Embed Size (px)
Citation preview
A Review of developments in
The Global & Indian Steel Industry
Monthly edition
Issue No. 22
December 2017 (covering November 2017)
Compiled on behalf of Indian Steel Association,
Mr. Anup Kashyap
Strictly for internal circulation
Our eight Full Members are:
• JSW Steel Ltd
• Steel Authority of India Ltd.
• Tata Steel Ltd.
• Rashtriya Ispat Nigam Ltd.
• Essar Steel Ltd.
• Jindal Steel & Power Ltd.
• Bhushan Power & Steel Ltd.
• Bhushan Steel & Strips Ltd.
Our seven Affiliate Members are Monnet
Steel, INSDAG (Institute for Steel
Development and Growth), KISMA
(Karnataka Iron and Steel Manufacturer’s
Association), Gerdau Steel, Visa Steel,
Jindal Stainless & Electrosteel Steels.
About Indian Steel Association
GLOBAL ECONOMIC DEVELOPMENTS
Source: The Economist Intelligence Unit, Global Forecasting Service
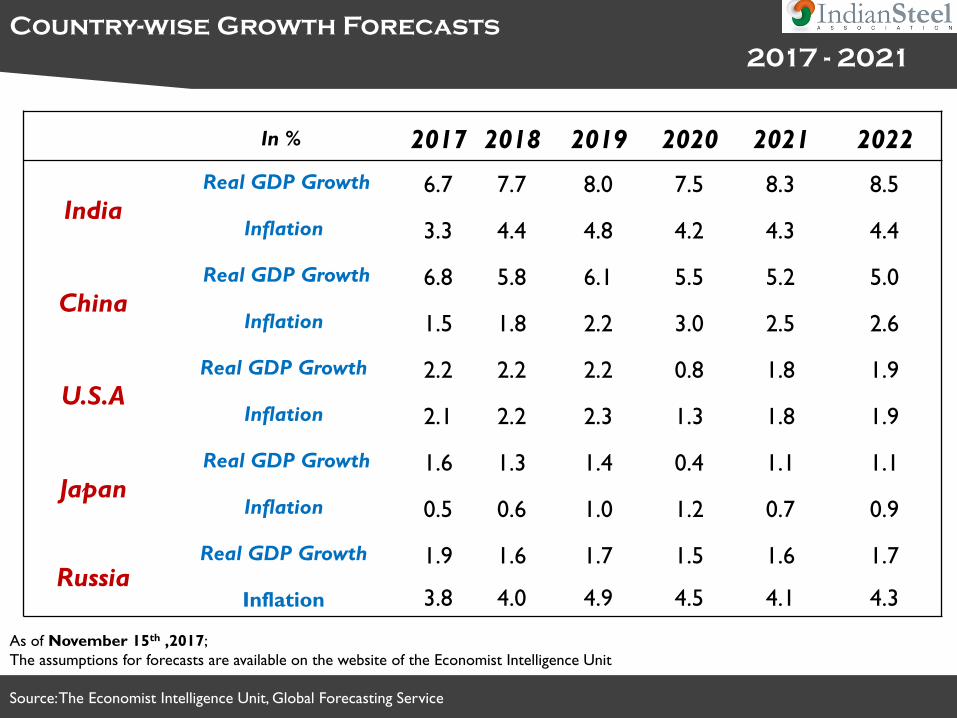
Country-wise Growth Forecasts
2017 - 2021
As of November 15th ,2017;
The assumptions for forecasts are available on the website of the Economist Intelligence Unit
In % 2017 2018 2019 2020 2021 2022
IndiaReal GDP Growth 6.7 7.7 8.0 7.5 8.3 8.5
Inflation 3.3 4.4 4.8 4.2 4.3 4.4
ChinaReal GDP Growth 6.8 5.8 6.1 5.5 5.2 5.0
Inflation 1.5 1.8 2.2 3.0 2.5 2.6
U.S.AReal GDP Growth 2.2 2.2 2.2 0.8 1.8 1.9
Inflation 2.1 2.2 2.3 1.3 1.8 1.9
JapanReal GDP Growth 1.6 1.3 1.4 0.4 1.1 1.1
Inflation 0.5 0.6 1.0 1.2 0.7 0.9
RussiaReal GDP Growth 1.9 1.6 1.7 1.5 1.6 1.7
Inflation 3.8 4.0 4.9 4.5 4.1 4.3
Source: Report on Global Economy Outlook-November 2017,The Conference Board .
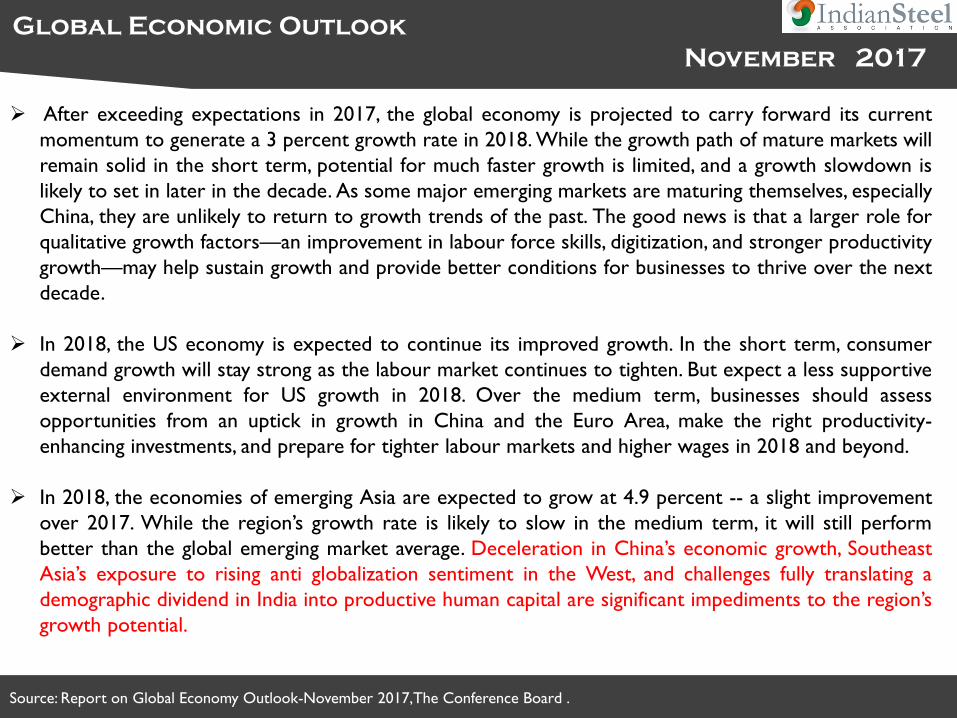
Global Economic Outlook
November 2017
➢ After exceeding expectations in 2017, the global economy is projected to carry forward its current
momentum to generate a 3 percent growth rate in 2018. While the growth path of mature markets will
remain solid in the short term, potential for much faster growth is limited, and a growth slowdown is
likely to set in later in the decade. As some major emerging markets are maturing themselves, especially
China, they are unlikely to return to growth trends of the past. The good news is that a larger role for
qualitative growth factors—an improvement in labour force skills, digitization, and stronger productivity
growth—may help sustain growth and provide better conditions for businesses to thrive over the next
decade.
➢ In 2018, the US economy is expected to continue its improved growth. In the short term, consumer
demand growth will stay strong as the labour market continues to tighten. But expect a less supportive
external environment for US growth in 2018. Over the medium term, businesses should assess
opportunities from an uptick in growth in China and the Euro Area, make the right productivity-
enhancing investments, and prepare for tighter labour markets and higher wages in 2018 and beyond.
➢ In 2018, the economies of emerging Asia are expected to grow at 4.9 percent -- a slight improvement
over 2017. While the region’s growth rate is likely to slow in the medium term, it will still perform
better than the global emerging market average. Deceleration in China’s economic growth, Southeast
Asia’s exposure to rising anti globalization sentiment in the West, and challenges fully translating a
demographic dividend in India into productive human capital are significant impediments to the region’s
growth potential.
Source: Doing business in 2018-Nov.2017,World Bank.
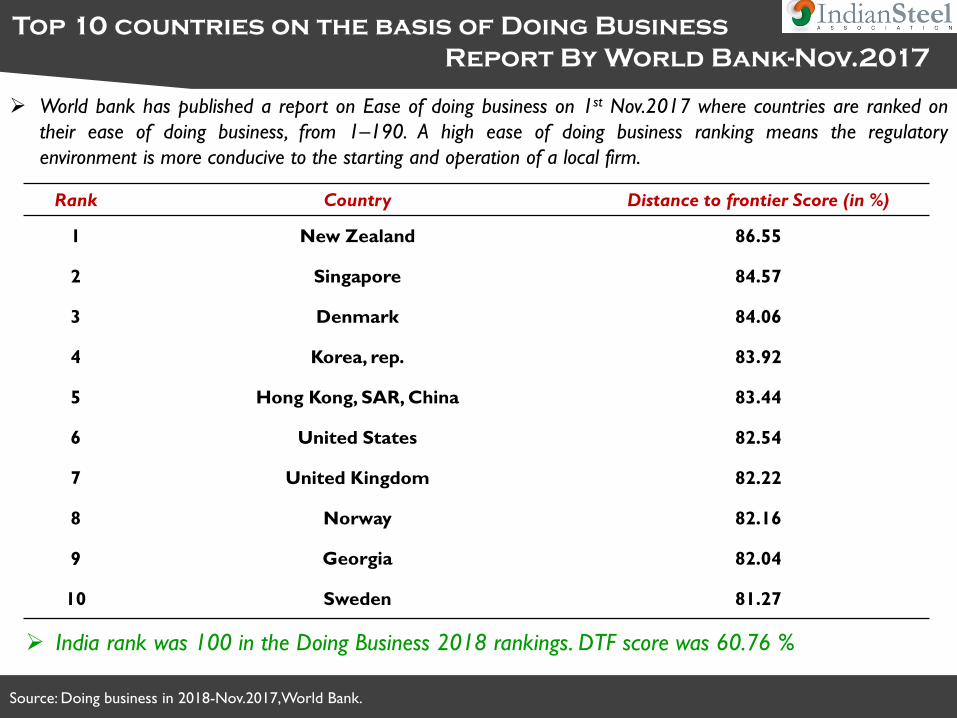
Top 10 countries on the basis of Doing Business
Report By World Bank-Nov.2017
➢ World bank has published a report on Ease of doing business on 1st Nov.2017 where countries are ranked on
their ease of doing business, from 1–190. A high ease of doing business ranking means the regulatory
environment is more conducive to the starting and operation of a local firm.
Rank Country Distance to frontier Score (in %)
1 New Zealand 86.55
2 Singapore 84.57
3 Denmark 84.06
4 Korea, rep. 83.92
5 Hong Kong, SAR, China 83.44
6 United States 82.54
7 United Kingdom 82.22
8 Norway 82.16
9 Georgia 82.04
10 Sweden 81.27
➢ India rank was 100 in the Doing Business 2018 rankings. DTF score was 60.76 %
GLOBAL STEEL DEVELOPMENT
Source: World Steel Association, MT-Million tons
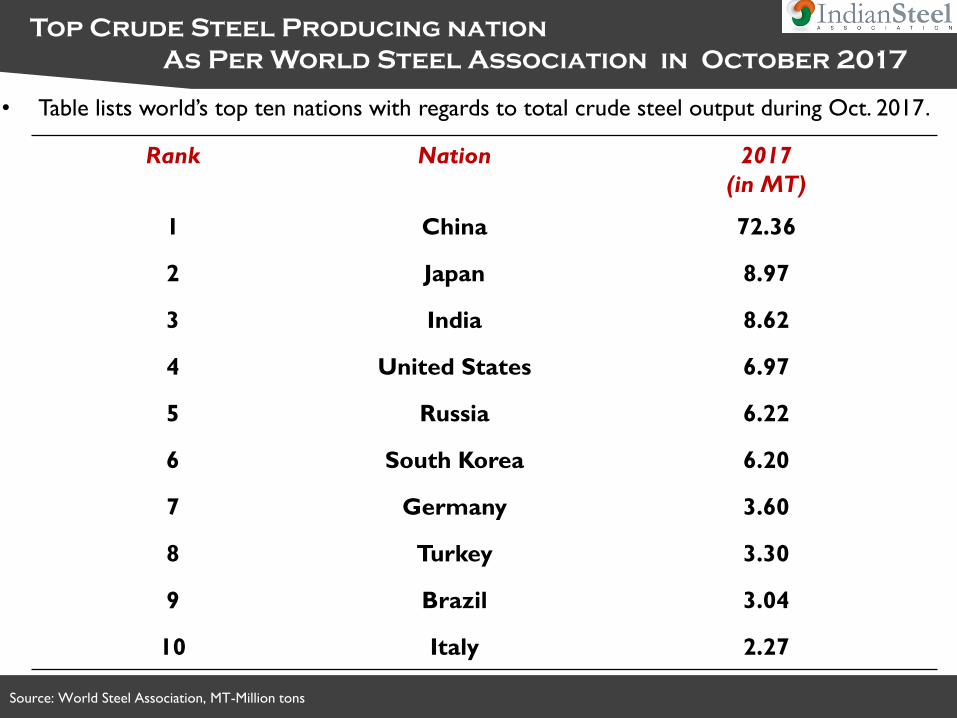
Top Crude Steel Producing nation
As Per World Steel Association in October 2017
Rank Nation 2017
(in MT)
1 China 72.36
2 Japan 8.97
3 India 8.62
4 United States 6.97
5 Russia 6.22
6 South Korea 6.20
7 Germany 3.60
8 Turkey 3.30
9 Brazil 3.04
10 Italy 2.27
• Table lists world’s top ten nations with regards to total crude steel output during Oct. 2017.
Source: World Steel Association, MT-Million tons
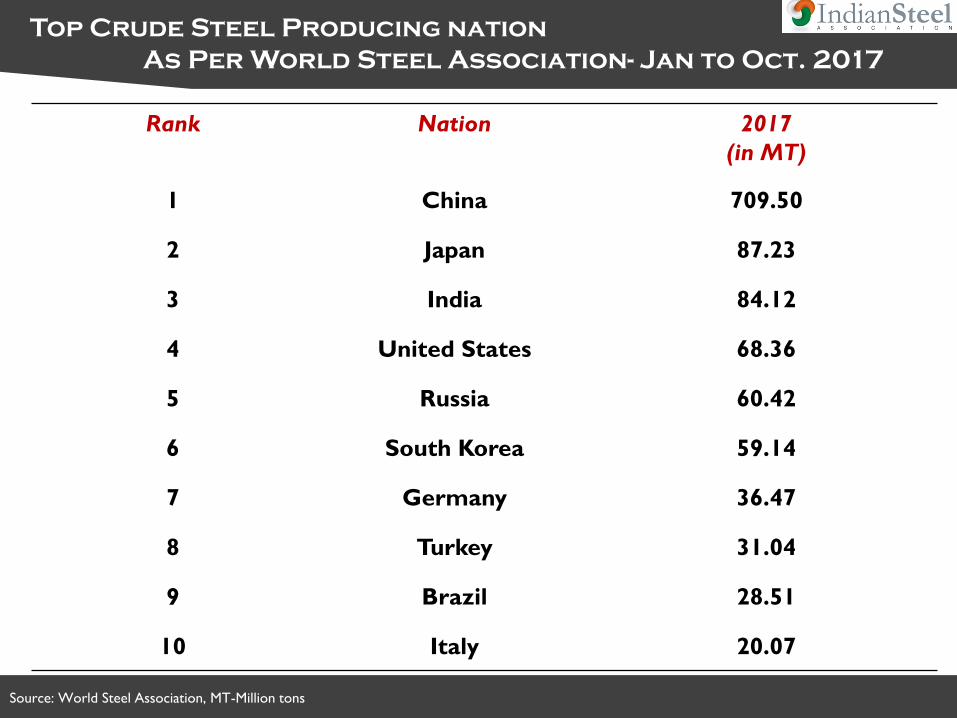
Top Crude Steel Producing nation
As Per World Steel Association- Jan to Oct. 2017
Rank Nation 2017
(in MT)
1 China 709.50
2 Japan 87.23
3 India 84.12
4 United States 68.36
5 Russia 60.42
6 South Korea 59.14
7 Germany 36.47
8 Turkey 31.04
9 Brazil 28.51
10 Italy 20.07

Source: World Steel Association
Top DRI Producing nations
As Per World Steel Association
• The table given below provides the list of world’s top ten DRI producers during Jan-Oct of
2017.
Rank Nation Output (in MT)
1 Iran 16.43
2 India 12.94
3 Mexico 5.07
4 Saudi Arabia 4.29
5 Egypt 3.32
6 UAE 2.96
7 Qatar 2.11
8 Canada 1.31
9 Argentina 0.945
10 South Africa 0.756
Source: World Steel Association; Figures in Million tons
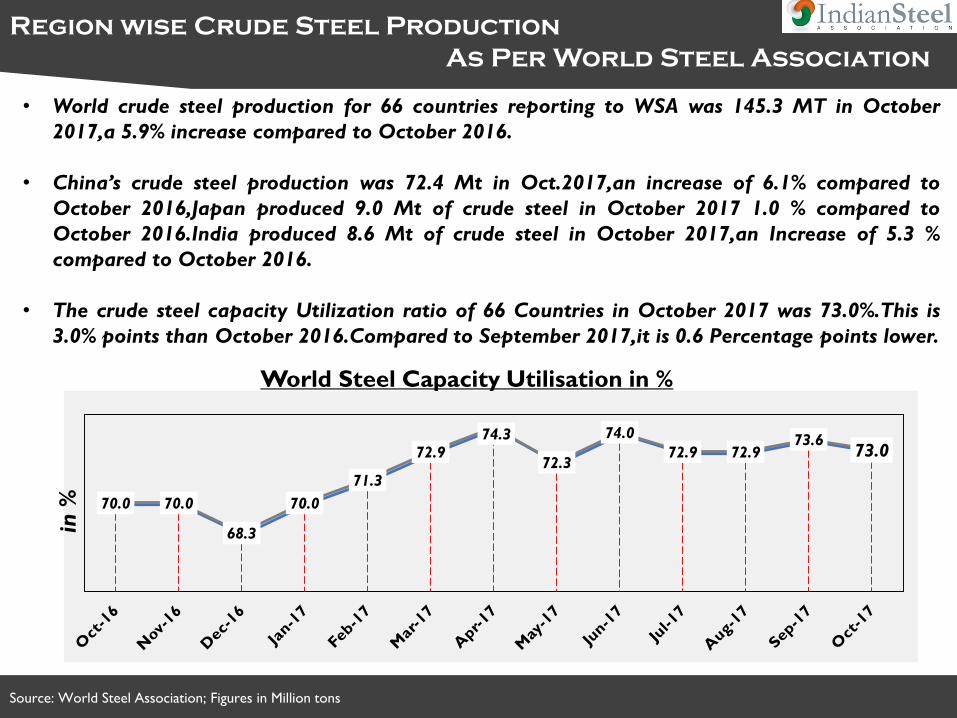
Region wise Crude Steel Production
As Per World Steel Association
• World crude steel production for 66 countries reporting to WSA was 145.3 MT in October
2017,a 5.9% increase compared to October 2016.
• China’s crude steel production was 72.4 Mt in Oct.2017,an increase of 6.1% compared to
October 2016,Japan produced 9.0 Mt of crude steel in October 2017 1.0 % compared to
October 2016.India produced 8.6 Mt of crude steel in October 2017,an Increase of 5.3 %
compared to October 2016.
• The crude steel capacity Utilization ratio of 66 Countries in October 2017 was 73.0%.This is
3.0% points than October 2016.Compared to September 2017,it is 0.6 Percentage points lower.
World Steel Capacity Utilisation in %
70.0 70.0
68.3
70.0
71.3
72.974.3
72.3
74.0
72.9 72.973.6
73.0
in %
Source-Financial Dynamics of International Steel makers-Core Report-November 2017-World Steel Dynamics.
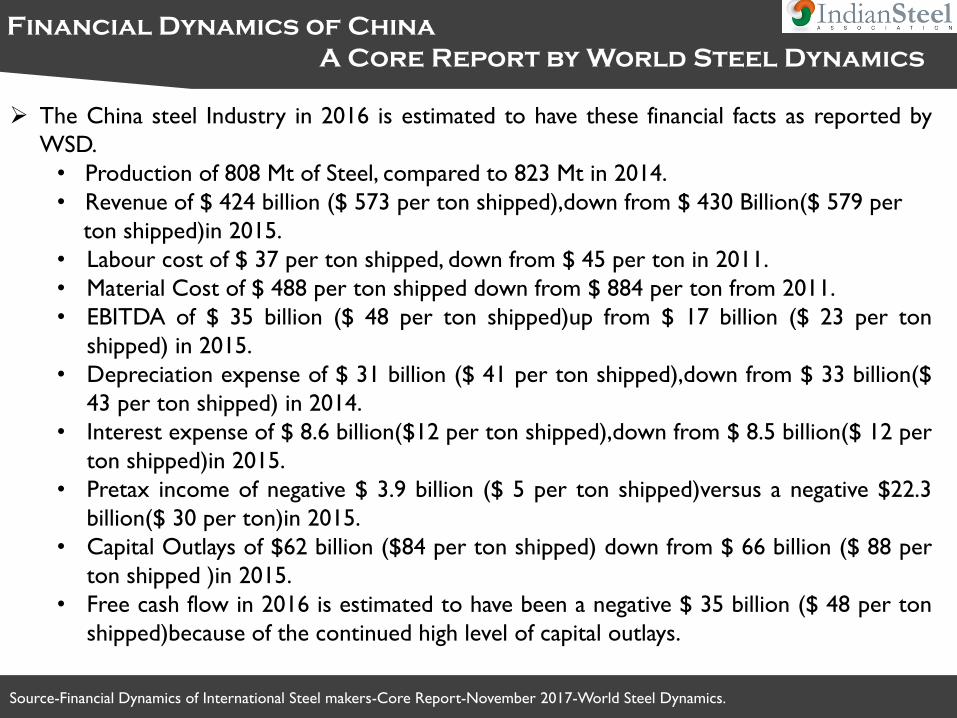
Financial Dynamics of China
A Core Report by World Steel Dynamics
➢ The China steel Industry in 2016 is estimated to have these financial facts as reported by
WSD.
• Production of 808 Mt of Steel, compared to 823 Mt in 2014.
• Revenue of $ 424 billion ($ 573 per ton shipped),down from $ 430 Billion($ 579 per
ton shipped)in 2015.
• Labour cost of $ 37 per ton shipped, down from $ 45 per ton in 2011.
• Material Cost of $ 488 per ton shipped down from $ 884 per ton from 2011.
• EBITDA of $ 35 billion ($ 48 per ton shipped)up from $ 17 billion ($ 23 per ton
shipped) in 2015.
• Depreciation expense of $ 31 billion ($ 41 per ton shipped),down from $ 33 billion($
43 per ton shipped) in 2014.
• Interest expense of $ 8.6 billion($12 per ton shipped),down from $ 8.5 billion($ 12 per
ton shipped)in 2015.
• Pretax income of negative $ 3.9 billion ($ 5 per ton shipped)versus a negative $22.3
billion($ 30 per ton)in 2015.
• Capital Outlays of $62 billion ($84 per ton shipped) down from $ 66 billion ($ 88 per
ton shipped )in 2015.
• Free cash flow in 2016 is estimated to have been a negative $ 35 billion ($ 48 per ton
shipped)because of the continued high level of capital outlays.

Source-Inside Track#159,Published by World steel Dynamics on November 22nd ,2017
Crude Steel Production-China, Non China & world
WSD forecast
➢ Steel production in Northern china is expected to be cut up to 50 % at many plants from
mid Nov-2017 through mid March 2018 in order to lessen air pollution during “ heating
season” when coal is used to heat many residence. WSD estimates that Chinese steel
production annualized will decline from 852 million ton in October 2018 to perhaps 790
Million tonnes in November 2018.
Source: Coal Mint research
Trend in Coking Coal Price
Nov-2017
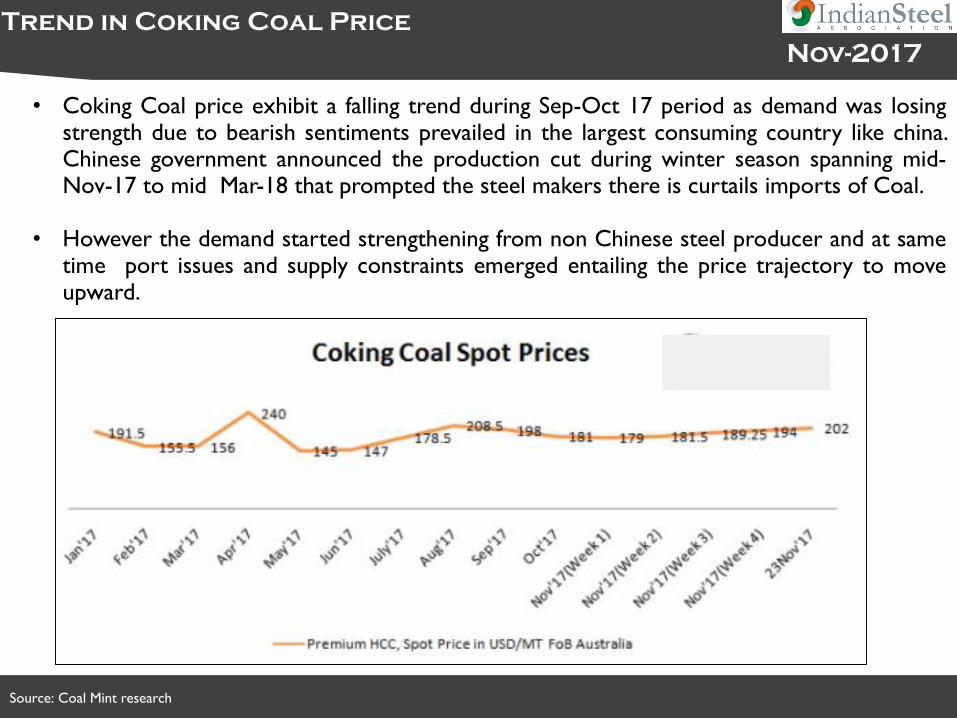
• Coking Coal price exhibit a falling trend during Sep-Oct 17 period as demand was losingstrength due to bearish sentiments prevailed in the largest consuming country like china.Chinese government announced the production cut during winter season spanning mid-Nov-17 to mid Mar-18 that prompted the steel makers there is curtails imports of Coal.
• However the demand started strengthening from non Chinese steel producer and at sametime port issues and supply constraints emerged entailing the price trajectory to moveupward.
Source: Japan Customs, Steel Mint research
Trend in Flat Steel Export
Japan Focus
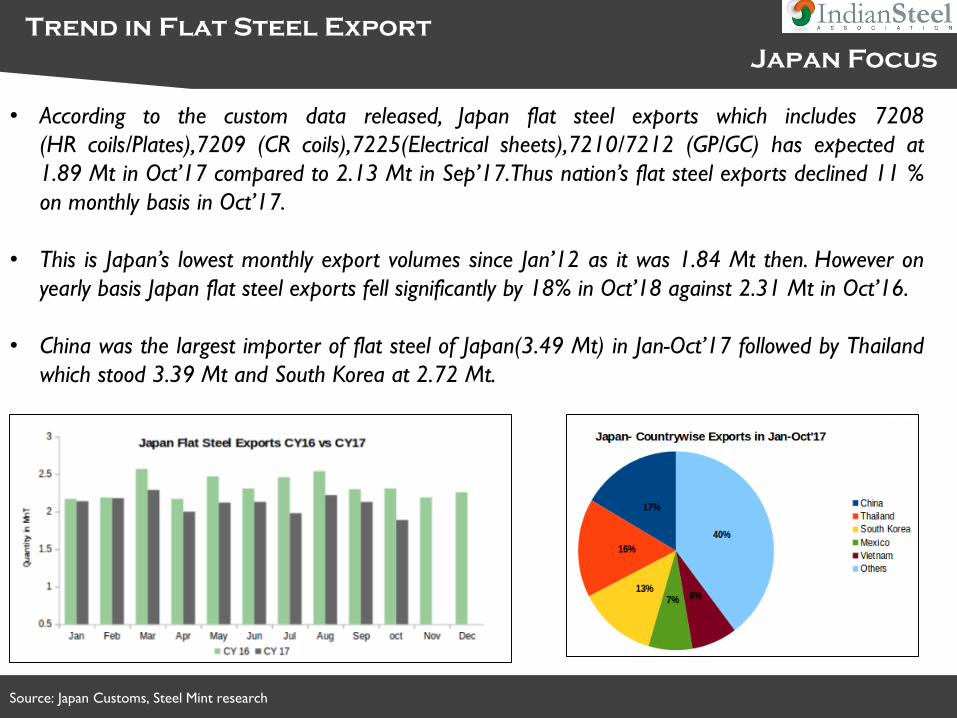
• According to the custom data released, Japan flat steel exports which includes 7208
(HR coils/Plates),7209 (CR coils),7225(Electrical sheets),7210/7212 (GP/GC) has expected at
1.89 Mt in Oct’17 compared to 2.13 Mt in Sep’17.Thus nation’s flat steel exports declined 11 %
on monthly basis in Oct’17.
• This is Japan’s lowest monthly export volumes since Jan’12 as it was 1.84 Mt then. However on
yearly basis Japan flat steel exports fell significantly by 18% in Oct’18 against 2.31 Mt in Oct’16.
• China was the largest importer of flat steel of Japan(3.49 Mt) in Jan-Oct’17 followed by Thailand
which stood 3.39 Mt and South Korea at 2.72 Mt.
Source-Steel Mint Research
Trend in Steel Import
South Korea Focus
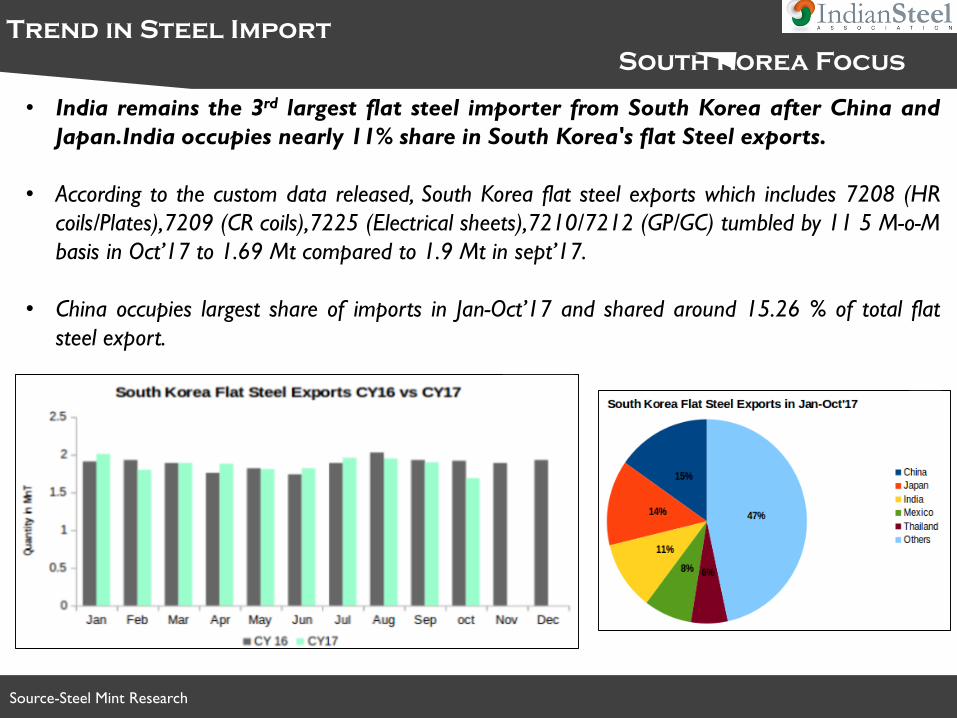
• India remains the 3rd largest flat steel importer from South Korea after China and
Japan.India occupies nearly 11% share in South Korea's flat Steel exports.
• According to the custom data released, South Korea flat steel exports which includes 7208 (HR
coils/Plates),7209 (CR coils),7225 (Electrical sheets),7210/7212 (GP/GC) tumbled by 11 5 M-o-M
basis in Oct’17 to 1.69 Mt compared to 1.9 Mt in sept’17.
• China occupies largest share of imports in Jan-Oct’17 and shared around 15.26 % of total flat
steel export.
DOMESTIC STEEL DEVELOPMENTS
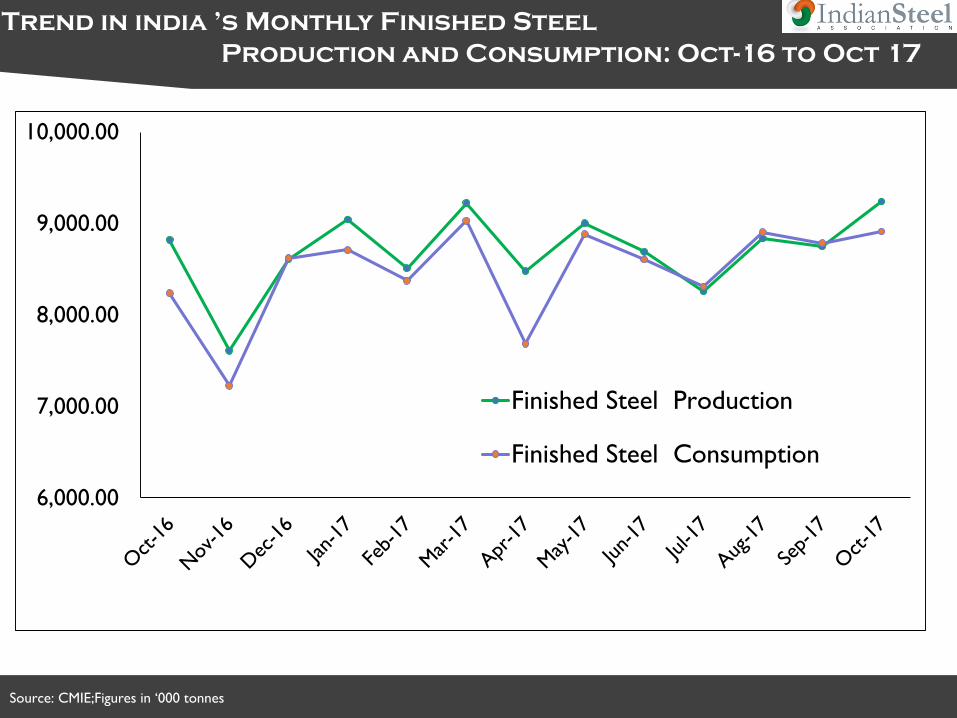
Source: CMIE;Figures in ‘000 tonnes
Trend in india ’s Monthly Finished Steel
Production and Consumption: Oct-16 to Oct 17
6,000.00
7,000.00
8,000.00
9,000.00
10,000.00
Finished Steel Production
Finished Steel Consumption
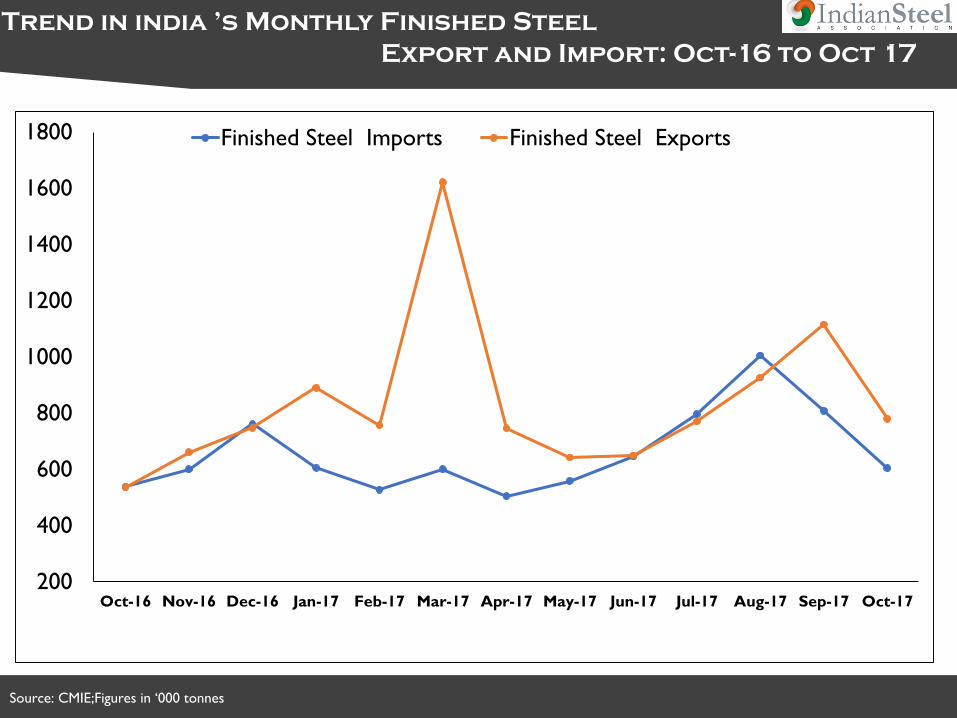
Source: CMIE;Figures in ‘000 tonnes
Trend in india ’s Monthly Finished Steel
Export and Import: Oct-16 to Oct 17
200
400
600
800
1000
1200
1400
1600
1800
Oct-16 Nov-16 Dec-16 Jan-17 Feb-17 Mar-17 Apr-17 May-17 Jun-17 Jul-17 Aug-17 Sep-17 Oct-17
Finished Steel Imports Finished Steel Exports
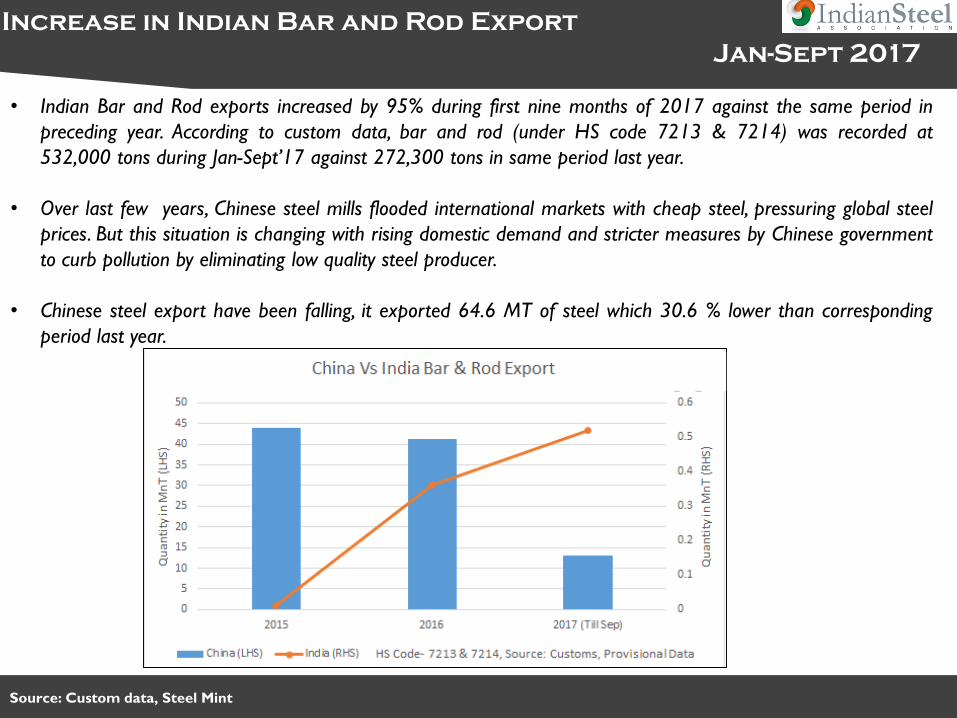
Source: Custom data, Steel Mint
Increase in Indian Bar and Rod Export
Jan-Sept 2017
• Indian Bar and Rod exports increased by 95% during first nine months of 2017 against the same period in
preceding year. According to custom data, bar and rod (under HS code 7213 & 7214) was recorded at
532,000 tons during Jan-Sept’17 against 272,300 tons in same period last year.
• Over last few years, Chinese steel mills flooded international markets with cheap steel, pressuring global steel
prices. But this situation is changing with rising domestic demand and stricter measures by Chinese government
to curb pollution by eliminating low quality steel producer.
• Chinese steel export have been falling, it exported 64.6 MT of steel which 30.6 % lower than corresponding
period last year.
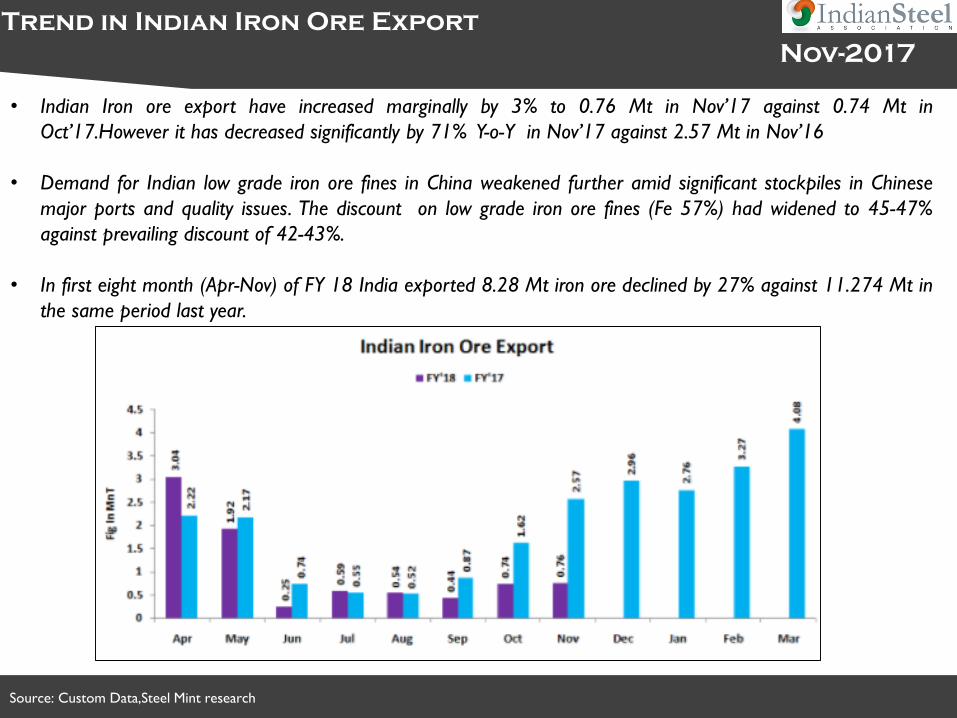
Source: Custom Data,Steel Mint research
Trend in Indian Iron Ore Export
Nov-2017
• Indian Iron ore export have increased marginally by 3% to 0.76 Mt in Nov’17 against 0.74 Mt in
Oct’17.However it has decreased significantly by 71% Y-o-Y in Nov’17 against 2.57 Mt in Nov’16
• Demand for Indian low grade iron ore fines in China weakened further amid significant stockpiles in Chinese
major ports and quality issues. The discount on low grade iron ore fines (Fe 57%) had widened to 45-47%
against prevailing discount of 42-43%.
• In first eight month (Apr-Nov) of FY 18 India exported 8.28 Mt iron ore declined by 27% against 11.274 Mt in
the same period last year.
Source: Custom Data,Steel Mint research
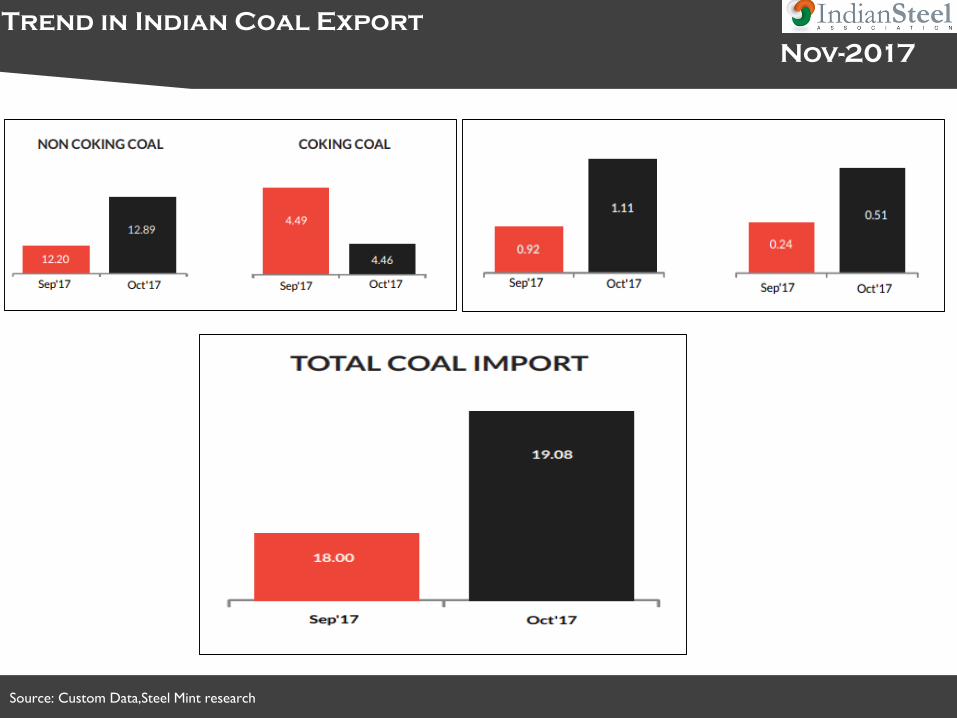
Trend in Indian Coal Export
Nov-2017
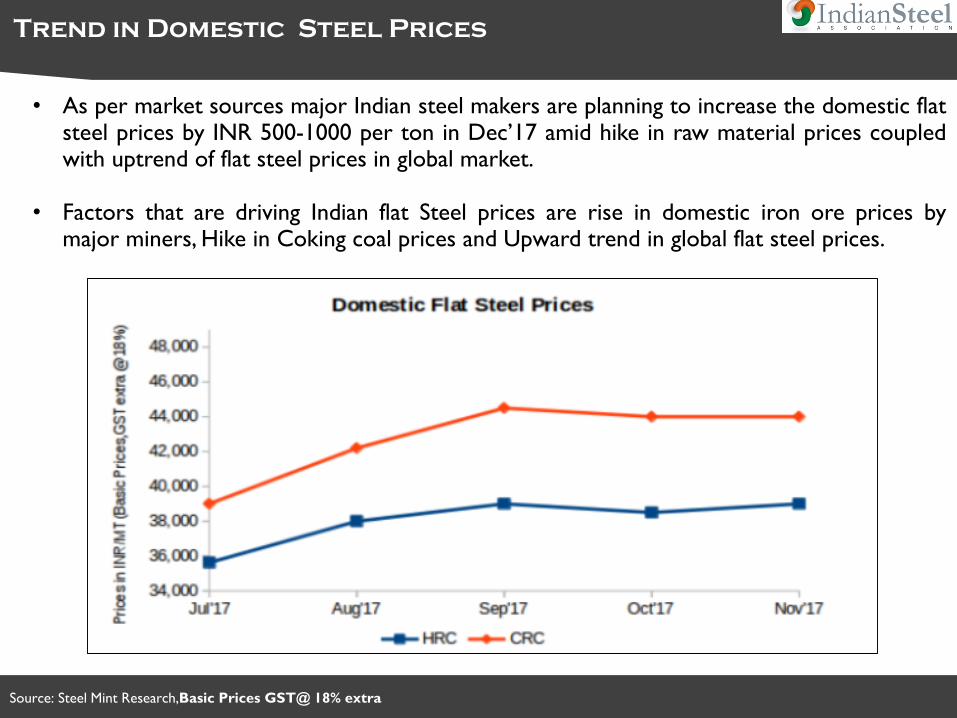
Source: Steel Mint Research,Basic Prices GST@ 18% extra
Trend in Domestic Steel Prices
• As per market sources major Indian steel makers are planning to increase the domestic flatsteel prices by INR 500-1000 per ton in Dec’17 amid hike in raw material prices coupledwith uptrend of flat steel prices in global market.
• Factors that are driving Indian flat Steel prices are rise in domestic iron ore prices bymajor miners, Hike in Coking coal prices and Upward trend in global flat steel prices.
INDIAN ECONOMIC DEVELOPMENT
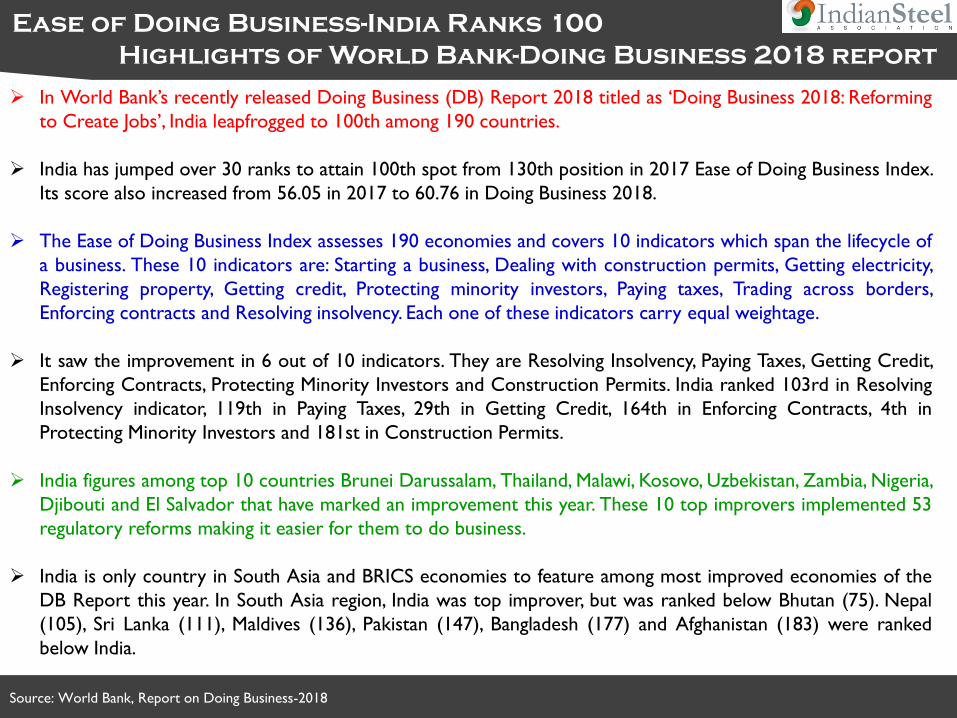
Source: World Bank, Report on Doing Business-2018
Ease of Doing Business-India Ranks 100
Highlights of World Bank-Doing Business 2018 report
➢ In World Bank’s recently released Doing Business (DB) Report 2018 titled as ‘Doing Business 2018: Reforming
to Create Jobs’, India leapfrogged to 100th among 190 countries.
➢ India has jumped over 30 ranks to attain 100th spot from 130th position in 2017 Ease of Doing Business Index.
Its score also increased from 56.05 in 2017 to 60.76 in Doing Business 2018.
➢ The Ease of Doing Business Index assesses 190 economies and covers 10 indicators which span the lifecycle of
a business. These 10 indicators are: Starting a business, Dealing with construction permits, Getting electricity,
Registering property, Getting credit, Protecting minority investors, Paying taxes, Trading across borders,
Enforcing contracts and Resolving insolvency. Each one of these indicators carry equal weightage.
➢ It saw the improvement in 6 out of 10 indicators. They are Resolving Insolvency, Paying Taxes, Getting Credit,
Enforcing Contracts, Protecting Minority Investors and Construction Permits. India ranked 103rd in Resolving
Insolvency indicator, 119th in Paying Taxes, 29th in Getting Credit, 164th in Enforcing Contracts, 4th in
Protecting Minority Investors and 181st in Construction Permits.
➢ India figures among top 10 countries Brunei Darussalam, Thailand, Malawi, Kosovo, Uzbekistan, Zambia, Nigeria,
Djibouti and El Salvador that have marked an improvement this year. These 10 top improvers implemented 53
regulatory reforms making it easier for them to do business.
➢ India is only country in South Asia and BRICS economies to feature among most improved economies of the
DB Report this year. In South Asia region, India was top improver, but was ranked below Bhutan (75). Nepal
(105), Sri Lanka (111), Maldives (136), Pakistan (147), Bangladesh (177) and Afghanistan (183) were ranked
below India.
Source: World Bank, Report on Doing Business-2018
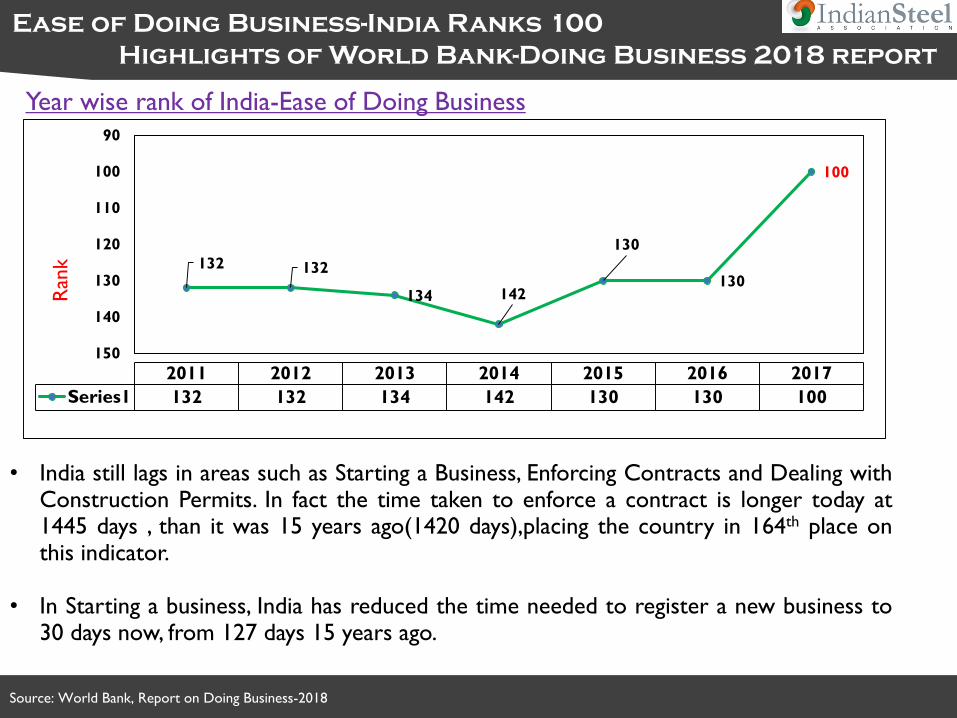
Ease of Doing Business-India Ranks 100
Highlights of World Bank-Doing Business 2018 report
132 132
134 142
130
130
100
90
100
110
120
130
140
150
Ran
k
2011 2012 2013 2014 2015 2016 2017
Series1 132 132 134 142 130 130 100
• India still lags in areas such as Starting a Business, Enforcing Contracts and Dealing withConstruction Permits. In fact the time taken to enforce a contract is longer today at1445 days , than it was 15 years ago(1420 days),placing the country in 164th place onthis indicator.
• In Starting a business, India has reduced the time needed to register a new business to30 days now, from 127 days 15 years ago.
Year wise rank of India-Ease of Doing Business
Source: Reserve Bank of India
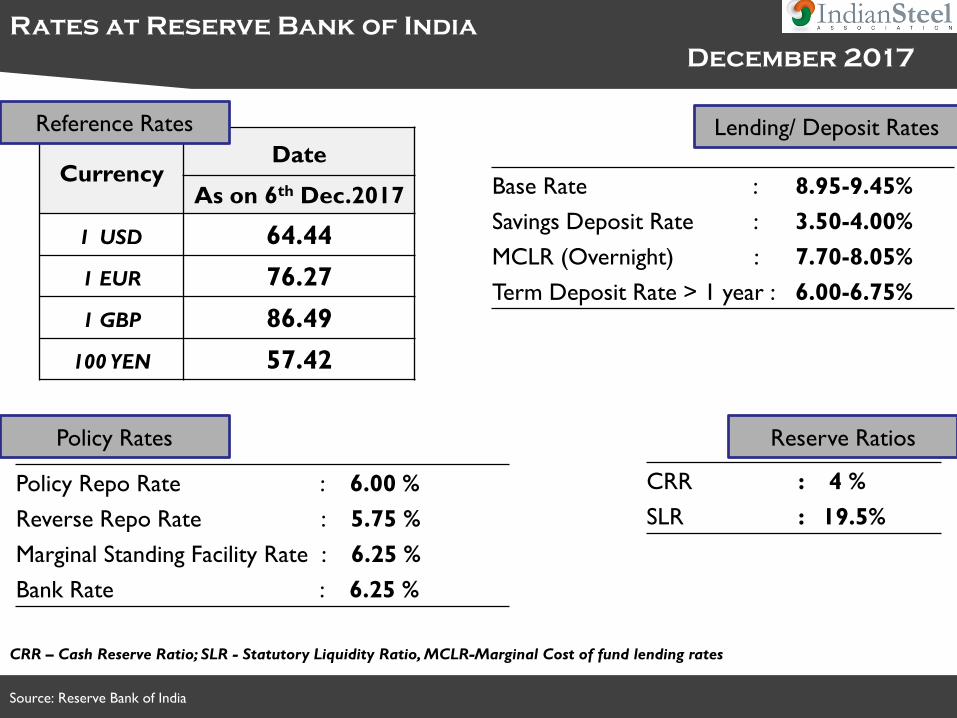
Rates at Reserve Bank of India
December 2017
CRR – Cash Reserve Ratio; SLR - Statutory Liquidity Ratio, MCLR-Marginal Cost of fund lending rates
CurrencyDate
As on 6th Dec.2017
I USD 64.44
1 EUR 76.27
1 GBP 86.49
100 YEN 57.42
Policy Repo Rate : 6.00 %
Reverse Repo Rate : 5.75 %
Marginal Standing Facility Rate : 6.25 %
Bank Rate : 6.25 %
Reference Rates
Policy Rates Reserve Ratios
CRR : 4 %
SLR : 19.5%
Lending/ Deposit Rates
Base Rate : 8.95-9.45%
Savings Deposit Rate : 3.50-4.00%
MCLR (Overnight) : 7.70-8.05%
Term Deposit Rate > 1 year : 6.00-6.75%
THANK YOU
DISCLAIMER
The material in this presentation has been prepared by Indian Steel Association (ISA) and is a general background information reviewing the status of the
developments in the global and Indian steel industry as at the date of this presentation. This presentation is strictly for internal use of all the member
companies of ISA, whose names have been stated in the presentation.
Information is given in summary form and does not purport to be complete or all inclusive. The information has been sourced from independent third party
databases, knowledge sources and news reports, and the authenticity of the same has not been independently verified by ISA.
Additionally, any third party forecasts on financial or economic parameters, projections or estimates should not be construed as an investment advice or a
recommendation to any ISA member. Recipients of this presentation from member companies of the ISA should each make their own evaluation of the
contents and adequacy of the information contained in the presentation.
ISA does not undertake any obligation to publicly release any changes to any revisions, modifications or forward looking statements in the subsequent
editions of this bi-monthly presentation. Unless otherwise specified, all information is for the period November 2017 or prior.