Embed Size (px)
Citation preview
Stainless Steel in Figures 2019
ISSF STAINLESS STEEL IN FIGURES 2019- 2
Contents
History
Figure 1 Compound annual growth rate of world stainless melt shop production
Figure 2 Regional share of stainless steel production
Figure 3 Stainless steel production versus plastics production
Figure 4 Compound annual growth rate of major metals
Actual performanceTable 1 Stainless melt shop production
Table 2 Stainless melt shop production by quarter
Figure 5 Stainless steel foreign trade
Table 3 Foreign trade exports of stainless steel
Table 4 Foreign trade exports of stainless steel scrap
Figure 6 Apparent stainless steel use by region
Figure 7 Stainless melt shop production by region
Figure 8 Stainless meltshop production by grade
Figure 9 Stainless meltshop production by quarter
PotentialFigure 10, 11, 12 Stainless steel demand versus
stainless steel consumption
Figure 13 GDP PPP per capita versus stainless steel use per capita
Figure 14 Stainless steel use per sector - 2018
ISSF STAINLESS STEEL IN FIGURES 2019- 3
Foreword by the Secretary-General
This is the eighth edition of the ISSF’s Annual Statistical Publication, which is more widely known as “Stainless Steel in Figures”. This book has acquired a well deserved reputation for accuracy and
completeness in its coverage of statistics from our industry, and also provides a one-stop-shop service of including key data from the nickel, chrome and molybdenum industries, for which we are indebted to the associations which represent these base metals.
The founders of the ISSF required it should be capable of providing a rapid, regular and reliable source of statistical data, which would end the need for members to purchase this type of information from commercial sources. They did so on the basis that no-one knows the stainless steel industry better than our own members and the ISSF was therefore the logical
focal point for the collection and analysis of the data which appears in this book.
There is an even wider store of historical data available on our Extranet. This book summarises what is available, but members are encouraged to refer our Extranet to see the depth of what is available. Those who may not have a password to our extranet should contact Jo Claes ([email protected]).
Once again we acknowledge the generous assistance provided by our raw materials partners in Team Stainless for the collaboration that goes into developing this book. We are grateful to the International Chrome Development Association (ICDA), the International Nickel Study Group (INSG) and the International Molybdenum Association (IMOA) each of whom has openly shared their information with us. The raw materials data is confidential and is for the use of ISSF members and the members of the contributing associations only. This information should please not be re-published without the permission
of the associations and any re-publication must acknowledge the applicable source – ISSF, ICDA, INSG or IMOA. Of course, the stainless steel data belongs to the ISSF and members are welcome to use it as they wish, provided that they acknowledge the ISSF as their source.
In closing, I will ask again whether any of you have any comments or suggestions for improving this book, or comments on other information which should be included. If so, please let me know.
John Rowe Secretary-General, International Stainless Steel Forum (ISSF) Chicago, May 2019
ISSF STAINLESS STEEL IN FIGURES 2019- 4HISTORY
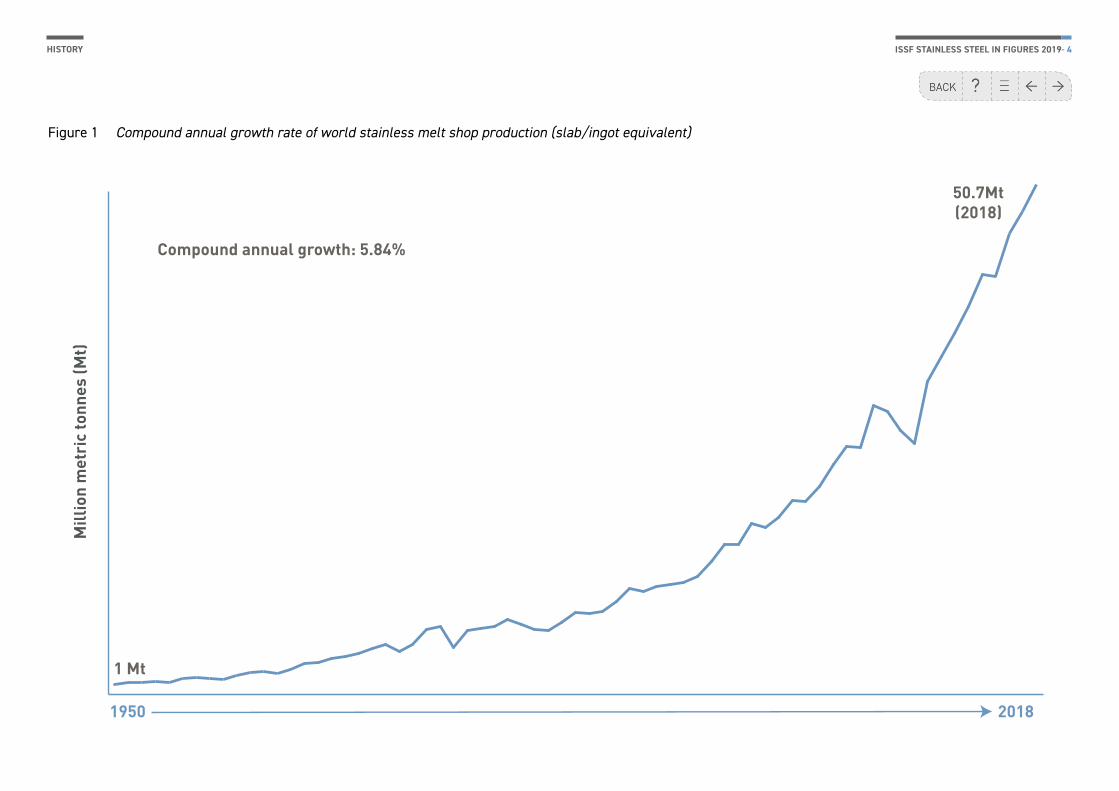
Figure 1 Compound annual growth rate of world stainless melt shop production (slab/ingot equivalent)
Compound annual growth: 5.84%
Mill
ion
met
ric
tonn
es (M
t)
1 Mt
50.7Mt(2018)
1950 2018
ISSF STAINLESS STEEL IN FIGURES 2019- 5HISTORY
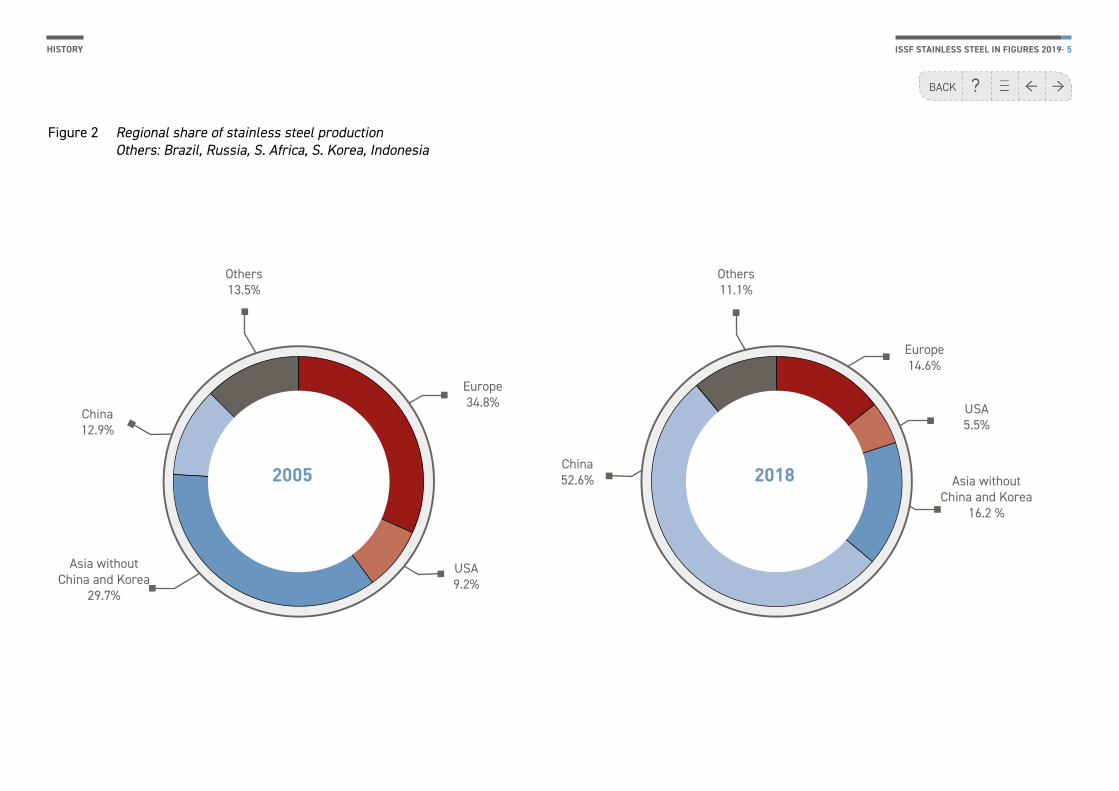
Figure 2 Regional share of stainless steel production Others: Brazil, Russia, S. Africa, S. Korea, Indonesia
USA5.5%
Asia without China and Korea
16.2 %
China52.6%
Others11.1%
Europe14.6%
USA9.2%
Asia without China and Korea
29.7%
China12.9%
Others13.5%
Europe34.8%
2005 2018
ISSF STAINLESS STEEL IN FIGURES 2019- 6HISTORY
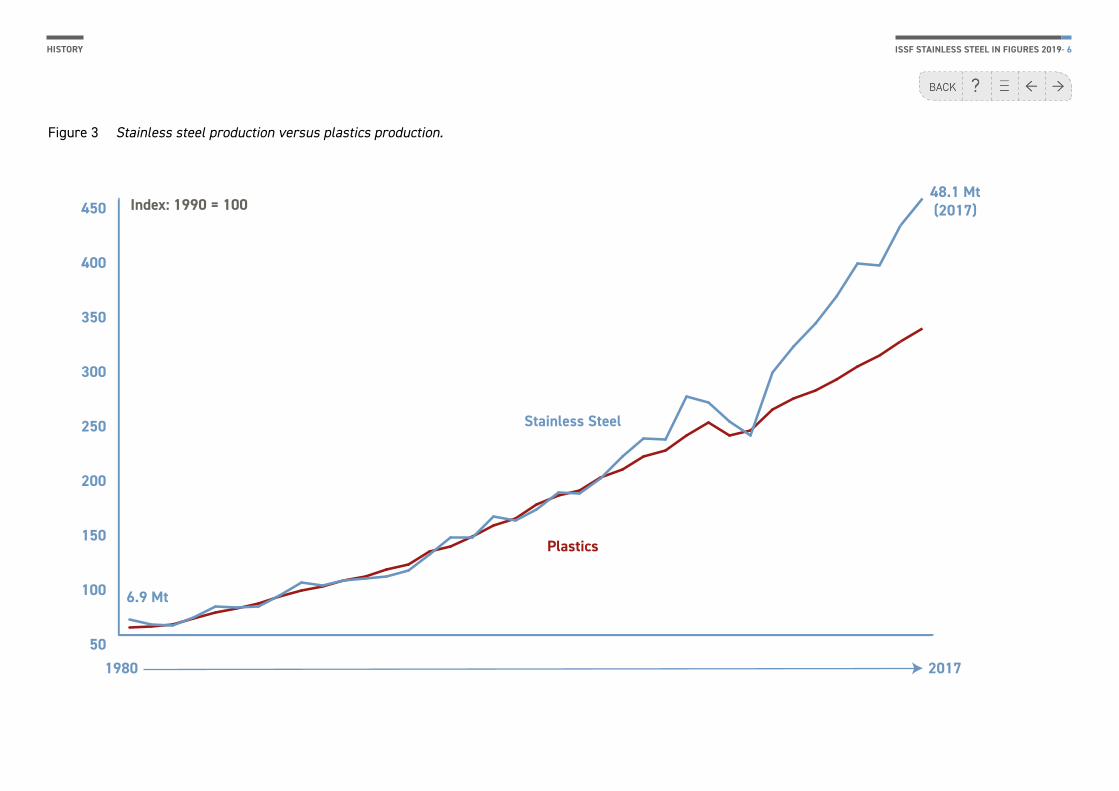
Figure 3 Stainless steel production versus plastics production.
Index: 1990 = 100
Stainless Steel
Plastics
6.9 Mt
48.1 Mt(2017)
50
100
150
200
250
300
350
400
450
1980 2017
ISSF STAINLESS STEEL IN FIGURES 2019- 7HISTORY
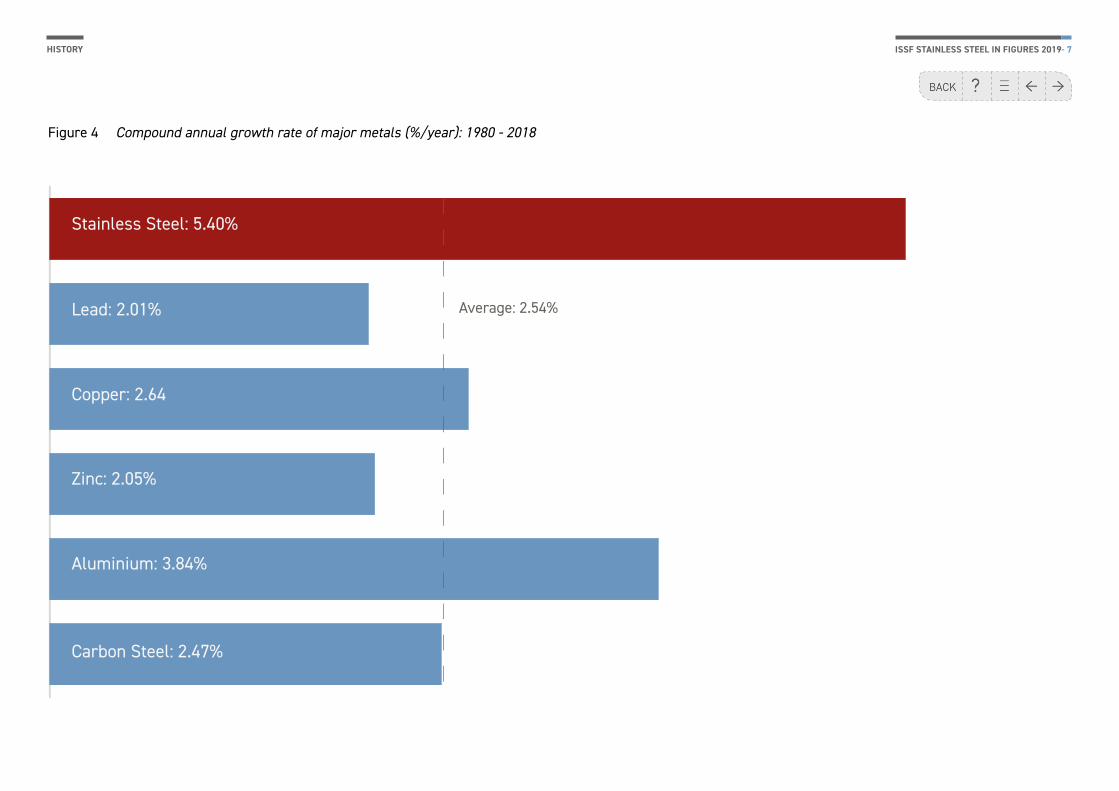
Lead: 2.01%
Copper: 2.64
Zinc: 2.05%
Aluminium: 3.84%
Carbon Steel: 2.47%
Stainless Steel: 5.40%
Average: 2.54%
Figure 4 Compound annual growth rate of major metals (%/year): 1980 - 2018
ISSF STAINLESS STEEL IN FIGURES 2019- 8ACTUAL PERFORMANCE
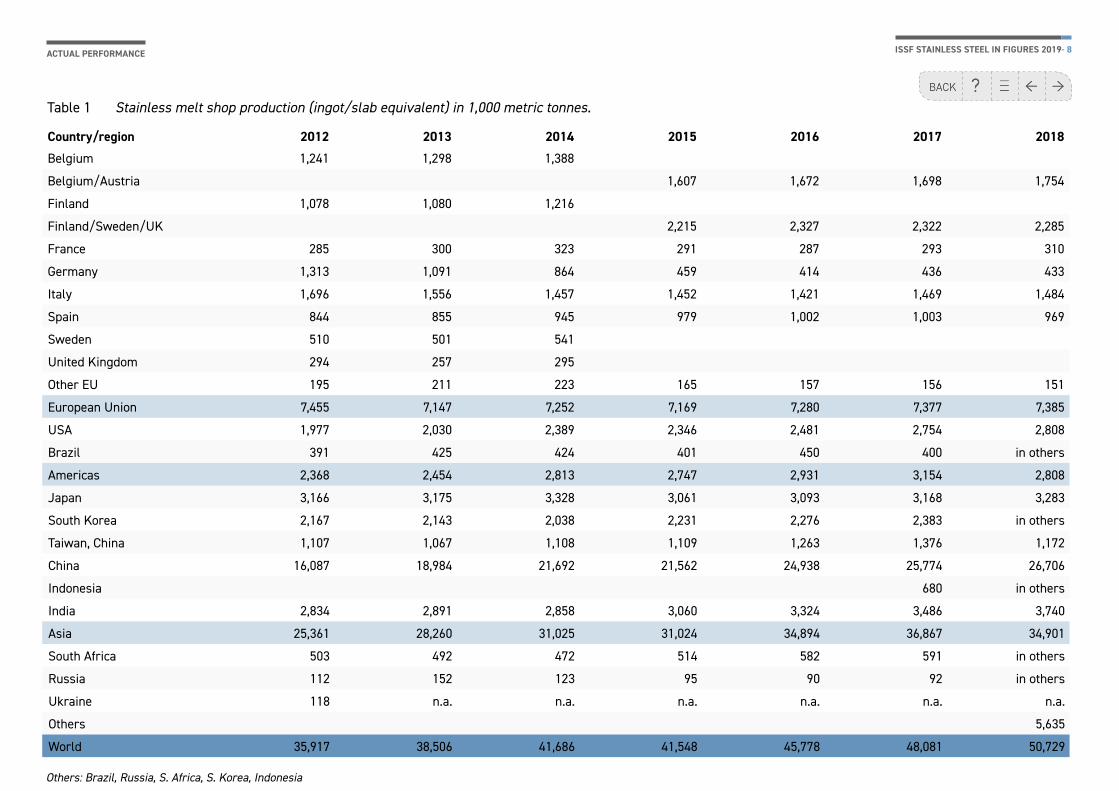
Country/region 2012 2013 2014 2015 2016 2017 2018
Belgium 1,241 1,298 1,388
Belgium/Austria 1,607 1,672 1,698 1,754
Finland 1,078 1,080 1,216
Finland/Sweden/UK 2,215 2,327 2,322 2,285
France 285 300 323 291 287 293 310
Germany 1,313 1,091 864 459 414 436 433
Italy 1,696 1,556 1,457 1,452 1,421 1,469 1,484
Spain 844 855 945 979 1,002 1,003 969
Sweden 510 501 541
United Kingdom 294 257 295
Other EU 195 211 223 165 157 156 151
European Union 7,455 7,147 7,252 7,169 7,280 7,377 7,385
USA 1,977 2,030 2,389 2,346 2,481 2,754 2,808
Brazil 391 425 424 401 450 400 in others
Americas 2,368 2,454 2,813 2,747 2,931 3,154 2,808
Japan 3,166 3,175 3,328 3,061 3,093 3,168 3,283
South Korea 2,167 2,143 2,038 2,231 2,276 2,383 in others
Taiwan, China 1,107 1,067 1,108 1,109 1,263 1,376 1,172
China 16,087 18,984 21,692 21,562 24,938 25,774 26,706
Indonesia 680 in others
India 2,834 2,891 2,858 3,060 3,324 3,486 3,740
Asia 25,361 28,260 31,025 31,024 34,894 36,867 34,901
South Africa 503 492 472 514 582 591 in others
Russia 112 152 123 95 90 92 in others
Ukraine 118 n.a. n.a. n.a. n.a. n.a. n.a.
Others 5,635
World 35,917 38,506 41,686 41,548 45,778 48,081 50,729
Table 1 Stainless melt shop production (ingot/slab equivalent) in 1,000 metric tonnes.
Others: Brazil, Russia, S. Africa, S. Korea, Indonesia
ISSF STAINLESS STEEL IN FIGURES 2019- 9ACTUAL PERFORMANCE
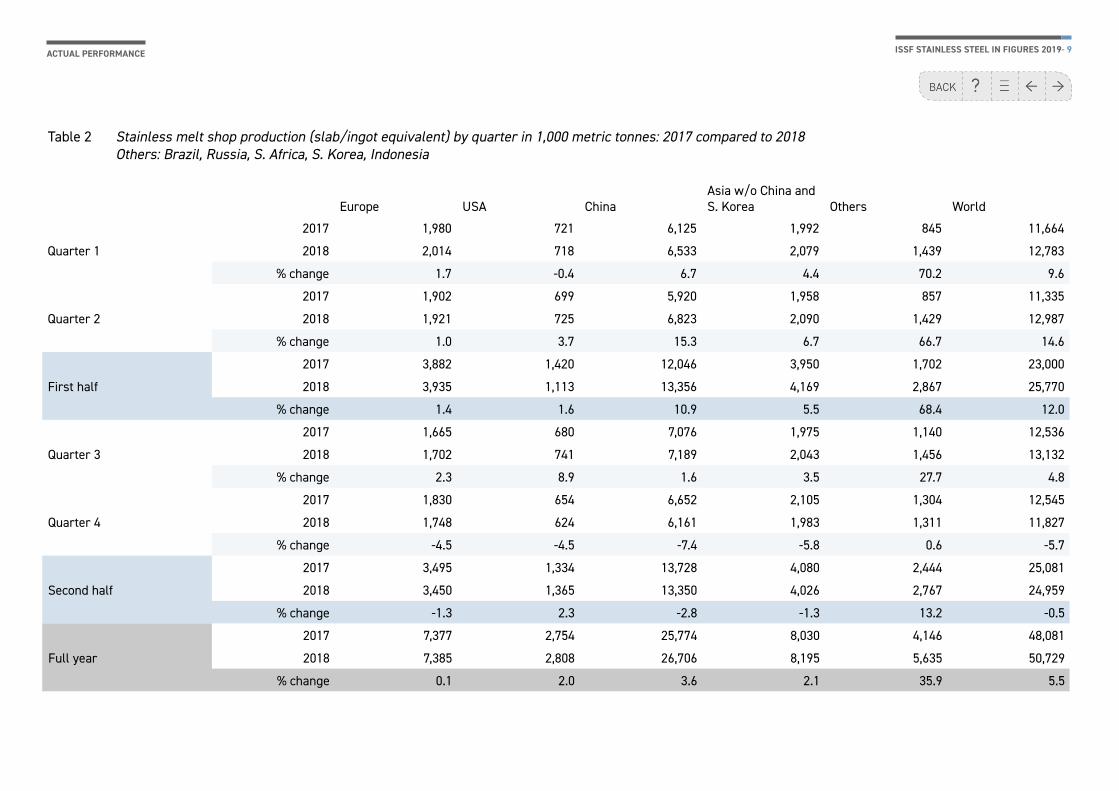
Europe USA ChinaAsia w/o China and S. Korea Others World
Quarter 1
2017 1,980 721 6,125 1,992 845 11,664
2018 2,014 718 6,533 2,079 1,439 12,783
% change 1.7 -0.4 6.7 4.4 70.2 9.6
Quarter 2
2017 1,902 699 5,920 1,958 857 11,335
2018 1,921 725 6,823 2,090 1,429 12,987
% change 1.0 3.7 15.3 6.7 66.7 14.6
First half
2017 3,882 1,420 12,046 3,950 1,702 23,000
2018 3,935 1,113 13,356 4,169 2,867 25,770
% change 1.4 1.6 10.9 5.5 68.4 12.0
Quarter 3
2017 1,665 680 7,076 1,975 1,140 12,536
2018 1,702 741 7,189 2,043 1,456 13,132
% change 2.3 8.9 1.6 3.5 27.7 4.8
Quarter 4
2017 1,830 654 6,652 2,105 1,304 12,545
2018 1,748 624 6,161 1,983 1,311 11,827
% change -4.5 -4.5 -7.4 -5.8 0.6 -5.7
Second half
2017 3,495 1,334 13,728 4,080 2,444 25,081
2018 3,450 1,365 13,350 4,026 2,767 24,959
% change -1.3 2.3 -2.8 -1.3 13.2 -0.5
Full year
2017 7,377 2,754 25,774 8,030 4,146 48,081
2018 7,385 2,808 26,706 8,195 5,635 50,729
% change 0.1 2.0 3.6 2.1 35.9 5.5
Table 2 Stainless melt shop production (slab/ingot equivalent) by quarter in 1,000 metric tonnes: 2017 compared to 2018 Others: Brazil, Russia, S. Africa, S. Korea, Indonesia
ISSF STAINLESS STEEL IN FIGURES 2019- 10ACTUAL PERFORMANCE
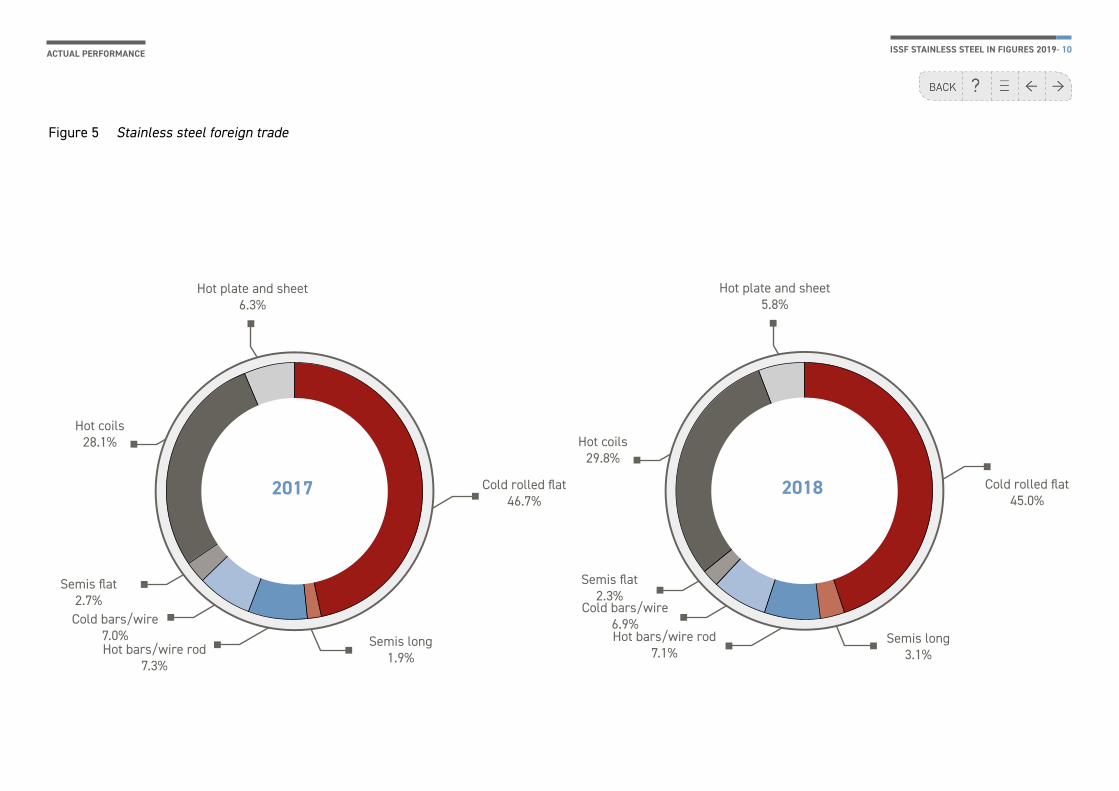
2017 2018
Hot bars/wire rod7.3%
Semis long1.9%
Hot plate and sheet6.3%
Hot coils28.1%
Semis flat2.7%Cold bars/wire
7.0%
Cold rolled flat46.7%
Hot bars/wire rod7.1%
Semis long3.1%
Hot plate and sheet5.8%
Hot coils29.8%
Semis flat2.3%
Cold bars/wire6.9%
Cold rolled flat45.0%
Figure 5 Stainless steel foreign trade
ISSF STAINLESS STEEL IN FIGURES 2019- 11ACTUAL PERFORMANCE
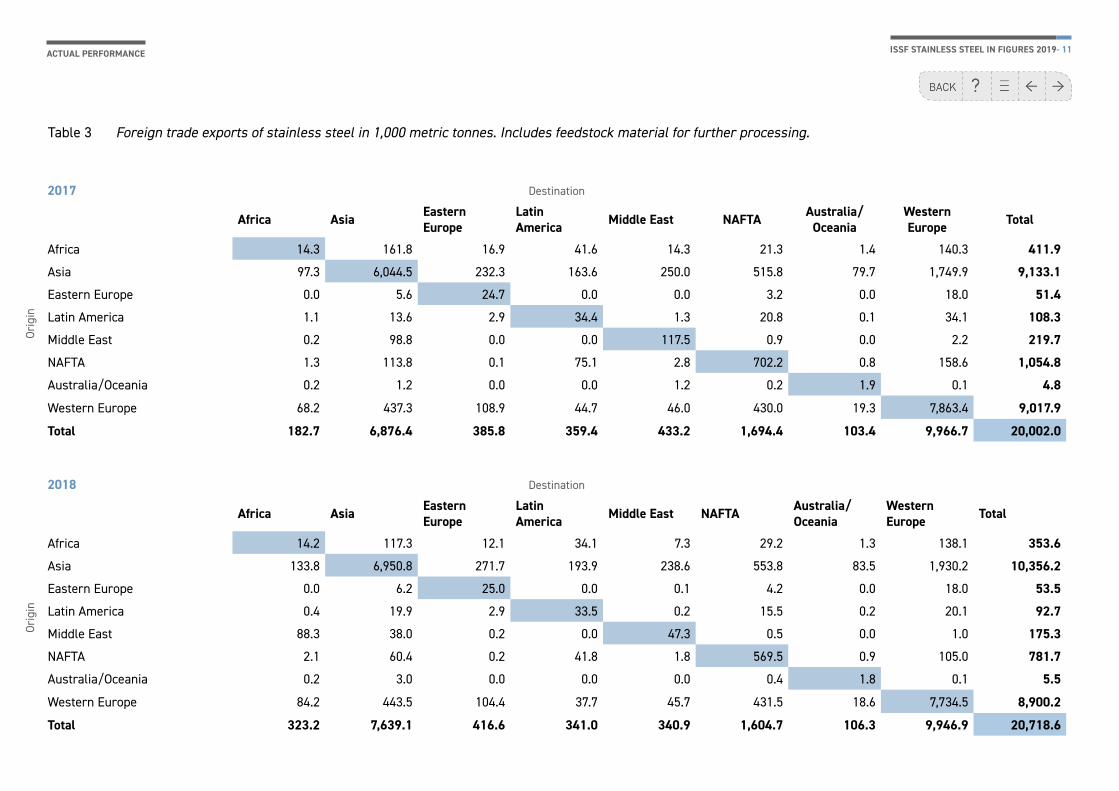
Table 3 Foreign trade exports of stainless steel in 1,000 metric tonnes. Includes feedstock material for further processing.
Orig
in
2017 Destination
Africa Asia Eastern Europe
Latin America Middle East NAFTA Australia/
OceaniaWestern Europe Total
Africa 14.3 161.8 16.9 41.6 14.3 21.3 1.4 140.3 411.9
Asia 97.3 6,044.5 232.3 163.6 250.0 515.8 79.7 1,749.9 9,133.1
Eastern Europe 0.0 5.6 24.7 0.0 0.0 3.2 0.0 18.0 51.4
Latin America 1.1 13.6 2.9 34.4 1.3 20.8 0.1 34.1 108.3
Middle East 0.2 98.8 0.0 0.0 117.5 0.9 0.0 2.2 219.7
NAFTA 1.3 113.8 0.1 75.1 2.8 702.2 0.8 158.6 1,054.8
Australia/Oceania 0.2 1.2 0.0 0.0 1.2 0.2 1.9 0.1 4.8
Western Europe 68.2 437.3 108.9 44.7 46.0 430.0 19.3 7,863.4 9,017.9
Total 182.7 6,876.4 385.8 359.4 433.2 1,694.4 103.4 9,966.7 20,002.0
Orig
in
2018 Destination
Africa Asia Eastern Europe
Latin America Middle East NAFTA Australia/
OceaniaWestern Europe Total
Africa 14.2 117.3 12.1 34.1 7.3 29.2 1.3 138.1 353.6
Asia 133.8 6,950.8 271.7 193.9 238.6 553.8 83.5 1,930.2 10,356.2
Eastern Europe 0.0 6.2 25.0 0.0 0.1 4.2 0.0 18.0 53.5
Latin America 0.4 19.9 2.9 33.5 0.2 15.5 0.2 20.1 92.7
Middle East 88.3 38.0 0.2 0.0 47.3 0.5 0.0 1.0 175.3
NAFTA 2.1 60.4 0.2 41.8 1.8 569.5 0.9 105.0 781.7
Australia/Oceania 0.2 3.0 0.0 0.0 0.0 0.4 1.8 0.1 5.5
Western Europe 84.2 443.5 104.4 37.7 45.7 431.5 18.6 7,734.5 8,900.2
Total 323.2 7,639.1 416.6 341.0 340.9 1,604.7 106.3 9,946.9 20,718.6
ISSF STAINLESS STEEL IN FIGURES 2019- 12ACTUAL PERFORMANCE
2017 Destination
Africa Asia Eastern Europe
Latin America Middle East NAFTA Australia/
OceaniaWestern Europe Total
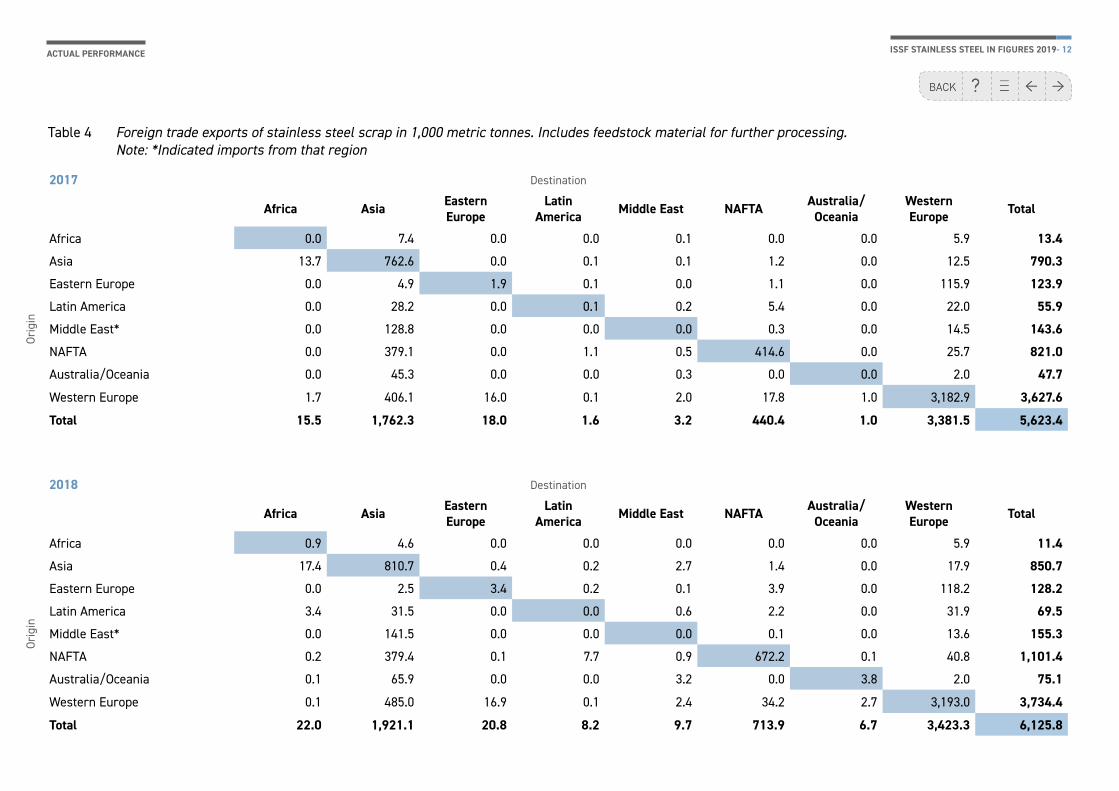
Africa 0.0 7.4 0.0 0.0 0.1 0.0 0.0 5.9 13.4
Asia 13.7 762.6 0.0 0.1 0.1 1.2 0.0 12.5 790.3
Eastern Europe 0.0 4.9 1.9 0.1 0.0 1.1 0.0 115.9 123.9
Latin America 0.0 28.2 0.0 0.1 0.2 5.4 0.0 22.0 55.9
Middle East* 0.0 128.8 0.0 0.0 0.0 0.3 0.0 14.5 143.6
NAFTA 0.0 379.1 0.0 1.1 0.5 414.6 0.0 25.7 821.0
Australia/Oceania 0.0 45.3 0.0 0.0 0.3 0.0 0.0 2.0 47.7
Western Europe 1.7 406.1 16.0 0.1 2.0 17.8 1.0 3,182.9 3,627.6
Total 15.5 1,762.3 18.0 1.6 3.2 440.4 1.0 3,381.5 5,623.4
Orig
in
2018 Destination
Africa Asia Eastern Europe
Latin America Middle East NAFTA Australia/
OceaniaWestern Europe Total
Africa 0.9 4.6 0.0 0.0 0.0 0.0 0.0 5.9 11.4
Asia 17.4 810.7 0.4 0.2 2.7 1.4 0.0 17.9 850.7
Eastern Europe 0.0 2.5 3.4 0.2 0.1 3.9 0.0 118.2 128.2
Latin America 3.4 31.5 0.0 0.0 0.6 2.2 0.0 31.9 69.5
Middle East* 0.0 141.5 0.0 0.0 0.0 0.1 0.0 13.6 155.3
NAFTA 0.2 379.4 0.1 7.7 0.9 672.2 0.1 40.8 1,101.4
Australia/Oceania 0.1 65.9 0.0 0.0 3.2 0.0 3.8 2.0 75.1
Western Europe 0.1 485.0 16.9 0.1 2.4 34.2 2.7 3,193.0 3,734.4
Total 22.0 1,921.1 20.8 8.2 9.7 713.9 6.7 3,423.3 6,125.8
Orig
in
Table 4 Foreign trade exports of stainless steel scrap in 1,000 metric tonnes. Includes feedstock material for further processing. Note: *Indicated imports from that region
ISSF STAINLESS STEEL IN FIGURES 2019- 13ACTUAL PERFORMANCE
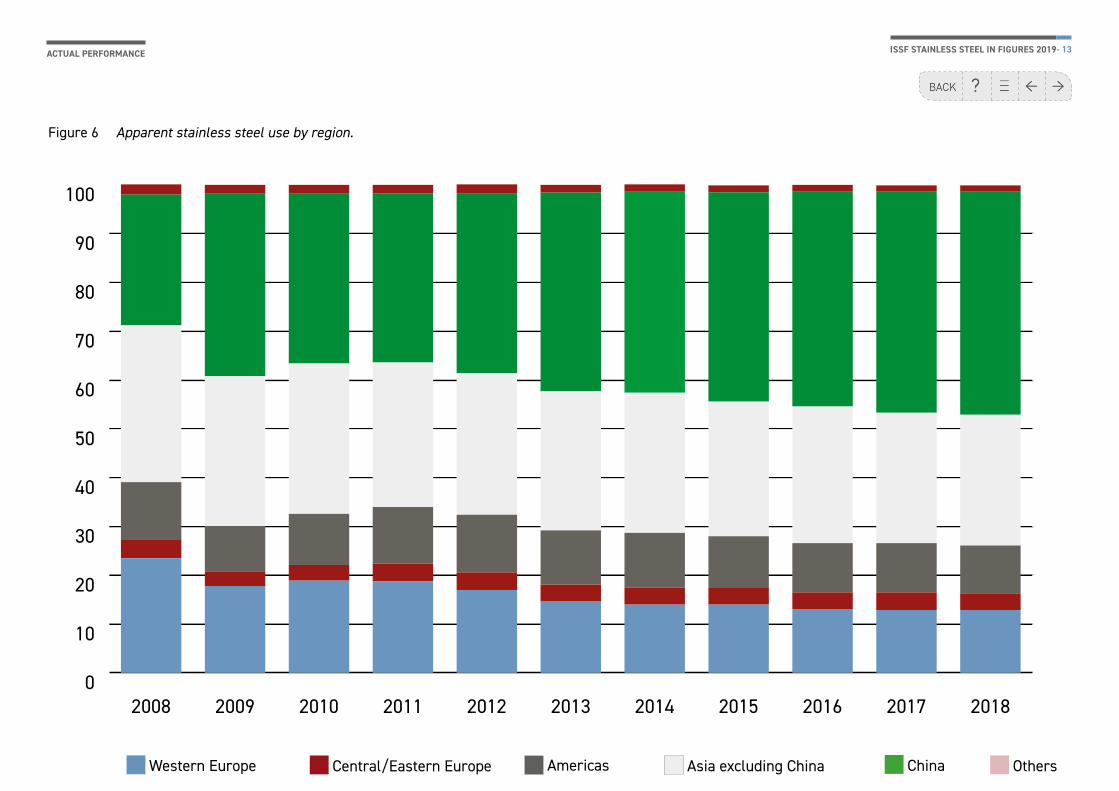
Figure 6 Apparent stainless steel use by region.
Western Europe Central/Eastern Europe Americas Asia excluding China China Others
0
10
20
30
40
50
60
70
80
90
100
20182017201620152014201320122011201020092008
ISSF STAINLESS STEEL IN FIGURES 2019- 14ACTUAL PERFORMANCE
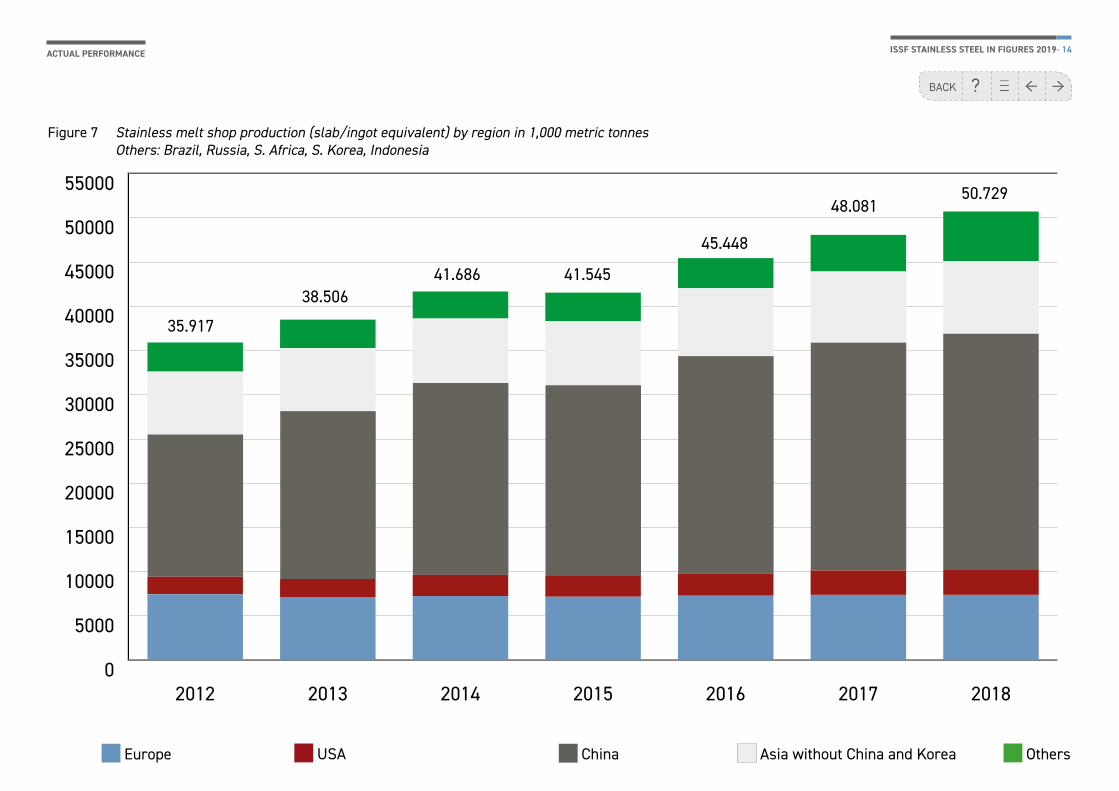
Figure 7 Stainless melt shop production (slab/ingot equivalent) by region in 1,000 metric tonnes Others: Brazil, Russia, S. Africa, S. Korea, Indonesia
0
5000
10000
15000
20000
25000
30000
35000
40000
45000
50000
55000
2018201720162015201420132012
35.917
38.50641.686 41.545
45.448
48.08150.729
Europe USA China Asia without China and Korea Others
ISSF STAINLESS STEEL IN FIGURES 2019- 15ACTUAL PERFORMANCE
0
10
20
30
40
50
60
70
80
90
100
2018Q4Q3Q2Q12017201620152014201320122011201020092008
Maj
or c
orre
ctio
n of
Chi
nese
dat
a fo
r 20
11, n
ot c
ompa
rabl
e w
ith p
revi
ous
year
s
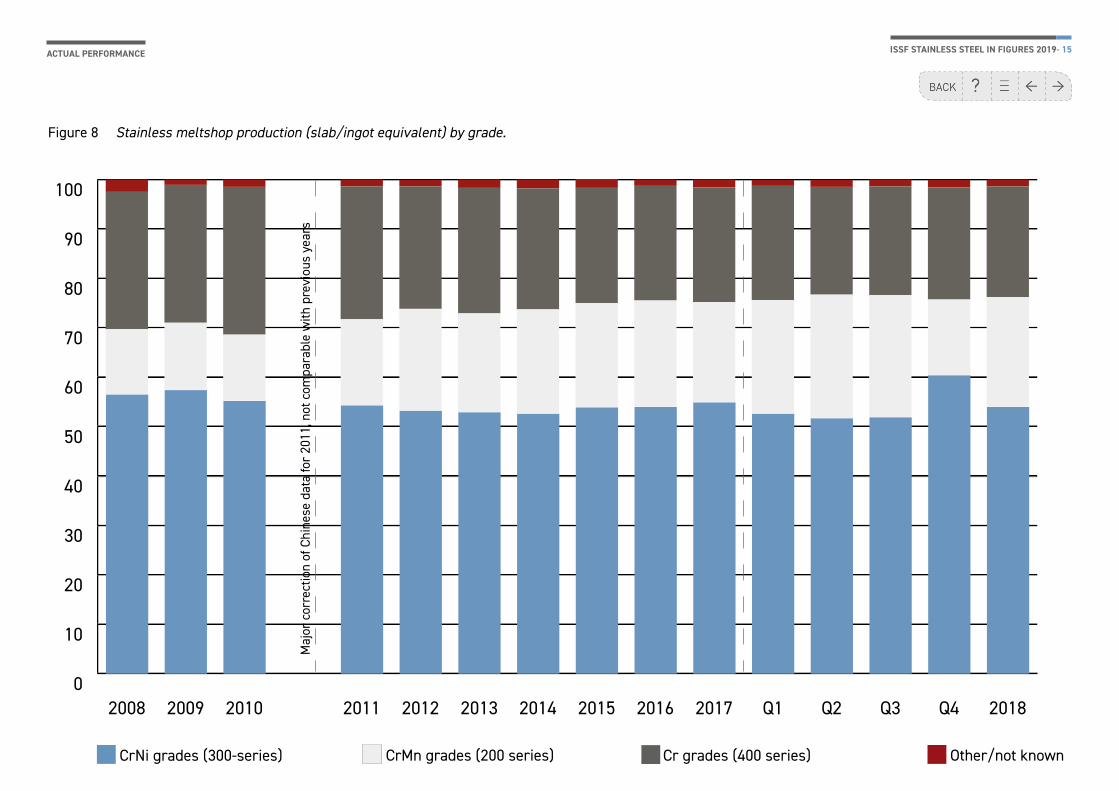
CrNi grades (300-series) Other/not knownCr grades (400 series)CrMn grades (200 series)
Figure 8 Stainless meltshop production (slab/ingot equivalent) by grade.
ISSF STAINLESS STEEL IN FIGURES 2019- 16ACTUAL PERFORMANCE
0
1
2
3
4
5
6
7
8
9
10
11
12
13
14
20182017201620152014201320122011201020092008
Majo
r co
rrecti
on
of
Ch
inese d
ata
for
20
11
, n
ot
com
para
ble
wit
h p
rev
iou
s y
ears
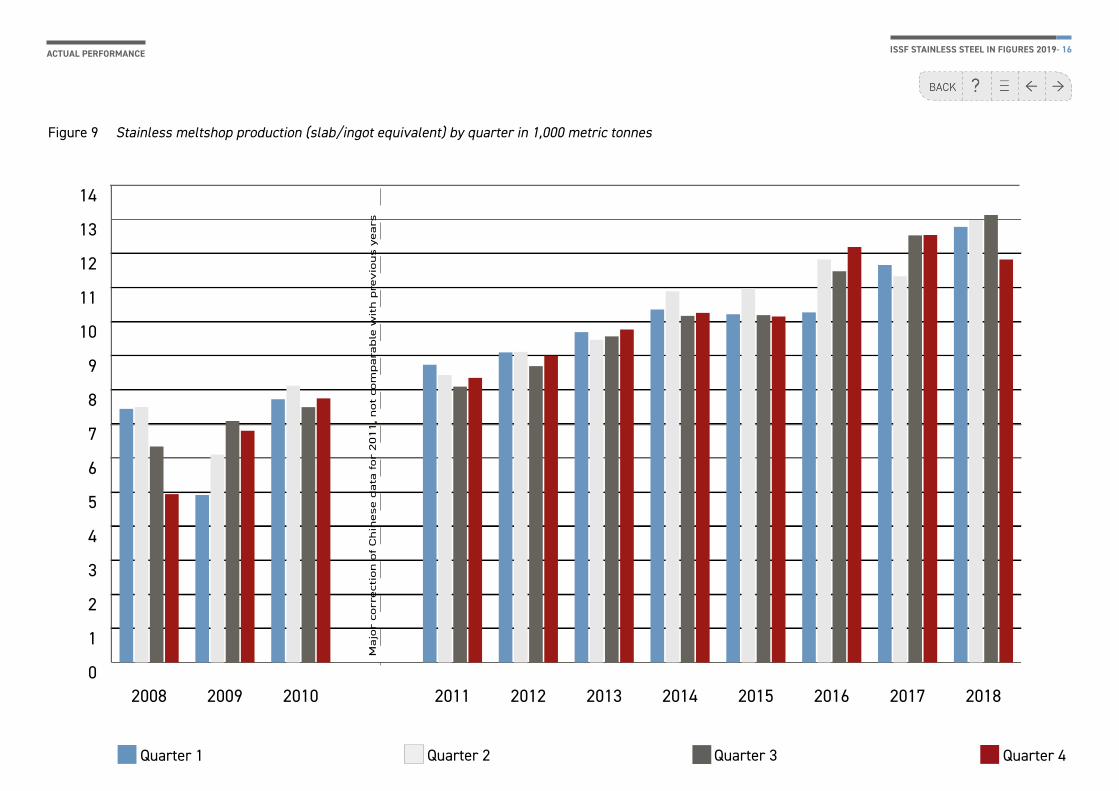
Quarter 1 Quarter 4Quarter 3Quarter 2
Figure 9 Stainless meltshop production (slab/ingot equivalent) by quarter in 1,000 metric tonnes
ISSF STAINLESS STEEL IN FIGURES 2019- 17POTENTIAL
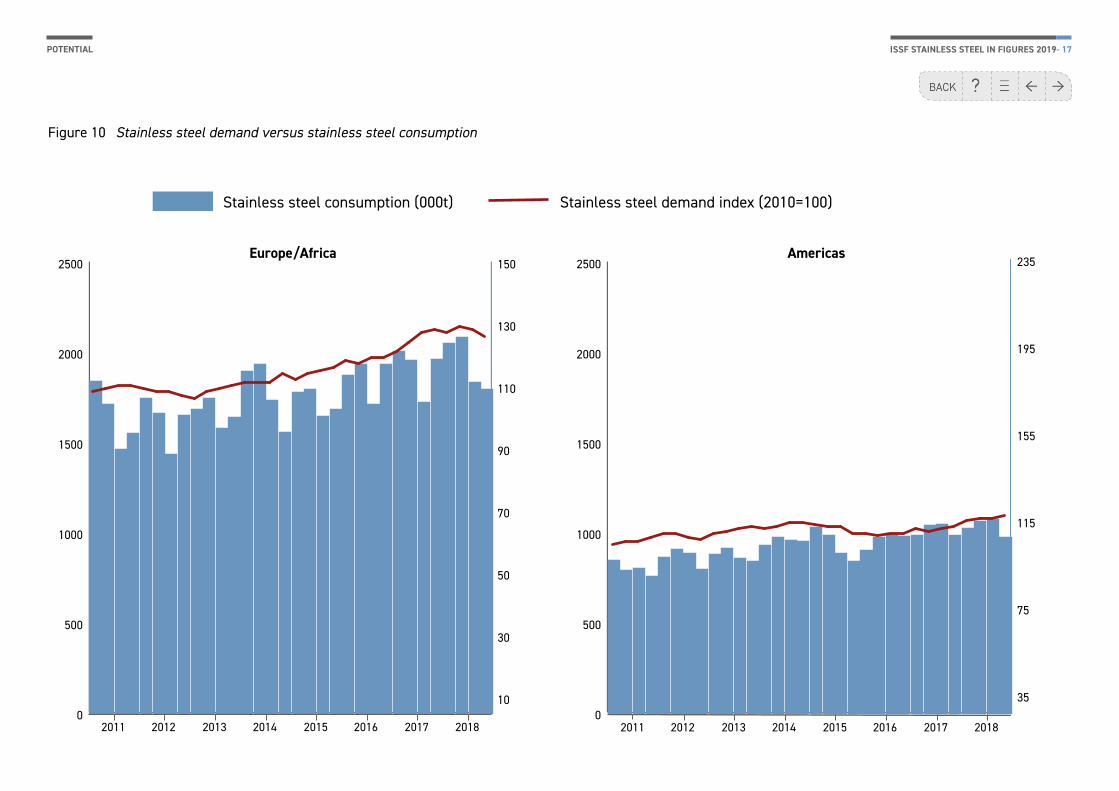
Figure 10 Stainless steel demand versus stainless steel consumption
Stainless steel consumption (000t) Stainless steel demand index (2010=100)
0
500
1000
1500
2000
2500
10
30
50
70
90
110
130
150
0
500
1000
1500
2000
2500
35
75
115
155
195
235
2011 2012 2013 2014 2015 2016 2017 2018 2011 2012 2013 2014 2015 2016 2017 2018
Europe/Africa Americas
ISSF STAINLESS STEEL IN FIGURES 2019- 18POTENTIAL
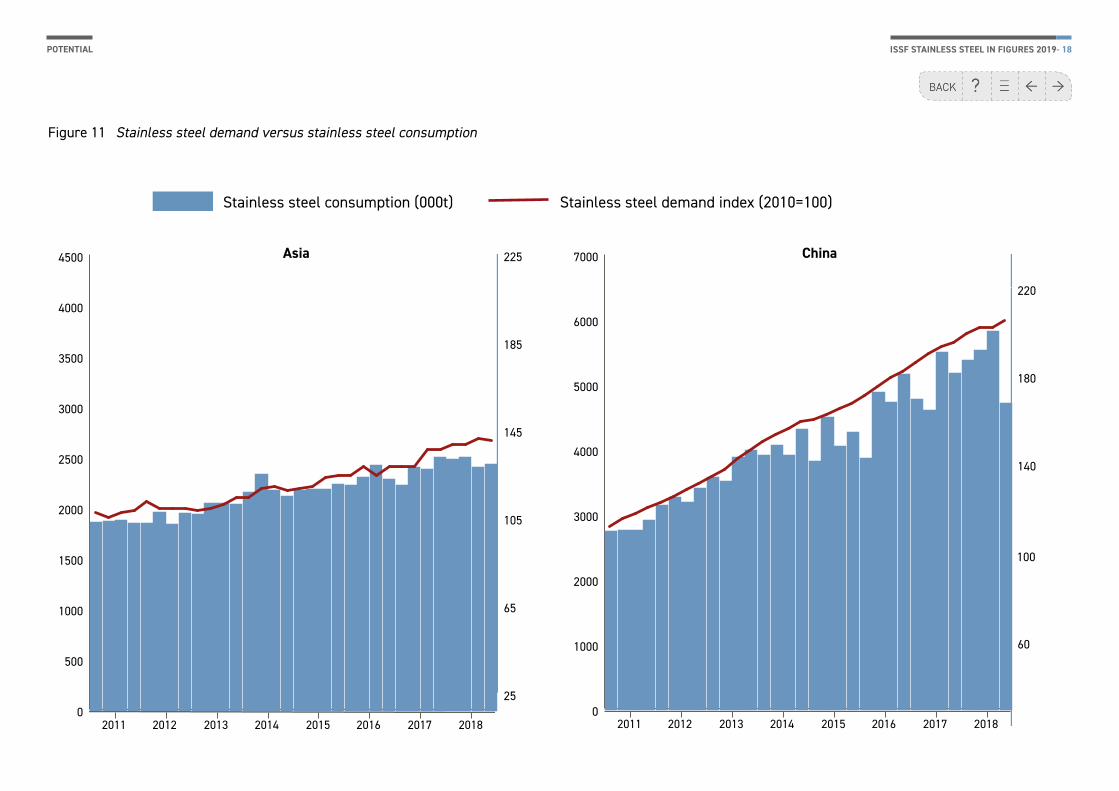
Figure 11 Stainless steel demand versus stainless steel consumption
Stainless steel consumption (000t) Stainless steel demand index (2010=100)
Asia China
0
500
1000
1500
2000
2500
3000
3500
4000
4500
25
65
105
145
185
225
0
1000
2000
3000
4000
5000
6000
7000
60
100
140
180
220
2011 2012 2013 2014 2015 2016 2017 2018 2011 2012 2013 2014 2015 2016 2017 2018
ISSF STAINLESS STEEL IN FIGURES 2019- 19POTENTIAL
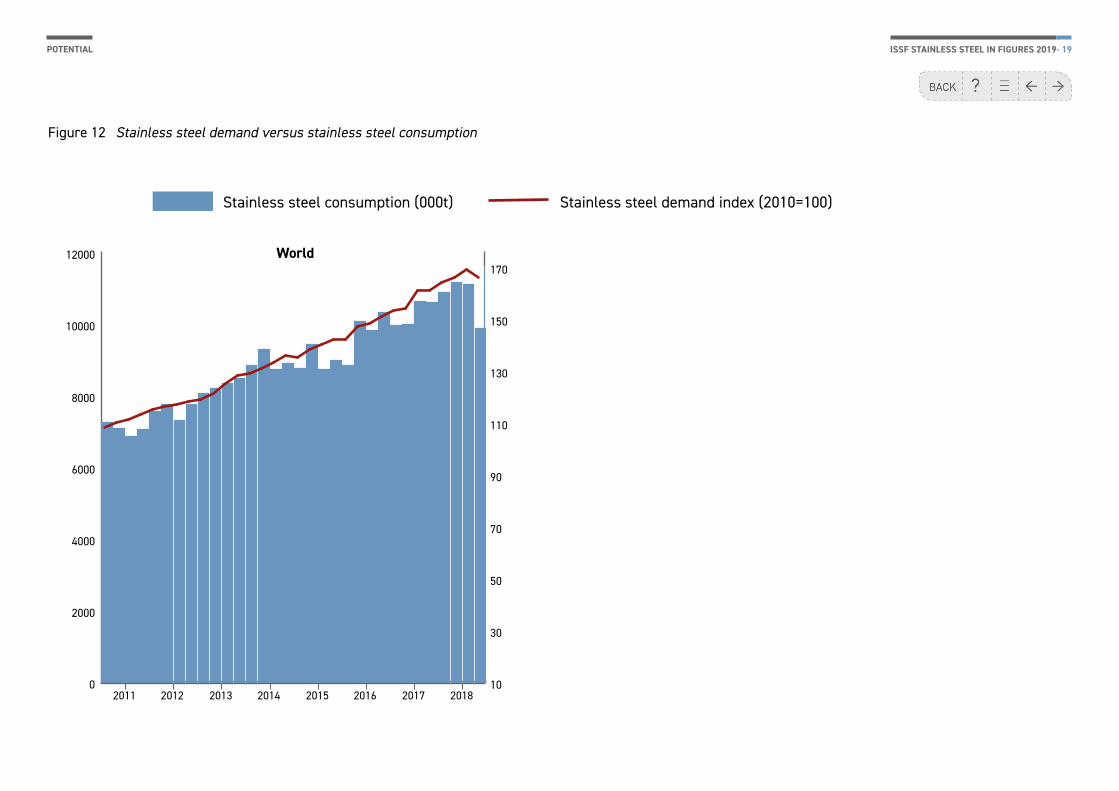
Figure 12 Stainless steel demand versus stainless steel consumption
Stainless steel consumption (000t) Stainless steel demand index (2010=100)
World
0
2000
4000
6000
8000
10000
12000
10
30
50
70
90
110
130
150
170
2011 2012 2013 2014 2015 2016 2017 2018
ISSF STAINLESS STEEL IN FIGURES 2019- 20POTENTIAL
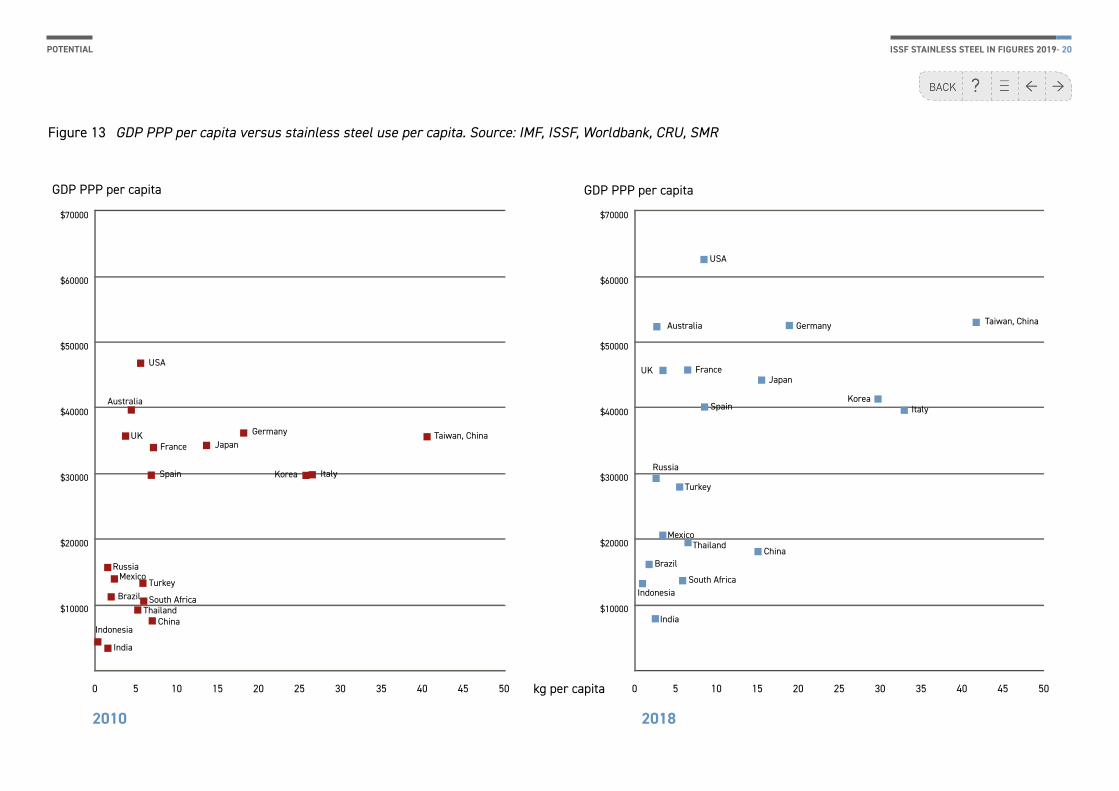
Figure 13 GDP PPP per capita versus stainless steel use per capita. Source: IMF, ISSF, Worldbank, CRU, SMR
0 5 10 15 20 25 30 35 40 45 50
$10000
$20000
$30000
$40000
$50000
$60000
$70000
0 5 10 15 20 25 30 35 40 45 50
$10000
$20000
$30000
$40000
$50000
$60000
$70000
USA
Australia Germany Taiwan, China
Korea
JapanFrance
Spain
Russia
Mexico
Turkey
Brazil
Thailand
South Africa
China
Indonesia
India
Italy
UKUSA
Australia
Germany Taiwan, China
Korea
JapanFrance
Spain
RussiaMexico
TurkeyBrazil
ThailandSouth Africa
ChinaIndonesia
India
Italy
UK
GDP PPP per capita GDP PPP per capita
kg per capita
2010 2018
ISSF STAINLESS STEEL IN FIGURES 2019- 21POTENTIAL
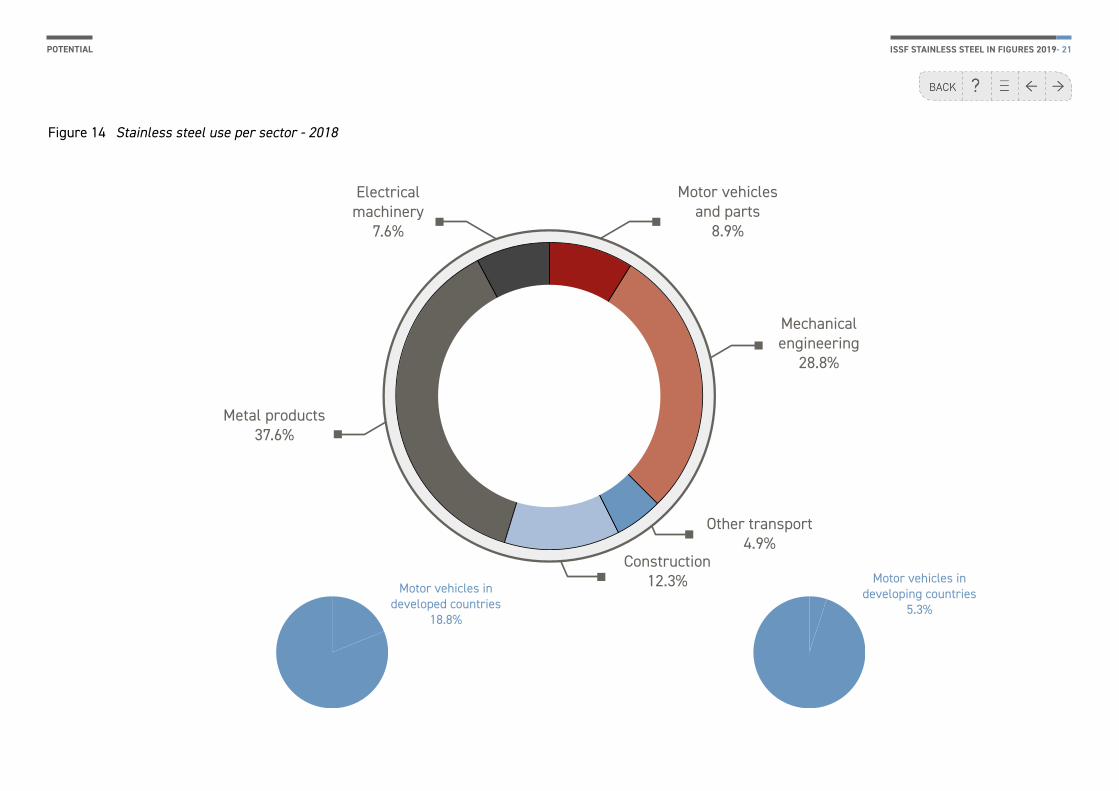
Figure 14 Stainless steel use per sector - 2018
Construction 12.3%
Metal products37.6%
Motor vehicles in developing countries
5.3%
Motor vehicles in developed countries
18.8%
Electrical machinery
7.6%
Motor vehicles and parts
8.9%
Mechanical engineering
28.8%
Other transport4.9%
ISSF STAINLESS STEEL IN FIGURES 2019- 22
Data sources
Unless otherwise indicated, all data in this booklet has been provided by the International Stainless Steel Forum (ISSF).
Data has also been provided by:1. International Chromium Development Association
(ICDA)
2. International Molybdenum Association (IMOA)
3. International Monetary Fund (IMF)
ISSF STAINLESS STEEL IN FIGURES 2019- 23
About ISSFThe International Stainless Steel Forum (ISSF) is a non-profit research and development organisation which was founded in 1996 and which serves as the focal point for the international stainless steel industry.
Who are the members?
ISSF has two categories of membership: company members and affiliated members. Company members are producers of stainless steel (integrated mills and rerollers). The association has 56 members from all over the world and currently represents approximately 90% of the total production of stainless steel.
Vision
Stainless steel provides sustainable solutions for everyday life.
More informationFor more information about ISSF, please consult our website worldstainless.org.
For more information about stainless steel and sustainability, please consult the sustainablestainless.org website.
Contact [email protected]
+32 2 702 89 00
Help
Help page
Contents page.
Previous page.
Next page.
Previous view.
DisclaimerThe International Stainless Steel Forum believes that the information presented is technically correct. However, ISSF, its members, staff and consultants specifically disclaim any and all liability or responsibility of any kind for loss, damage, or injury resulting from the use of the informa-tion contained in this brochure.