Embed Size (px)
Citation preview

Ferrous Division
World Steel recycling in FigureS 2008 – 2012
Steel Scrap – a Raw Material for Steelmaking
BIR GloBal Facts & FIGuRes Ferrous Metals


World Steel Recycling in Figures 2008 – 2012 1
Contents
Foreword 2
Executive Summary 4
Graphs & Tables 8
World Crude Steel Production 8
The Largest 12 Steel Producing Countries 9
World BOF Production 10
World EAF Production 10
Total Metallics for Steelmaking in the World 11
Steel Scrap for Steelmaking in the World 11
Steel Scrap Use and Purchases for Steelmaking in the World 12
Steel Scrap for Steelmaking in Major Countries 13
Scrap Use in Iron and Steel Foundries in the World 17
Volume of Global External Steel Scrap Trade 18
Main Steel Scrap Importers 18
Main Steel Scrap Exporters 19
Main Flows of Steel Scrap Exports 20
Major Net Steel Scrap Exporters 27
Price Curve 28
Glossary 29

The new edition of our BIR ferrous report “World Steel Recycling in Figures”, which covers the five-year period between 2008 and 2012, highlights the importance of scrap as a global raw material for the world’s steelworks and foundries.
It is a great pleasure for me to announce the publication of the fourth edition of our “World steel Recycling in Figures” report.
this compilation of important statistics relating to the global ferrous scrap markets has enjoyed a very positive reception since it appeared for the first time in 2010.
In addition to scrap usage information for the eU, China, the UsA, Japan, Russia and turkey, we have updated our calculation models covering the entire use of steel scrap as a raw material for steelmaking and for global scrap use in iron and steel foundries. According to our figures, global scrap use in steelmaking has been between 440m and 570m tonnes per annum in recent years, while its annual use in iron and steel foundries has amounted to between 56m and 74m tonnes.
We have also provided more information about world trade in steel scrap. For example, we show in a new graph the volume of global steel scrap trade, including inter-eU trade since the year 2000. In addition, we have developed four flow charts relating to steel scrap exports from the UsA, the eU-27, Japan and Russia. And we complete our fourth edition of “World steel Recycling in Figures” with an overview of 2012 export prices for the UsA and the eU.
FoReWoRd
2 World Steel Recycling in Figures 2008 – 2012

World Steel Recycling in Figures 2008 – 2012 3
the scale of world trade in steel scrap underlines the need for a free raw materials market. our industry lives from free trade worldwide, enabling us to bridge the global imbalance between net scrap exporters and net scrap importers.
I would like to extend special thanks to Rolf Willeke, the BIR Ferrous division’s statistics Advisor, who compiled, prepared and evaluated all the figures in our report which has been extended by some four pages such that it contains a total of 38 graphs and tables – seven more than its predecessor.
For an even more accurate appraisal of the market, we want to continue to improve the steel scrap figures at our disposal, including our quarterly update of world statistics.
We hope that “World steel Recycling in Figures 2008-2012” will be useful to you in your day-to-day business operations.
Brussels, May 2013
Christian RubachPresident of the BIR Ferrous division

4 World Steel Recycling in Figures 2008 – 2012
Final figures for 2012 show a record world steel output and virtually unchanged global steel scrap use for steelmaking.
World crude steel production increased 1.2% in 2012 to a record-breaking 1.547bn tonnes, according to worldsteel. the growth came mainly from Asia and north America while crude steel production fell last year in the eU-27 and south America.
Looking at the main scrap-using countries, worldsteel confirms in our last year’s statistics that China’s crude steel production reached 716.54m tonnes in 2012 for an increase of 3.1% over the previous year; the country’s share of world crude steel production increased from 45.4% in 2011 to 46.3% last year. other positives include increased crude steel production in the UsA (+2.7% to 88.7m tonnes), in Russia (+2.3% to 70.4m tonnes) and in turkey (+5.2% to 35.9m tonnes). In contrast, there were reductions in crude steel output in the eU-27 (-4.9% to 168.9m tonnes) and in Japan (-0.3% to 107.2m tonnes).
Global steel scrap use was unchanged at around 570m tonnes in 2012 although developments differed from country to country.Regarding global scrap use, we are still dependent on estimates for many areas of the world. so, in collaboration with experts from the German steel Federation (WV stahl), we have calculated scrap usage in world steel production of around 570m tonnes in 2012 – unchanged from 2011. owing to last year’s 1.2% increase in world crude steel output, the proportion of steel scrap used in crude steel production fell from 37.3% to 36.8%.
According to our calculations, there was also no change last year in own arisings (circulating scrap) at 200m tonnes. the proportion of own arisings used in crude steel production dropped from 13.1% to 12.9% as a result of mills’ efforts to improve yields through the wider use of continuous casting and of near-net-shape casting. For 2012, we have calculated unchanged steel scrap purchases by steelworks at around 370m tonnes.
one of the main reasons why global steel scrap use did not mirror the increase in world steel output last year was the situation in China. As the world’s biggest steel producer, China is attracting particular attention regarding its scrap usage; in 2012, its steel industry sharply reduced its scrap usage – by 12.3% to 79.8m tonnes – despite the fact that the country’s crude steel production was in positive
exeCUtIVe sUMMARy

World Steel Recycling in Figures 2008 – 2012 5
territory (+3.1% over 2011). For the Chinese market, iron ore was cheaper for many months last year and so the cost of blast furnace iron was less than steel scrap for many of the country’s steelmakers. this assessment is supported by last year’s 6.8% growth in global pig iron production to 1.105bn tonnes – an increase which was much higher than the 1.2% gain in world steel output. Chinese steelmakers also benefitted from an increasing domestic scrap supply which caused prices to decline. together, these facts limited China’s need to import steel scrap. this is in line with the insistence of the country’s new president xi Jinping that China will put more into its ‘green’ efforts, including recycling and low-carbon developments.
the eU-27 recorded a drop in steel scrap usage in 2012 (-6% to 94.1m tonnes) while the region’s crude steel production fell by a smaller proportion (-4.9%). the biggest steel scrap user in the eU-27 was Italy on 20.8m tonnes (-5.8%). Also in decline during 2012 was steel scrap consumption in Russia (-4.4% to 20.1m tonnes), even though the country’s crude steel production increased 2.3%, and also in Japan (-4.6% to 35.5m tonnes) where crude steel output slipped only 0.3%.
the only major positives in our least year’s statistics were the steel scrap usage gains in the UsA and in turkey. the increase in Us steel scrap use (+9.4% to 61.7m tonnes) was greater than the growth in domestic crude steel production (+2.7%). A possible explanation for higher steel scrap usage in the UsA is the increased use of lower-quality grades by integrated plants as they make use of their ability to dilute residuals in these lesser grades of scrap. Last year’s upturn in turkish steel scrap consumption was around 5.1% to 32.4m tonnes although growth in the country’s crude steel production was higher still (+5.2%). But we can assume that in 2012, we also had a higher steel scrap usage in two other big steel producing countries, i.e. India and the Republic of Korea. India increased its steel output (+4.3% to 76.7m tonnes) and steel scrap imports (+32.4% to 8.180m tonnes), and the Republic of Korea increased its steel output (+0.8% to 69.1m tonnes) and steel scrap imports (+17.4% to 10.126m tonnes).
Global annual scrap use in iron and steel foundries is between 56m and 74m tonnes We are able to present again a calculation model for global scrap use in iron and steel foundries, produced in collaboration with experts from the German Foundry Association (BdG) which is also responsible for the secretariat General of the european Foundry Association (CAeF). our calculations cover the period from 2008 to 2011; it was not possible to incorporate figures for 2012 because world casting production

6 World Steel Recycling in Figures 2008 – 2012
is determined only by Us magazine “Modern Casting” with a time lag of one year. It should also be pointed out that our calculation model takes into account the high pig iron usage for casting production in the iron and steel foundries of China and India.
For 2011, we have calculated global scrap usage of 69.7m tonnes for a world iron and steel casting production of 82m tonnes. For the period 2008 to 2011, annual scrap use in iron and steel foundries amounted to between 56m and 74m tonnes. Furthermore, we have calculated annual scrap purchases by the world’s iron and steel foundries at around 43.1m tonnes for 2011.
In 2012, Turkey remained the world’s foremost importer of steel scrap whereas China sharply reduced its importsIn 2012, turkey’s overseas purchases of steel scrap climbed around 4.5% to 22.415m tonnes to reinforce the country’s position as the world’s foremost importer of steel scrap. As previously stated, it was similarly interesting to note substantially increased imports by the Republic of Korea (+17.4% to 10.126m tonnes) and by India (+32.4% to 8.18m tonnes). Also in positive territory last year were steel scrap imports into Canada (+22.6% to 2.343m tonnes).
China recorded a substantial drop in overseas steel scrap purchases last year (-26.5% to 4.974m tonnes), while declines were also registered by taiwan (-7% to 4.955m tonnes), the UsA (-7.2% to 3.711m tonnes), the eU-27 (-8.1% to 3.412m tonnes), Indonesia (-9.9% to 1.944m tonnes), Malaysia (-11.4% to 1.816m tonnes) and thailand (-9.4% to 1.701m tonnes).
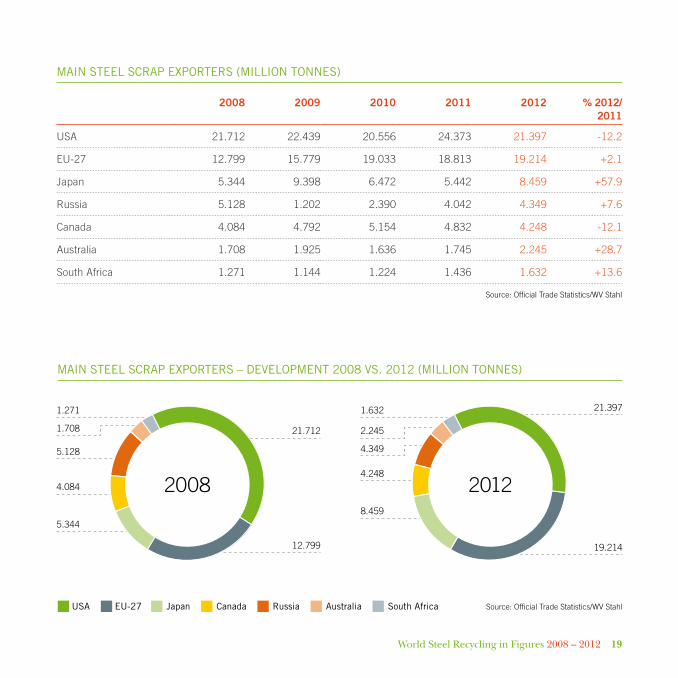
The USA remained the world’s leading exporter of steel scrap in spite of a drop in 2012In 2012, there was a decline in Us steel scrap exports of around 12.2% to 21.397m tonnes from the high figure of 2011. But in spite of this drop, the UsA remained the world’s leading exporter of steel scrap – the biggest buyer of which was turkey (+13.8% to 6.398m tonnes). It is also worth highlighting a steep decline in Us shipments to China (-54% to 1.945m tonnes ) as well as a drop in Canada’s steel scrap exports of around 12.1% to 4.248m tonnes.
World Steel Recycling in Figures 2008 – 2012 7
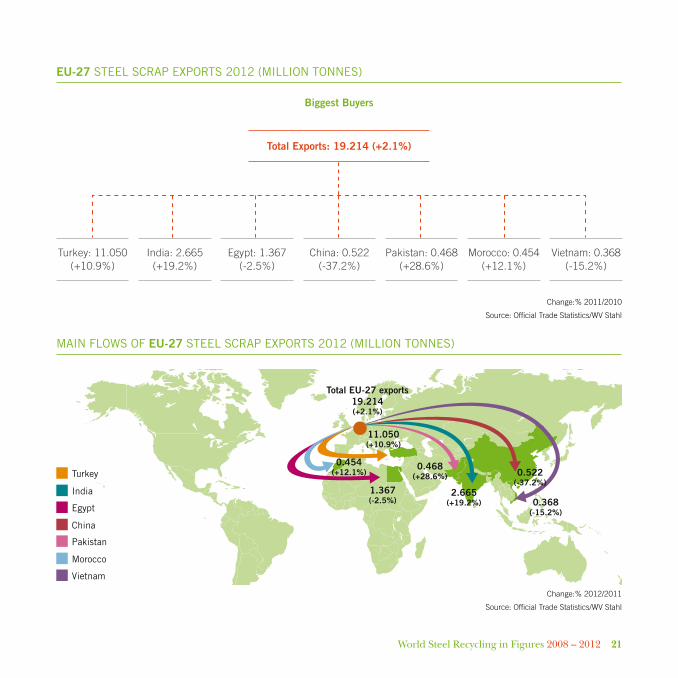
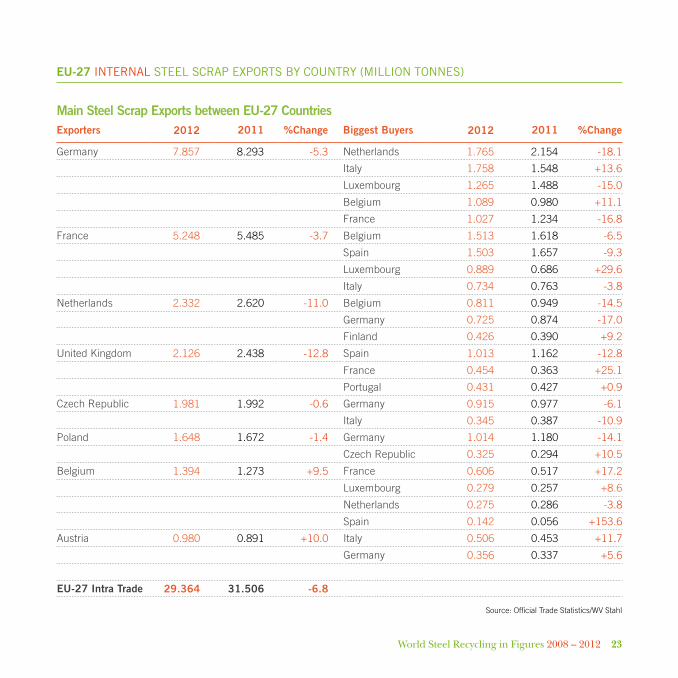
Whereas eU steel mills reduced their steel scrap usage, the region’s exports jumped 2.1% to 19.214m tonnes in 2012, with turkey maintaining its position as the biggest buyer of eU steel scrap on 11.05m tonnes (+10.9% over 2011). It is noticeable that, in 2012, turkey was the biggest buyer of steel scrap for all the main exporting countries of the eU-27. However, there was a sharp decline in eU shipments to China (-37.2% to 0.522m tonnes). the eU-27’s internal steel scrap exports last year amounted to around 29.364m tonnes (-6.8% over 2011) – a figure which was clearly higher than shipments to third countries and which confirms the active role of inter-eU trade in the raw materials supply chain for european steel production.
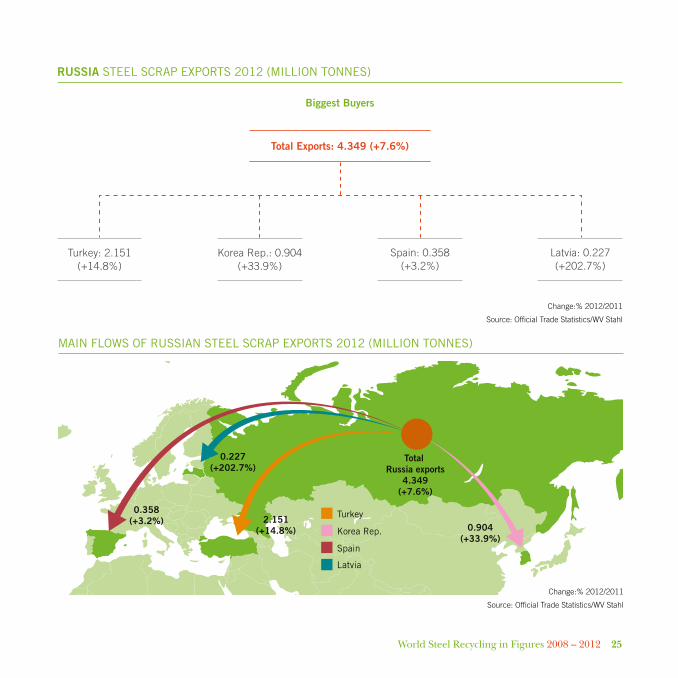
After a difficult 2011, Japan’s steel scrap export volumes jumped 57.9% to 8.459m tonnes last year, with shipments to the Republic of Korea soaring 69.9% to 4.862m tonnes. the second biggest buyer of Japan’s exports was China on 3.13m tonnes (+28.2% over 2011). Clearly, Japan’s exports were positively influenced by favourable short shipping routes. In 2012, higher overseas shipments of steel scrap were also recorded by Russia (+7.6% to 4.349m tonnes), Australia (+28.7% to 2.245m tonnes) and south Africa (+13.6% to 1.436m tonnes).
our new graph shows that worldwide, total external steel scrap trade reached 106.6m tonnes in 2012 (-1.9% over 2011), of which nearly 28% was attributable to inter-eU trade. It is also noticeable that all the world’s leading steel scrap exporters are major net steel scrap exporters: the export surplus was, for example, 17.7m tonnes for the UsA and 15.8m tonnes for the eU-27 in 2012.
Meanwhile, the figures for last year also show that steel scrap prices (as illustrated in the export prices of the UsA and the eU) remained volatile, thus emphasising that this raw material is an international commodity subject to world market prices.
Finally, market developments in 2012 highlighted the global importance of scrap as an ecologically beneficial raw material for steelworks and foundries, and at the same time underlined the need for a free world raw material market.
Rolf Willekestatistics Advisor of the BIR Ferrous division

8 World Steel Recycling in Figures 2008 – 2012
World crude Steel production – Summary (million tonneS)
2008 2009 2010 2011 2012 % 2012/ 2011
Europe 344.3 265.3 314.7 329.5 319.8 -2.9
of which:
eU (27) 198.2 139.3 172.8 177.7 168.9 -4.9
CIs 114.3 96.9 108.2 112.7 111.0 -1.5
of which:
Russia 68.5 60.0 66.9 68.9 70.4 +2.3
North America 124.5 82.6 111.6 118.9 121.8 +2.5
of which:
United states 91.4 58.2 80.5 86.4 88.7 +2.7
South America 47.4 37.8 43.9 48.4 46.9 -3.0
Africa 17.0 15.4 16.6 15.7 15.8 +0.7
Middle East 16.6 17.7 20.0 23.0 24.2 +5.3
Asia 783.0 810.3 916.7 986.5 1 012.4 +2.6
of which:
China 512.3 577.1 638.7 694.8 716.5 +3.1
Japan 118.7 87.5 109.6 107.6 107.2 -0.3
Australia / New Zealand 8.4 6.0 8.1 7.2 5.8 -19.9
World 1 341.2 1 235.1 1 431.7 1 529.2 1 546.8 +1.2
source: worldsteel
GRAPHs And tABLes

World Steel Recycling in Figures 2008 – 2012 9
World crude Steel production (million tonneS)
the largeSt 12 Steel producing countrieS (million tonneS)
Change:%2012/2011 Source: worldsteelWorld Steel Production Of which China
0
300
600
900
1 200
1 500
2008 2009 2010 2011 2012
1 341
512577
639695
717(+3.1%)
1 235
1 4321 529
1 547(+1.2%)
2008 2009 2010 2011 2012 % 2012/ 2011
1 China 512.3 577.1 638.7 694.8 716.5 +3.1
2 Japan 118.7 87.5 109.6 107.6 107.2 -0.3
3 United states 91.4 58.2 80.5 86.4 88.7 +2.7
4 India 57.8 63.5 69.6 73.6 76.7 +4.3
5 Russia 68.5 60.0 66.9 68.9 70.4 +2.3
6 Korea Rep. 53.6 48.6 58.9 68.5 69.1 +0.8
7 Germany 45.8 32.7 43.8 44.3 42.7 -3.7
8 turkey 26.8 25.3 29.1 34.1 35.9 +5.2
9 Brazil 33.7 26,5 32.9 35.2 34.7 -1.5
10 Ukraine 37.3 29.9 33.5 35.3 33.0 -6.7
11 Italy 30.6 19.8 25.8 28.7 27.2 -5.3
12 taiwan 19.9 15.8 19.8 20.2 20.7 +2.4
source: worldsteel

10 World Steel Recycling in Figures 2008 – 2012
World BoF production (million tonneS)
World eaF production (million tonneS)
Change:%2012/2011 Source: worldsteelBOF : Basic Oxygen Fumace
0
300
600
900
1 200
2008 2009 2010 2011 2012
890 863
9871 065
1 074(+0,8%)
Change:%2012/2011 Source: worldsteelEAF : Electric Arc Fumace
0
300
600
900
1 200
2008 2009 2010 2011 2012
409344
411449
452(+0,7%)

World Steel Recycling in Figures 2008 – 2012 11
total metallicS For Steelmaking in the World (million tonneS)
Steel Scrap For Steelmaking in the World (million tonneS)
2008 2009 2010 2011 2012 % 2012/ 2011
Crude steel Production 1 341 1 235 1 432 1 529 1 547 +1.2
of which oxygen (BoF) 890 863 987 1 065 1 074 +0.8
electric (eAF) 409 344 411 449 452 +0.7
(Share EAF of Crude Steel) in % 30.5 27.9 28.7 29.4 29.2
Pig Iron 949 933 1034 1035 1105 +6.8
(Ratio Pig Iron / Crude Steel) in % 70.8 75.5 72.2 67.7 71.4
steel scrap 530 440 530 570 570 ±0.0
(Ratio Steel Scrap / Crude Steel) in % 39.5 35.6 37.0 37.3 36.8
dRI 68 64 70 72 73 +1.4
(Ratio DRI / Crude Steel) in % 5.1 5.2 4.9 4.7 4.7
total Metallics 1 547 1 437 1 634 1 677 1 748 +4.2
(Ratio Total Metallics / Crude Steel) in % 115.4 116.4 114.1 109.7 113.0
source: worldsteel, Midrex and own calculations by WV stahl/BIR
2008 2009 2010 2011 2012 % 2012/ 2011
Crude steel Production 1 341 1 235 1 432 1 529 1 547 +1.2
total steel scrap Use 530 440 530 570 570 ±0.0
(Ratio Steel Scrap / Crude Steel) in % 39.5 35.6 37.0 37.3 36.8
of which:
own Arisings (Circulating scrap) 195 176 190 200 200 ±0.0
(Share Own Arisings of Scrap Use) in % 36.8 39.8 35.9 35.1 35.1
Purchases by steelworks 335 265 340 370 370 ±0.0
(Share Purchases of Scrap Use) in % 63.2 60.2 64.2 64.9 64.9
of which:
new steel scrap (Process scrap) 105 90 110 120 120 ±0.0
(Share New Steel Scrap of Total Purchases) in % 31.3 34.0 32.4 32.4 32.4
old steel scrap (Capital scrap) 230 175 230 250 250 ±0.0
(Share Old Steel Scrap of Total Purchases) in % 68.7 66.0 67.8 67.6 67.6
source: worldsteel and own calculations by WV stahl/BIR

12 World Steel Recycling in Figures 2008 – 2012
Steel Scrap uSe and purchaSeS For Steelmaking in the World (million tonneS)
Source: worldsteel and WV Stahl/BIRCrude Steel Production Steel Scrap Use Steel Scrap Purchases
0
200
400
600
800
1 000
1 200
1 400
1 600
2008 2009 2010 2011 2012
1 341
530
335265
340 370 370440
530 570 570
1 235
1 4321 529
1 547(+1.2%)
Steel Scrap For Steelmaking in the World
0
100
200
300
400
600
500
20
25
30
35
45
Million Tonnes %
40
Source: WV Stahl/BIR
2009200820072006200520042003200220012000 2010 2011 2012
Ratio Steel Scrap / Crude Steel
Total Steel Scrap Use
Purchased Steel Scrap
Old Steel Scrap
Own Arisings
New Steel Scrap
Old Steel Scrap

World Steel Recycling in Figures 2008 – 2012 13
Steel Scrap For Steelmaking in the EU-27 (million tonneS)
Change:%2012/2011 Source: worldsteel and EUROFERCrude Steel Production Steel Scrap Use
0
20
40
60
80
100
120
140
160
180
200
220
2008 2009 2010 2011 2012
198.2
111.3
80.9
96.5 100.1 94.1(-6.0%)
139.3
172.8 177.7 168.9(-4.9%)
Steel Scrap For Steelmaking in major countrieS (million tonneS)
Steel Scrap Consumption Crude Steel Production
2012 2011 % Change 2012 2011 % Change
eU-27 94.1 100.1 -6.0 168.9 177.7 -4.9
China 79.8 91.0 -12.3 716.5 694.8 +3.1
UsA 61.7 56.4 +9.4 88.7 86.4 +2.7
Japan 35.5 37.2 -4.6 107.2 107.6 -0.3
turkey 32.4 30.8 +5.1 35.9 34.1 +5.2
Russia 20.1 21.0 -4.4 70.4 68.9 +2.3
source: worldsteel, eURoFeR, CAMU, IsRI/UsGs, dCUd, Japan Ministry of economy, Impextrade LLC, Russia

14 World Steel Recycling in Figures 2008 – 2012
Steel Scrap For Steelmaking in EU-27 countrieS (million tonneS)
Steel Scrap Consumption Crude Steel Production
2012 2011 %Change 2012 2011 %Change
Austria 2.539 2.526 +0.5 7.421 7.474 -0.7
Belgium 3.128 3.181 -1.7 7.301 8.026 -9.0
Bulgaria 0.690 0.910 -24.1 0.632 0.835 -24.3
Czech Republic 2.006 2.288 -12.3 5.072 5.583 -9.2
Finland 1.721 1.668 +3.1 3.759 3.989 -5.8
France 8.326 8.747 -4.8 15.609 15.780 -1.1
Germany 19.152 19.794 -3.2 42.661 44.284 -3.7
Greece 1.462 2.270 -35.6 1.247 1.934 -35.5
Hungary 0.385 0.526 -26.8 1.542 1.746 -11.7
Italy 20.845 22.132 -5.8 27.216 28.735 -5.3
Latvia 0.906 0.409 +48.2 0.805 0.568 +41.7
Luxembourg 2.473 2.824 -12.4 2.208 2.521 -12.4
netherlands 1.678 1.765 -4.9 6.879 6.937 -0.8
Poland 5.619 5.971 -5.9 8.366 8.801 -4.9
Portugal 2.100 1.520 +38.2 1.866 1.871 -0.2
Romania 1.988 2.330 -14.7 3.780 3.835 -1.4
slovakia 1.345 1.188 +13.2 4.403 4.236 +3.9
slovenia 0.696 0.734 -5.2 0.632 0.648 -2.4
spain 11.392 13.118 -13.2 13.628 15.504 -12.1
sweden 2.032 2.349 -13.5 4.326 4.867 -11.1
United Kingdom 3.658 3.890 -6.0 9.579 9.478 +1.1
EU-27 94.139 100.139 -6.0 168.935 177.652 -4.9
source: steel scrap Consumption: eURoFeR, steel Production: worldsteel

World Steel Recycling in Figures 2008 – 2012 15
Steel Scrap For Steelmaking in ChINA (million tonneS)
Change:%2012/2011 Source: worldsteel and CAMUCrude Steel Production Steel Scrap Use
0
100
200
300
400
500
600
700
800
2008 2009 2010 2011 2012
512.3
72.0 83.1 88.1 91.079.8
(-12.3%)
577.1
638.7
694.8
716.5(+3.1%)
Steel Scrap For Steelmaking in the USA (million tonneS)
Change:%2012/2011 Source: worldsteel and ISRI/USGSCrude Steel Production Steel Scrap Use
0
20
40
60
80
100
2008 2009 2010 2011 2012
91.4
66.0
53.060.0 56.4
61.7(+9.4%)
58.2
80.586.4
88.7(+2.7%)

16 World Steel Recycling in Figures 2008 – 2012
Steel Scrap For Steelmaking in jAPAN (million tonneS)
Change:%2012/2011 Source: worldsteel and Ministry of Economy, Trade and Industry in JapanCrude Steel Production Steel Scrap Use
0
20
40
60
80
100
120
140
2008 2009 2010 2011 2012
118.7
44.8
29.838.4 37.2
35.5(-4.6%)
87.5
109.6 107.6107.2
(-0.3%)
Steel Scrap For Steelmaking in TURkEy (million tonneS)
Change:%2012/2011 Source: worldsteel and DGUDCrude Steel Production Steel Scrap Use
0
5
10
15
20
25
30
35
40
2008 2009 2010 2011 2012
26.8
22.921.5
25.3
30.8
32.4(+5.1%)
25.3
29.1
34.1
35.9(+5.2%)

World Steel Recycling in Figures 2008 – 2012 17
Steel Scrap For Steelmaking in RUSSIA (million tonneS)
Change:%2012/2011 Source: worldsteel and UKRMETCrude Steel Production Steel Scrap Use
0
10
20
30
40
50
60
70
80
2008 2009 2010 2011 2012
68.5
20.1
13.7
21.5 21.020.1
(-4.4%)
60.0
66.968.9
70.4(+2.3%)
Scrap uSe in iron and Steel FoundrieS in the World (million tonneS)
2008 2009 2010 2011 % 2011/ 2010
Iron steel and Malleable Casting Production 78.8 67.6 76.9 82.0 +6.6
total scrap Use 73.6 56.9 64.4 69.7 +8.2
(Ratio Scrap Use / Casting Production) in % 93.4 84.2 83.8 85.0
of which:
own Arisings (Circulating scrap)* 28.1 21.7 24.6 26.6 +8.1
(Share Own Arisings of Scrap Use) in % 38.2 38.1 38.2 38.2
scrap Purchases 45.5 35.2 39.8 43.1 +8.3
(Share Purchases of Scrap Use) in % 61.8 61.9 61.8 61.8
source: Modern Casting and own calculations by BdG/BIR
* own Arisings (Circulating scrap) is the term for lumpy metal remains evolving during the casting process. elements belonging to this process such as sprues, runners, ingates and feeders are essential to produce a raw casting, but they do not belong to the actual casting and are therefore eliminated during the finishing process of it. Rejects and scrap developing in the foundry are added to the Circulating scrap as well.

18 World Steel Recycling in Figures 2008 – 2012
main Steel Scrap importerS (million tonneS)
2008 2009 2010 2011 2012 % 2012/2011
turkey 17.415 15.665 19.192 21.460 22.415 +4.5
Korea Rep. 7.319 7.800 8.091 8.628 10.126 +17.4
India 4.579 5.336 4.643 6.175 8.180 +32.4
China 3.590 13.692 5.848 6.767 4.974 -26.5
taiwan 5.539 3.912 5.364 5.328 4.955 -7.0
UsA 3.571 2.986 3.775 4.003 3.711 -7.2
eU-27 4.809 3.270 3.646 3.714 3.412 -8.1
Canada 1.674 1.408 2.226 1.911 2.343 +22.6
Indonesia 1.899 1.484 1.642 2.157 1.944 -9.9
Malaysia 2.293 1.683 2.292 2.050 1.816 -11.4
thailand 3.142 1.323 1.282 1.877 1.701 -9.4
source: official trade statistics/WV stahl
Volume oF gloBal external Steel Scrap trade (million tonneS)
2000 2001 2002 2003 2004 2005 2006 2007 2008 2009 2010 2011 2012
EU Intra Trade (Steel Scrap Trade between EU countries)
Steel Scrap External Trade Including EU Intra Trade
Source: Official Trade Statistics/WV Stahl
0
20
40
60
80
100
120
67.973.4
78.985.8
98.994.3 95.8 97.0
103.095.4
101.5108.7 106.6
World Steel Recycling in Figures 2008 – 2012 19
main Steel Scrap exporterS (million tonneS)
2008 2009 2010 2011 2012 % 2012/2011
UsA 21.712 22.439 20.556 24.373 21.397 -12.2
eU-27 12.799 15.779 19.033 18.813 19.214 +2.1
Japan 5.344 9.398 6.472 5.442 8.459 +57.9
Russia 5.128 1.202 2.390 4.042 4.349 +7.6
Canada 4.084 4.792 5.154 4.832 4.248 -12.1
Australia 1.708 1.925 1.636 1.745 2.245 +28.7
south Africa 1.271 1.144 1.224 1.436 1.632 +13.6
source: official trade statistics/WV stahl
main Steel Scrap exporterS – deVelopment 2008 VS. 2012 (million tonneS)
Source: Official Trade Statistics/WV Stahl
1.271
5.128
1.708
5.344
4.084
1.632
4.349
2.245
8.459
4.248
21.712
12.799
21.397
19.214
JapanUSA EU-27 Canada Russia Australia South Africa
2008 2012

20 World Steel Recycling in Figures 2008 – 2012
US Steel Scrap exportS 2012 (million tonneS)
Biggest Buyers
Change:% 2011/2010
source: official trade statistics/WV stahl
Total Exports: 21.397 (-12.2%)
turkey: 6.398 (+13.8%)
Korea Rep.: 2.824 (-4.7%)
taiwan: 3.509 (-0.9%)
India: 1.221 (+4.1%)
Malaysia: 0.810 (-17.7%)
main FloWS oF uS Steel Scrap exportS 2012 (million tonneS)
Change:% 2012/2011
source: official trade statistics/WV stahl
1.155(-21.1%)1.945
(-54.0%)
6.398(+13.8%)
1.221(+4.1%)
China
Turkey
Taiwan
India
Canada
Korea Rep.
Malaysia
2.824(-4.7%)
3.509(-0.9%)
0.810(-17.7%)
TotalUS exports
21.397(-12.2%)
China: 1.945 (-54.0%)
Canada: 1.155 (-21.1%)
World Steel Recycling in Figures 2008 – 2012 21
EU-27 Steel Scrap exportS 2012 (million tonneS)
main FloWS oF EU-27 Steel Scrap exportS 2012 (million tonneS)
Biggest Buyers
Change:% 2011/2010
source: official trade statistics/WV stahl
Change:% 2012/2011
source: official trade statistics/WV stahl
Total Exports: 19.214 (+2.1%)
turkey: 11.050(+10.9%)
China: 0.522(-37.2%)
India: 2.665(+19.2%)
Pakistan: 0.468(+28.6%)
egypt: 1.367(-2.5%)
Morocco: 0.454(+12.1%)
Vietnam: 0.368(-15.2%)
0.368(-15.2%)
0.522(-37.2%)
11.050(+10.9%)
0.468(+28.6%)
1.367(-2.5%)
0.454(+12.1%)
2.665(+19.2%)
Vietnam
China
Pakistan
India
Morocco
Turkey
Egypt
Total EU-27 exports19.214(+2.1%)

22 World Steel Recycling in Figures 2008 – 2012
EU-27 external Steel Scrap exportS By country (million tonneS)
Steel Scrap Exports by Main EU-27 Exporters to Third Countries Exporters 2012 2011 %Change Biggest Buyers 2012 2011 %Change
United Kingdom 5.170 5.376 -3.8 turkey 2.330 2.087 +11.6
India 1.311 1.090 +20.3
egypt 0.426 0.281 +51.6
Pakistan 0.205 0.148 +38.5
Morocco 0.173 0.216 -19.9
UsA 0.155 0.068 +127.9
netherlands 2.839 2.570 +10.5 turkey 1.671 1.281 +30.4
India 0.246 0.226 +8.8
egypt 0.192 0.386 -50.3
China 0.180 0.180 ±0.0
Vietnam 0.120 0.063 +90.5
Belgium 2.230 2.248 -0.8 turkey 1.313 1.240 +5.9
egypt 0.662 0.680 -2.6
Germany 1.651 1.674 -1.4 turkey 0.652 0.700 -6.9
India 0.385 0.251 +53.4
switzerland 0.246 0.321 -23.4
egypt 0.079 0.053 +49.1
France 0.908 0.765 +18.7 turkey 0.529 0.321 +64.8
Morocco 0.153 0.167 -8.4
India 0.074 0.080 -7.5
Romania 1.724 2.061 -16.4 turkey 1.724 2.061 -16.4
sweden 0.869 0.758 +14.6 turkey 0.383 0.293 +30.7
norway 0.113 0.068 +66.2
India 0.100 0.141 -29.1
Bulgaria 0.686 0.730 -6.0 turkey 0.598 0.514 +16.3
Macedonia 0.071 0.203 -65.0
EU-27 Extra Trade 19.214 18.813 +2.1
source: official trade statistics/WV stahl
World Steel Recycling in Figures 2008 – 2012 23
EU-27 internal Steel Scrap exportS By country (million tonneS)
Main Steel Scrap Exports between EU-27 Countries Exporters 2012 2011 %Change Biggest Buyers 2012 2011 %Change
Germany 7.857 8.293 -5.3 netherlands 1.765 2.154 -18.1
Italy 1.758 1.548 +13.6
Luxembourg 1.265 1.488 -15.0
Belgium 1.089 0.980 +11.1
France 1.027 1.234 -16.8
France 5.248 5.485 -3.7 Belgium 1.513 1.618 -6.5
spain 1.503 1.657 -9.3
Luxembourg 0.889 0.686 +29.6
Italy 0.734 0.763 -3.8
netherlands 2.332 2.620 -11.0 Belgium 0.811 0.949 -14.5
Germany 0.725 0.874 -17.0
Finland 0.426 0.390 +9.2
United Kingdom 2.126 2.438 -12.8 spain 1.013 1.162 -12.8
France 0.454 0.363 +25.1
Portugal 0.431 0.427 +0.9
Czech Republic 1.981 1.992 -0.6 Germany 0.915 0.977 -6.1
Italy 0.345 0.387 -10.9
Poland 1.648 1.672 -1.4 Germany 1.014 1.180 -14.1
Czech Republic 0.325 0.294 +10.5
Belgium 1.394 1.273 +9.5 France 0.606 0.517 +17.2
Luxembourg 0.279 0.257 +8.6
netherlands 0.275 0.286 -3.8
spain 0.142 0.056 +153.6
Austria 0.980 0.891 +10.0 Italy 0.506 0.453 +11.7
Germany 0.356 0.337 +5.6
EU-27 Intra Trade 29.364 31.506 -6.8
source: official trade statistics/WV stahl

24 World Steel Recycling in Figures 2008 – 2012
jAPAN Steel Scrap exportS 2012 (million tonneS)
Biggest Buyers
Change:% 2012/2011
source: official trade statistics/WV stahl
Total Exports: 8.459 (+57.9%)
Korea Rep.: 4.862(+69.9%)
China: 3.130(+28.2%)
taiwan: 0.189(+397.4%)
Vietnam: 0.283 (+644.7%)
main FloWS oF japaneSe Steel Scrap exportS 2012 (million tonneS)
Change:% 2012/2011
source: official trade statistics/WV stahl
0.189(+397.4%)
4.862(+69.9%)
China
Vietnam
Taiwan
Korea Rep.
3.130(+28.2%)
0.283(+664.7%)
Total Japan exports8.459
(+57.9%)
World Steel Recycling in Figures 2008 – 2012 25
RUSSIA Steel Scrap exportS 2012 (million tonneS)
Biggest Buyers
Change:% 2012/2011
source: official trade statistics/WV stahl
Total Exports: 4.349 (+7.6%)
turkey: 2.151(+14.8%)
Latvia: 0.227(+202.7%)
Korea Rep.: 0.904(+33.9%)
main FloWS oF ruSSian Steel Scrap exportS 2012 (million tonneS)
Change:% 2012/2011
source: official trade statistics/WV stahl
Turkey
Korea Rep.
Spain
Latvia
Total Russia exports
4.349(+7.6%)
0.227(+202.7%)
2.151(+14.8%) 0.904
(+33.9%)
0.358(+3.2%)
spain: 0.358 (+3.2%)

26 World Steel Recycling in Figures 2008 – 2012
AUSTRAlIA Steel Scrap exportS 2012 (million tonneS)
Biggest Buyers
Change:% 2012/2011
source: official trade statistics/WV stahl
Total Exports: 2.245 (+28.7%)
Vietnam: 0.562 (+178.2%)
Malaysia: 0.228(+10.7%)
Indonesia: 0.390 (+132.1%)
China: 0.390 (-14.8%)
CANADA Steel Scrap exportS 2012 (million tonneS)
Biggest Buyers
Change:% 2012/2011
source: official trade statistics/WV stahl
Total Exports: 4.248 (-12.1%)
UsA: 3.011(-7.6%)
turkey: 0.338(-52.9%)
egypt: 0.256(-28.7%)
India: 0.160 (+196.3%)

World Steel Recycling in Figures 2008 – 2012 27
SOUTh AFRICA Steel Scrap exportS 2012 (million tonneS)
Biggest Buyers
Change:% 2012/2011
source: official trade statistics/WV stahl
Total Exports: 1.632 (+13.6%)
India: 1.056(+85.3%)
Vietnam: 0.078(-25.0%)
Malaysia: 0.152 (-45.9%)
Pakistan: 0.116 (+19.6%)
major net Steel Scrap exporterS 2012 (million tonneS)
Source: Official Trade Statistics/WV StahlSteel Scrap Export Steel Scrap Import
0
5
10
15
20
25
USA EU-27 JAPAN RUSSIA
21.397
19.214
8.459
4.3493.711 3.412
0.225 0.004

28 World Steel Recycling in Figures 2008 – 2012
price curVe january 2012/2013
Source: Recycling International
300
325
350
375
400
425
450
410
405
420 420 420
320
370380
345
385
335
390
385
425 425 425
330365
340
380
320
385
390
380
JAN FEB MAR APR MAY JUN JUL AUG SEP OCT NOV DEC JAN
USA Export Prices (US$/GRT)HMS 1, heavy steel scrap (1/4 inch)
Source: Recycling InternationalHighest price Lowest price
FOB East Coast price FOB West Coast price
300
325
350
375
400
425
450
425
420410
425415
350
365 365
335
370360
350
365
415430
420
355370
340
375365
360370370
JAN FEB MAR APR MAY JUN JUL AUG SEP OCT NOV DEC JAN
FOB Rotterdam Export Prices (US$/t)HMS 80/20 heavy steel scrap

GLossARy
BIR Bureau of International Recycling, Brussels, Belgium
BDG German Foundry Association, düsseldorf, Germany
CAMU China’s Association of Metalscrap Utilization, Beijing, China
DCUD turkish Iron and steel Producers Association, Ankara, turkey
EFR european Ferrous Recovery & Recycling Federation, Brussels, Belgium
EUROFER european Confederation of Iron and steel Industries, Brussels, Belgium
ISRI Institute of scrap Recycling Industries, Washington, UsA
MIDREX Midrex technologies Inc., Charlotte, UsA
Modern Casting Magazine for Foundries and diecasters, schaumburg, Illinois, UsA
Official Trade Statistics Prepared by WV stahl, düsseldorf, Germany
Recycling International International trade magazine, Arnhem, the netherlands
USGS U.s. Geological survey, Reston, UsA
worldsteel World steel Association, Brussels, Belgium
WV Stahl German steel Federation, düsseldorf, Germany

Bureau of International Recycling aisblAvenue Franklin Roosevelt 241050 BrusselsBelgium
T. +32 2 627 57 70F. +32 2 627 57 73
Des
ign
by


![World Steel in Figures WSIF2010[1]](https://img.pdfslide.us/doc/110x75/5477ba1bb4af9f4d108b497a/world-steel-in-figures-wsif20101.jpg)