Embed Size (px)
Citation preview
7/27/2019 Wipro, 1Q FY 2014
http://slidepdf.com/reader/full/wipro-1q-fy-2014 1/14
Please refer to important disclosures at the end of this report 1
(` cr) 1QFY14 4QFY13 % chg (qoq) 1QFY13 % chg (yoy)
Net revenue 9,735 9,643 0.9 9,284 4.8
EBITDA 2,020 2,122 (4.8) 2,019 0.1
EBITDA margin (%) 20.8 22.0 (125)bp 21.7 (99)bp
PAT 1,632 1,606 1.6 1,457 12.0
Source: Company, Angel Research
For 1QFY2014, Wipro’s results were broadly in line with our estimates except in
terms of USD revenue. The IT services revenue came in at US$1,588mn, up just
0.2% qoq vs our expectation of ~1.0% qoq growth; though in constant currency
terms revenues grew by 1.2%. Going forward, for 2QFY2014, the Management
has given a USD revenue guidance of US$1,620mn-1,640mn, which translatesinto a qoq growth of 2-4%, which is above our expectation of 1.5-3.0% qoq
growth. We believe that the restructuring initiatives have not yet started showing
the expected results and will start reflecting in the financials of the company in
due course. We recommend an Accumulate rating on the stock.
Quarterly highlights: For 1QFY2014, Wipro’s consolidated revenues came in at
` 9,735cr, up 0.9% qoq. The company’s consolidated EBITDA margin declined by
125bp qoq to 20.8% while the EBIT margin grew by 49bp qoq to 18.2%. The IT
services segment’s EBIT margin was at 20.0%, down ~20bp qoq, impacted by
one month wage hikes given to employees (effective 1 June 2013). The PAT came
in line with our expectations at ` 1,632cr, up 1.6% qoq.
Outlook and valuation: For 2QFY2014, the Management has given a USDrevenue guidance of US$1,620mn-1,640mn, which translates into a qoq growth
of 2-4%. The Management remains confident of the revenue growth pick-up
sustaining, citing a pick-up in large deal closures and win rates, uptick in
discretionary spending, a strong business pipeline and momentum in demand
from the US sustaining. Though the deal pipeline has remained largely
unchanged over the past few months, deal closures and win ratios were on the
up, reflecting both an improving environment (leading to faster decision-making)
and execution (higher win ratios). We expect USD and INR revenue CAGR for IT
services to be at 7.2% and 10.7%, respectively over FY2013-15. We expect an
EBIT margin of 18.2% and 18.8% for FY2014 and FY2015, respectively. The stock
is currently trading at 13.5x FY2014E and 12.3x FY2015E EPS. We value the
stock at 14x FY2015E EPS of ` 31.2, which gives a target price of ` 435. Werecommend Accumulate rating on the stock.
Key financials (Consolidated, IFRS)Y/E March (` cr) FY2011 FY2012 FY2013 FY2014E FY2015E
Net sales 31,099 37,525 37,823 42,196 45,890
% chg 14.7 20.7 0.8 11.6 8.8
Net profit 5,297 5,573 6,130 6,991 7,705
% chg 15.3 5.2 10.0 14.1 10.2
EBITDA margin (%) 21.2 19.8 21.7 21.0 21.6
EPS (`) 21.7 22.7 24.8 28.3 31.2
P/E (x) 17.7 16.9 15.4 13.5 12.3
P/BV (x) 3.9 3.3 3.3 2.8 2.4
RoE (%) 22.0 19.5 21.5 20.7 19.4
RoCE (%) 15.5 14.7 15.9 15.3 15.1
EV/Sales (x) 2.7 2.2 2.1 1.8 1.5
EV/EBITDA (x) 12.9 11.4 9.6 8.4 6.8
Source: Company, Angel Research
ACCUMULATECMP ` 383
Target Price ` 435
Investment Period 12 Months
Stock Info
Sector
Net debt ( ` cr) (9,965)
Bloomberg Code
Shareholding Pattern (%)
Promoters 73.5
MF / Banks / Indian Fls 4.6
FII / NRIs / OCBs 7.3
Indian Public / Others 14.6
Abs. (%) 3m 1yr 3yr
Sensex 2.4 18.7 9.6
Wipro 16.0 16.0 (7.3)
Face Value ( ` )
BSE Sensex
Nifty
Reuters Code
93,920
0.6
418/290
163,184
IT
Avg. Daily Volume
Market Cap ( ` cr)
Beta
52 Week High / Low
2
19,748
5,886
WIPR.BO
WPRO@IN
Ankita Somani
+91 22-39357800 Ext: 6819
Wipro
Performance Highlights
1QFY2014 Result Update | IT
July 29, 2013
7/27/2019 Wipro, 1Q FY 2014
http://slidepdf.com/reader/full/wipro-1q-fy-2014 2/14
July 29, 2013 2
Wipro | 1QFY2014 Result Update
Exhibit 1: 1QFY2014 performance (Consolidated, IFRS)
Y/E March (` cr) 1QFY14 4QFY13 % chg (qoq) 1QFY13 % chg (yoy) FY2013 FY2012 % chg (yoy)
Net revenue 9,735 9,643 0.9 9,284 4.8 37,823 37,525 0.8
Cost of revenue 6,472 6,318 2.4 6,132 5.5 26,203 26,317 (0.4)
Gross profit 3,263 3,325 (1.9) 3,152 3.5 11,619 11,207 3.7
SG&A expense 1,243 1,204 3.3 1,133 9.7 4,635 4,806 (3.6)
EBITDA 2,020 2,122 (4.8) 2,019 0.1 8,222 7,414 10.9
Dep. and amortization 250 415 (39.8) 270 (7.5) 1,237 1,013 22.2
EBIT 1,770 1,706 3.7 1,749 1.2 6,984 6,401 9.1
Other inc., net of finance chgs. 287 328 133 990 574
PBT 2,057 2,044 0.6 1,871 9.9 7,974 6,975 14.3
Income tax 425 438 (2.9) 405 5.1 1,835 1,376 33.3
PAT 1,632 1,606 1.6 1,466 11.3 6,139 5,599 9.7
Minority interest - - 10 (100.0) 10 26 (62.1)
Adj. PAT 1,632 1,606 1.6 1,457 12.0 6,130 5,573 10.0
Diluted EPS (`) 6.6 6.5 1.6 5.9 12.0 24.8 22.7 9.3Gross margin (%) 33.5 34.5 (96)bp 34.0 (43)bp 30.7 29.9 85bp
EBITDA margin (%) 20.8 22.0 (125)bp 21.7 (99)bp 21.7 19.8 198bp
EBIT margin (%) 18.2 17.7 49bp 18.8 (65)bp 18.5 17.1 141bp
PAT margin (%) 19.7 20.1 (35)bp 15.8 391bp 18.8 16.4 244bp
Source: Company, Angel Research
Exhibit 2: 1QFY2014 – Actual vs Angel estimates
(` cr) Actual Estimate Variation (%)
Net revenue 9,735 10,186 (4.4)
EBITDA margin (%) 20.8 21.1 (34)bp
PAT 1,632 1,633 (0.1) Source: Company, Angel Research
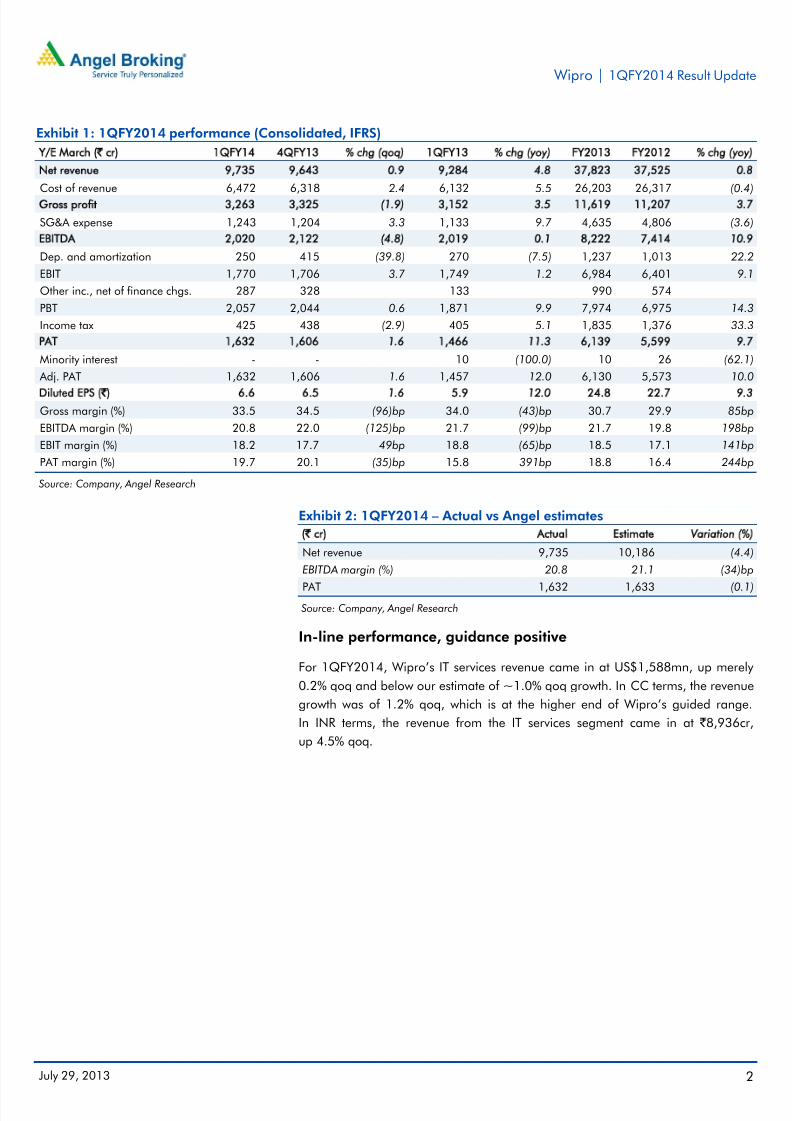
In-line performance, guidance positive
For 1QFY2014, Wipro’s IT services revenue came in at US$1,588mn, up merely
0.2% qoq and below our estimate of ~1.0% qoq growth. In CC terms, the revenue
growth was of 1.2% qoq, which is at the higher end of Wipro’s guided range.
In INR terms, the revenue from the IT services segment came in at ` 8,936cr,
up 4.5% qoq.
7/27/2019 Wipro, 1Q FY 2014
http://slidepdf.com/reader/full/wipro-1q-fy-2014 3/14
July 29, 2013 3
Wipro | 1QFY2014 Result Update
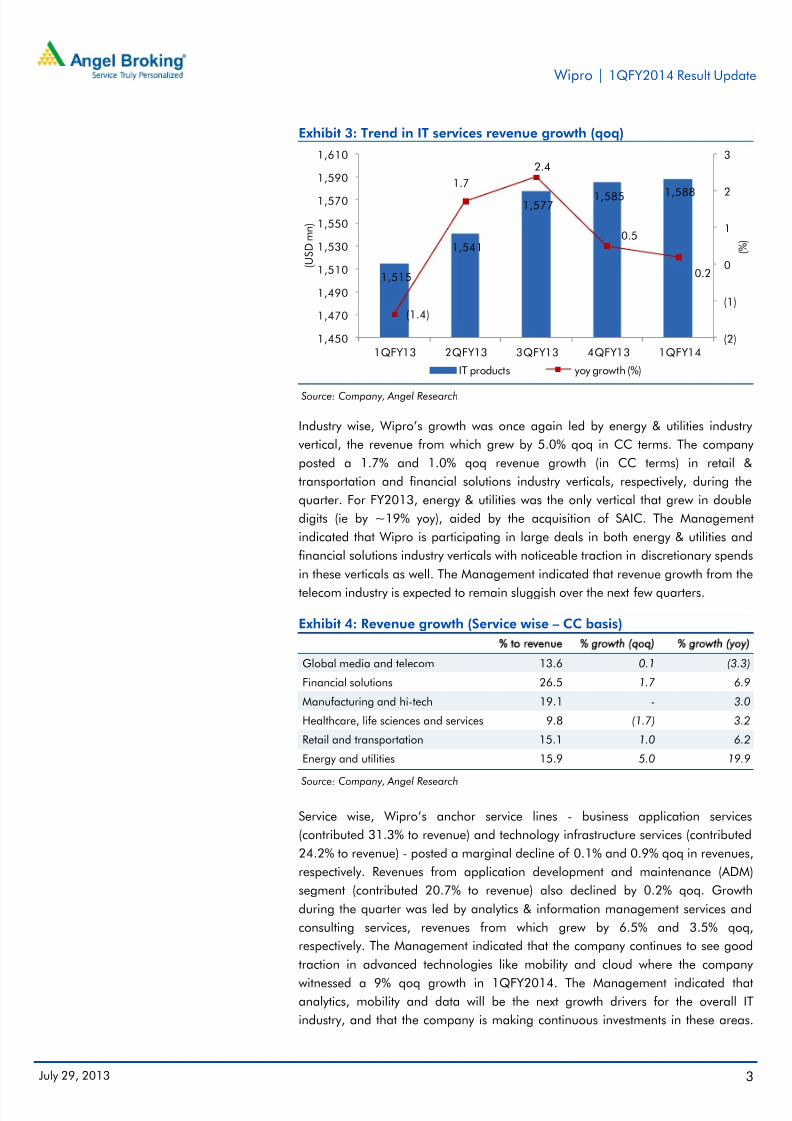
Exhibit 3: Trend in IT services revenue growth (qoq)
1,515
1,541
1,577 1,585 1,588
(1.4)
1.7
2.4
0.5
0.2
(2)
(1)
0
1
2
3
1,450
1,470
1,490
1,510
1,530
1,550
1,570
1,590
1,610
1QFY13 2QFY13 3QFY13 4QFY13 1QFY14
( % )
( U S D m n )
IT products yoy growth (%)
Source: Company, Angel Research
Industry wise, Wipro’s growth was once again led by energy & utilities industry
vertical, the revenue from which grew by 5.0% qoq in CC terms. The company
posted a 1.7% and 1.0% qoq revenue growth (in CC terms) in retail &
transportation and financial solutions industry verticals, respectively, during the
quarter. For FY2013, energy & utilities was the only vertical that grew in double
digits (ie by ~19% yoy), aided by the acquisition of SAIC. The Management
indicated that Wipro is participating in large deals in both energy & utilities and
financial solutions industry verticals with noticeable traction in discretionary spends
in these verticals as well. The Management indicated that revenue growth from the
telecom industry is expected to remain sluggish over the next few quarters.
Exhibit 4: Revenue growth (Service wise – CC basis)
% to revenue % growth (qoq) % growth (yoy)
Global media and telecom 13.6 0.1 (3.3)
Financial solutions 26.5 1.7 6.9
Manufacturing and hi-tech 19.1 - 3.0
Healthcare, life sciences and services 9.8 (1.7) 3.2
Retail and transportation 15.1 1.0 6.2
Energy and utilities 15.9 5.0 19.9
Source: Company, Angel Research
Service wise, Wipro’s anchor service lines - business application services
(contributed 31.3% to revenue) and technology infrastructure services (contributed
24.2% to revenue) - posted a marginal decline of 0.1% and 0.9% qoq in revenues,
respectively. Revenues from application development and maintenance (ADM)
segment (contributed 20.7% to revenue) also declined by 0.2% qoq. Growth
during the quarter was led by analytics & information management services and
consulting services, revenues from which grew by 6.5% and 3.5% qoq,
respectively. The Management indicated that the company continues to see good
traction in advanced technologies like mobility and cloud where the company
witnessed a 9% qoq growth in 1QFY2014. The Management indicated thatanalytics, mobility and data will be the next growth drivers for the overall IT
industry, and that the company is making continuous investments in these areas.
7/27/2019 Wipro, 1Q FY 2014
http://slidepdf.com/reader/full/wipro-1q-fy-2014 4/14
July 29, 2013 4
Wipro | 1QFY2014 Result Update
The company is seeing bottoming out of weakness in multiple segments, such as
the IMS business out of India, and product engineering.
Exhibit 5: Revenue growth (Service wise)
Service verticals % to revenue % growth (qoq) % growth (yoy)
Technology infrastructure services 24.2 (0.9) 11.3
Analytics and information management 7.5 6.5 10.6
Business application services 31.3 (0.1) 6.9
BPO 8.8 0.5 9.8
Product engineering and mobility 7.5 (0.2) (6.8)
ADM 20.7 (0.2) (3.8)
R&D business 10.2 (2.5) (11.5)
Consulting 2.5 3.5 6.0
Source: Company, Angel Research
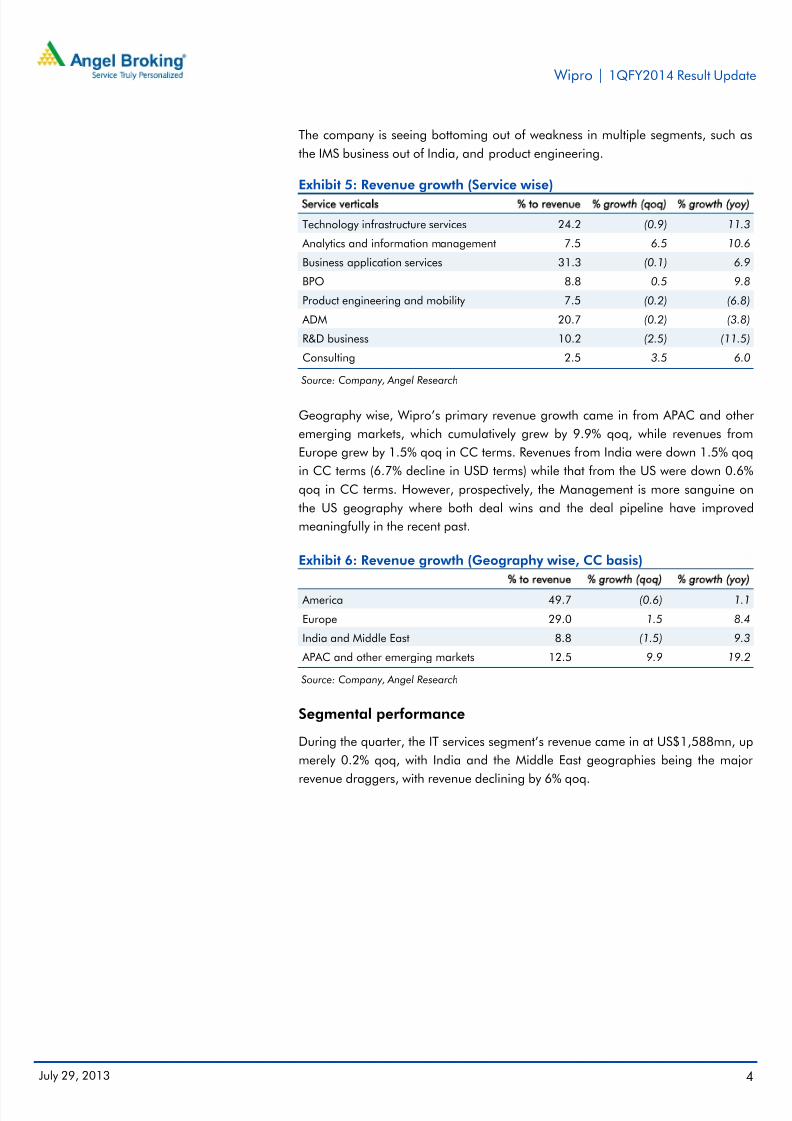
Geography wise, Wipro’s primary revenue growth came in from APAC and other
emerging markets, which cumulatively grew by 9.9% qoq, while revenues from
Europe grew by 1.5% qoq in CC terms. Revenues from India were down 1.5% qoq
in CC terms (6.7% decline in USD terms) while that from the US were down 0.6%
qoq in CC terms. However, prospectively, the Management is more sanguine on
the US geography where both deal wins and the deal pipeline have improved
meaningfully in the recent past.
Exhibit 6: Revenue growth (Geography wise, CC basis)
% to revenue % growth (qoq) % growth (yoy)
America 49.7 (0.6) 1.1
Europe 29.0 1.5 8.4
India and Middle East 8.8 (1.5) 9.3
APAC and other emerging markets 12.5 9.9 19.2
Source: Company, Angel Research
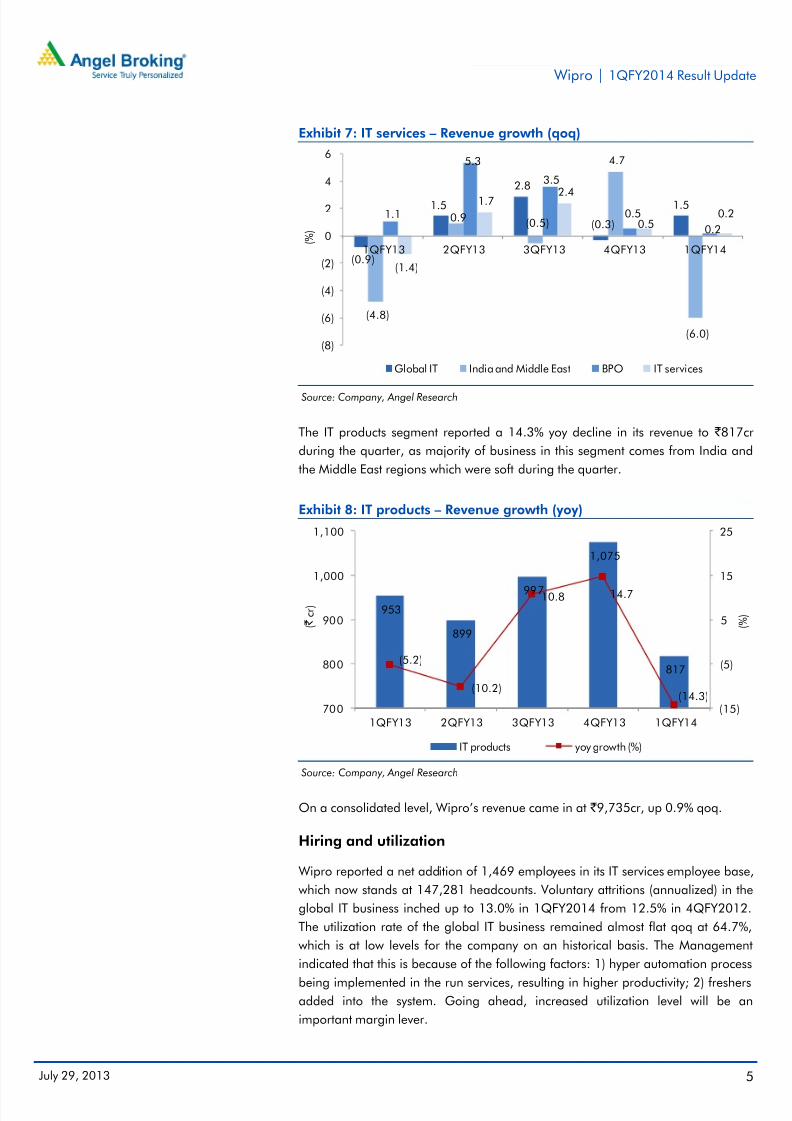
Segmental performance
During the quarter, the IT services segment’s revenue came in at US$1,588mn, up
merely 0.2% qoq, with India and the Middle East geographies being the major
revenue draggers, with revenue declining by 6% qoq.
7/27/2019 Wipro, 1Q FY 2014
http://slidepdf.com/reader/full/wipro-1q-fy-2014 5/14
July 29, 2013 5
Wipro | 1QFY2014 Result Update
Exhibit 7: IT services – Revenue growth (qoq)
(0.9)
1.5
2.8
(0.3)
1.5
(4.8)
0.9(0.5)
4.7
(6.0)
1.1
5.3
3.5
0.5
0.2
(1.4)
1.7 2.4
0.50.2
(8)
(6)
(4)
(2)
0
2
4
6
1QFY13 2QFY13 3QFY13 4QFY13 1QFY14 ( % )
Global IT India and Middle East BPO IT services
Source: Company, Angel Research
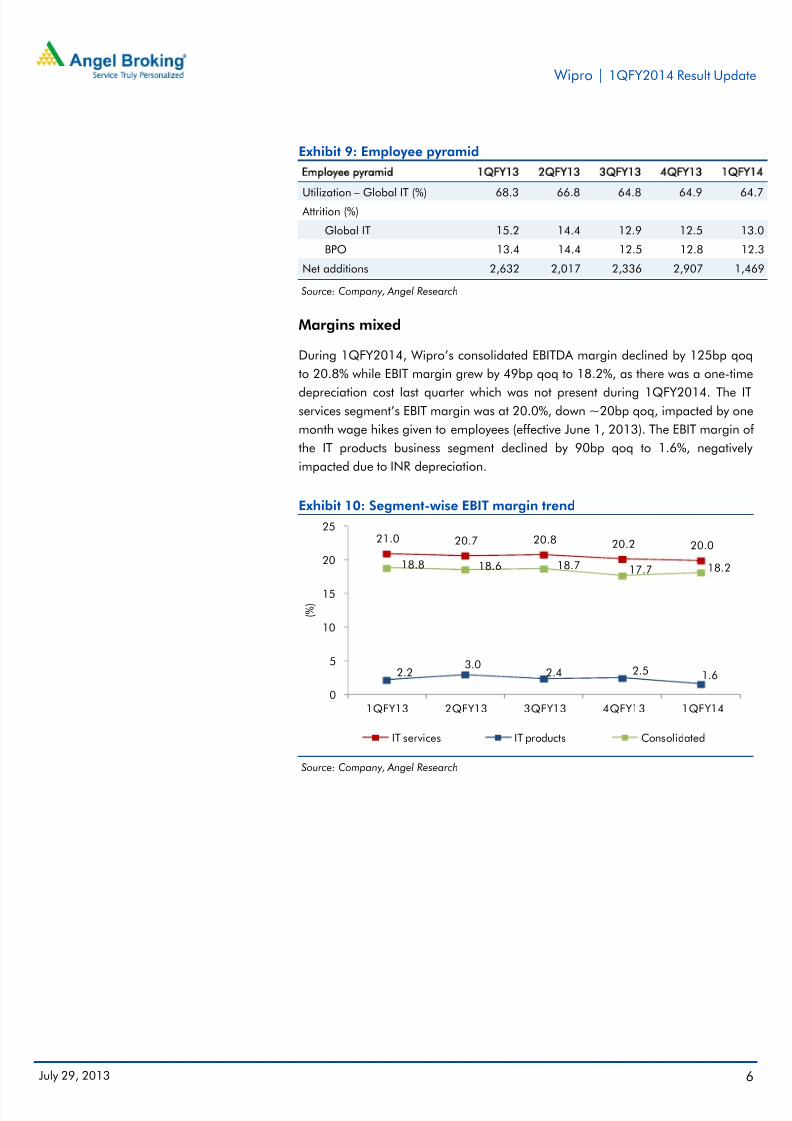
The IT products segment reported a 14.3% yoy decline in its revenue to ` 817cr
during the quarter, as majority of business in this segment comes from India and
the Middle East regions which were soft during the quarter.
Exhibit 8: IT products – Revenue growth (yoy)
953
899
997
1,075
817(5.2)
(10.2)
10.8 14.7
(14.3)(15)
(5)
5
15
25
700
800
900
1,000
1,100
1QFY13 2QFY13 3QFY13 4QFY13 1QFY14
( % )
( `
c r )
IT products yoy growth (%)
Source: Company, Angel Research
On a consolidated level, Wipro’s revenue came in at ` 9,735cr, up 0.9% qoq.
Hiring and utilization
Wipro reported a net addition of 1,469 employees in its IT services employee base,
which now stands at 147,281 headcounts. Voluntary attritions (annualized) in the
global IT business inched up to 13.0% in 1QFY2014 from 12.5% in 4QFY2012.
The utilization rate of the global IT business remained almost flat qoq at 64.7%,
which is at low levels for the company on an historical basis. The Management
indicated that this is because of the following factors: 1) hyper automation process
being implemented in the run services, resulting in higher productivity; 2) freshersadded into the system. Going ahead, increased utilization level will be an
important margin lever.
7/27/2019 Wipro, 1Q FY 2014
http://slidepdf.com/reader/full/wipro-1q-fy-2014 6/14
July 29, 2013 6
Wipro | 1QFY2014 Result Update
Exhibit 9: Employee pyramid
Employee pyramid 1QFY13 2QFY13 3QFY13 4QFY13 1QFY14
Utilization – Global IT (%) 68.3 66.8 64.8 64.9 64.7 Attrition (%)
Global IT 15.2 14.4 12.9 12.5 13.0
BPO 13.4 14.4 12.5 12.8 12.3
Net additions 2,632 2,017 2,336 2,907 1,469
Source: Company, Angel Research
Margins mixed
During 1QFY2014, Wipro’s consolidated EBITDA margin declined by 125bp qoq
to 20.8% while EBIT margin grew by 49bp qoq to 18.2%, as there was a one-time
depreciation cost last quarter which was not present during 1QFY2014. The ITservices segment’s EBIT margin was at 20.0%, down ~20bp qoq, impacted by one
month wage hikes given to employees (effective June 1, 2013). The EBIT margin of
the IT products business segment declined by 90bp qoq to 1.6%, negatively
impacted due to INR depreciation.
Exhibit 10: Segment-wise EBIT margin trend
21.0 20.7 20.8 20.2 20.0
2.23.0
2.4 2.5 1.6
18.8 18.6 18.7 17.7 18.2
0
5
10
15
20
25
1QFY13 2QFY13 3QFY13 4QFY13 1QFY14
( % )
IT services IT products Consolidated
Source: Company, Angel Research
7/27/2019 Wipro, 1Q FY 2014
http://slidepdf.com/reader/full/wipro-1q-fy-2014 7/14
July 29, 2013 7
Wipro | 1QFY2014 Result Update
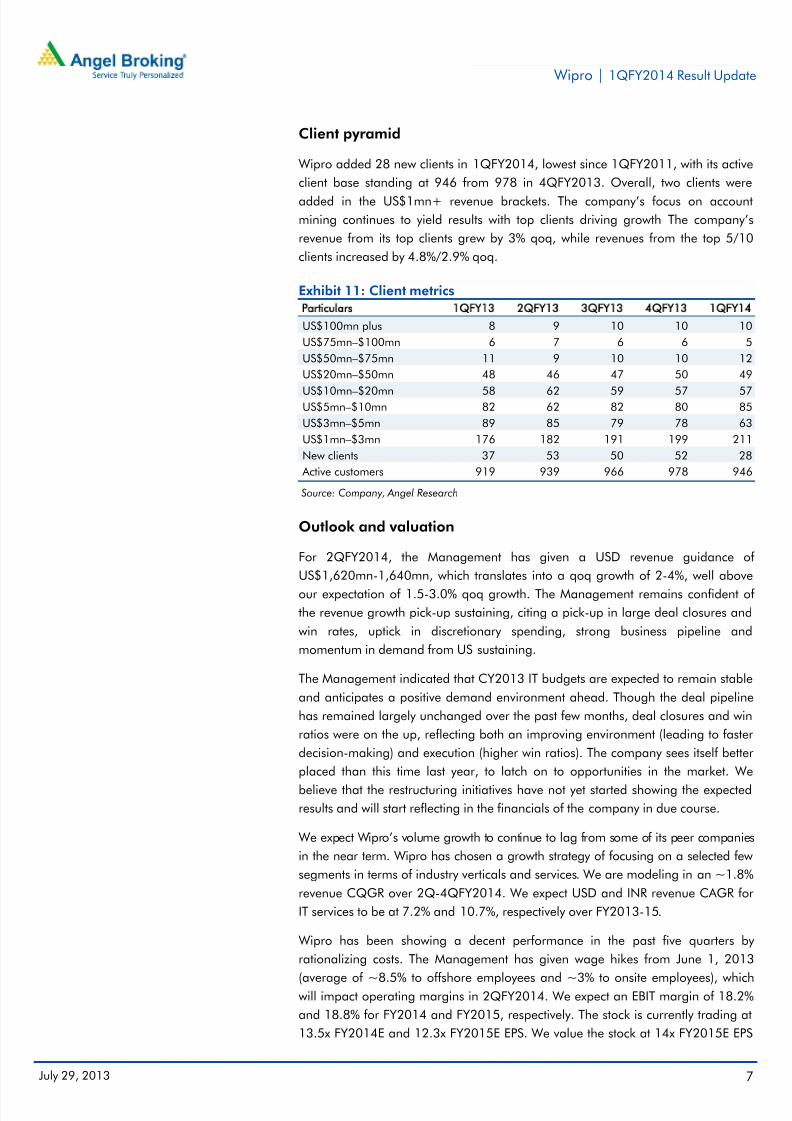
Client pyramid
Wipro added 28 new clients in 1QFY2014, lowest since 1QFY2011, with its active
client base standing at 946 from 978 in 4QFY2013. Overall, two clients were
added in the US$1mn+ revenue brackets. The company’s focus on account
mining continues to yield results with top clients driving growth The company’s
revenue from its top clients grew by 3% qoq, while revenues from the top 5/10
clients increased by 4.8%/2.9% qoq.
Exhibit 11: Client metrics
Particulars 1QFY13 2QFY13 3QFY13 4QFY13 1QFY14
US$100mn plus 8 9 10 10 10
US$75mn–$100mn 6 7 6 6 5
US$50mn–$75mn 11 9 10 10 12
US$20mn–$50mn 48 46 47 50 49
US$10mn–$20mn 58 62 59 57 57US$5mn–$10mn 82 62 82 80 85
US$3mn–$5mn 89 85 79 78 63
US$1mn–$3mn 176 182 191 199 211
New clients 37 53 50 52 28
Active customers 919 939 966 978 946
Source: Company, Angel Research
Outlook and valuation
For 2QFY2014, the Management has given a USD revenue guidance of
US$1,620mn-1,640mn, which translates into a qoq growth of 2-4%, well above
our expectation of 1.5-3.0% qoq growth. The Management remains confident of
the revenue growth pick-up sustaining, citing a pick-up in large deal closures and
win rates, uptick in discretionary spending, strong business pipeline and
momentum in demand from US sustaining.
The Management indicated that CY2013 IT budgets are expected to remain stable
and anticipates a positive demand environment ahead. Though the deal pipeline
has remained largely unchanged over the past few months, deal closures and win
ratios were on the up, reflecting both an improving environment (leading to faster
decision-making) and execution (higher win ratios). The company sees itself better
placed than this time last year, to latch on to opportunities in the market. We
believe that the restructuring initiatives have not yet started showing the expected
results and will start reflecting in the financials of the company in due course.
We expect Wipro’s volume growth to continue to lag from some of its peer companies
in the near term. Wipro has chosen a growth strategy of focusing on a selected few
segments in terms of industry verticals and services. We are modeling in an ~1.8%
revenue CQGR over 2Q-4QFY2014. We expect USD and INR revenue CAGR for
IT services to be at 7.2% and 10.7%, respectively over FY2013-15.
Wipro has been showing a decent performance in the past five quarters by
rationalizing costs. The Management has given wage hikes from June 1, 2013
(average of ~8.5% to offshore employees and ~3% to onsite employees), whichwill impact operating margins in 2QFY2014. We expect an EBIT margin of 18.2%
and 18.8% for FY2014 and FY2015, respectively. The stock is currently trading at
13.5x FY2014E and 12.3x FY2015E EPS. We value the stock at 14x FY2015E EPS
7/27/2019 Wipro, 1Q FY 2014
http://slidepdf.com/reader/full/wipro-1q-fy-2014 8/14
July 29, 2013 8
Wipro | 1QFY2014 Result Update
of ` 31.2, which is still at a reasonable discount to our target multiple for TCS. The
discounted valuation for Wipro vis-a-vis TCS is fair in our view given several years
of revenue underperformance at Wipro, while several quarters of sustained
performance will be required for Wipro to narrow the valuation multiples. Werecommend an Accumulate rating on the stock with a target price of `435.
Exhibit 12: Key assumptions
FY2014 FY2015
Revenue growth – IT services (USD) 6.0 8.5
USD-INR rate (realized) 57.9 58.0
Revenue growth – Consolidated ( ` ) 11.6 8.8
EBITDA margin (%) 21.0 21.6
Tax rate (%) 18.2 18.8
EPS growth (%) 14.1 10.2
Source: Company, Angel Research
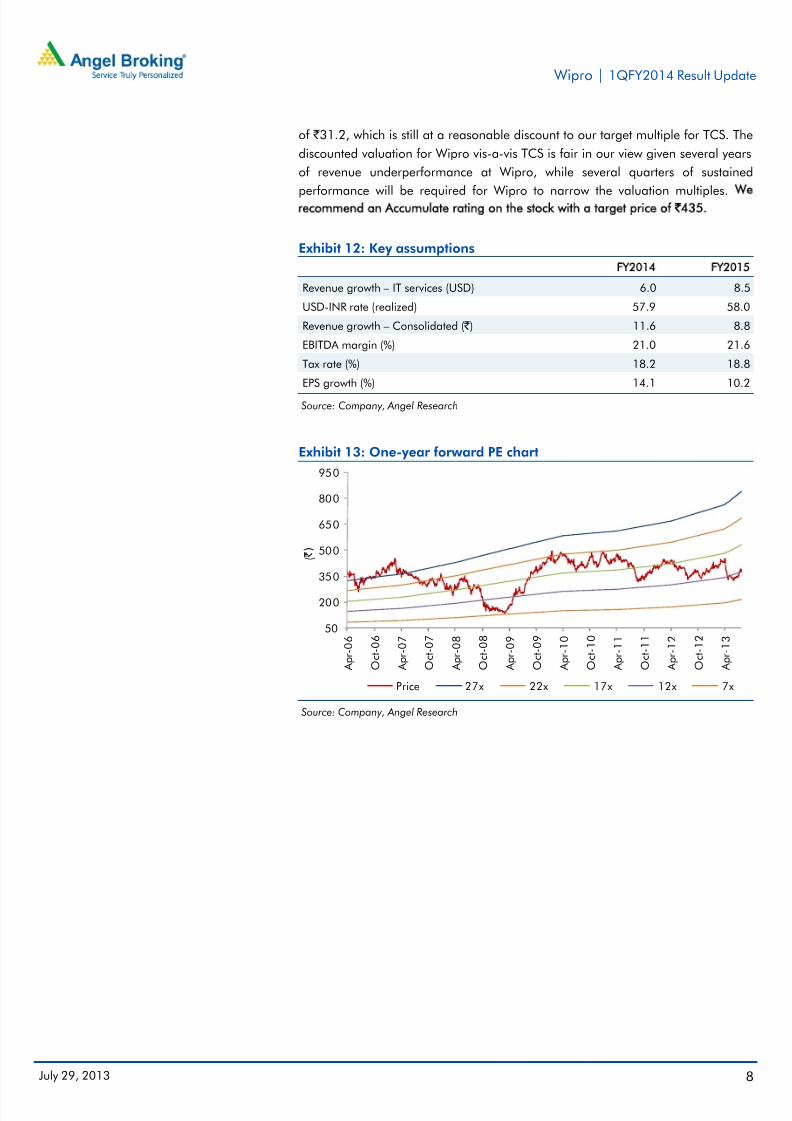
Exhibit 13: One-year forward PE chart
50
200
350
500
650
800
950
A p r - 0 6
O c t - 0 6
A p r - 0 7
O c t - 0 7
A p r - 0 8
O c t - 0 8
A p r - 0 9
O c t - 0 9
A p r - 1 0
O c t - 1 0
A p r - 1 1
O c t - 1 1
A p r - 1 2
O c t - 1 2
A p r - 1 3
( ` )
Price 27x 22x 17x 12x 7x
Source: Company, Angel Research
7/27/2019 Wipro, 1Q FY 2014
http://slidepdf.com/reader/full/wipro-1q-fy-2014 9/14
July 29, 2013 9
Wipro | 1QFY2014 Result Update
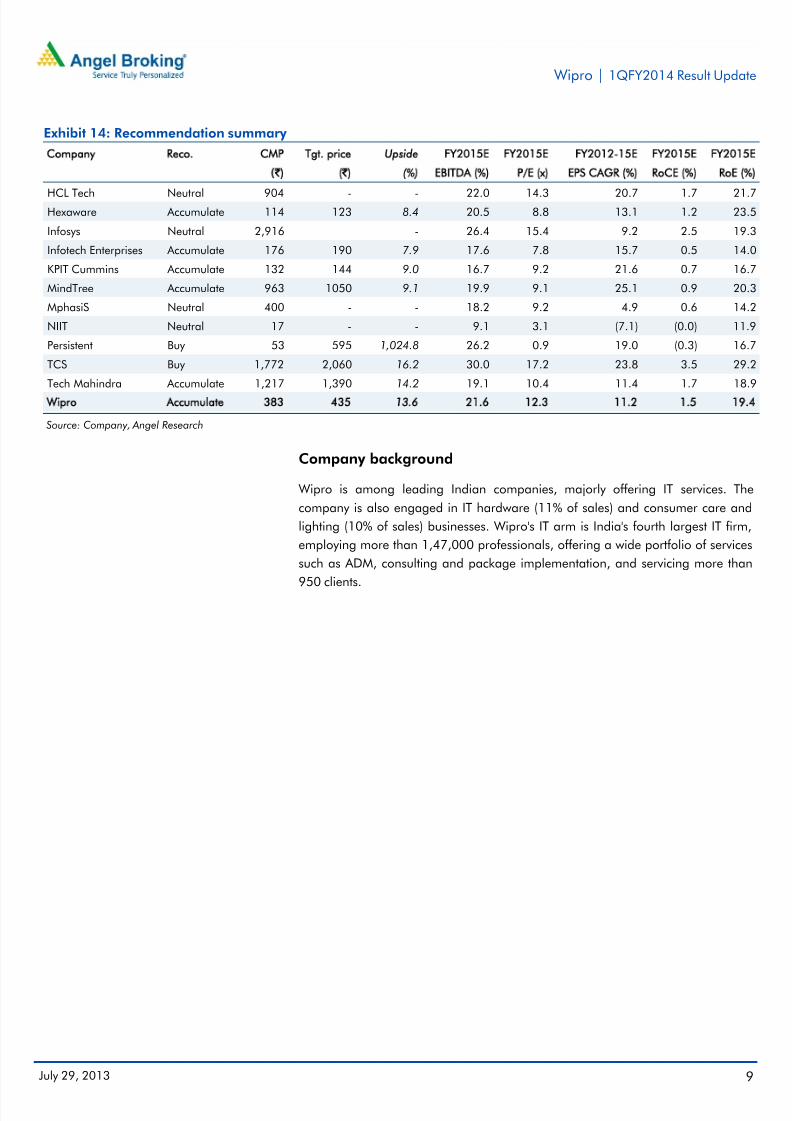
Exhibit 14: Recommendation summary
Company Reco. CMP Tgt. price Upside FY2015E FY2015E FY2012-15E FY2015E FY2015E
(`) (`) (%) EBITDA (%) P/E (x) EPS CAGR (%) RoCE (%) RoE (%)
HCL Tech Neutral 904 - - 22.0 14.3 20.7 1.7 21.7Hexaware Accumulate 114 123 8.4 20.5 8.8 13.1 1.2 23.5
Infosys Neutral 2,916 - 26.4 15.4 9.2 2.5 19.3
Infotech Enterprises Accumulate 176 190 7.9 17.6 7.8 15.7 0.5 14.0
KPIT Cummins Accumulate 132 144 9.0 16.7 9.2 21.6 0.7 16.7
MindTree Accumulate 963 1050 9.1 19.9 9.1 25.1 0.9 20.3
MphasiS Neutral 400 - - 18.2 9.2 4.9 0.6 14.2
NIIT Neutral 17 - - 9.1 3.1 (7.1) (0.0) 11.9
Persistent Buy 53 595 1,024.8 26.2 0.9 19.0 (0.3) 16.7
TCS Buy 1,772 2,060 16.2 30.0 17.2 23.8 3.5 29.2
Tech Mahindra Accumulate 1,217 1,390 14.2 19.1 10.4 11.4 1.7 18.9
Wipro Accumulate 383 435 13.6 21.6 12.3 11.2 1.5 19.4
Source: Company, Angel Research
Company background
Wipro is among leading Indian companies, majorly offering IT services. The
company is also engaged in IT hardware (11% of sales) and consumer care and
lighting (10% of sales) businesses. Wipro's IT arm is India's fourth largest IT firm,
employing more than 1,47,000 professionals, offering a wide portfolio of services
such as ADM, consulting and package implementation, and servicing more than
950 clients.
7/27/2019 Wipro, 1Q FY 2014
http://slidepdf.com/reader/full/wipro-1q-fy-2014 10/14
July 29, 2013 10
Wipro | 1QFY2014 Result Update
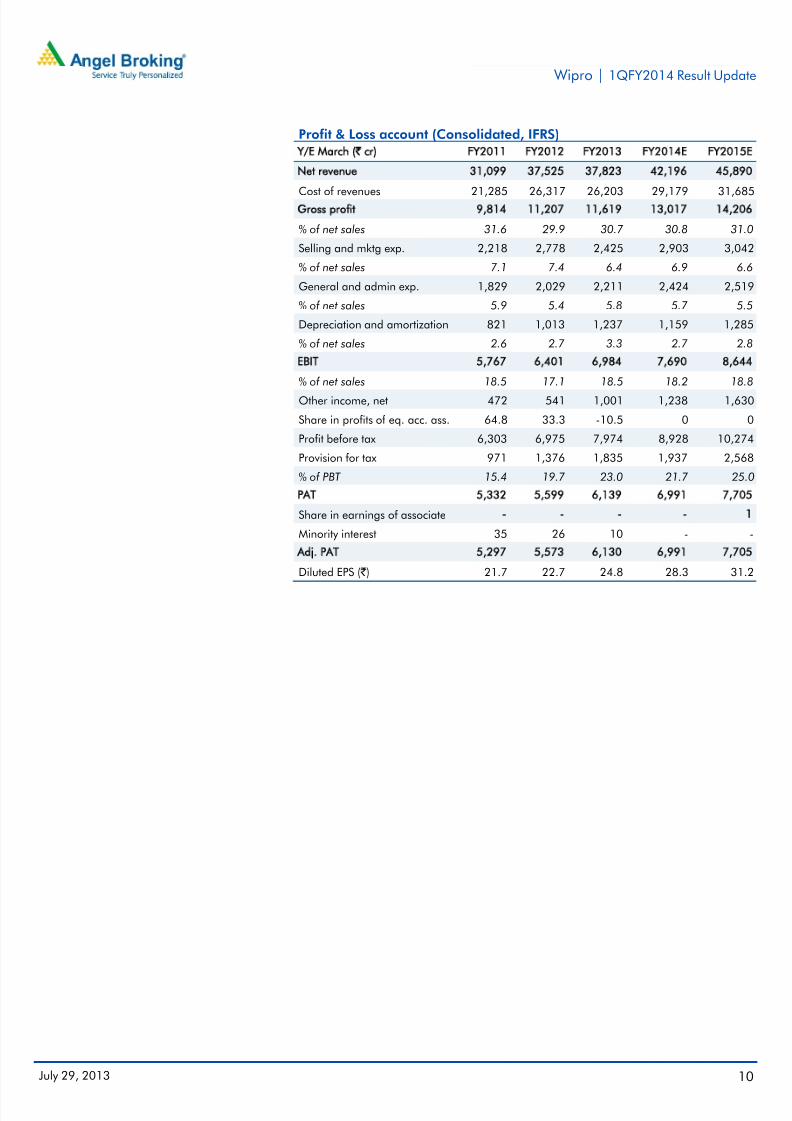
Profit & Loss account (Consolidated, IFRS)
Y/E March (` cr) FY2011 FY2012 FY2013 FY2014E FY2015E
Net revenue 31,099 37,525 37,823 42,196 45,890
Cost of revenues 21,285 26,317 26,203 29,179 31,685Gross profit 9,814 11,207 11,619 13,017 14,206
% of net sales 31.6 29.9 30.7 30.8 31.0
Selling and mktg exp. 2,218 2,778 2,425 2,903 3,042
% of net sales 7.1 7.4 6.4 6.9 6.6
General and admin exp. 1,829 2,029 2,211 2,424 2,519
% of net sales 5.9 5.4 5.8 5.7 5.5
Depreciation and amortization 821 1,013 1,237 1,159 1,285
% of net sales 2.6 2.7 3.3 2.7 2.8
EBIT 5,767 6,401 6,984 7,690 8,644
% of net sales 18.5 17.1 18.5 18.2 18.8
Other income, net 472 541 1,001 1,238 1,630
Share in profits of eq. acc. ass. 64.8 33.3 -10.5 0 0
Profit before tax 6,303 6,975 7,974 8,928 10,274
Provision for tax 971 1,376 1,835 1,937 2,568
% of PBT 15.4 19.7 23.0 21.7 25.0
PAT 5,332 5,599 6,139 6,991 7,705
Share in earnings of associate - - - - 1
Minority interest 35 26 10 - -
Adj. PAT 5,297 5,573 6,130 6,991 7,705
Diluted EPS ( ` ) 21.7 22.7 24.8 28.3 31.2
7/27/2019 Wipro, 1Q FY 2014
http://slidepdf.com/reader/full/wipro-1q-fy-2014 11/14
July 29, 2013 11
Wipro | 1QFY2014 Result Update
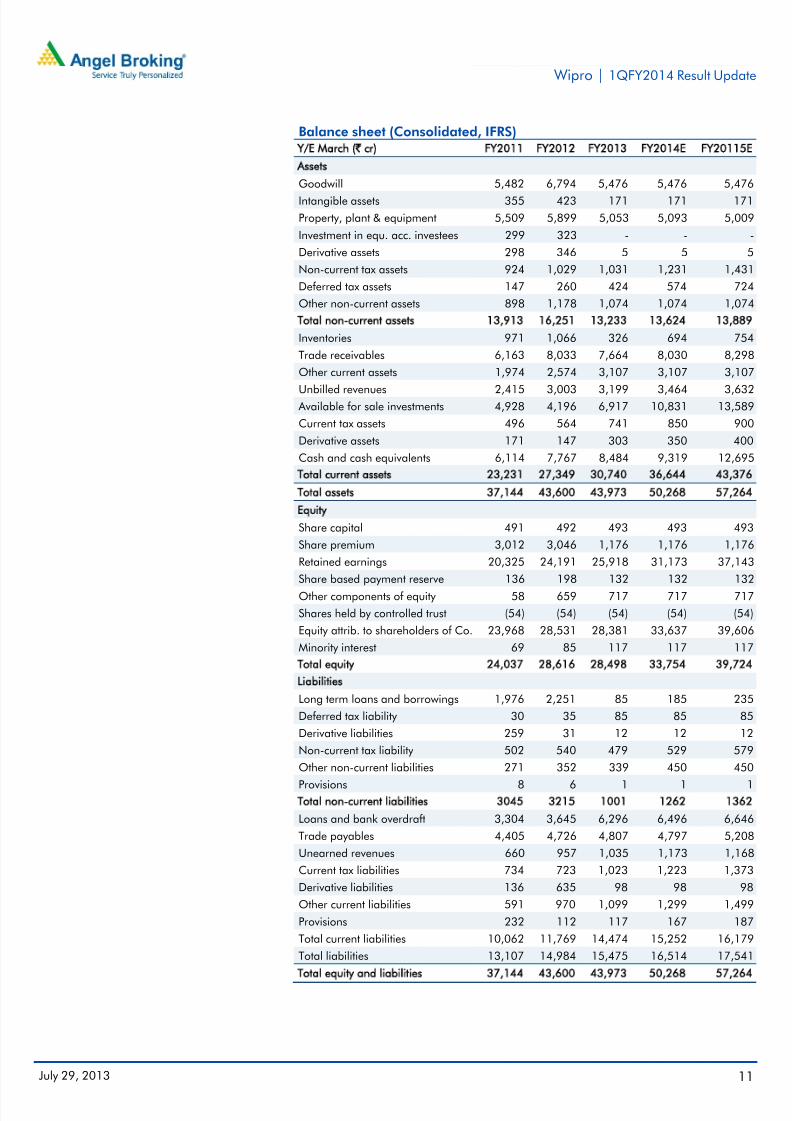
Balance sheet (Consolidated, IFRS)
Y/E March (` cr) FY2011 FY2012 FY2013 FY2014E FY20115E
Assets
Goodwill 5,482 6,794 5,476 5,476 5,476
Intangible assets 355 423 171 171 171
Property, plant & equipment 5,509 5,899 5,053 5,093 5,009
Investment in equ. acc. investees 299 323 - - -
Derivative assets 298 346 5 5 5
Non-current tax assets 924 1,029 1,031 1,231 1,431
Deferred tax assets 147 260 424 574 724
Other non-current assets 898 1,178 1,074 1,074 1,074
Total non-current assets 13,913 16,251 13,233 13,624 13,889
Inventories 971 1,066 326 694 754
Trade receivables 6,163 8,033 7,664 8,030 8,298
Other current assets 1,974 2,574 3,107 3,107 3,107
Unbilled revenues 2,415 3,003 3,199 3,464 3,632 Available for sale investments 4,928 4,196 6,917 10,831 13,589
Current tax assets 496 564 741 850 900
Derivative assets 171 147 303 350 400
Cash and cash equivalents 6,114 7,767 8,484 9,319 12,695
Total current assets 23,231 27,349 30,740 36,644 43,376
Total assets 37,144 43,600 43,973 50,268 57,264
Equity
Share capital 491 492 493 493 493
Share premium 3,012 3,046 1,176 1,176 1,176
Retained earnings 20,325 24,191 25,918 31,173 37,143
Share based payment reserve 136 198 132 132 132
Other components of equity 58 659 717 717 717
Shares held by controlled trust (54) (54) (54) (54) (54)
Equity attrib. to shareholders of Co. 23,968 28,531 28,381 33,637 39,606
Minority interest 69 85 117 117 117
Total equity 24,037 28,616 28,498 33,754 39,724
Liabilities
Long term loans and borrowings 1,976 2,251 85 185 235
Deferred tax liability 30 35 85 85 85
Derivative liabilities 259 31 12 12 12
Non-current tax liability 502 540 479 529 579
Other non-current liabilities 271 352 339 450 450
Provisions 8 6 1 1 1Total non-current liabilities 3045 3215 1001 1262 1362
Loans and bank overdraft 3,304 3,645 6,296 6,496 6,646
Trade payables 4,405 4,726 4,807 4,797 5,208
Unearned revenues 660 957 1,035 1,173 1,168
Current tax liabilities 734 723 1,023 1,223 1,373
Derivative liabilities 136 635 98 98 98
Other current liabilities 591 970 1,099 1,299 1,499
Provisions 232 112 117 167 187
Total current liabilities 10,062 11,769 14,474 15,252 16,179
Total liabilities 13,107 14,984 15,475 16,514 17,541
Total equity and liabilities 37,144 43,600 43,973 50,268 57,264
7/27/2019 Wipro, 1Q FY 2014
http://slidepdf.com/reader/full/wipro-1q-fy-2014 12/14
July 29, 2013 12
Wipro | 1QFY2014 Result Update
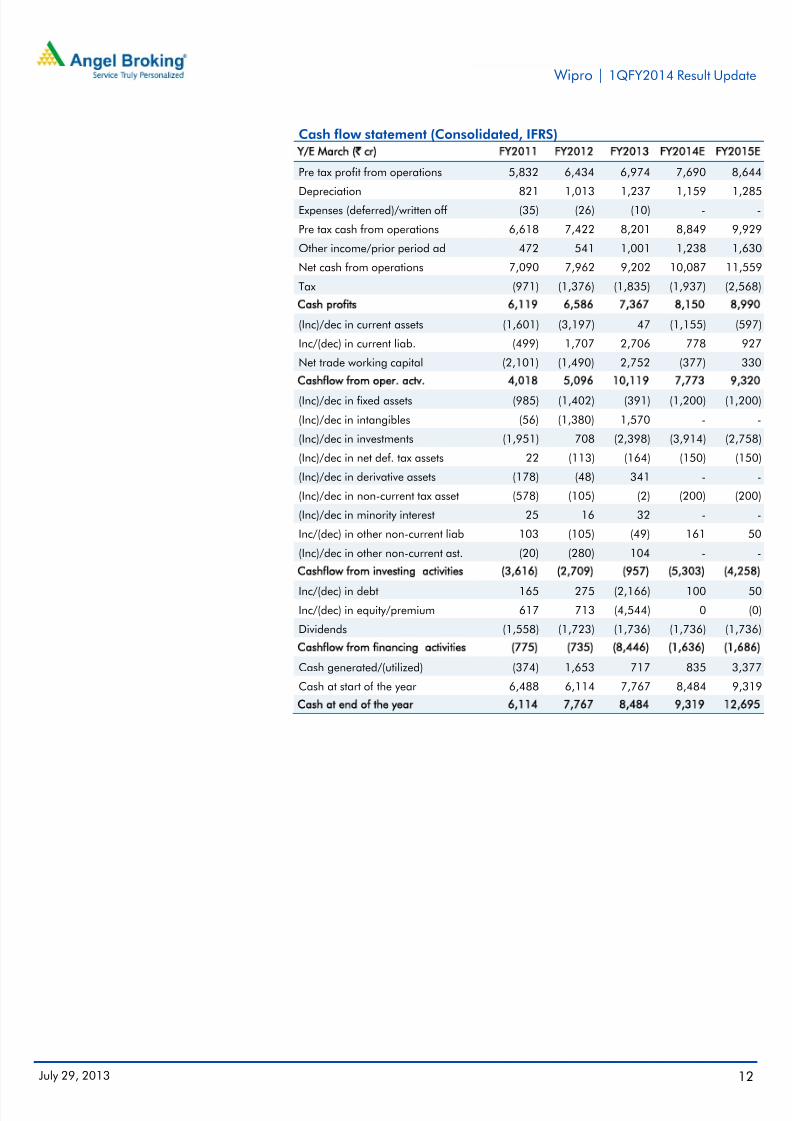
Cash flow statement (Consolidated, IFRS)
Y/E March (` cr) FY2011 FY2012 FY2013 FY2014E FY2015E
Pre tax profit from operations 5,832 6,434 6,974 7,690 8,644
Depreciation 821 1,013 1,237 1,159 1,285Expenses (deferred)/written off (35) (26) (10) - -
Pre tax cash from operations 6,618 7,422 8,201 8,849 9,929
Other income/prior period ad 472 541 1,001 1,238 1,630
Net cash from operations 7,090 7,962 9,202 10,087 11,559
Tax (971) (1,376) (1,835) (1,937) (2,568)
Cash profits 6,119 6,586 7,367 8,150 8,990
(Inc)/dec in current assets (1,601) (3,197) 47 (1,155) (597)
Inc/(dec) in current liab. (499) 1,707 2,706 778 927
Net trade working capital (2,101) (1,490) 2,752 (377) 330
Cashflow from oper. actv. 4,018 5,096 10,119 7,773 9,320
(Inc)/dec in fixed assets (985) (1,402) (391) (1,200) (1,200)
(Inc)/dec in intangibles (56) (1,380) 1,570 - -
(Inc)/dec in investments (1,951) 708 (2,398) (3,914) (2,758)
(Inc)/dec in net def. tax assets 22 (113) (164) (150) (150)
(Inc)/dec in derivative assets (178) (48) 341 - -
(Inc)/dec in non-current tax asset (578) (105) (2) (200) (200)
(Inc)/dec in minority interest 25 16 32 - -
Inc/(dec) in other non-current liab 103 (105) (49) 161 50
(Inc)/dec in other non-current ast. (20) (280) 104 - -
Cashflow from investing activities (3,616) (2,709) (957) (5,303) (4,258)
Inc/(dec) in debt 165 275 (2,166) 100 50
Inc/(dec) in equity/premium 617 713 (4,544) 0 (0)
Dividends (1,558) (1,723) (1,736) (1,736) (1,736)
Cashflow from financing activities (775) (735) (8,446) (1,636) (1,686)
Cash generated/(utilized) (374) 1,653 717 835 3,377
Cash at start of the year 6,488 6,114 7,767 8,484 9,319
Cash at end of the year 6,114 7,767 8,484 9,319 12,695
7/27/2019 Wipro, 1Q FY 2014
http://slidepdf.com/reader/full/wipro-1q-fy-2014 13/14
July 29, 2013 13
Wipro | 1QFY2014 Result Update
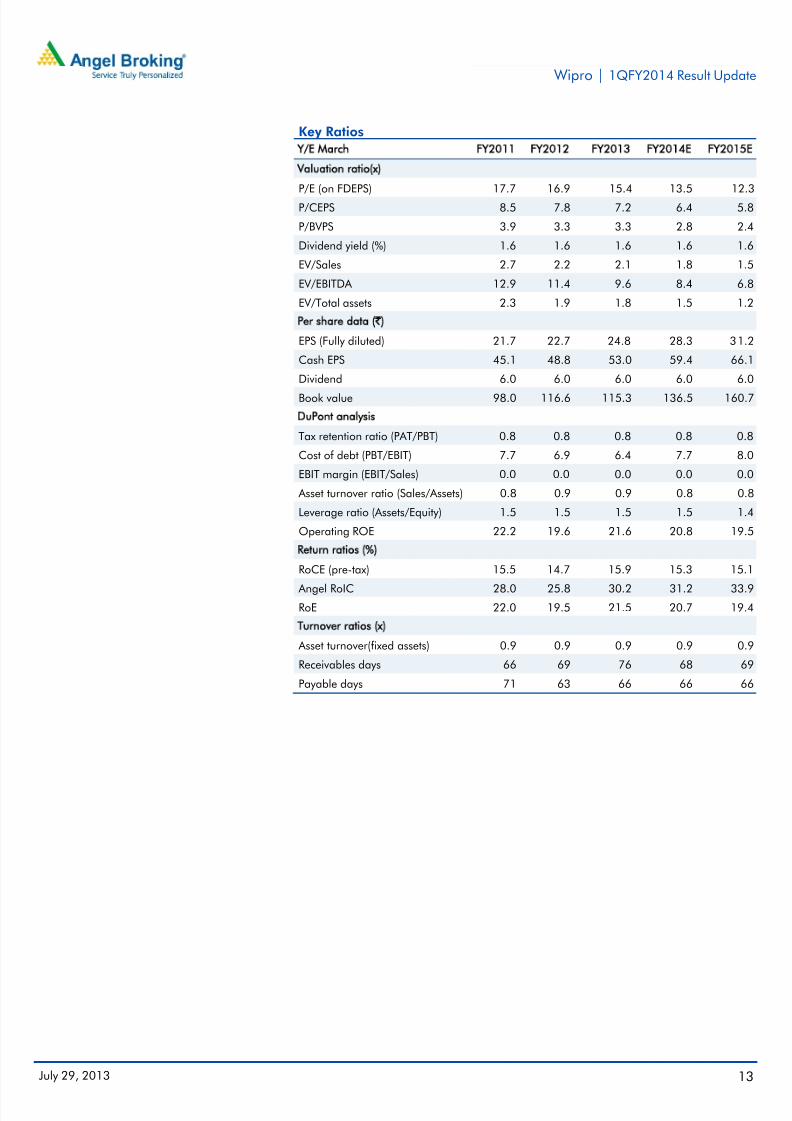
Key Ratios
Y/E March FY2011 FY2012 FY2013 FY2014E FY2015E
Valuation ratio(x)
P/E (on FDEPS) 17.7 16.9 15.4 13.5 12.3
P/CEPS 8.5 7.8 7.2 6.4 5.8
P/BVPS 3.9 3.3 3.3 2.8 2.4
Dividend yield (%) 1.6 1.6 1.6 1.6 1.6
EV/Sales 2.7 2.2 2.1 1.8 1.5
EV/EBITDA 12.9 11.4 9.6 8.4 6.8
EV/Total assets 2.3 1.9 1.8 1.5 1.2
Per share data (`)
EPS (Fully diluted) 21.7 22.7 24.8 28.3 31.2
Cash EPS 45.1 48.8 53.0 59.4 66.1
Dividend 6.0 6.0 6.0 6.0 6.0
Book value 98.0 116.6 115.3 136.5 160.7
DuPont analysis
Tax retention ratio (PAT/PBT) 0.8 0.8 0.8 0.8 0.8
Cost of debt (PBT/EBIT) 7.7 6.9 6.4 7.7 8.0
EBIT margin (EBIT/Sales) 0.0 0.0 0.0 0.0 0.0
Asset turnover ratio (Sales/Assets) 0.8 0.9 0.9 0.8 0.8
Leverage ratio (Assets/Equity) 1.5 1.5 1.5 1.5 1.4
Operating ROE 22.2 19.6 21.6 20.8 19.5
Return ratios (%)
RoCE (pre-tax) 15.5 14.7 15.9 15.3 15.1
Angel RoIC 28.0 25.8 30.2 31.2 33.9RoE 22.0 19.5 21.5 20.7 19.4
Turnover ratios (x)
Asset turnover(fixed assets) 0.9 0.9 0.9 0.9 0.9
Receivables days 66 69 76 68 69
Payable days 71 63 66 66 66
7/27/2019 Wipro, 1Q FY 2014
http://slidepdf.com/reader/full/wipro-1q-fy-2014 14/14
Wipro | 1QFY2014 Result Update
Research Team Tel: 022 - 3935 7800 E-mail: [email protected] Website: www.angelbroking.com
DISCLAIMER
This document is solely for the personal information of the recipient, and must not be singularly used as the basis of any investment
decision. Nothing in this document should be construed as investment or financial advice. Each recipient of this document should make
such investigations as they deem necessary to arrive at an independent evaluation of an investment in the securities of the companies
referred to in this document (including the merits and risks involved), and should consult their own advisors to determine the merits and
risks of such an investment.
Angel Broking Pvt. Ltd., its affiliates, directors, its proprietary trading and investment businesses may, from time to time, make
investment decisions that are inconsistent with or contradictory to the recommendations expressed herein. The views contained in this
document are those of the analyst, and the company may or may not subscribe to all the views expressed within.
Reports based on technical and derivative analysis center on studying charts of a stock's price movement, outstanding positions and
trading volume, as opposed to focusing on a company's fundamentals and, as such, may not match with a report on a company's
fundamentals.
The information in this document has been printed on the basis of publicly available information, internal data and other reliablesources believed to be true, but we do not represent that it is accurate or complete and it should not be relied on as such, as thisdocument is for general guidance only. Angel Broking Pvt. Ltd. or any of its affiliates/ group companies shall not be in any way responsible for any loss or damage that may arise to any person from any inadvertent error in the information contained in this report .
Angel Broking Pvt. Ltd. has not independently verified all the information contained within this document. Accordingly, we cannottestify, nor make any representation or warranty, express or implied, to the accuracy, contents or data contained within this document. While Angel Broking Pvt. Ltd. endeavours to update on a reasonable basis the information discussed in this material, there may beregulatory, compliance, or other reasons that prevent us from doing so.
This document is being supplied to you solely for your information, and its contents, information or data may not be reproduced,
redistributed or passed on, directly or indirectly.
Angel Broking Pvt. Ltd. and its affiliates may seek to provide or have engaged in providing corporate finance, investment banking or
other advisory services in a merger or specific transaction to the companies referred to in this report, as on the date of this report or in
the past.
Neither Angel Broking Pvt. Ltd., nor its directors, employees or affiliates shall be liable for any loss or damage that may arise from or in
connection with the use of this information.
Note: Please refer to the important `Stock Holding Disclosure' report on the Angel website (Research Section). Also, please refer to thelatest update on respective stocks for the disclosure status in respect of those stocks. Angel Broking Pvt. Ltd. and its affiliates may haveinvestment positions in the stocks recommended in this report.
Disclosure of Interest Statement Wipro
1. Analyst ownership of the stock No
2. Angel and its Group companies ownership of the stock No
3. Angel and its Group companies' Directors ownership of the stock No
4. Broking relationship with company covered No
Ratings (Returns): Buy (> 15%) Accumulate (5% to 15%) Neutral (-5 to 5%)Reduce (-5% to -15%) Sell (< -15%)
Note: We have not considered any Exposure below ` 1 lakh for Angel, its Group companies and Directors