Embed Size (px)
Citation preview
7/27/2019 GAIL India, 1Q FY 2014
http://slidepdf.com/reader/full/gail-india-1q-fy-2014 1/12
Please refer to important disclosures at the end of this report 1
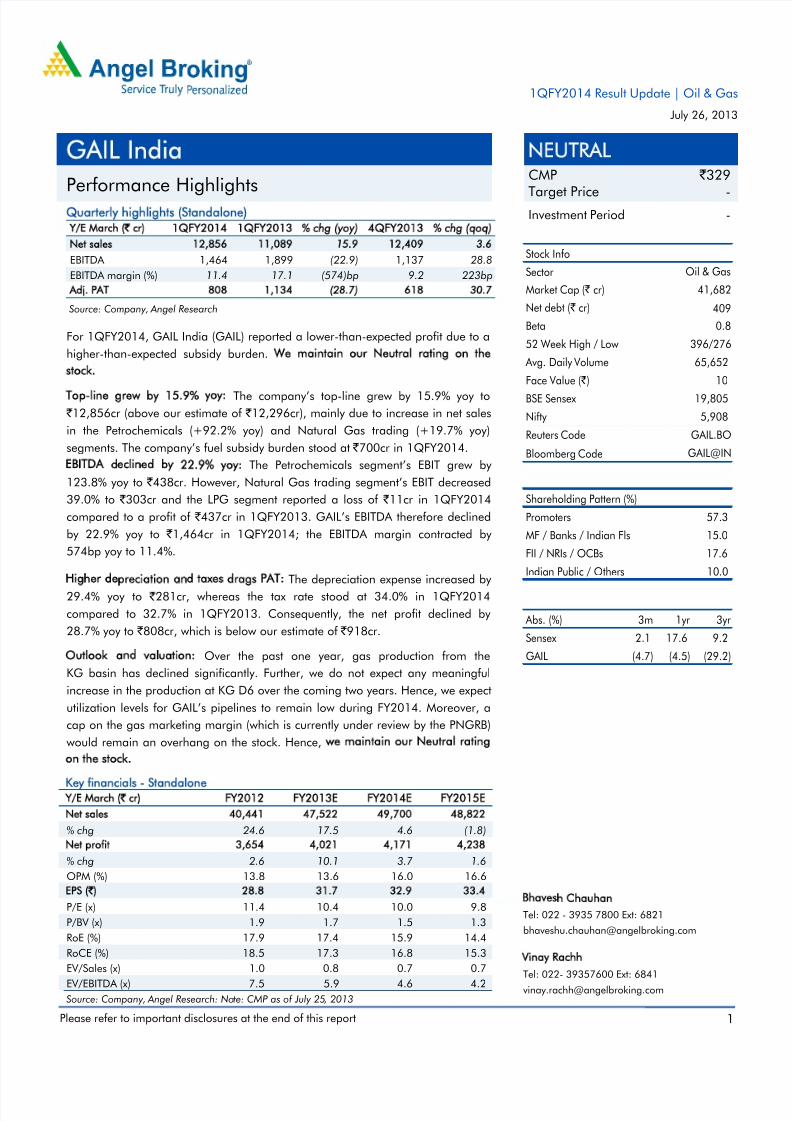
Quarterly highlights (Standalone)Y/E March (` cr) 1QFY2014 1QFY2013 % chg (yoy) 4QFY2013 % chg (qoq)
Net sales 12,856 11,089 15.9 12,409 3.6
EBITDA 1,464 1,899 (22.9) 1,137 28.8
EBITDA margin (%) 11.4 17.1 (574)bp 9.2 223bp
Adj. PAT 808 1,134 (28.7) 618 30.7
Source: Company, Angel Research
For 1QFY2014, GAIL India (GAIL) reported a lower-than-expected profit due to a
higher-than-expected subsidy burden. We maintain our Neutral rating on the
stock.
Top-line grew by 15.9% yoy: The company’s top-line grew by 15.9% yoy to
` 12,856cr (above our estimate of ` 12,296cr), mainly due to increase in net sales
in the Petrochemicals (+92.2% yoy) and Natural Gas trading (+19.7% yoy)
segments. The company’s fuel subsidy burden stood at ` 700cr in 1QFY2014.
EBITDA declined by 22.9% yoy: The Petrochemicals segment’s EBIT grew by
123.8% yoy to ` 438cr. However, Natural Gas trading segment’s EBIT decreased
39.0% to ` 303cr and the LPG segment reported a loss of ` 11cr in 1QFY2014
compared to a profit of ` 437cr in 1QFY2013. GAIL’s EBITDA therefore declined
by 22.9% yoy to ` 1,464cr in 1QFY2014; the EBITDA margin contracted by
574bp yoy to 11.4%.
Higher depreciation and taxes drags PAT: The depreciation expense increased by
29.4% yoy to ` 281cr, whereas the tax rate stood at 34.0% in 1QFY2014
compared to 32.7% in 1QFY2013. Consequently, the net profit declined by
28.7% yoy to ` 808cr, which is below our estimate of ` 918cr.
Outlook and valuation: Over the past one year, gas production from the
KG basin has declined significantly. Further, we do not expect any meaningful
increase in the production at KG D6 over the coming two years. Hence, we expect
utilization levels for GAIL’s pipelines to remain low during FY2014. Moreover, a
cap on the gas marketing margin (which is currently under review by the PNGRB)
would remain an overhang on the stock. Hence, we maintain our Neutral ratingon the stock.
Key financials - Standalone
Y/E March (` cr) FY2012 FY2013E FY2014E FY2015E
Net sales 40,441 47,522 49,700 48,822
% chg 24.6 17.5 4.6 (1.8)
Net profit 3,654 4,021 4,171 4,238
% chg 2.6 10.1 3.7 1.6
OPM (%) 13.8 13.6 16.0 16.6
EPS (`) 28.8 31.7 32.9 33.4
P/E (x) 11.4 10.4 10.0 9.8
P/BV (x) 1.9 1.7 1.5 1.3
RoE (%) 17.9 17.4 15.9 14.4
RoCE (%) 18.5 17.3 16.8 15.3
EV/Sales (x) 1.0 0.8 0.7 0.7
EV/EBITDA (x) 7.5 5.9 4.6 4.2
Source: Company, Angel Research: Note: CMP as of July 25, 2013
NEUTRALCMP ` 329
Target Price -
Investment Period -
Stock Info
Sector
409
Bloomberg Code
Shareholding Pattern (%)
Promoters 57.3
MF / Banks / Indian Fls 15.0
FII / NRIs / OCBs 17.6 Indian Public / Others 10.0
Abs. (%) 3m 1yr 3yr
Sensex 2.1 17.6 9.2
GAIL (4.7) (4.5) (29.2)
10
19,805
5,908
GAIL.BO
GAIL@IN
Beta
Face Value ( ` )
BSE Sensex
Nifty
Reuters Code
41,682
396/276
65,652
0.8
Oil & Gas
Avg. Daily Volume
Market Cap ( ` cr)
52 Week High / Low
Net debt ( ` cr)
Bhavesh Chauhan
Tel: 022 - 3935 7800 Ext: 6821
Vinay Rachh
Tel: 022- 39357600 Ext: 6841
GAIL India
Performance Highlights
1QFY2014 Result Update | Oil & Gas
July 26, 2013
7/27/2019 GAIL India, 1Q FY 2014
http://slidepdf.com/reader/full/gail-india-1q-fy-2014 2/12
GAIL | 1QFY2014 Result Update
July 26, 2013 2
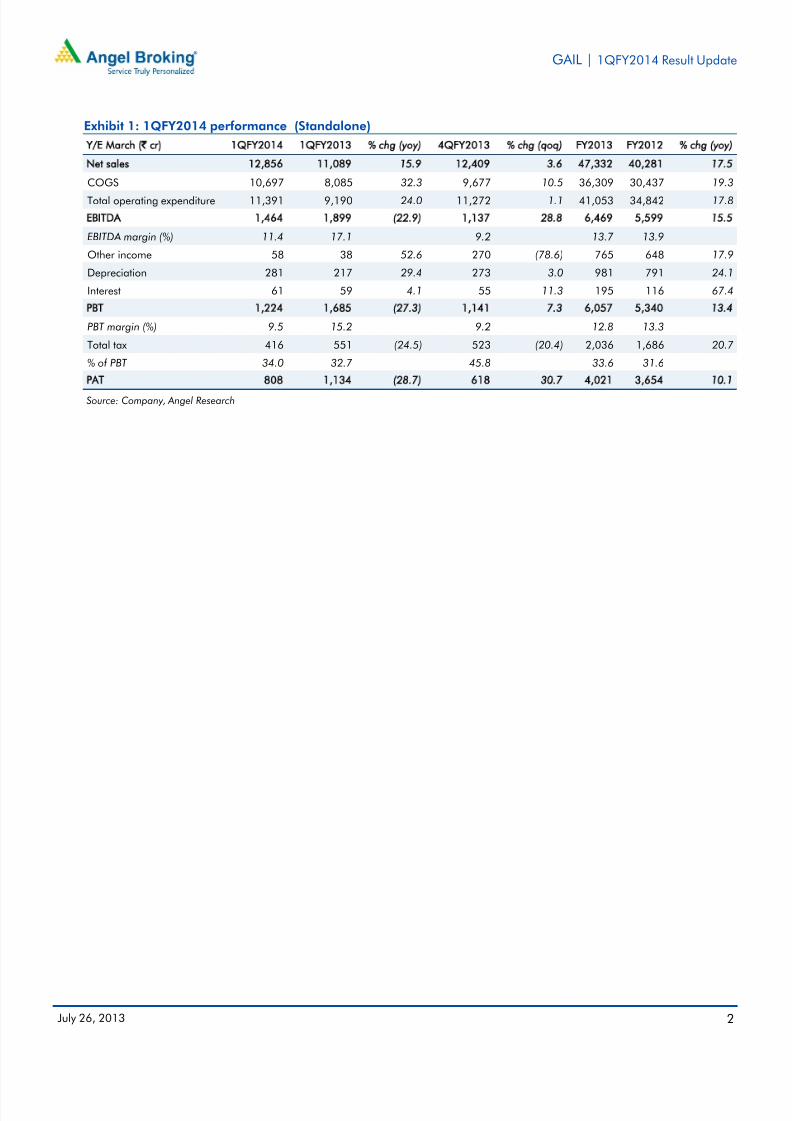
Exhibit 1: 1QFY2014 performance (Standalone)
Y/E March (` cr) 1QFY2014 1QFY2013 % chg (yoy) 4QFY2013 % chg (qoq) FY2013 FY2012 % chg (yoy)
Net sales 12,856 11,089 15.9 12,409 3.6 47,332 40,281 17.5
COGS 10,697 8,085 32.3 9,677 10.5 36,309 30,437 19.3Total operating expenditure 11,391 9,190 24.0 11,272 1.1 41,053 34,842 17.8
EBITDA 1,464 1,899 (22.9) 1,137 28.8 6,469 5,599 15.5
EBITDA margin (%) 11.4 17.1 9.2 13.7 13.9
Other income 58 38 52.6 270 (78.6) 765 648 17.9
Depreciation 281 217 29.4 273 3.0 981 791 24.1
Interest 61 59 4.1 55 11.3 195 116 67.4
PBT 1,224 1,685 (27.3) 1,141 7.3 6,057 5,340 13.4
PBT margin (%) 9.5 15.2 9.2 12.8 13.3
Total tax 416 551 (24.5) 523 (20.4) 2,036 1,686 20.7
% of PBT 34.0 32.7 45.8 33.6 31.6
PAT 808 1,134 (28.7) 618 30.7 4,021 3,654 10.1
Source: Company, Angel Research
7/27/2019 GAIL India, 1Q FY 2014
http://slidepdf.com/reader/full/gail-india-1q-fy-2014 3/12
GAIL | 1QFY2014 Result Update
July 26, 2013 3
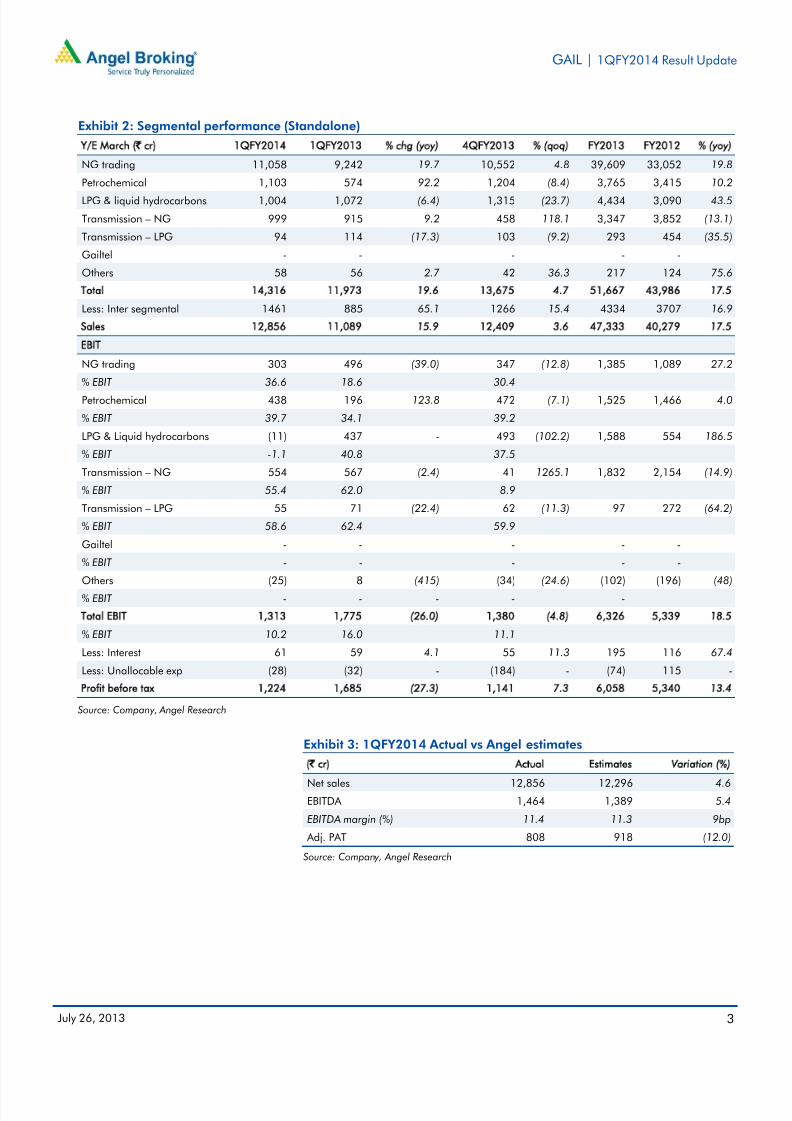
Exhibit 2: Segmental performance (Standalone)
Y/E March (` cr) 1QFY2014 1QFY2013 % chg (yoy) 4QFY2013 % (qoq) FY2013 FY2012 % (yoy)
NG trading 11,058 9,242 19.7 10,552 4.8 39,609 33,052 19.8
Petrochemical 1,103 574 92.2 1,204 (8.4) 3,765 3,415 10.2LPG & liquid hydrocarbons 1,004 1,072 (6.4) 1,315 (23.7) 4,434 3,090 43.5
Transmission – NG 999 915 9.2 458 118.1 3,347 3,852 (13.1)
Transmission – LPG 94 114 (17.3) 103 (9.2) 293 454 (35.5)
Gailtel - - - - -
Others 58 56 2.7 42 36.3 217 124 75.6
Total 14,316 11,973 19.6 13,675 4.7 51,667 43,986 17.5
Less: Inter segmental 1461 885 65.1 1266 15.4 4334 3707 16.9
Sales 12,856 11,089 15.9 12,409 3.6 47,333 40,279 17.5
EBIT
NG trading 303 496 (39.0) 347 (12.8) 1,385 1,089 27.2
% EBIT 36.6 18.6 30.4
Petrochemical 438 196 123.8 472 (7.1) 1,525 1,466 4.0
% EBIT 39.7 34.1 39.2
LPG & Liquid hydrocarbons (11) 437 - 493 (102.2) 1,588 554 186.5
% EBIT -1.1 40.8 37.5
Transmission – NG 554 567 (2.4) 41 1265.1 1,832 2,154 (14.9)
% EBIT 55.4 62.0 8.9
Transmission – LPG 55 71 (22.4) 62 (11.3) 97 272 (64.2)
% EBIT 58.6 62.4 59.9
Gailtel - - - - -
% EBIT - - - - -
Others (25) 8 (415) (34) (24.6) (102) (196) (48)
% EBIT - - - - -
Total EBIT 1,313 1,775 (26.0) 1,380 (4.8) 6,326 5,339 18.5
% EBIT 10.2 16.0 11.1
Less: Interest 61 59 4.1 55 11.3 195 116 67.4
Less: Unallocable exp (28) (32) - (184) - (74) 115 -
Profit before tax 1,224 1,685 (27.3) 1,141 7.3 6,058 5,340 13.4
Source: Company, Angel Research
Exhibit 3: 1QFY2014 Actual vs Angel estimates(` cr) Actual Estimates Variation (%)
Net sales 12,856 12,296 4.6
EBITDA 1,464 1,389 5.4
EBITDA margin (%) 11.4 11.3 9bp
Adj. PAT 808 918 (12.0)
Source: Company, Angel Research
7/27/2019 GAIL India, 1Q FY 2014
http://slidepdf.com/reader/full/gail-india-1q-fy-2014 4/12
GAIL | 1QFY2014 Result Update
July 26, 2013 4
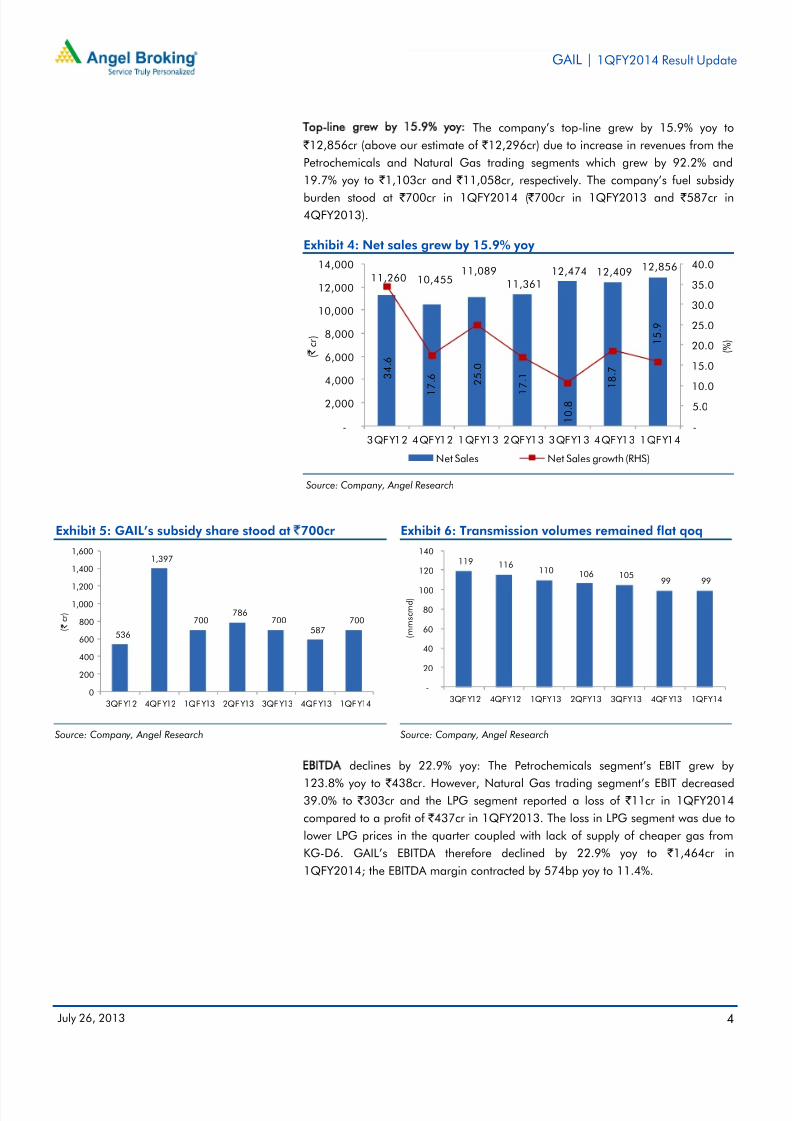
Top-line grew by 15.9% yoy: The company’s top-line grew by 15.9% yoy to
` 12,856cr (above our estimate of ` 12,296cr) due to increase in revenues from the
Petrochemicals and Natural Gas trading segments which grew by 92.2% and
19.7% yoy to `
1,103cr and `
11,058cr, respectively. The company’s fuel subsidy burden stood at ` 700cr in 1QFY2014 ( ` 700cr in 1QFY2013 and ` 587cr in
4QFY2013).
Exhibit 4: Net sales grew by 15.9% yoy
11,260 10,45511,089
11,361
12,474 12,40912,856
3 4
. 6
1 7 . 6
2 5 .
0
1 7 . 1
1 0 . 8
1 8 . 7
1 5 . 9
-
5.0
10.015.0
20.0
25.0
30.0
35.0
40.0
-
2,000
4,000
6,000
8,000
10,000
12,000
14,000
3QFY12 4QFY12 1QFY13 2QFY13 3QFY13 4QFY13 1QFY14
( % )
( `
c r )
Net Sales Net Sales growth (RHS)
Source: Company, Angel Research
Exhibit 5: GAIL’s subsidy share stood at `700cr
536
1,397
700786
700587
700
0
200
400
600
800
1,000
1,200
1,400
1,600
3QFY12 4QFY12 1QFY13 2QFY13 3QFY13 4QFY13 1QFY14
( `
c r )
Source: Company, Angel Research
Exhibit 6: Transmission volumes remained flat qoq
119 116110 106 105
99 99
-
20
40
60
80
100
120
140
3QF Y12 4QFY12 1QFY13 2QFY13 3QFY13 4QF Y13 1QFY14
( m m s c m d )
Source: Company, Angel Research
EBITDA declines by 22.9% yoy: The Petrochemicals segment’s EBIT grew by
123.8% yoy to ` 438cr. However, Natural Gas trading segment’s EBIT decreased
39.0% to ` 303cr and the LPG segment reported a loss of ` 11cr in 1QFY2014
compared to a profit of ` 437cr in 1QFY2013. The loss in LPG segment was due to
lower LPG prices in the quarter coupled with lack of supply of cheaper gas from
KG-D6. GAIL’s EBITDA therefore declined by 22.9% yoy to ` 1,464cr in
1QFY2014; the EBITDA margin contracted by 574bp yoy to 11.4%.
7/27/2019 GAIL India, 1Q FY 2014
http://slidepdf.com/reader/full/gail-india-1q-fy-2014 5/12
GAIL | 1QFY2014 Result Update
July 26, 2013 5
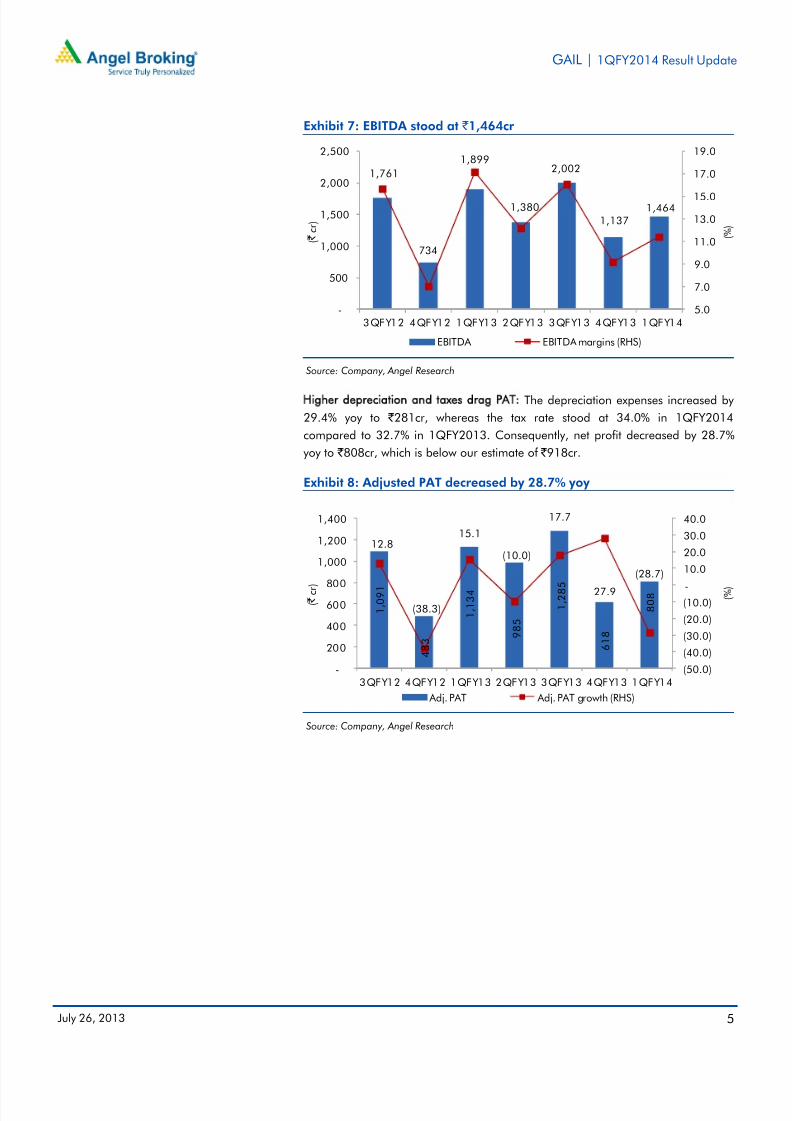
Exhibit 7: EBITDA stood at ` 1,464cr
1,761
734
1,899
1,380
2,002
1,1371,464
5.0
7.0
9.0
11.0
13.0
15.0
17.0
19.0
-
500
1,000
1,500
2,000
2,500
3QFY12 4QFY12 1QFY13 2QFY13 3QFY13 4QFY13 1QFY14
( % )
( `
c r )
EBITDA EBITDA margins (RHS)
Source: Company, Angel Research
Higher depreciation and taxes drag PAT: The depreciation expenses increased by
29.4% yoy to ` 281cr, whereas the tax rate stood at 34.0% in 1QFY2014
compared to 32.7% in 1QFY2013. Consequently, net profit decreased by 28.7%
yoy to ` 808cr, which is below our estimate of ` 918cr.
Exhibit 8: Adjusted PAT decreased by 28.7% yoy
1 , 0
9 1
4 8 3
1 , 1
3 4
9 8 5
1 , 2
8 5
6 1 8
8 0 8
12.8
(38.3)
15.1
(10.0)
17.7
27.9
(28.7)
(50.0)
(40.0)
(30.0)
(20.0)
(10.0)
-
10.020.0
30.0
40.0
-
200
400
600
800
1,000
1,200
1,400
3QFY12 4QFY12 1QFY13 2QFY13 3QFY13 4QFY13 1QFY14
( % )
( `
c r )
Adj. PAT Adj. PAT growth (RHS)
Source: Company, Angel Research
7/27/2019 GAIL India, 1Q FY 2014
http://slidepdf.com/reader/full/gail-india-1q-fy-2014 6/12
GAIL | 1QFY2014 Result Update
July 26, 2013 6
Investment arguments
Upstream segment could see triggers: GAIL’s asset portfolio includes prospective
basins such as Myanmar fields and CBM blocks. We view these blocks as a
potential upside for the stock. Of the 27 exploratory blocks owned by GAIL, nine
blocks have potential hydrocarbon discoveries. Any material success in the form of
a major discovery could be a key catalyst for the stock.
Falling domestic gas production remains a concern: GAIL is expanding its
transmission capacity from 170mmscmd currently to 300mmscnd in the next two
years. However, gas production from the KG basin has declined significantly over
the past one year. Looking ahead, we do not expect any meaningful increase in
production at KG D6 in the coming year. Hence, we expect utilization levels for
GAIL’s pipelines to remain low during FY2014-15.
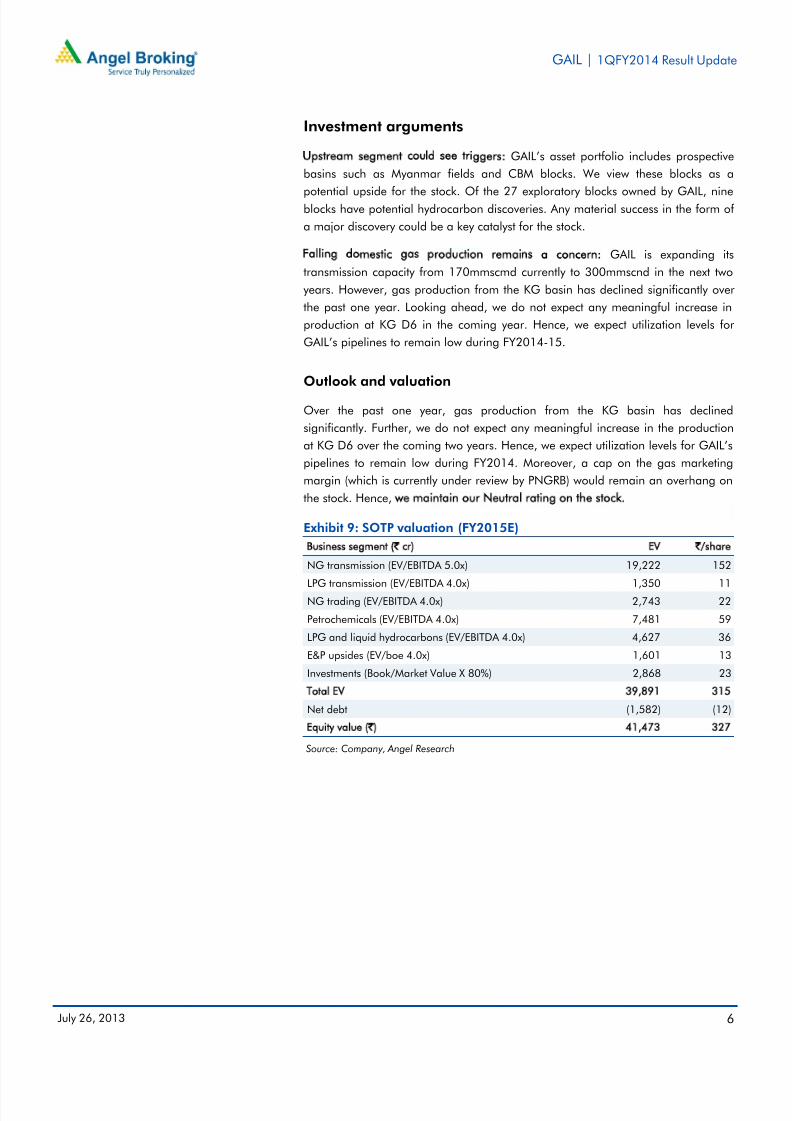
Outlook and valuation
Over the past one year, gas production from the KG basin has declined
significantly. Further, we do not expect any meaningful increase in the production
at KG D6 over the coming two years. Hence, we expect utilization levels for GAIL’s
pipelines to remain low during FY2014. Moreover, a cap on the gas marketing
margin (which is currently under review by PNGRB) would remain an overhang on
the stock. Hence, we maintain our Neutral rating on the stock.
Exhibit 9: SOTP valuation (FY2015E)
Business segment (` cr) EV `/share
NG transmission (EV/EBITDA 5.0x) 19,222 152
LPG transmission (EV/EBITDA 4.0x) 1,350 11
NG trading (EV/EBITDA 4.0x) 2,743 22
Petrochemicals (EV/EBITDA 4.0x) 7,481 59
LPG and liquid hydrocarbons (EV/EBITDA 4.0x) 4,627 36
E&P upsides (EV/boe 4.0x) 1,601 13
Investments (Book/Market Value X 80%) 2,868 23
Total EV 39,891 315
Net debt (1,582) (12)
Equity value (`) 41,473 327
Source: Company, Angel Research
7/27/2019 GAIL India, 1Q FY 2014
http://slidepdf.com/reader/full/gail-india-1q-fy-2014 7/12
GAIL | 1QFY2014 Result Update
July 26, 2013 7
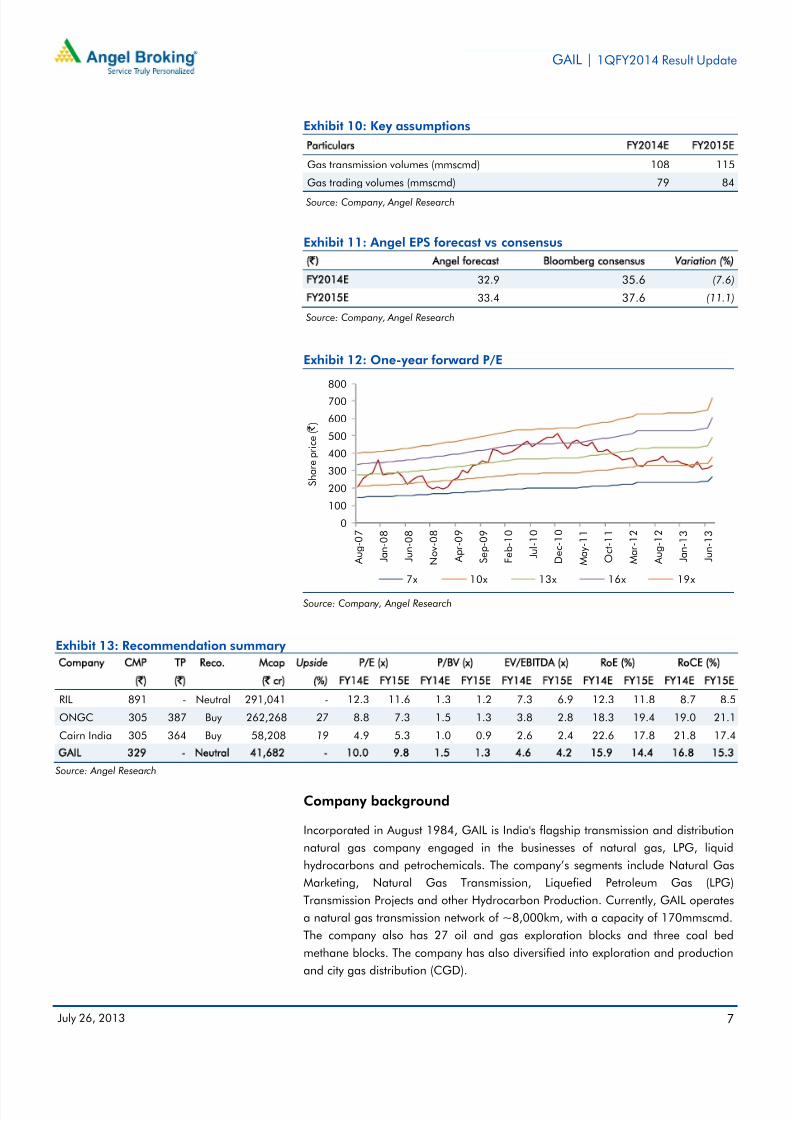
Exhibit 10: Key assumptions
Particulars FY2014E FY2015E
Gas transmission volumes (mmscmd) 108 115
Gas trading volumes (mmscmd) 79 84 Source: Company, Angel Research
Exhibit 11: Angel EPS forecast vs consensus
(`) Angel forecast Bloomberg consensus Variation (%)
FY2014E 32.9 35.6 (7.6)
FY2015E 33.4 37.6 (11.1)
Source: Company, Angel Research
Exhibit 12: One-year forward P/E
0
100
200
300
400
500
600
700
800
A u g - 0
7
J a
n - 0
8
J u
n - 0
8
N o v - 0
8
A p r - 0 9
S e
p - 0
9
F e
b - 1
0
J
u l - 1 0
D e c - 1
0
M a y - 1
1
O
c t - 1 1
M a r - 1 2
A u g - 1
2
J a
n - 1
3
J u
n - 1
3
S h a r e p r i c e ( ` )
7x 10x 13x 16x 19x
Source: Company, Angel Research
Exhibit 13: Recommendation summary
Company CMP TP Reco. Mcap Upside P/E (x) P/BV (x) EV/EBITDA (x) RoE (%) RoCE (%)
(`) (`) (` cr) (%) FY14E FY15E FY14E FY15E FY14E FY15E FY14E FY15E FY14E FY15E
RIL 891 - Neutral 291,041 - 12.3 11.6 1.3 1.2 7.3 6.9 12.3 11.8 8.7 8.5
ONGC 305 387 Buy 262,268 27 8.8 7.3 1.5 1.3 3.8 2.8 18.3 19.4 19.0 21.1
Cairn India 305 364 Buy 58,208 19 4.9 5.3 1.0 0.9 2.6 2.4 22.6 17.8 21.8 17.4
GAIL 329 - Neutral 41,682 - 10.0 9.8 1.5 1.3 4.6 4.2 15.9 14.4 16.8 15.3
Source: Angel Research
Company background
Incorporated in August 1984, GAIL is India's flagship transmission and distribution
natural gas company engaged in the businesses of natural gas, LPG, liquid
hydrocarbons and petrochemicals. The company’s segments include Natural Gas
Marketing, Natural Gas Transmission, Liquefied Petroleum Gas (LPG)
Transmission Projects and other Hydrocarbon Production. Currently, GAIL operates
a natural gas transmission network of ~8,000km, with a capacity of 170mmscmd.
The company also has 27 oil and gas exploration blocks and three coal bed
methane blocks. The company has also diversified into exploration and production
and city gas distribution (CGD).
7/27/2019 GAIL India, 1Q FY 2014
http://slidepdf.com/reader/full/gail-india-1q-fy-2014 8/12
GAIL | 1QFY2014 Result Update
July 26, 2013 8
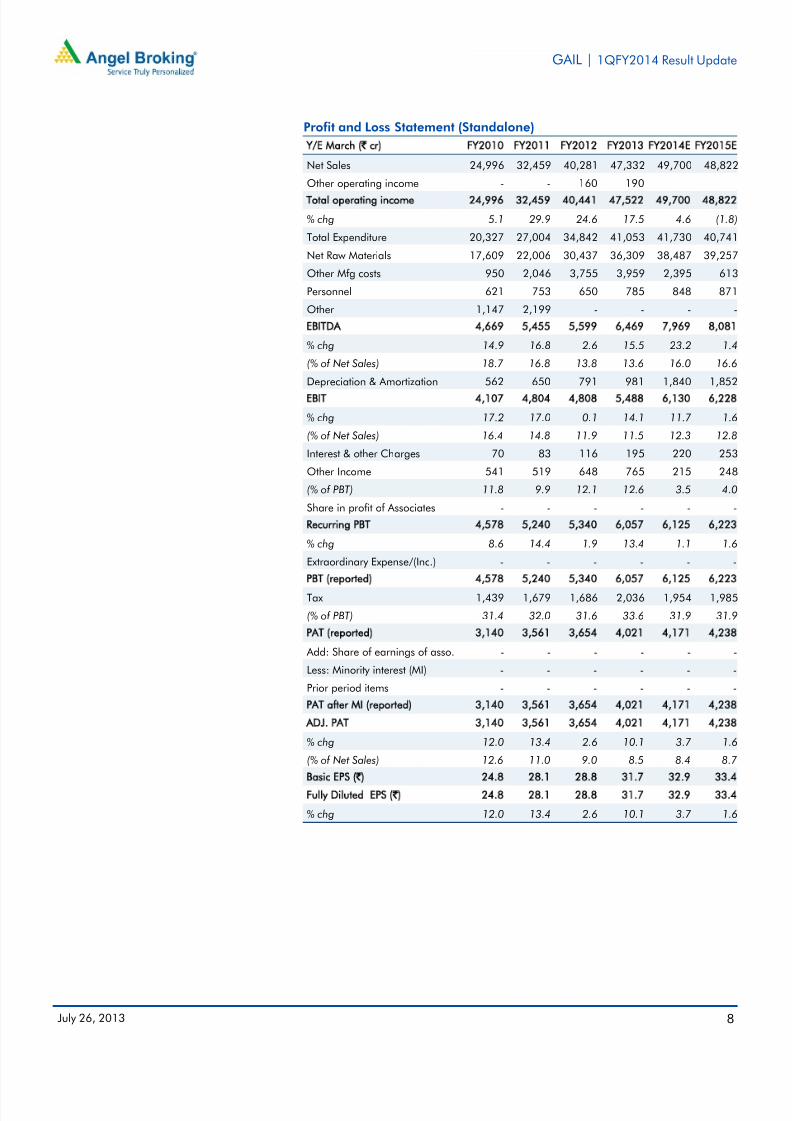
Profit and Loss Statement (Standalone)
Y/E March (` cr) FY2010 FY2011 FY2012 FY2013 FY2014E FY2015E
Net Sales 24,996 32,459 40,281 47,332 49,700 48,822
Other operating income - - 160 190Total operating income 24,996 32,459 40,441 47,522 49,700 48,822
% chg 5.1 29.9 24.6 17.5 4.6 (1.8)
Total Expenditure 20,327 27,004 34,842 41,053 41,730 40,741
Net Raw Materials 17,609 22,006 30,437 36,309 38,487 39,257
Other Mfg costs 950 2,046 3,755 3,959 2,395 613
Personnel 621 753 650 785 848 871
Other 1,147 2,199 - - - -
EBITDA 4,669 5,455 5,599 6,469 7,969 8,081
% chg 14.9 16.8 2.6 15.5 23.2 1.4
(% of Net Sales) 18.7 16.8 13.8 13.6 16.0 16.6
Depreciation & Amortization 562 650 791 981 1,840 1,852
EBIT 4,107 4,804 4,808 5,488 6,130 6,228
% chg 17.2 17.0 0.1 14.1 11.7 1.6
(% of Net Sales) 16.4 14.8 11.9 11.5 12.3 12.8
Interest & other Charges 70 83 116 195 220 253
Other Income 541 519 648 765 215 248
(% of PBT) 11.8 9.9 12.1 12.6 3.5 4.0
Share in profit of Associates - - - - - -
Recurring PBT 4,578 5,240 5,340 6,057 6,125 6,223
% chg 8.6 14.4 1.9 13.4 1.1 1.6
Extraordinary Expense/(Inc.) - - - - - -
PBT (reported) 4,578 5,240 5,340 6,057 6,125 6,223
Tax 1,439 1,679 1,686 2,036 1,954 1,985
(% of PBT) 31.4 32.0 31.6 33.6 31.9 31.9
PAT (reported) 3,140 3,561 3,654 4,021 4,171 4,238
Add: Share of earnings of asso. - - - - - -
Less: Minority interest (MI) - - - - - -
Prior period items - - - - - -
PAT after MI (reported) 3,140 3,561 3,654 4,021 4,171 4,238
ADJ. PAT 3,140 3,561 3,654 4,021 4,171 4,238
% chg 12.0 13.4 2.6 10.1 3.7 1.6(% of Net Sales) 12.6 11.0 9.0 8.5 8.4 8.7
Basic EPS (`) 24.8 28.1 28.8 31.7 32.9 33.4
Fully Diluted EPS (̀ ) 24.8 28.1 28.8 31.7 32.9 33.4
% chg 12.0 13.4 2.6 10.1 3.7 1.6
7/27/2019 GAIL India, 1Q FY 2014
http://slidepdf.com/reader/full/gail-india-1q-fy-2014 9/12
GAIL | 1QFY2014 Result Update
July 26, 2013 9
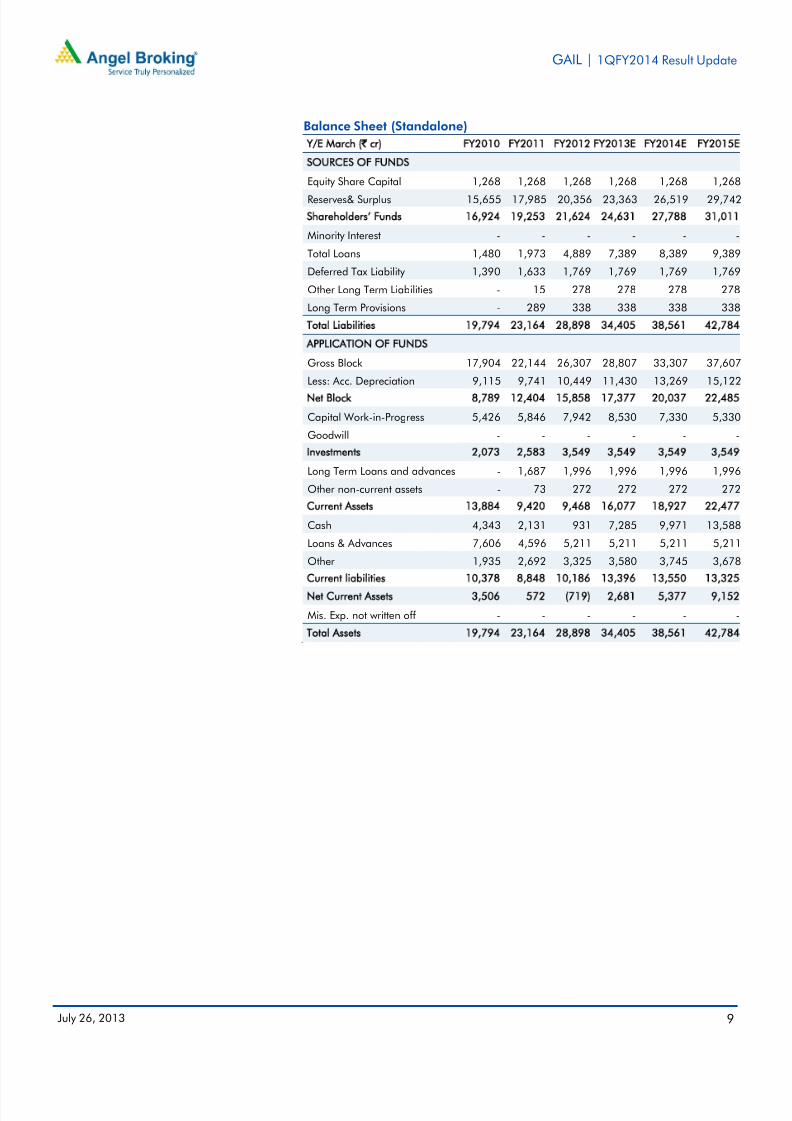
Balance Sheet (Standalone)
Y/E March (` cr) FY2010 FY2011 FY2012 FY2013E FY2014E FY2015E
SOURCES OF FUNDS
Equity Share Capital 1,268 1,268 1,268 1,268 1,268 1,268Reserves& Surplus 15,655 17,985 20,356 23,363 26,519 29,742
Shareholders’ Funds 16,924 19,253 21,624 24,631 27,788 31,011
Minority Interest - - - - - -
Total Loans 1,480 1,973 4,889 7,389 8,389 9,389
Deferred Tax Liability 1,390 1,633 1,769 1,769 1,769 1,769
Other Long Term Liabilities - 15 278 278 278 278
Long Term Provisions - 289 338 338 338 338
Total Liabilities 19,794 23,164 28,898 34,405 38,561 42,784
APPLICATION OF FUNDS
Gross Block 17,904 22,144 26,307 28,807 33,307 37,607
Less: Acc. Depreciation 9,115 9,741 10,449 11,430 13,269 15,122
Net Block 8,789 12,404 15,858 17,377 20,037 22,485
Capital Work-in-Progress 5,426 5,846 7,942 8,530 7,330 5,330
Goodwill - - - - - -
Investments 2,073 2,583 3,549 3,549 3,549 3,549
Long Term Loans and advances - 1,687 1,996 1,996 1,996 1,996
Other non-current assets - 73 272 272 272 272
Current Assets 13,884 9,420 9,468 16,077 18,927 22,477
Cash 4,343 2,131 931 7,285 9,971 13,588
Loans & Advances 7,606 4,596 5,211 5,211 5,211 5,211
Other 1,935 2,692 3,325 3,580 3,745 3,678
Current liabilities 10,378 8,848 10,186 13,396 13,550 13,325
Net Current Assets 3,506 572 (719) 2,681 5,377 9,152
Mis. Exp. not written off - - - - - -
Total Assets 19,794 23,164 28,898 34,405 38,561 42,784
7/27/2019 GAIL India, 1Q FY 2014
http://slidepdf.com/reader/full/gail-india-1q-fy-2014 10/12
GAIL | 1QFY2014 Result Update
July 26, 2013 10
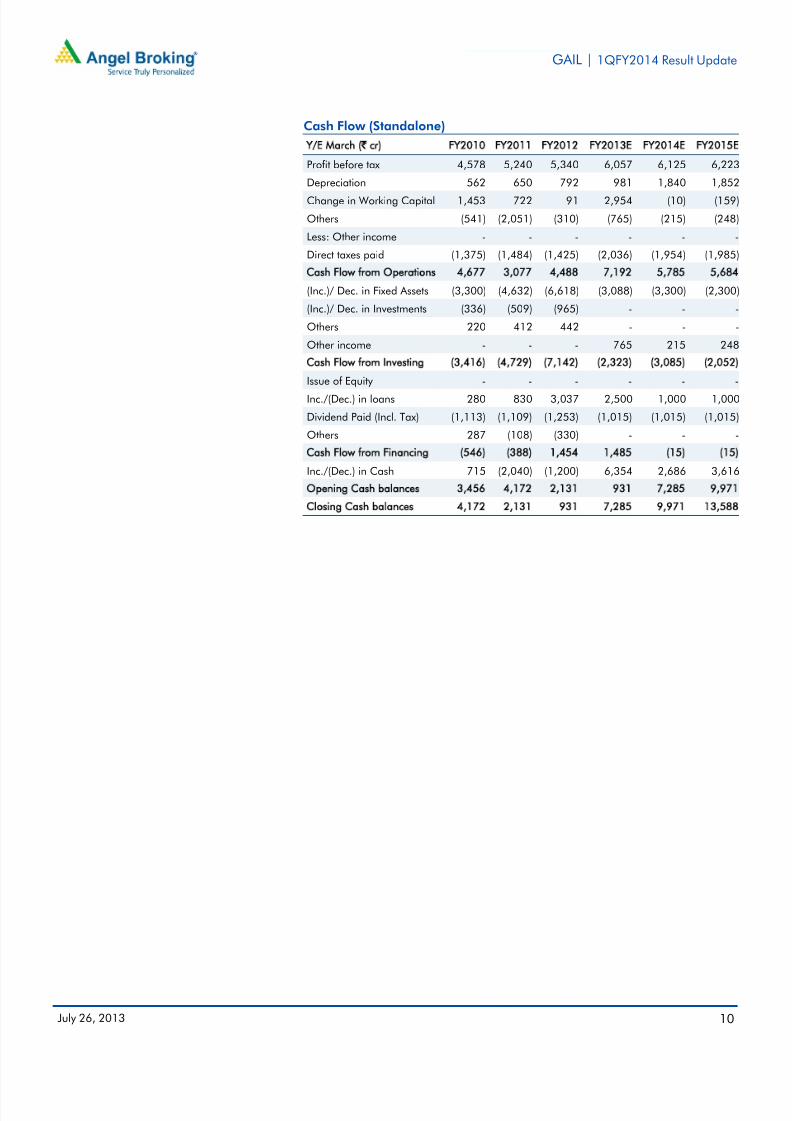
Cash Flow (Standalone)
Y/E March (` cr) FY2010 FY2011 FY2012 FY2013E FY2014E FY2015E
Profit before tax 4,578 5,240 5,340 6,057 6,125 6,223
Depreciation 562 650 792 981 1,840 1,852Change in Working Capital 1,453 722 91 2,954 (10) (159)
Others (541) (2,051) (310) (765) (215) (248)
Less: Other income - - - - - -
Direct taxes paid (1,375) (1,484) (1,425) (2,036) (1,954) (1,985)
Cash Flow from Operations 4,677 3,077 4,488 7,192 5,785 5,684
(Inc.)/ Dec. in Fixed Assets (3,300) (4,632) (6,618) (3,088) (3,300) (2,300)
(Inc.)/ Dec. in Investments (336) (509) (965) - - -
Others 220 412 442 - - -
Other income - - - 765 215 248
Cash Flow from Investing (3,416) (4,729) (7,142) (2,323) (3,085) (2,052)
Issue of Equity - - - - - -
Inc./(Dec.) in loans 280 830 3,037 2,500 1,000 1,000
Dividend Paid (Incl. Tax) (1,113) (1,109) (1,253) (1,015) (1,015) (1,015)
Others 287 (108) (330) - - -
Cash Flow from Financing (546) (388) 1,454 1,485 (15) (15)
Inc./(Dec.) in Cash 715 (2,040) (1,200) 6,354 2,686 3,616
Opening Cash balances 3,456 4,172 2,131 931 7,285 9,971
Closing Cash balances 4,172 2,131 931 7,285 9,971 13,588
7/27/2019 GAIL India, 1Q FY 2014
http://slidepdf.com/reader/full/gail-india-1q-fy-2014 11/12
GAIL | 1QFY2014 Result Update
July 26, 2013 11
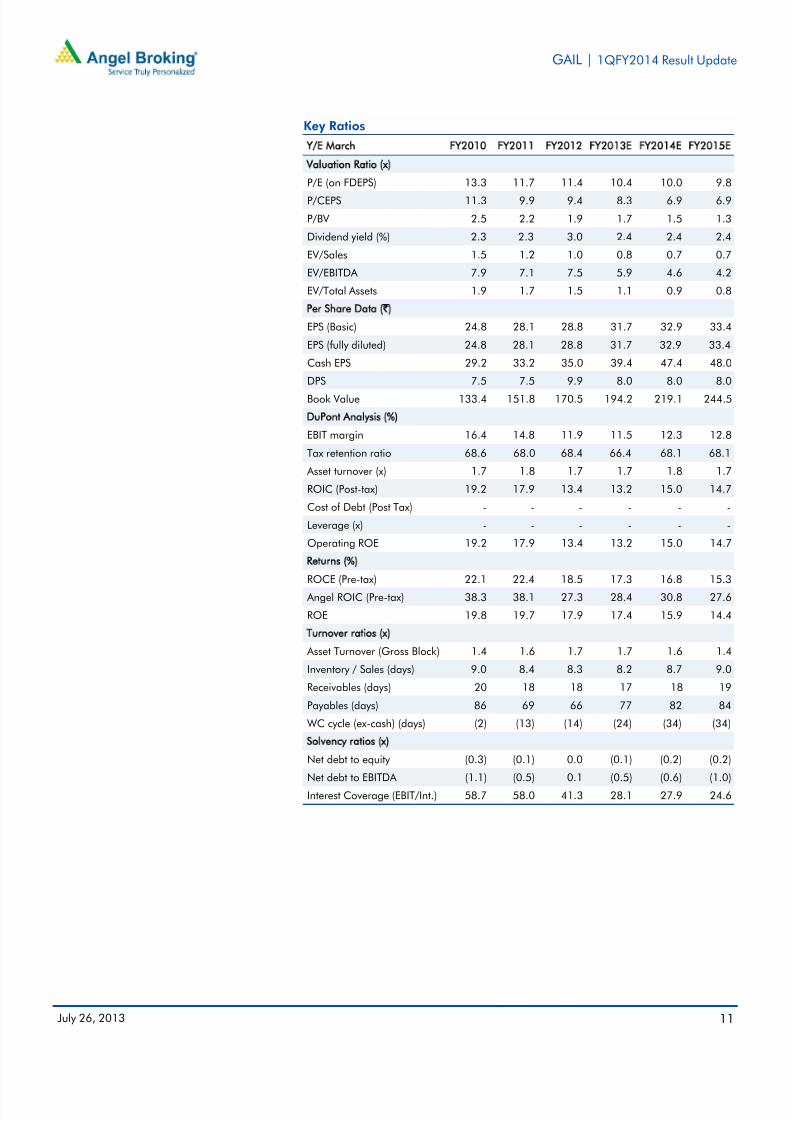
Key Ratios
Y/E March FY2010 FY2011 FY2012 FY2013E FY2014E FY2015E
Valuation Ratio (x)
P/E (on FDEPS) 13.3 11.7 11.4 10.4 10.0 9.8P/CEPS 11.3 9.9 9.4 8.3 6.9 6.9
P/BV 2.5 2.2 1.9 1.7 1.5 1.3
Dividend yield (%) 2.3 2.3 3.0 2.4 2.4 2.4
EV/Sales 1.5 1.2 1.0 0.8 0.7 0.7
EV/EBITDA 7.9 7.1 7.5 5.9 4.6 4.2
EV/Total Assets 1.9 1.7 1.5 1.1 0.9 0.8
Per Share Data (`)
EPS (Basic) 24.8 28.1 28.8 31.7 32.9 33.4
EPS (fully diluted) 24.8 28.1 28.8 31.7 32.9 33.4
Cash EPS 29.2 33.2 35.0 39.4 47.4 48.0
DPS 7.5 7.5 9.9 8.0 8.0 8.0
Book Value 133.4 151.8 170.5 194.2 219.1 244.5
DuPont Analysis (%)
EBIT margin 16.4 14.8 11.9 11.5 12.3 12.8
Tax retention ratio 68.6 68.0 68.4 66.4 68.1 68.1
Asset turnover (x) 1.7 1.8 1.7 1.7 1.8 1.7
ROIC (Post-tax) 19.2 17.9 13.4 13.2 15.0 14.7
Cost of Debt (Post Tax) - - - - - -
Leverage (x) - - - - - -
Operating ROE 19.2 17.9 13.4 13.2 15.0 14.7
Returns (%)
ROCE (Pre-tax) 22.1 22.4 18.5 17.3 16.8 15.3
Angel ROIC (Pre-tax) 38.3 38.1 27.3 28.4 30.8 27.6
ROE 19.8 19.7 17.9 17.4 15.9 14.4
Turnover ratios (x)
Asset Turnover (Gross Block) 1.4 1.6 1.7 1.7 1.6 1.4
Inventory / Sales (days) 9.0 8.4 8.3 8.2 8.7 9.0
Receivables (days) 20 18 18 17 18 19
Payables (days) 86 69 66 77 82 84
WC cycle (ex-cash) (days) (2) (13) (14) (24) (34) (34)
Solvency ratios (x)Net debt to equity (0.3) (0.1) 0.0 (0.1) (0.2) (0.2)
Net debt to EBITDA (1.1) (0.5) 0.1 (0.5) (0.6) (1.0)
Interest Coverage (EBIT/Int.) 58.7 58.0 41.3 28.1 27.9 24.6
7/27/2019 GAIL India, 1Q FY 2014
http://slidepdf.com/reader/full/gail-india-1q-fy-2014 12/12
GAIL | 1QFY2014 Result Update
July 26 2013 12
Research Team Tel: 022 – 3935 7800 E-mail: [email protected] Website: www.angelbroking.com
DISCLAIMER
This document is solely for the personal information of the recipient, and must not be singularly used as the basis of any investment
decision. Nothing in this document should be construed as investment or financial advice. Each recipient of this document should make
such investigations as they deem necessary to arrive at an independent evaluation of an investment in the securities of the companies
referred to in this document (including the merits and risks involved), and should consult their own advisors to determine the merits and
risks of such an investment.
Angel Broking Pvt. Limited, its affiliates, directors, its proprietary trading and investment businesses may, from time to time, make
investment decisions that are inconsistent with or contradictory to the recommendations expressed herein. The views contained in this
document are those of the analyst, and the company may or may not subscribe to all the views expressed within.
Reports based on technical and derivative analysis center on studying charts of a stock's price movement, outstanding positions and
trading volume, as opposed to focusing on a company's fundamentals and, as such, may not match with a report on a company's
fundamentals.
The information in this document has been printed on the basis of publicly available information, internal data and other reliablesources believed to be true, but we do not represent that it is accurate or complete and it should not be relied on as such, as thisdocument is for general guidance only. Angel Broking Pvt. Limited or any of its affiliates/ group companies shall not be in any way responsible for any loss or damage that may arise to any person from any inadvertent error in the information contained in this report .
Angel Broking Pvt. Limited has not independently verified all the information contained within this document. Accordingly, we cannottestify, nor make any representation or warranty, express or implied, to the accuracy, contents or data contained within this document. While Angel Broking Pvt. Limited endeavours to update on a reasonable basis the information discussed in this material, there may beregulatory, compliance, or other reasons that prevent us from doing so.
This document is being supplied to you solely for your information, and its contents, information or data may not be reproduced,
redistributed or passed on, directly or indirectly.
Angel Broking Pvt. Limited and its affiliates may seek to provide or have engaged in providing corporate finance, investment bankingor other advisory services in a merger or specific transaction to the companies referred to in this report, as on the date of this report or
in the past.
Neither Angel Broking Pvt. Limited, nor its directors, employees or affiliates shall be liable for any loss or damage that may arise from
or in connection with the use of this information.
Note: Please refer to the important `Stock Holding Disclosure' report on the Angel website (Research Section). Also, please refer to thelatest update on respective stocks for the disclosure status in respect of those stocks. Angel Broking Pvt. Limited and its affiliates mayhave investment positions in the stocks recommended in this report.
Disclosure of Interest Statement GAIL
1. Analyst ownership of the stock No
2. Angel and its Group companies ownership of the stock No
3. Angel and its Group companies' Directors ownership of the stock No
4. Broking relationship with company covered No
Note: We have not considered any Exposure below ` 1 lakh for Angel, its Group companies and Directors.
Ratings (Returns) : Buy (> 15%) Accumulate (5% to 15%) Neutral (-5 to 5%)Reduce (-5% to -15%) Sell (< -15%)