Embed Size (px)
DESCRIPTION
This is Vanguard Health Care Fund's 2014 Annual Report.
Citation preview
Vanguard Health Care Fund
Annual Report | January 31, 2015
Contents
Please note: The opinions expressed in this report are just that—informed opinions. They should not be considered promises or advice.Also, please keep in mind that the information and opinions cover the period through the date on the front of this report. Of course, therisks of investing in your fund are spelled out in the prospectus.
See the Glossary for definitions of investment terms used in this report.About the cover: Since our founding, Vanguard has drawn inspiration from the enterprise and valor demonstrated by Britishnaval hero Horatio Nelson and his command at the Battle of the Nile in 1798. The photograph displays a replica of a merchantship from the same era as Nelson’s flagship, the HMS Vanguard.
The mission continues
On May 1, 1975, Vanguard began operations, a fledgling company basedon the simple but revolutionary idea that a mutual fund company shouldbe managed solely in the interest of its investors.
Four decades later, that revolutionary spirit continues to animate theenterprise. Vanguard remains on a mission to give investors the bestchance of investment success.
As we mark our 40th anniversary, we thank you for entrusting your assetsto Vanguard and giving us the opportunity to help you reach your financialgoals in the decades to come.
Your Fund’s Total Returns. . . . . . . . . . . . . . . . . . . . . . . . . . . 1
Chairman’s Letter. . . . . . . . . . . . . . . . . . . . . . . . . . . . . . . . . . 2
Advisor’s Report. . . . . . . . . . . . . . . . . . . . . . . . . . . . . . . . . . . 8
Fund Profile. . . . . . . . . . . . . . . . . . . . . . . . . . . . . . . . . . . . . .12
Performance Summary. . . . . . . . . . . . . . . . . . . . . . . . . . . . .14
Financial Statements. . . . . . . . . . . . . . . . . . . . . . . . . . . . . . 16
Your Fund’s After-Tax Returns. . . . . . . . . . . . . . . . . . . . . . . 32
About Your Fund’s Expenses. . . . . . . . . . . . . . . . . . . . . . . . 33
Glossary. . . . . . . . . . . . . . . . . . . . . . . . . . . . . . . . . . . . . . . . 35
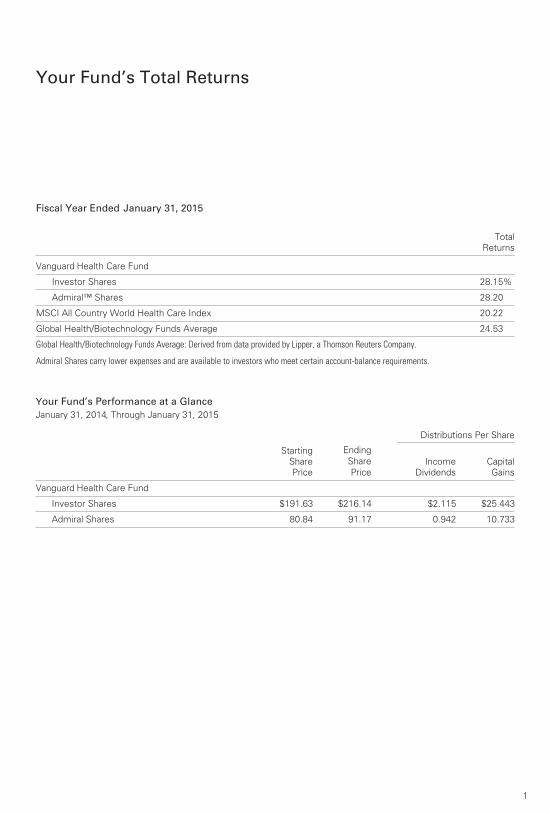
Your Fund’s Total Returns
1
Fiscal Year Ended January 31, 2015
TotalReturns
Vanguard Health Care Fund
Investor Shares 28.15%
Admiral™ Shares 28.20
MSCI All Country World Health Care Index 20.22
Global Health/Biotechnology Funds Average 24.53
Global Health/Biotechnology Funds Average: Derived from data provided by Lipper, a Thomson Reuters Company.
Admiral Shares carry lower expenses and are available to investors who meet certain account-balance requirements.
Your Fund’s Performance at a GlanceJanuary 31, 2014, Through January 31, 2015
Distributions Per Share
StartingSharePrice
EndingSharePrice
IncomeDividends
CapitalGains
Vanguard Health Care Fund
Investor Shares $191.63 $216.14 $2.115 $25.443
Admiral Shares 80.84 91.17 0.942 10.733
Chairman’s Letter
2
Dear Shareholder,
The health care sector outshone the broader global stock market for the fourth straight fiscal year. Against this backdrop, Vanguard Health Care Fund flourished: For the 12 months ended January 31, 2015, the fund returned about 28%, notably better than its comparative standards. Its benchmark, the MSCI All Country World Health Care Index, returned about 20%, while the average return of its peers was close to 25%.
In the previous two fiscal years, the
fund’s relatively light allocation to small-
capitalization biotechnology stocks curbed
its otherwise robust returns. Over the
recent fiscal year, however, the advisor’s
holdings in several industry subsectors––
especially pharmaceuticals––put the fund
ahead of its benchmark and peers. The
Health Care Fund also benefited as large-cap
stocks outpaced their small-cap brethren,
both in the biotech arena and more broadly.
If you own shares of this fund in a taxable
account, you may wish to review the fund’s
after-tax returns later in this report.
U.S. stocks posted strong resultsdespite facing many challengesAlthough volatility picked up toward the end
of the period and flat results in December
turned negative in January, the broad U.S.
stock market returned about 13% for the
12 months ended January 31, 2015. Mostly
strong U.S. corporate earnings, combined
with the effects of global monetary stimulus,
3
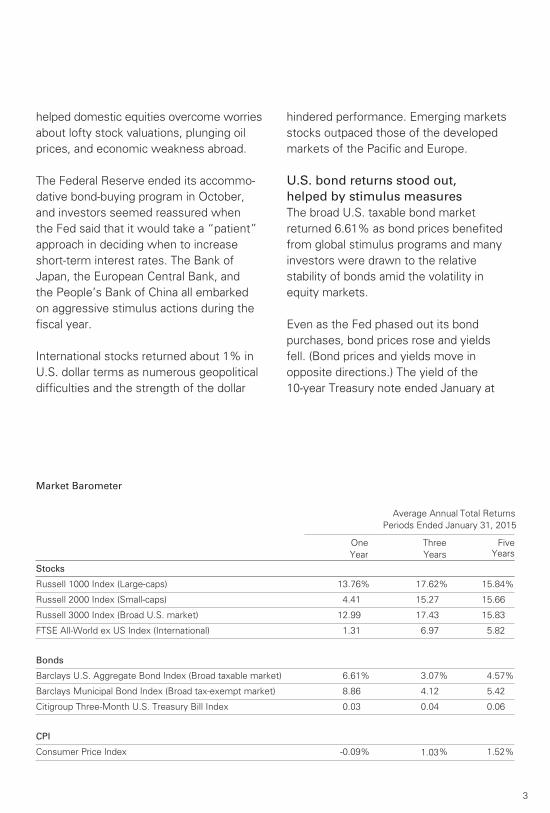
Market Barometer
Average Annual Total Returns
Periods Ended January 31, 2015
One
Year
Three
Years
Five
Years
Stocks
Russell 1000 Index (Large-caps) 13.76% 17.62% 15.84%
Russell 2000 Index (Small-caps) 4.41 15.27 15.66
Russell 3000 Index (Broad U.S. market) 12.99 17.43 15.83
FTSE All-World ex US Index (International) 1.31 6.97 5.82
Bonds
Barclays U.S. Aggregate Bond Index (Broad taxable market) 6.61% 3.07% 4.57%
Barclays Municipal Bond Index (Broad tax-exempt market) 8.86 4.12 5.42
Citigroup Three-Month U.S. Treasury Bill Index 0.03 0.04 0.06
CPI
Consumer Price Index -0.09% 1.03% 1.52%
helped domestic equities overcome worries
about lofty stock valuations, plunging oil
prices, and economic weakness abroad.
The Federal Reserve ended its accommo-
dative bond-buying program in October,
and investors seemed reassured when
the Fed said that it would take a “patient”
approach in deciding when to increase
short-term interest rates. The Bank of
Japan, the European Central Bank, and
the People’s Bank of China all embarked
on aggressive stimulus actions during the
fiscal year.
International stocks returned about 1% in
U.S. dollar terms as numerous geopolitical
difficulties and the strength of the dollar
hindered performance. Emerging markets
stocks outpaced those of the developed
markets of the Pacific and Europe.
U.S. bond returns stood out,helped by stimulus measuresThe broad U.S. taxable bond market
returned 6.61% as bond prices benefited
from global stimulus programs and many
investors were drawn to the relative
stability of bonds amid the volatility in
equity markets.
Even as the Fed phased out its bond
purchases, bond prices rose and yields
fell. (Bond prices and yields move in
opposite directions.) The yield of the
10-year Treasury note ended January at
4
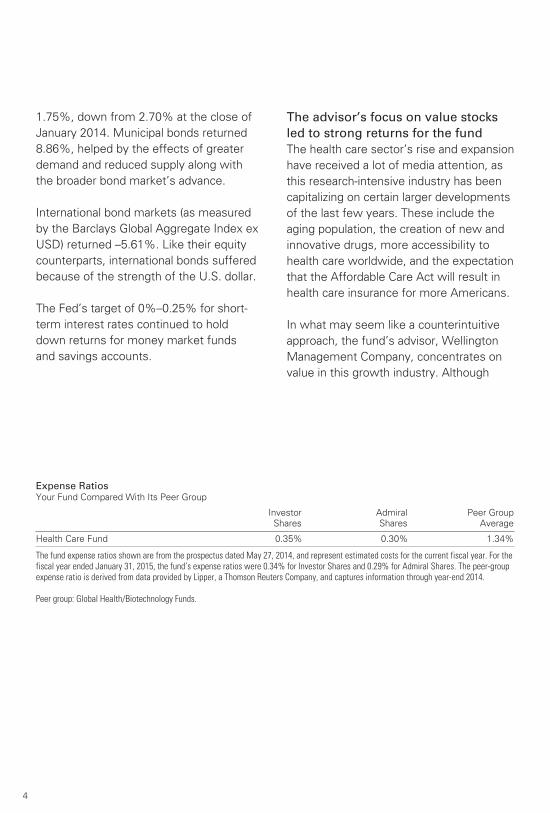
Expense RatiosYour Fund Compared With Its Peer Group
Investor
Shares
Admiral
Shares
Peer Group
Average
Health Care Fund 0.35% 0.30% 1.34%
The fund expense ratios shown are from the prospectus dated May 27, 2014, and represent estimated costs for the current fiscal year. For thefiscal year ended January 31, 2015, the fund’s expense ratios were 0.34% for Investor Shares and 0.29% for Admiral Shares. The peer-groupexpense ratio is derived from data provided by Lipper, a Thomson Reuters Company, and captures information through year-end 2014.
Peer group: Global Health/Biotechnology Funds.
1.75%, down from 2.70% at the close of
January 2014. Municipal bonds returned
8.86%, helped by the effects of greater
demand and reduced supply along with
the broader bond market’s advance.
International bond markets (as measured
by the Barclays Global Aggregate Index ex
USD) returned –5.61%. Like their equity
counterparts, international bonds suffered
because of the strength of the U.S. dollar.
The Fed’s target of 0%–0.25% for short-
term interest rates continued to hold
down returns for money market funds
and savings accounts.
The advisor’s focus on value stocksled to strong returns for the fundThe health care sector’s rise and expansion
have received a lot of media attention, as
this research-intensive industry has been
capitalizing on certain larger developments
of the last few years. These include the
aging population, the creation of new and
innovative drugs, more accessibility to
health care worldwide, and the expectation
that the Affordable Care Act will result in
health care insurance for more Americans.
In what may seem like a counterintuitive
approach, the fund’s advisor, Wellington
Management Company, concentrates on
value in this growth industry. Although
5
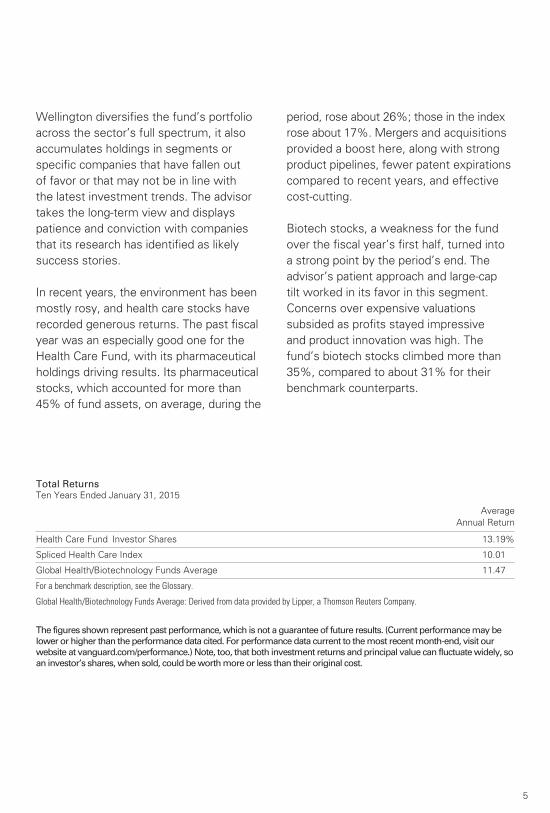
Total ReturnsTen Years Ended January 31, 2015
Average
Annual Return
Health Care Fund Investor Shares 13.19%
Spliced Health Care Index 10.01
Global Health/Biotechnology Funds Average 11.47
For a benchmark description, see the Glossary.
Global Health/Biotechnology Funds Average: Derived from data provided by Lipper, a Thomson Reuters Company.
The figures shown represent past performance, which is not a guarantee of future results. (Current performance may belower or higher than the performance data cited. For performance data current to the most recent month-end, visit ourwebsite at vanguard.com/performance.) Note, too, that both investment returns and principal value can fluctuate widely, soan investor’s shares, when sold, could be worth more or less than their original cost.
Wellington diversifies the fund’s portfolio
across the sector’s full spectrum, it also
accumulates holdings in segments or
specific companies that have fallen out
of favor or that may not be in line with
the latest investment trends. The advisor
takes the long-term view and displays
patience and conviction with companies
that its research has identified as likely
success stories.
In recent years, the environment has been
mostly rosy, and health care stocks have
recorded generous returns. The past fiscal
year was an especially good one for the
Health Care Fund, with its pharmaceutical
holdings driving results. Its pharmaceutical
stocks, which accounted for more than
45% of fund assets, on average, during the
period, rose about 26%; those in the index
rose about 17%. Mergers and acquisitions
provided a boost here, along with strong
product pipelines, fewer patent expirations
compared to recent years, and effective
cost-cutting.
Biotech stocks, a weakness for the fund
over the fiscal year’s first half, turned into
a strong point by the period’s end. The
advisor’s patient approach and large-cap
tilt worked in its favor in this segment.
Concerns over expensive valuations
subsided as profits stayed impressive
and product innovation was high. The
fund’s biotech stocks climbed more than
35%, compared to about 31% for their
benchmark counterparts.
6
Health care providers and services
companies, chiefly managed-care firms,
also paced the fund. While the Affordable
Care Act may bring health insurance to
more people, it may also make it harder
for these companies to maximize profits.
Several of the fund’s holdings in this
subsector are succeeding in the changing
landscape, and the advisor, which pays
close attention to the regulatory climate
in Washington, D.C., deserves credit for
seeing their potential. Its selections among
health care equipment companies also
helped performance.
The fund wasn’t without its trouble spots.
Health care technology firms, which
account for less than 5% of fund assets
on average, restrained results. Although
small, the portfolio’s exposure was still
much larger than that of the benchmark,
and the advisor’s selections posted
disappointing results.
The Advisor’s Report that follows this
letter provides additional details about
the management and performance of
your fund during the year.
Through a long-term lens,the fund’s results stand outOf course, investing in any sector fund––
no matter how well-managed it is, or how
impressive its record––is accompanied
by a high degree of risk. The health care
sector can be extremely volatile at times.
Expiring patents on blockbuster drugs,
failure to receive regulatory approval on
new drugs, and uncertainty about U.S.
health care reform can wreak havoc on
returns and sour investors on the industry.
Over the past decade, the advisor has
steered the Health Care Fund through
challenging situations. Its average annual
return of about 13% over the ten years
exceeds that of both its peers and its
benchmark index. This outstanding perfor-
mance is a credit to the Wellington team,
especially Jean M. Hynes, who took over
as the fund’s lead portfolio manager in
December 2012 and was a member of the
team for about two decades before that.
Although volatility is inevitable, you don’t have to ‘inherit’ itIn January, Tim Buckley, Vanguard’s
chief investment officer, and I answered
questions from shareholders as part of a
live webcast. It was a great opportunity
to hear what you’re thinking, offer some
insights, and reinforce Vanguard’s key
principles of investing.
Not surprisingly, given that the first month
of 2015 was marked by sharp fluctuations
in the markets, volatility came up as a
concern. The broad stock market had
several swings of more than 1% in January.
Bond yields, meanwhile, moved sharply
lower as prices rallied.
Our response? Tim and I both stressed that
how you react—or don’t react—to such
jolts can determine how you ultimately fare
as an investor. That’s why one of our key
principles highlights the need to maintain
perspective and long-term discipline. (You
can read Vanguard’s Principles for Investing Success at vanguard.com/research.)
7
Tim noted that the best course for
long-term investors is simply to ignore
daily market moves. He pointed out that
investors “inherit” what would otherwise
be fleeting volatility when they sell in
response to a market downturn. As Tim
put it, the only way to truly have a loss is
to act and realize that loss.
Those are wise words to keep in mind
when markets turn stormy again.
As always, thank you for investing
with Vanguard.
Sincerely,
F. William McNabb III
Chairman and Chief Executive Officer
February 12, 2015
Advisor’s Report
8
For the fiscal year ended January 31, 2015,
Vanguard Health Care Fund delivered solid
absolute and relative returns, gaining
28.15% for Investor Shares and 28.20%
for Admiral Shares. The fund surpassed
the 20.22% return of its benchmark, the
MSCI All Country World Health Care Index,
and the 24.53% average return of global
health/biotechnology funds.
Major Portfolio ChangesYear Ended January 31, 2015
Additions Comments
Actavis Actavis is a specialty pharmaceutical company that develops generic
and branded products. We owned Actavis prior to its Forest Labs
acquisition but increased our position. We are attracted to the
uniqueness of the combined company’s business model, which
provides exposure to both generic and branded pharmaceuticals
globally. The company’s Irish tax rate could also be strategically
important in future mergers and acquisitions. Actavis was the
fund’s second-largest holding as of the end of the period.
Bristol-Myers Squibb We increased our position in this biopharmaceutical company.
We see its immuno-oncology franchise as a transformative driver
in the years ahead and believe the market does not fully recognize
the magnitude of the company’s potential in this area. Bristol-Myers
Squibb was the fund’s largest holding at the end of the period.
Mylan We increased our position in this global generic pharmaceutical
manufacturer as its core generics business remains steady and has
benefited from selective price increases. We believe the planned
acquisition of Abbott’s non-U.S. established pharmaceuticals
business will augment the company’s globalization strategy.
Reductions Comments
Teva Pharmaceuticals We trimmed into strength our position in Teva, an Israel-based global
biopharmaceutical company specializing in generic formulations. The
stock rose substantially on a combination of speculation around M&A
in the sector, enthusiasm for the new CEO, and the strong conversion
of once-daily Copaxone to the three-times-a-week version.
Amgen We trimmed our position in Amgen, a U.S.-based global
biotechnology company that discovers, develops, manufactures,
and delivers human therapeutics. The stock was a strong performer
in the latter half of 2014 given restructuring efforts to focus more
attention on research and development.
Covance We eliminated our position in Covance, a contract research organization
that works with biopharmaceutical companies to help manage their
clinical trial process, after LabCorp announced in the fall that it would
acquire the company.
9
The investment environment The 12-month period was strong for
developed-market stocks and particularly
impressive for the health care sector. The
MSCI All Country World Health Care Index
outpaced the MSCI All Country World
Index, which returned 7.40%.
Mergers and acquisitions within the
health care industry continued to dominate
headlines. Most relevant for Vanguard
Health Care Fund was Actavis’ purchase
of one of our largest holdings, Forest Labs,
and Pfizer’s public bid for AstraZeneca.
Pfizer’s final bid of nearly $120 billion was
ultimately turned down by AstraZeneca’s
board, as the company believed the offer
did not appropriately value the strength of
its development pipeline. Other notable
developments included Medtronic’s
acquisition of Covidien and Mylan’s
proposed purchase of Abbott’s non-U.S.
established pharmaceuticals business.
This is an exciting time for the health
care sector, as two major secular trends
will create dynamic opportunities in the
future. The first is a deeper understanding
of human diseases. This has been enabled
by advances in gene sequencing, allowing
for a fuller knowledge of disease biology.
We are on the cusp of some truly exciting
innovation in pharmaceuticals. The progress
we have seen recently is more profound
and has occurred more rapidly than we
imagined even a few years ago.
The second trend is the changing shape
of health care delivery in the United States.
The emergence of a digital health care
system, combined with potential payment
reforms, will slowly shift incentives toward
health care outcomes, creating many
winners and losers. Longer term, this
trend may also have an impact on health
care systems outside the United States.
More broadly, this environment should
provide investors with deep research
expertise the opportunity to shine.
Our successesOur mid- and large-cap biopharmaceutical
holdings were key drivers of the fund’s
returns during the period. Stock selection
among companies in North America and
other developed markets added most to
relative outperformance; selections among
Japanese and United Kingdom-based
companies also contributed.
Among mid-cap biopharmaceuticals,
Forest Labs and Actavis were two of the
top relative contributors. In the first quarter
of 2014, it was announced that Forest
would be acquired by Actavis, which is the
world’s third-largest generic manufacturer
and also has a significant branded pharma-
ceuticals business following its merger with
Warner Chilcott in 2013. We viewed the
merger as transformational and purchased
more Actavis; at the end of the period,
Actavis was our second-largest holding.
Our position in Vertex Pharmaceuticals
also added to returns, after the company
reported positive phase 3 clinical data for
its combination cystic fibrosis regimen.
In the large-cap biopharmaceutical space,
our underweight position in Pfizer helped
the fund’s relative performance. Pfizer’s
stock price fell after AstraZeneca rebuffed
its acquisition plans. As I mentioned,
AstraZeneca’s decision was based largely
on its belief that the final offer price
10
undervalued its early-stage pipeline, a view
we share. Our exposure to AstraZeneca
aided the fund’s absolute returns as Pfizer’s
bid shed light on AstraZeneca’s enviable
pipeline. Our position in Roche Holding
also added to returns.
Within health care services, managed
care organizations (MCOs) responded
favorably to the proposed 2015 Medicare
Advantage rates as well as to continued
positive enrollment and cost trends. We
continue to believe that MCOs, such as
UnitedHealth and Aetna, will play an
increasingly important role in the U.S.
health care system. Our positions in
UnitedHealth and Humana contributed
to relative returns within this subindustry.
We believe drug store holdings Walgreens
and CVS should benefit in the future from
generic pricing and accelerating volume,
as an increasing number of Americans
obtain health insurance. Both companies
also contributed to relative returns.
Within medical devices, our holding in
Edwards Lifesciences benefited from the
greater-than-expected market growth of
transcatheter aortic valve replacement
(TAVR) and its market-leading valve, Sapien.
Our shortfallsThe most significant detractors from
relative performance were stocks that
we did not own or stocks in which
we had underweight positions. These
included Allergan, Celgene, Gilead
Sciences, and Novartis. Our position
in Allscripts Healthcare, a health care
information technology company that is
not included in the benchmark, and our
allocation to Daiichi Sankyo, a mid-cap
biopharmaceutical company based in Japan,
also detracted, as did our small-cap biophar-
maceutical holdings and our cash position.
Shares of Allscripts fell more than 28%
during the period. The company remains
a turnaround, and management’s 2014
financial road map may take longer to
materialize. We continue to own a position
and believe the stock is attractive at the
current valuation. Shares of Daiichi Sankyo
have been weak as investors have been
concerned about the efficacy of its antico-
agulation drug Edoxaban. We continue to
own the stock.
The fund’s positioningWe currently hold about 20% of the fund’s
assets in non-U.S. investments, a strategy
that we believe provides diversification
to shareholders over the long term. The
portfolio is distributed among 89 equity
names across health care’s subsectors.
We expect that number to remain near the
existing level or perhaps increase slightly,
as we sometimes elect to gain exposure
to certain themes or subsectors of the
market by holding a “basket” of smaller
positions rather than fewer larger ones.
Nonetheless, the top ten largest positions
constituted a meaningful portion—more
than 38%—of the fund’s assets at the
period’s close. We expect turnover to
remain quite low. The fund’s annualized
turnover as of January 31, 2015, was
approximately 20%, partially inflated by
the large number of M&A deals.
We are optimistic about the long-term
outlook for the health care sector and
continue to have exposure to a number
11
of positive forces, such as delivery
changes in the U.S. health care system
and new biological approaches to disease.
One area of exciting science is immuno-
oncology, which may be broadly applicable
to treating cancer. Leaders in this field
include our holdings Bristol-Myers Squibb,
Merck, Roche, AstraZeneca, and Incyte.
The structure of the U.S. health care
market is in the early stages of dynamic
change, which will result in opportunities
and challenges for market participants.
Our holdings are aligned with companies
that we believe can benefit from these
opportunities, including health plans such
as UnitedHealth and Humana and other
players that will facilitate transparency,
such as health care information company
Cerner or hospital leader HCA.
In recent years we have observed an
increasingly difficult reimbursement
environment for drugs that compete in
crowded categories with minimal product
differentiation. Embedded in our invest-
ment process for biopharmaceutical,
health care service, and medical device
stocks is our assumption that a tougher
pricing environment represents the way
of the future. As an example, we have
chosen not to own stocks that may have
solid current fundamentals but are likely
to face increasing pricing pressure from
biosimilar or generic competition in the
mid- to long-term. We also try to position
the fund to hold pharmaceutical supply
chain companies that will benefit from this
changing pricing environment.
While valuations have risen after another
strong year of outperformance for the
health care sector, for the most part,
they remain in line with historical levels—
albeit at the high end—and fundamentals
continue to surprise on the upside. As I
mentioned earlier, we continue to believe
we are in the early years of secular growth
in the industry driven by biopharmaceutical
discoveries and opportunities afforded with
the changing health care delivery landscape.
Our philosophy of using a long-term horizon
while looking at secular themes and trends
across the entire market should help us
identify pockets of health care that will
generate sustainable, innovation-driven,
differentiated growth. We will remain
diversified across subsectors and regions,
focused on the long haul, and positioned
in the most promising health care stocks
to generate attractive, risk-adjusted returns
for Vanguard’s shareholders.
Jean M. Hynes, CFA
Senior Managing Director and
Portfolio Manager
Wellington Management Company LLP
February 19, 2015
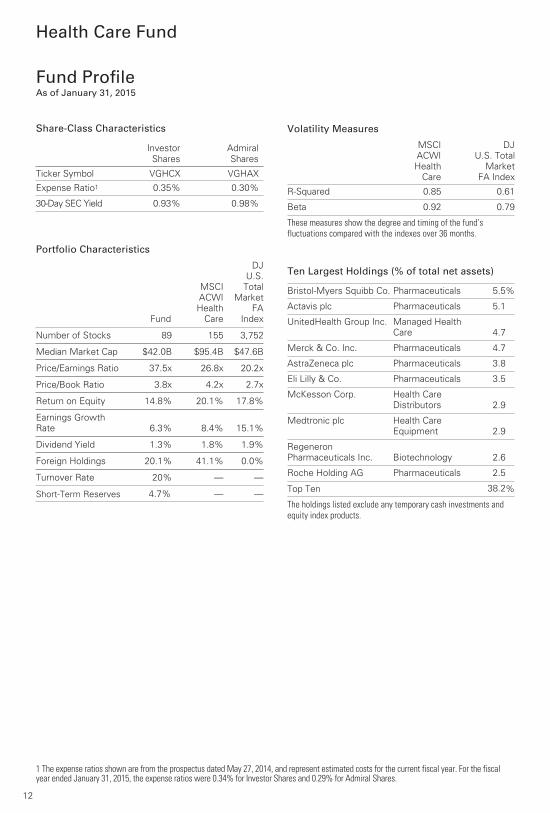
Fund ProfileAs of January 31, 2015
Portfolio Characteristics
Fund
MSCI
ACWI
Health
Care
DJ
U.S.
Total
Market
FA
Index
Number of Stocks 89 155 3,752
Median Market Cap $42.0B $95.4B $47.6B
Price/Earnings Ratio 37.5x 26.8x 20.2x
Price/Book Ratio 3.8x 4.2x 2.7x
Return on Equity 14.8% 20.1% 17.8%
Earnings Growth
Rate 6.3% 8.4% 15.1%
Dividend Yield 1.3% 1.8% 1.9%
Foreign Holdings 20.1% 41.1% 0.0%
Turnover Rate 20% — —
Short-Term Reserves 4.7% — —
Health Care Fund
Share-Class Characteristics
InvestorShares
AdmiralShares
Ticker Symbol VGHCX VGHAX
Expense Ratio1 0.35% 0.30%
30-Day SEC Yield 0.93% 0.98%
1 The expense ratios shown are from the prospectus dated May 27, 2014, and represent estimated costs for the current fiscal year. For the fiscal year ended January 31, 2015, the expense ratios were 0.34% for Investor Shares and 0.29% for Admiral Shares.
12
Volatility Measures
MSCI
ACWI
Health
Care
DJ
U.S. Total
Market
FA Index
R-Squared 0.85 0.61
Beta 0.92 0.79
These measures show the degree and timing of the fund’sfluctuations compared with the indexes over 36 months.
Ten Largest Holdings (% of total net assets)
Bristol-Myers Squibb Co. Pharmaceuticals 5.5%
Actavis plc Pharmaceuticals 5.1
UnitedHealth Group Inc. Managed Health
Care 4.7
Merck & Co. Inc. Pharmaceuticals 4.7
AstraZeneca plc Pharmaceuticals 3.8
Eli Lilly & Co. Pharmaceuticals 3.5
McKesson Corp. Health Care
Distributors 2.9
Medtronic plc Health Care
Equipment 2.9
Regeneron
Pharmaceuticals Inc. Biotechnology 2.6
Roche Holding AG Pharmaceuticals 2.5
Top Ten 38.2%
The holdings listed exclude any temporary cash investments andequity index products.
Health Care Fund
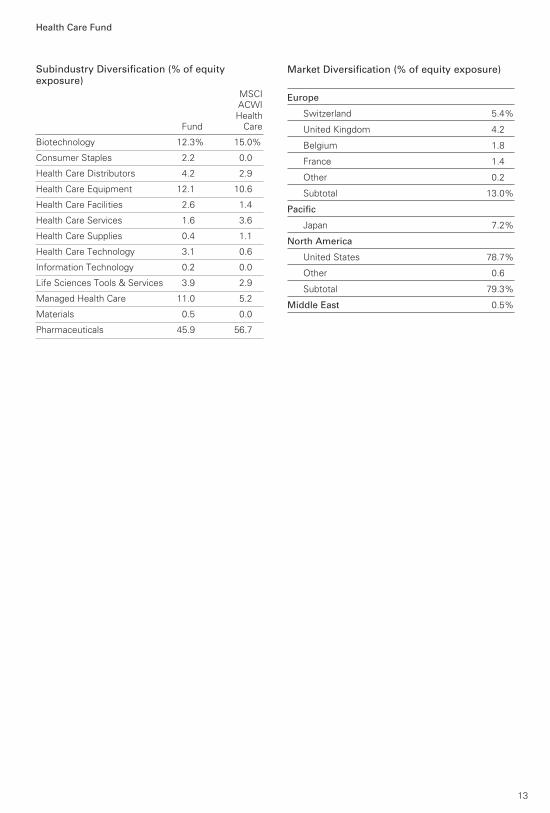
Subindustry Diversification (% of equityexposure)
Fund
MSCIACWIHealth
Care
Biotechnology 12.3% 15.0%
Consumer Staples 2.2 0.0
Health Care Distributors 4.2 2.9
Health Care Equipment 12.1 10.6
Health Care Facilities 2.6 1.4
Health Care Services 1.6 3.6
Health Care Supplies 0.4 1.1
Health Care Technology 3.1 0.6
Information Technology 0.2 0.0
Life Sciences Tools & Services 3.9 2.9
Managed Health Care 11.0 5.2
Materials 0.5 0.0
Pharmaceuticals 45.9 56.7
13
Market Diversification (% of equity exposure)
Europe
Switzerland 5.4%
United Kingdom 4.2
Belgium 1.8
France 1.4
Other 0.2
Subtotal 13.0%
Pacific
Japan 7.2%
North America
United States 78.7%
Other 0.6
Subtotal 79.3%
Middle East 0.5%
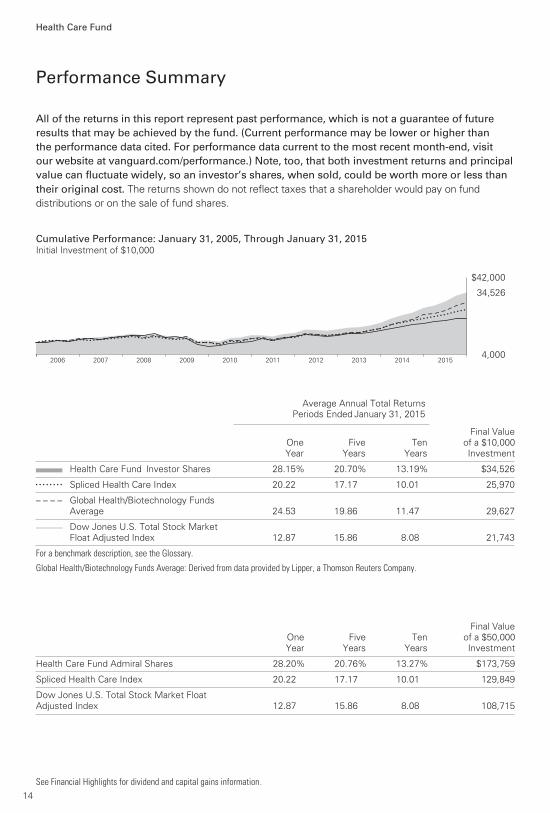
All of the returns in this report represent past performance, which is not a guarantee of future results that may be achieved by the fund. (Current performance may be lower or higher thanthe performance data cited. For performance data current to the most recent month-end, visitour website at vanguard.com/performance.) Note, too, that both investment returns and principalvalue can fluctuate widely, so an investor’s shares, when sold, could be worth more or less than their original cost. The returns shown do not reflect taxes that a shareholder would pay on fund
distributions or on the sale of fund shares.
Performance Summary
Cumulative Performance: January 31, 2005, Through January 31, 2015Initial Investment of $10,000
2015201420132012201120102009200820072006
$42,000
4,000
34,526
See Financial Highlights for dividend and capital gains information.
Health Care Fund
14
Average Annual Total Returns
Periods Ended January 31, 2015
OneYear
FiveYears
TenYears
Final Valueof a $10,000Investment
Health Care Fund*Investor Shares 28.15% 20.70% 13.19% $34,526• • • • • • • • Spliced Health Care Index 20.22 17.17 10.01 25,970
– – – – Global Health/Biotechnology FundsAverage 24.53 19.86 11.47 29,627
________ Dow Jones U.S. Total Stock MarketFloat Adjusted Index 12.87 15.86 8.08 21,743
For a benchmark description, see the Glossary.
Global Health/Biotechnology Funds Average: Derived from data provided by Lipper, a Thomson Reuters Company.
OneYear
FiveYears
TenYears
Final Valueof a $50,000Investment
Health Care Fund Admiral Shares 28.20% 20.76% 13.27% $173,759
Spliced Health Care Index 20.22 17.17 10.01 129,849
Dow Jones U.S. Total Stock Market Float Adjusted Index 12.87 15.86 8.08 108,715
Health Care Fund
15
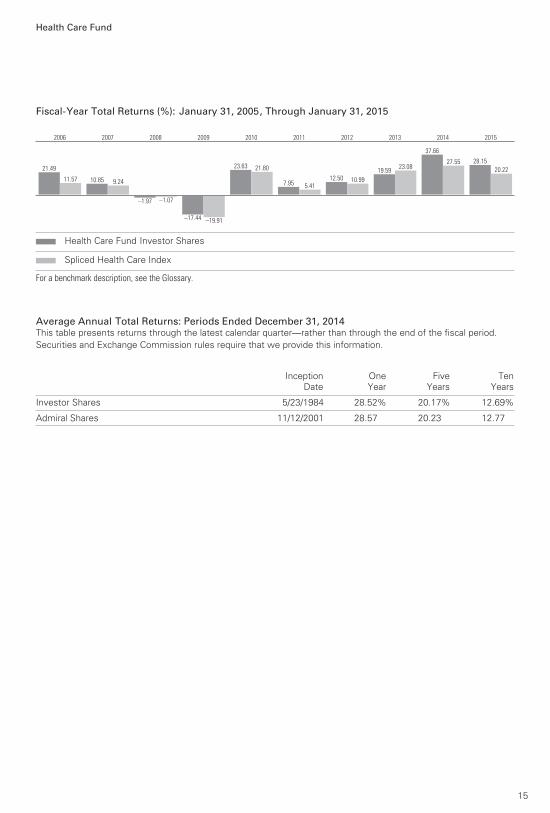
Fiscal-Year Total Returns (%): January 31, 2005, Through January 31, 2015
21.49
11.57
2006
10.85 9.24
2007
–1.97 –1.07
2008
–17.44 –19.91
2009
23.63 21.80
2010
7.95 5.41
2011
12.50 10.99
2012
19.5923.08
2013
37.66
27.55
2014
28.15
20.22
2015
Health Care Fund Investor Shares
Spliced Health Care Index
For a benchmark description, see the Glossary.
Average Annual Total Returns: Periods Ended December 31, 2014This table presents returns through the latest calendar quarter—rather than through the end of the fiscal period.Securities and Exchange Commission rules require that we provide this information.
InceptionDate
OneYear
FiveYears
TenYears
Investor Shares 5/23/1984 28.52% 20.17% 12.69%
Admiral Shares 11/12/2001 28.57 20.23 12.77
Market
Value•
Shares ($000)
Market
Value•
Shares ($000)
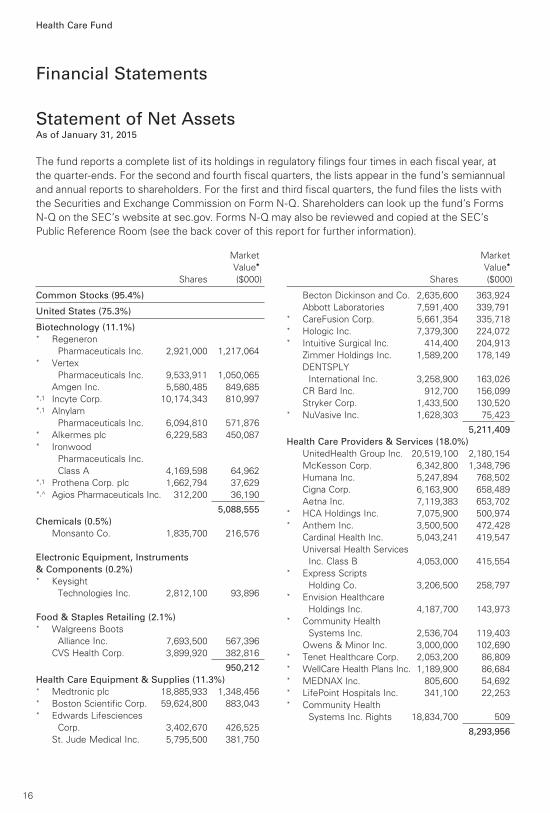
Common Stocks (95.4%)
United States (75.3%)
Biotechnology (11.1%) * Regeneron
Pharmaceuticals Inc. 2,921,000 1,217,064* Vertex
Pharmaceuticals Inc. 9,533,911 1,050,065
Amgen Inc. 5,580,485 849,685*,1 Incyte Corp. 10,174,343 810,997*,1 Alnylam
Pharmaceuticals Inc. 6,094,810 571,876* Alkermes plc 6,229,583 450,087* Ironwood
Pharmaceuticals Inc.
Class A 4,169,598 64,962*,1 Prothena Corp. plc 1,662,794 37,629*,^ Agios Pharmaceuticals Inc. 312,200 36,190
5,088,555
Chemicals (0.5%)
Monsanto Co. 1,835,700 216,576
Electronic Equipment, Instruments
& Components (0.2%) * Keysight
Technologies Inc. 2,812,100 93,896
Food & Staples Retailing (2.1%) * Walgreens Boots
Alliance Inc. 7,693,500 567,396
CVS Health Corp. 3,899,920 382,816
950,212
Health Care Equipment & Supplies (11.3%) * Medtronic plc 18,885,933 1,348,456* Boston Scientific Corp. 59,624,800 883,043* Edwards Lifesciences
Corp. 3,402,670 426,525
St. Jude Medical Inc. 5,795,500 381,750
Becton Dickinson and Co. 2,635,600 363,924
Abbott Laboratories 7,591,400 339,791* CareFusion Corp. 5,661,354 335,718* Hologic Inc. 7,379,300 224,072* Intuitive Surgical Inc. 414,400 204,913
Zimmer Holdings Inc. 1,589,200 178,149
DENTSPLY
International Inc. 3,258,900 163,026
CR Bard Inc. 912,700 156,099
Stryker Corp. 1,433,500 130,520* NuVasive Inc. 1,628,303 75,423
5,211,409
Health Care Providers & Services (18.0%)
UnitedHealth Group Inc. 20,519,100 2,180,154
McKesson Corp. 6,342,800 1,348,796
Humana Inc. 5,247,894 768,502
Cigna Corp. 6,163,900 658,489
Aetna Inc. 7,119,383 653,702* HCA Holdings Inc. 7,075,900 500,974* Anthem Inc. 3,500,500 472,428
Cardinal Health Inc. 5,043,241 419,547
Universal Health Services
Inc. Class B 4,053,000 415,554* Express Scripts
Holding Co. 3,206,500 258,797* Envision Healthcare
Holdings Inc. 4,187,700 143,973* Community Health
Systems Inc. 2,536,704 119,403
Owens & Minor Inc. 3,000,000 102,690* Tenet Healthcare Corp. 2,053,200 86,809* WellCare Health Plans Inc. 1,189,900 86,684* MEDNAX Inc. 805,600 54,692* LifePoint Hospitals Inc. 341,100 22,253* Community Health
Systems Inc. Rights 18,834,700 509
8,293,956
Financial Statements
Statement of Net AssetsAs of January 31, 2015
The fund reports a complete list of its holdings in regulatory filings four times in each fiscal year, at
the quarter-ends. For the second and fourth fiscal quarters, the lists appear in the fund’s semiannual
and annual reports to shareholders. For the first and third fiscal quarters, the fund files the lists with
the Securities and Exchange Commission on Form N-Q. Shareholders can look up the fund’s Forms
N-Q on the SEC’s website at sec.gov. Forms N-Q may also be reviewed and copied at the SEC’s
Public Reference Room (see the back cover of this report for further information).
Health Care Fund
16
Health Care Fund
Market
Value•
Shares ($000)
Market
Value•
Shares ($000)
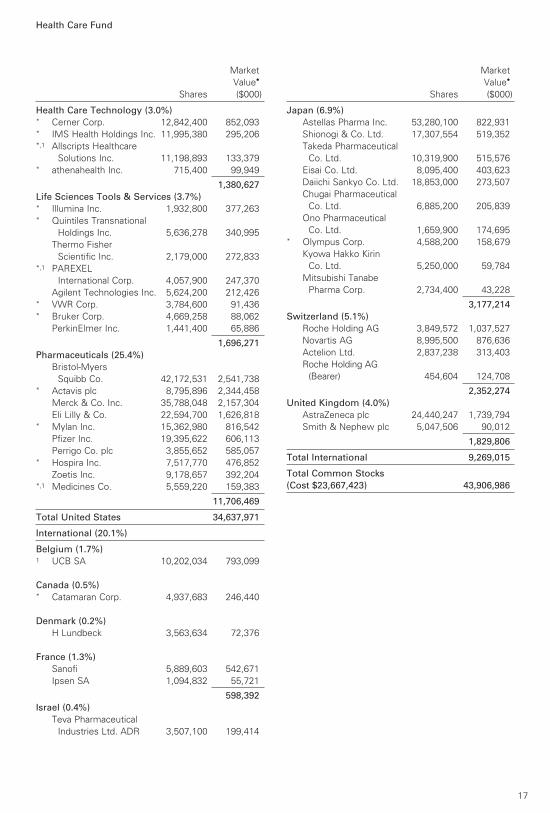
Health Care Technology (3.0%) * Cerner Corp. 12,842,400 852,093* IMS Health Holdings Inc. 11,995,380 295,206*,1 Allscripts Healthcare
Solutions Inc. 11,198,893 133,379* athenahealth Inc. 715,400 99,949
1,380,627
Life Sciences Tools & Services (3.7%) * Illumina Inc. 1,932,800 377,263* Quintiles Transnational
Holdings Inc. 5,636,278 340,995
Thermo Fisher
Scientific Inc. 2,179,000 272,833*,1 PAREXEL
International Corp. 4,057,900 247,370
Agilent Technologies Inc. 5,624,200 212,426* VWR Corp. 3,784,600 91,436* Bruker Corp. 4,669,258 88,062
PerkinElmer Inc. 1,441,400 65,886
1,696,271
Pharmaceuticals (25.4%)
Bristol-Myers
Squibb Co. 42,172,531 2,541,738* Actavis plc 8,795,896 2,344,458
Merck & Co. Inc. 35,788,048 2,157,304
Eli Lilly & Co. 22,594,700 1,626,818* Mylan Inc. 15,362,980 816,542
Pfizer Inc. 19,395,622 606,113
Perrigo Co. plc 3,855,652 585,057* Hospira Inc. 7,517,770 476,852
Zoetis Inc. 9,178,657 392,204*,1 Medicines Co. 5,559,220 159,383
11,706,469
Total United States 34,637,971
International (20.1%)
Belgium (1.7%) 1 UCB SA 10,202,034 793,099
Canada (0.5%) * Catamaran Corp. 4,937,683 246,440
Denmark (0.2%)
H Lundbeck 3,563,634 72,376
France (1.3%)
Sanofi 5,889,603 542,671
Ipsen SA 1,094,832 55,721
598,392
Israel (0.4%)
Teva Pharmaceutical
Industries Ltd. ADR 3,507,100 199,414
Japan (6.9%)
Astellas Pharma Inc. 53,280,100 822,931
Shionogi & Co. Ltd. 17,307,554 519,352
Takeda Pharmaceutical
Co. Ltd. 10,319,900 515,576
Eisai Co. Ltd. 8,095,400 403,623
Daiichi Sankyo Co. Ltd. 18,853,000 273,507
Chugai Pharmaceutical
Co. Ltd. 6,885,200 205,839
Ono Pharmaceutical
Co. Ltd. 1,659,900 174,695* Olympus Corp. 4,588,200 158,679
Kyowa Hakko Kirin
Co. Ltd. 5,250,000 59,784
Mitsubishi Tanabe
Pharma Corp. 2,734,400 43,228
3,177,214
Switzerland (5.1%)
Roche Holding AG 3,849,572 1,037,527
Novartis AG 8,995,500 876,636
Actelion Ltd. 2,837,238 313,403
Roche Holding AG
(Bearer) 454,604 124,708
2,352,274
United Kingdom (4.0%)
AstraZeneca plc 24,440,247 1,739,794
Smith & Nephew plc 5,047,506 90,012
1,829,806
Total International 9,269,015
Total Common Stocks
(Cost $23,667,423) 43,906,986
17
Health Care Fund
Market
Value•
Shares ($000)
Face Market
Amount Value•
($000) ($000)
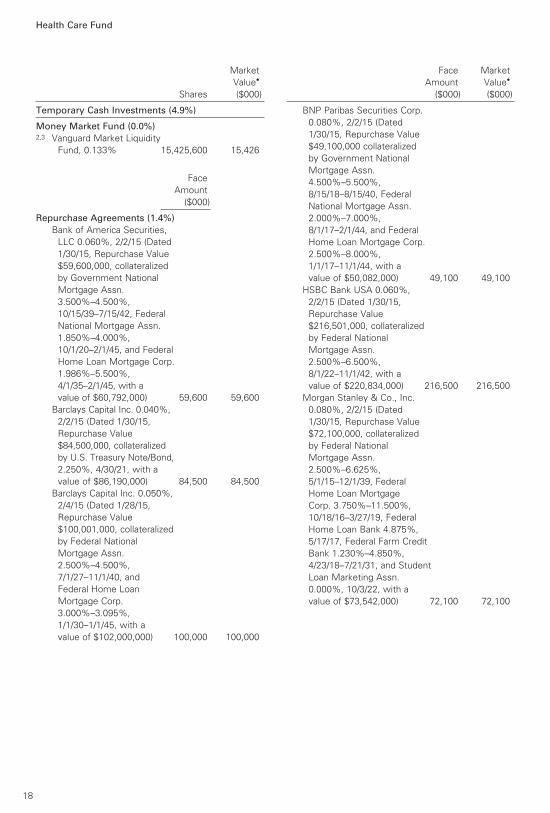
Temporary Cash Investments (4.9%)
Money Market Fund (0.0%)2,3 Vanguard Market Liquidity
Fund, 0.133% 15,425,600 15,426
Face
Amount
($000)
Repurchase Agreements (1.4%)
Bank of America Securities,
LLC 0.060%, 2/2/15 (Dated
1/30/15, Repurchase Value
$59,600,000, collateralized
by Government National
Mortgage Assn.
3.500%–4.500%,
10/15/39–7/15/42, Federal
National Mortgage Assn.
1.850%–4.000%,
10/1/20–2/1/45, and Federal
Home Loan Mortgage Corp.
1.986%–5.500%,
4/1/35–2/1/45, with a
value of $60,792,000) 59,600 59,600
Barclays Capital Inc. 0.040%,
2/2/15 (Dated 1/30/15,
Repurchase Value
$84,500,000, collateralized
by U.S. Treasury Note/Bond,
2.250%, 4/30/21, with a
value of $86,190,000) 84,500 84,500
Barclays Capital Inc. 0.050%,
2/4/15 (Dated 1/28/15,
Repurchase Value
$100,001,000, collateralized
by Federal National
Mortgage Assn.
2.500%–4.500%,
7/1/27–11/1/40, and
Federal Home Loan
Mortgage Corp.
3.000%–3.095%,
1/1/30–1/1/45, with a
value of $102,000,000) 100,000 100,000
BNP Paribas Securities Corp.
0.080%, 2/2/15 (Dated
1/30/15, Repurchase Value
$49,100,000 collateralized
by Government National
Mortgage Assn.
4.500%–5.500%,
8/15/18–8/15/40, Federal
National Mortgage Assn.
2.000%–7.000%,
8/1/17–2/1/44, and Federal
Home Loan Mortgage Corp.
2.500%–8.000%,
1/1/17–11/1/44, with a
value of $50,082,000) 49,100 49,100
HSBC Bank USA 0.060%,
2/2/15 (Dated 1/30/15,
Repurchase Value
$216,501,000, collateralized
by Federal National
Mortgage Assn.
2.500%–6.500%,
8/1/22–11/1/42, with a
value of $220,834,000) 216,500 216,500
Morgan Stanley & Co., Inc.
0.080%, 2/2/15 (Dated
1/30/15, Repurchase Value
$72,100,000, collateralized
by Federal National
Mortgage Assn.
2.500%–6.625%,
5/1/15–12/1/39, Federal
Home Loan Mortgage
Corp. 3.750%–11.500%,
10/18/16–3/27/19, Federal
Home Loan Bank 4.875%,
5/17/17, Federal Farm Credit
Bank 1.230%–4.850%,
4/23/18–7/21/31, and Student
Loan Marketing Assn.
0.000%, 10/3/22, with a
value of $73,542,000) 72,100 72,100
18
19
Health Care Fund
Face Market
Amount Value•
($000) ($000)
Face Market
Amount Value•
($000) ($000)
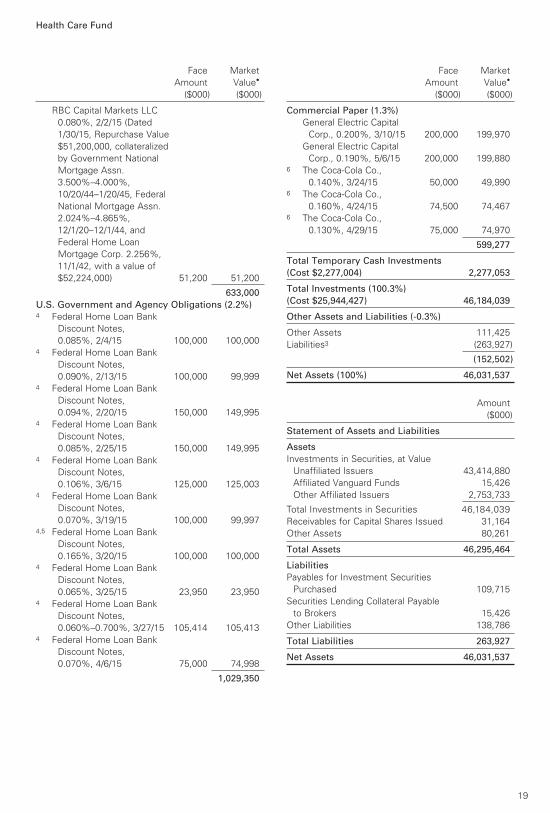
RBC Capital Markets LLC
0.080%, 2/2/15 (Dated
1/30/15, Repurchase Value
$51,200,000, collateralized
by Government National
Mortgage Assn.
3.500%–4.000%,
10/20/44–1/20/45, Federal
National Mortgage Assn.
2.024%–4.865%,
12/1/20–12/1/44, and
Federal Home Loan
Mortgage Corp. 2.256%,
11/1/42, with a value of
$52,224,000) 51,200 51,200
633,000
U.S. Government and Agency Obligations (2.2%) 4 Federal Home Loan Bank
Discount Notes,
0.085%, 2/4/15 100,000 100,0004 Federal Home Loan Bank
Discount Notes,
0.090%, 2/13/15 100,000 99,9994 Federal Home Loan Bank
Discount Notes,
0.094%, 2/20/15 150,000 149,9954 Federal Home Loan Bank
Discount Notes,
0.085%, 2/25/15 150,000 149,9954 Federal Home Loan Bank
Discount Notes,
0.106%, 3/6/15 125,000 125,0034 Federal Home Loan Bank
Discount Notes,
0.070%, 3/19/15 100,000 99,9974,5 Federal Home Loan Bank
Discount Notes,
0.165%, 3/20/15 100,000 100,0004 Federal Home Loan Bank
Discount Notes,
0.065%, 3/25/15 23,950 23,9504 Federal Home Loan Bank
Discount Notes,
0.060%–0.700%, 3/27/15 105,414 105,4134 Federal Home Loan Bank
Discount Notes,
0.070%, 4/6/15 75,000 74,998
1,029,350
Commercial Paper (1.3%)
General Electric Capital
Corp., 0.200%, 3/10/15 200,000 199,970
General Electric Capital
Corp., 0.190%, 5/6/15 200,000 199,8806 The Coca-Cola Co.,
0.140%, 3/24/15 50,000 49,9906 The Coca-Cola Co.,
0.160%, 4/24/15 74,500 74,4676 The Coca-Cola Co.,
0.130%, 4/29/15 75,000 74,970
599,277
Total Temporary Cash Investments
(Cost $2,277,004) 2,277,053
Total Investments (100.3%)
(Cost $25,944,427) 46,184,039
Other Assets and Liabilities (-0.3%)
Other Assets 111,425
Liabilities3 (263,927)
(152,502)
Net Assets (100%) 46,031,537
Amount
($000)
Statement of Assets and Liabilities
Assets
Investments in Securities, at Value
Unaffiliated Issuers 43,414,880
Affiliated Vanguard Funds 15,426
Other Affiliated Issuers 2,753,733
Total Investments in Securities 46,184,039
Receivables for Capital Shares Issued 31,164
Other Assets 80,261
Total Assets 46,295,464
Liabilities
Payables for Investment Securities
Purchased 109,715
Securities Lending Collateral Payable
to Brokers 15,426
Other Liabilities 138,786
Total Liabilities 263,927
Net Assets 46,031,537
Health Care Fund
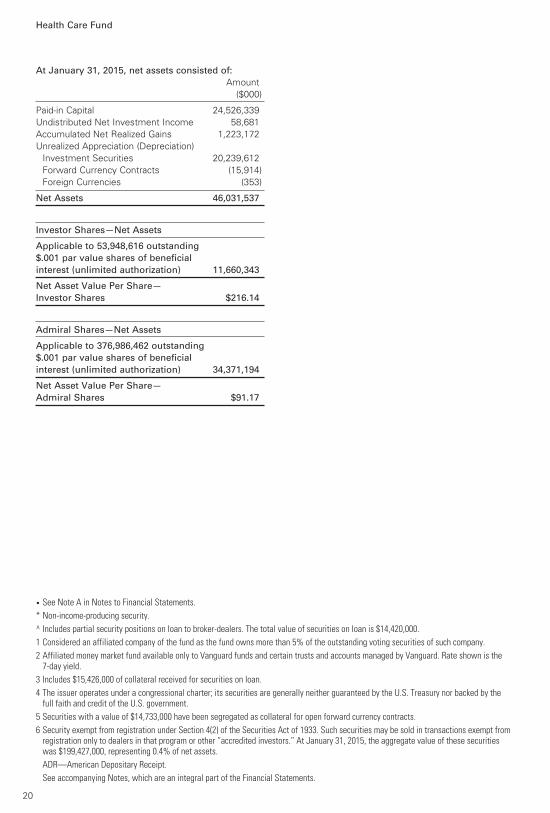
At January 31, 2015, net assets consisted of:
Amount
($000)
Paid-in Capital 24,526,339
Undistributed Net Investment Income 58,681
Accumulated Net Realized Gains 1,223,172
Unrealized Appreciation (Depreciation)
Investment Securities 20,239,612
Forward Currency Contracts (15,914)
Foreign Currencies (353)
Net Assets 46,031,537
Investor Shares—Net Assets
Applicable to 53,948,616 outstanding
$.001 par value shares of beneficial
interest (unlimited authorization) 11,660,343
Net Asset Value Per Share—
Investor Shares $216.14
Admiral Shares—Net Assets
Applicable to 376,986,462 outstanding
$.001 par value shares of beneficial
interest (unlimited authorization) 34,371,194
Net Asset Value Per Share—
Admiral Shares $91.17
• See Note A in Notes to Financial Statements.
* Non-income-producing security.
^ Includes partial security positions on loan to broker-dealers. The total value of securities on loan is $14,420,000.
1 Considered an affiliated company of the fund as the fund owns more than 5% of the outstanding voting securities of such company.
2 Affiliated money market fund available only to Vanguard funds and certain trusts and accounts managed by Vanguard. Rate shown is the 7-day yield.
3 Includes $15,426,000 of collateral received for securities on loan.
4 The issuer operates under a congressional charter; its securities are generally neither guaranteed by the U.S. Treasury nor backed by the full faith and credit of the U.S. government.
5 Securities with a value of $14,733,000 have been segregated as collateral for open forward currency contracts.
6 Security exempt from registration under Section 4(2) of the Securities Act of 1933. Such securities may be sold in transactions exempt from registration only to dealers in that program or other “accredited investors.” At January 31, 2015, the aggregate value of these securities was $199,427,000, representing 0.4% of net assets.
ADR—American Depositary Receipt.
See accompanying Notes, which are an integral part of the Financial Statements.
20
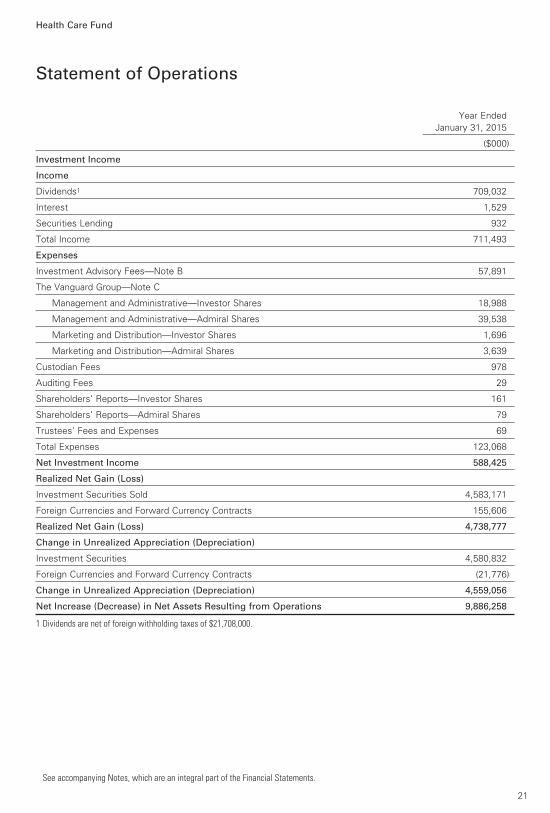
Year Ended
January 31, 2015
($000)
Investment Income
Income
Dividends1 709,032
Interest 1,529
Securities Lending 932
Total Income 711,493
Expenses
Investment Advisory Fees—Note B 57,891
The Vanguard Group—Note C
Management and Administrative—Investor Shares 18,988
Management and Administrative—Admiral Shares 39,538
Marketing and Distribution—Investor Shares 1,696
Marketing and Distribution—Admiral Shares 3,639
Custodian Fees 978
Auditing Fees 29
Shareholders’ Reports—Investor Shares 161
Shareholders’ Reports—Admiral Shares 79
Trustees’ Fees and Expenses 69
Total Expenses 123,068
Net Investment Income 588,425
Realized Net Gain (Loss)
Investment Securities Sold 4,583,171
Foreign Currencies and Forward Currency Contracts 155,606
Realized Net Gain (Loss) 4,738,777
Change in Unrealized Appreciation (Depreciation)
Investment Securities 4,580,832
Foreign Currencies and Forward Currency Contracts (21,776)
Change in Unrealized Appreciation (Depreciation) 4,559,056
Net Increase (Decrease) in Net Assets Resulting from Operations 9,886,258
1 Dividends are net of foreign withholding taxes of $21,708,000.
Statement of Operations
Health Care Fund
See accompanying Notes, which are an integral part of the Financial Statements.
21
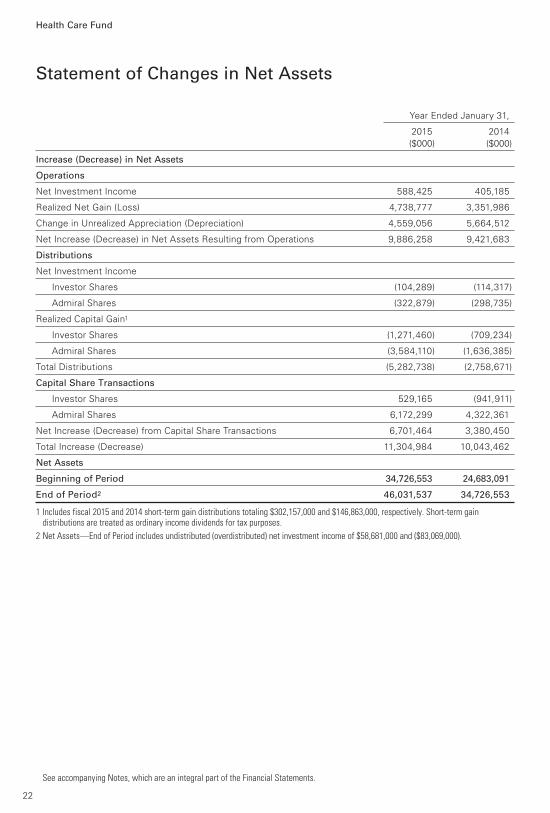
Statement of Changes in Net Assets
Health Care Fund
See accompanying Notes, which are an integral part of the Financial Statements.
Year Ended January 31,
2015 2014
($000) ($000)
Increase (Decrease) in Net Assets
Operations
Net Investment Income 588,425 405,185
Realized Net Gain (Loss) 4,738,777 3,351,986
Change in Unrealized Appreciation (Depreciation) 4,559,056 5,664,512
Net Increase (Decrease) in Net Assets Resulting from Operations 9,886,258 9,421,683
Distributions
Net Investment Income
Investor Shares (104,289) (114,317)
Admiral Shares (322,879) (298,735)
Realized Capital Gain1
Investor Shares (1,271,460) (709,234)
Admiral Shares (3,584,110) (1,636,385)
Total Distributions (5,282,738) (2,758,671)
Capital Share Transactions
Investor Shares 529,165 (941,911)
Admiral Shares 6,172,299 4,322,361
Net Increase (Decrease) from Capital Share Transactions 6,701,464 3,380,450
Total Increase (Decrease) 11,304,984 10,043,462
Net Assets
Beginning of Period 34,726,553 24,683,091
End of Period2 46,031,537 34,726,553
1 Includes fiscal 2015 and 2014 short-term gain distributions totaling $302,157,000 and $146,863,000, respectively. Short-term gain distributions are treated as ordinary income dividends for tax purposes.
2 Net Assets—End of Period includes undistributed (overdistributed) net investment income of $58,681,000 and ($83,069,000).
22
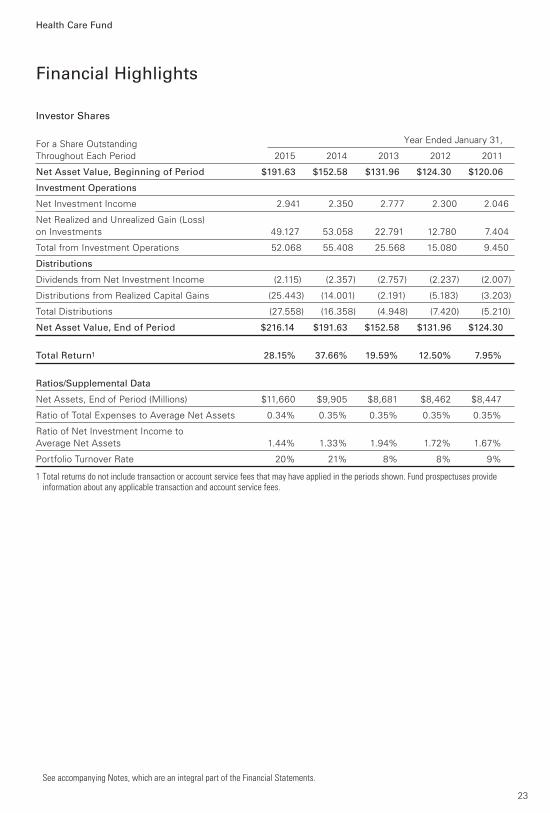
Investor Shares
For a Share Outstanding Year Ended January 31,
Throughout Each Period 2015 2014 2013 2012 2011
Net Asset Value, Beginning of Period $191.63 $152.58 $131.96 $124.30 $120.06
Investment Operations
Net Investment Income 2.941 2.350 2.777 2.300 2.046
Net Realized and Unrealized Gain (Loss)
on Investments 49.127 53.058 22.791 12.780 7.404
Total from Investment Operations 52.068 55.408 25.568 15.080 9.450
Distributions
Dividends from Net Investment Income (2.115) (2.357) (2.757) (2.237) (2.007)
Distributions from Realized Capital Gains (25.443) (14.001) (2.191) (5.183) (3.203)
Total Distributions (27.558) (16.358) (4.948) (7.420) (5.210)
Net Asset Value, End of Period $216.14 $191.63 $152.58 $131.96 $124.30
Total Return1 28.15% 37.66% 19.59% 12.50% 7.95%
Ratios/Supplemental Data
Net Assets, End of Period (Millions) $11,660 $9,905 $8,681 $8,462 $8,447
Ratio of Total Expenses to Average Net Assets 0.34% 0.35% 0.35% 0.35% 0.35%
Ratio of Net Investment Income to
Average Net Assets 1.44% 1.33% 1.94% 1.72% 1.67%
Portfolio Turnover Rate 20% 21% 8% 8% 9%
1 Total returns do not include transaction or account service fees that may have applied in the periods shown. Fund prospectuses provide information about any applicable transaction and account service fees.
Financial Highlights
See accompanying Notes, which are an integral part of the Financial Statements.
Health Care Fund
23
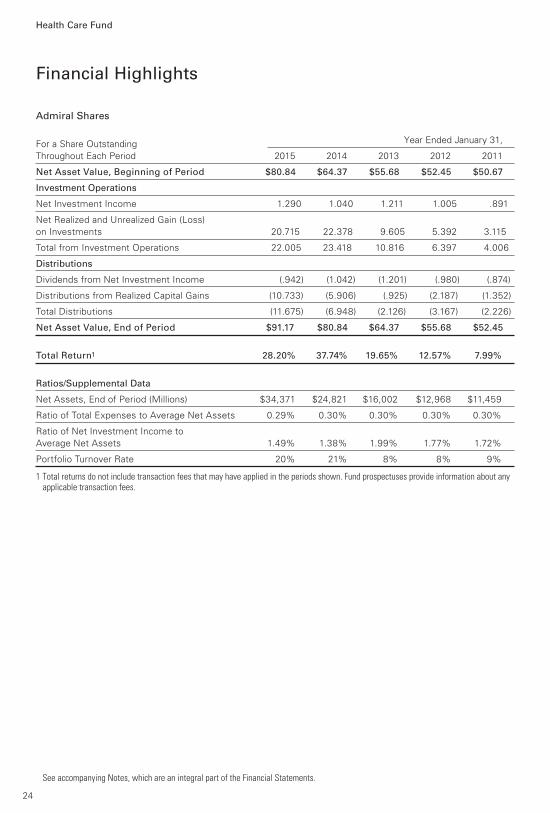
Admiral Shares
For a Share Outstanding Year Ended January 31,
Throughout Each Period 2015 2014 2013 2012 2011
Net Asset Value, Beginning of Period $80.84 $64.37 $55.68 $52.45 $50.67
Investment Operations
Net Investment Income 1.290 1.040 1.211 1.005 .891
Net Realized and Unrealized Gain (Loss)
on Investments 20.715 22.378 9.605 5.392 3.115
Total from Investment Operations 22.005 23.418 10.816 6.397 4.006
Distributions
Dividends from Net Investment Income (.942) (1.042) (1.201) (.980) (.874)
Distributions from Realized Capital Gains (10.733) (5.906) (.925) (2.187) (1.352)
Total Distributions (11.675) (6.948) (2.126) (3.167) (2.226)
Net Asset Value, End of Period $91.17 $80.84 $64.37 $55.68 $52.45
Total Return1 28.20% 37.74% 19.65% 12.57% 7.99%
Ratios/Supplemental Data
Net Assets, End of Period (Millions) $34,371 $24,821 $16,002 $12,968 $11,459
Ratio of Total Expenses to Average Net Assets 0.29% 0.30% 0.30% 0.30% 0.30%
Ratio of Net Investment Income to
Average Net Assets 1.49% 1.38% 1.99% 1.77% 1.72%
Portfolio Turnover Rate 20% 21% 8% 8% 9%
1 Total returns do not include transaction fees that may have applied in the periods shown. Fund prospectuses provide information about any applicable transaction fees.
Financial Highlights
See accompanying Notes, which are an integral part of the Financial Statements.
Health Care Fund
24
Notes to Financial Statements
Health Care Fund
Vanguard Health Care Fund is registered under the Investment Company Act of 1940 as an open-end
investment company, or mutual fund. The fund invests in securities of foreign issuers, which may
subject it to investment risks not normally associated with investing in securities of U.S. corporations.
The fund offers two classes of shares: Investor Shares and Admiral Shares. Investor Shares are available
to any investor who meets the fund’s minimum purchase requirements. Admiral Shares are designed
for investors who meet certain administrative, service, and account-size criteria.
A. The following significant accounting policies conform to generally accepted accounting principles
for U.S. investment companies. The fund consistently follows such policies in preparing its financial
statements.
1. Security Valuation: Securities are valued as of the close of trading on the New York Stock Exchange
(generally 4 p.m., Eastern time) on the valuation date. Equity securities are valued at the latest quoted
sales prices or official closing prices taken from the primary market in which each security trades;
such securities not traded on the valuation date are valued at the mean of the latest quoted bid and
asked prices. Securities for which market quotations are not readily available, or whose values have
been affected by events occurring before the fund’s pricing time but after the close of the securities’
primary markets, are valued at their fair values calculated according to procedures adopted by the
board of trustees. These procedures include obtaining quotations from an independent pricing
service, monitoring news to identify significant market- or security-specific events, and evaluating
changes in the values of foreign market proxies (for example, ADRs, futures contracts, or exchange-
traded funds), between the time the foreign markets close and the fund’s pricing time. When
fair-value pricing is employed, the prices of securities used by a fund to calculate its net asset value
may differ from quoted or published prices for the same securities. Investments in Vanguard Market
Liquidity Fund are valued at that fund’s net asset value. Temporary cash investments acquired over
60 days to maturity are valued using the latest bid prices or using valuations based on a matrix system
(which considers such factors as security prices, yields, maturities, and ratings), both as furnished by
independent pricing services. Other temporary cash investments are valued at amortized cost, which
approximates market value.
2. Foreign Currency: Securities and other assets and liabilities denominated in foreign currencies
are translated into U.S. dollars using exchange rates obtained from an independent third party as
of the fund’s pricing time on the valuation date. Realized gains (losses) and unrealized appreciation
(depreciation) on investment securities include the effects of changes in exchange rates since the
securities were purchased, combined with the effects of changes in security prices. Fluctuations
in the value of other assets and liabilities resulting from changes in exchange rates are recorded as
unrealized foreign currency gains (losses) until the assets or liabilities are settled in cash, at which
time they are recorded as realized foreign currency gains (losses).
3. Forward Currency Contracts: The fund enters into forward currency contracts to protect the value
of securities and related receivables and payables against changes in future foreign exchange rates.
The fund’s risks in using these contracts include movement in the values of the foreign currencies
relative to the U.S. dollar and the ability of the counterparties to fulfill their obligations under the
contracts. The fund mitigates its counterparty risk by entering into forward currency contracts only
with a diverse group of prequalified counterparties, monitoring their financial strength, entering into
master netting arrangements with its counterparties, and requiring its counterparties to transfer
collateral as security for their performance. The master netting arrangements provide that, in the
25
Health Care Fund
event of a counterparty’s default (including bankruptcy), the fund may terminate the forward currency
contracts, determine the net amount owed by either party in accordance with its master netting
arrangements, and sell or retain any collateral held up to the net amount owed to the fund under
the master netting arrangements. The forward currency contracts contain provisions whereby a
counterparty may terminate open contracts if the fund’s net assets decline below a certain level,
triggering a payment by the fund if the fund is in a net liability position at the time of the termination.
The payment amount would be reduced by any collateral the fund has pledged. Any assets pledged
as collateral for open contracts are noted in the Statement of Net Assets. The value of collateral
received or pledged is compared daily to the value of the forward currency contracts exposure
with each counterparty, and any difference, if in excess of a specified minimum transfer amount,
is adjusted and settled within two business days.
Forward currency contracts are valued at their quoted daily prices obtained from an independent third
party, adjusted for currency risk based on the expiration date of each contract. The notional amounts
of the contracts are not recorded in the Statement of Net Assets. Fluctuations in the value of the
contracts are recorded in the Statement of Net Assets as an asset (liability) and in the Statement of
Operations as unrealized appreciation (depreciation) until the contracts are closed, when they are
recorded as realized forward currency contract gains (losses).
During the year ended January 31, 2015, the fund’s average investment in forward currency contracts
represented 2% of net assets, based on the average of notional amounts at each quarter-end during
the period.
4. Repurchase Agreements: The fund enters into repurchase agreements with institutional
counterparties. Securities pledged as collateral to the fund under repurchase agreements are held
by a custodian bank until the agreements mature. Each agreement requires that the market value of
the collateral be sufficient to cover payments of interest and principal. The fund further mitigates its
counterparty risk by entering into repurchase agreements only with a diverse group of prequalified
counterparties, monitoring their financial strength, and entering into master repurchase agreements
with its counterparties. The master repurchase agreements provide that, in the event of a counter-
party’s default (including bankruptcy), the fund may terminate any repurchase agreements with that
counterparty, determine the net amount owed, and sell or retain the collateral up to the net amount
owed to the fund. Such action may be subject to legal proceedings, which may delay or limit the
disposition of collateral.
5. Federal Income Taxes: The fund intends to continue to qualify as a regulated investment company
and distribute all of its taxable income. Management has analyzed the fund’s tax positions taken for
all open federal income tax years (January 31, 2012–2015), and has concluded that no provision for
federal income tax is required in the fund’s financial statements.
6. Distributions: Distributions to shareholders are recorded on the ex-dividend date.
7. Securities Lending: To earn additional income, the fund lends its securities to qualified institutional
borrowers. Security loans are required to be secured at all times by collateral in an amount at least equal
to the market value of securities loaned. Daily market fluctuations could cause the value of loaned
securities to be more or less than the value of the collateral received. When this occurs, the collateral
is adjusted and settled on the next business day. The fund further mitigates its counterparty risk by
entering into securities lending transactions only with a diverse group of prequalified counterparties,
26
Health Care Fund
monitoring their financial strength, and entering into master securities lending agreements with its
counterparties. The master securities lending agreements provide that, in the event of a counterparty’s
default (including bankruptcy), the fund may terminate any loans with that borrower, determine the
net amount owed, and sell or retain the collateral up to the net amount owed to the fund; however,
such actions may be subject to legal proceedings. While collateral mitigates counterparty risk, in the
absence of a default the fund may experience delays and costs in recovering the securities loaned.
The fund invests cash collateral received in Vanguard Market Liquidity Fund, and records a liability
in the Statement of Net Assets for the return of the collateral, during the period the securities are
on loan. Securities lending income represents fees charged to borrowers plus income earned on
invested cash collateral, less expenses associated with the loan.
8. Credit Facility: The fund and certain other funds managed by The Vanguard Group participate in a
$2.89 billion committed credit facility provided by a syndicate of lenders pursuant to a credit agreement
that may be renewed annually; each fund is individually liable for its borrowings, if any, under the
credit facility. Borrowings may be utilized for temporary and emergency purposes, and are subject
to the fund’s regulatory and contractual borrowing restrictions. The participating funds are charged
administrative fees and an annual commitment fee of 0.06% of the undrawn amount of the facility;
these fees are allocated to the funds based on a method approved by the fund’s board of trustees
and included in Management and Administrative expenses on the fund’s Statement of Operations.
Any borrowings under this facility bear interest at a rate equal to the higher of the federal funds rate
or LIBOR reference rate plus an agreed-upon spread.
The fund had no borrowings outstanding at January 31, 2015, or at any time during the period
then ended.
9. Other: Dividend income is recorded on the ex-dividend date. Interest is accrued daily. Premiums
and discounts on debt securities purchased are amortized and accreted, respectively, to interest
income over the lives of the respective securities. Security transactions are accounted for on the
date securities are bought or sold. Costs used to determine realized gains (losses) on the sale of
investment securities are those of the specific securities sold.
Each class of shares has equal rights as to assets and earnings, except that each class separately
bears certain class-specific expenses related to maintenance of shareholder accounts (included in
Management and Administrative expenses) and shareholder reporting. Marketing and distribution
expenses are allocated to each class of shares based on a method approved by the board of trustees.
Income, other non-class-specific expenses, and gains and losses on investments are allocated to
each class of shares based on its relative net assets.
B. Wellington Management Company LLP provides investment advisory services to the fund for
a fee calculated at an annual percentage rate of average net assets. For the year ended January 31,
2015, the investment advisory fee represented an effective annual rate of 0.14% of the fund’s average
net assets.
C. The Vanguard Group furnishes at cost corporate management, administrative, marketing, and
distribution services. The costs of such services are allocated to the fund based on methods approved
by the board of trustees. The fund has committed to invest up to 0.40% of its net assets in Vanguard.
At January 31, 2015, the fund had contributed capital of $4,227,000 to Vanguard (included in Other
Assets), representing 0.01% of the fund’s net assets and 1.69% of Vanguard’s capitalization. The
fund’s trustees and officers are also directors and officers of Vanguard.
27
Health Care Fund
D. Various inputs may be used to determine the value of the fund’s investments. These inputs are
summarized in three broad levels for financial statement purposes. The inputs or methodologies
used to value securities are not necessarily an indication of the risk associated with investing in
those securities.
Level 1—Quoted prices in active markets for identical securities.
Level 2—Other significant observable inputs (including quoted prices for similar securities, interest
rates, prepayment speeds, credit risk, etc.).
Level 3—Significant unobservable inputs (including the fund’s own assumptions used to determine
the fair value of investments).
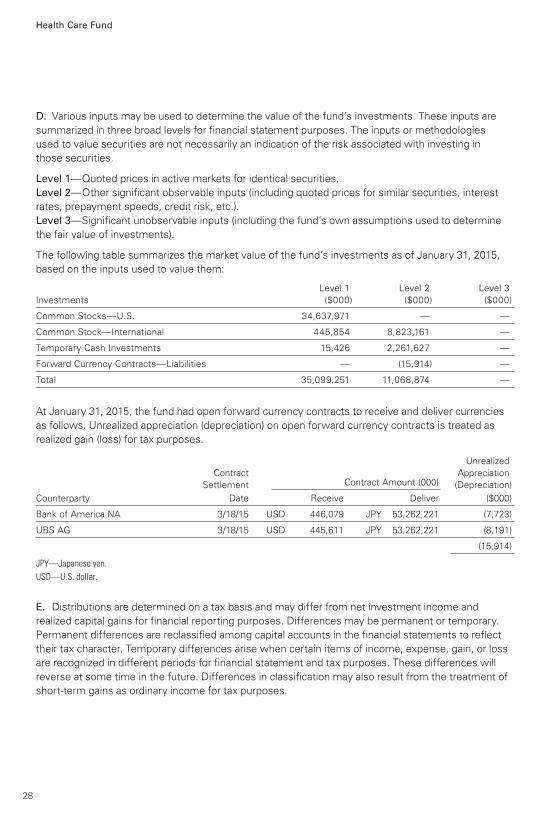
The following table summarizes the market value of the fund’s investments as of January 31, 2015,
based on the inputs used to value them:
Level 1 Level 2 Level 3
Investments ($000) ($000) ($000)
Common Stocks—U.S. 34,637,971 — —
Common Stock—International 445,854 8,823,161 —
Temporary Cash Investments 15,426 2,261,627 —
Forward Currency Contracts—Liabilities — (15,914) —
Total 35,099,251 11,068,874 —
At January 31, 2015, the fund had open forward currency contracts to receive and deliver currencies
as follows. Unrealized appreciation (depreciation) on open forward currency contracts is treated as
realized gain (loss) for tax purposes.
Unrealized
Contract Appreciation
Settlement Contract Amount (000) (Depreciation)
Counterparty Date Receive Deliver ($000)
Bank of America NA 3/18/15 USD 446,079 JPY 53,262,221 (7,723)
UBS AG 3/18/15 USD 445,611 JPY 53,262,221 (8,191)
(15,914)
JPY—Japanese yen.
USD—U.S. dollar.
E. Distributions are determined on a tax basis and may differ from net investment income and
realized capital gains for financial reporting purposes. Differences may be permanent or temporary.
Permanent differences are reclassified among capital accounts in the financial statements to reflect
their tax character. Temporary differences arise when certain items of income, expense, gain, or loss
are recognized in different periods for financial statement and tax purposes. These differences will
reverse at some time in the future. Differences in classification may also result from the treatment of
short-term gains as ordinary income for tax purposes.
28
Health Care Fund
During the year ended January 31, 2015, the fund realized net foreign currency losses of $70,000,
which decreased distributable net income for tax purposes; accordingly, such losses have been
reclassified from accumulated net realized gains to undistributed net investment income. Certain of
the fund’s investments are in securities considered to be passive foreign investment companies, for
which any unrealized appreciation and/or realized gains are required to be included in distributable net
investment income for tax purposes. Passive foreign investment companies held at January 31, 2015,
had unrealized appreciation of $69,005,000, of which all has been distributed and is reflected in the
balance of undistributed net investment income.
The fund used a tax accounting practice to treat a portion of the price of capital shares redeemed
as distributions from net investment income and realized capital gains. Accordingly, the fund has
reclassified $20,800,000 from undistributed net investment income, and $165,401,000 from
accumulated net realized gains, to paid-in capital.
For tax purposes, at January 31, 2015, the fund had $307,756,000 of ordinary income and
$1,075,366,000 of long-term capital gains available for distribution.
At January 31, 2015, the cost of investment securities for tax purposes was $26,013,432,000. Net
unrealized appreciation of investment securities for tax purposes was $20,170,607,000, consisting
of unrealized gains of $20,422,392,000 on securities that had risen in value since their purchase and
$251,785,000 in unrealized losses on securities that had fallen in value since their purchase.
F. During the year ended January 31, 2015, the fund purchased $9,197,460,000 of investment
securities and sold $7,773,571,000 of investment securities, other than temporary cash investments.
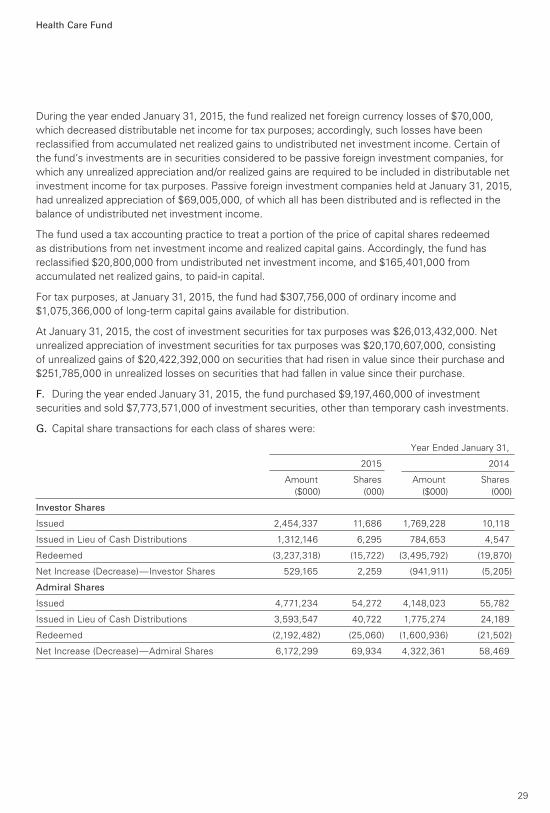
G. Capital share transactions for each class of shares were:
Year Ended January 31,
2015 2014
Amount Shares Amount Shares
($000) (000) ($000) (000)
Investor Shares
Issued 2,454,337 11,686 1,769,228 10,118
Issued in Lieu of Cash Distributions 1,312,146 6,295 784,653 4,547
Redeemed (3,237,318) (15,722) (3,495,792) (19,870)
Net Increase (Decrease)—Investor Shares 529,165 2,259 (941,911) (5,205)
Admiral Shares
Issued 4,771,234 54,272 4,148,023 55,782
Issued in Lieu of Cash Distributions 3,593,547 40,722 1,775,274 24,189
Redeemed (2,192,482) (25,060) (1,600,936) (21,502)
Net Increase (Decrease)—Admiral Shares 6,172,299 69,934 4,322,361 58,469
29
30
Health Care Fund
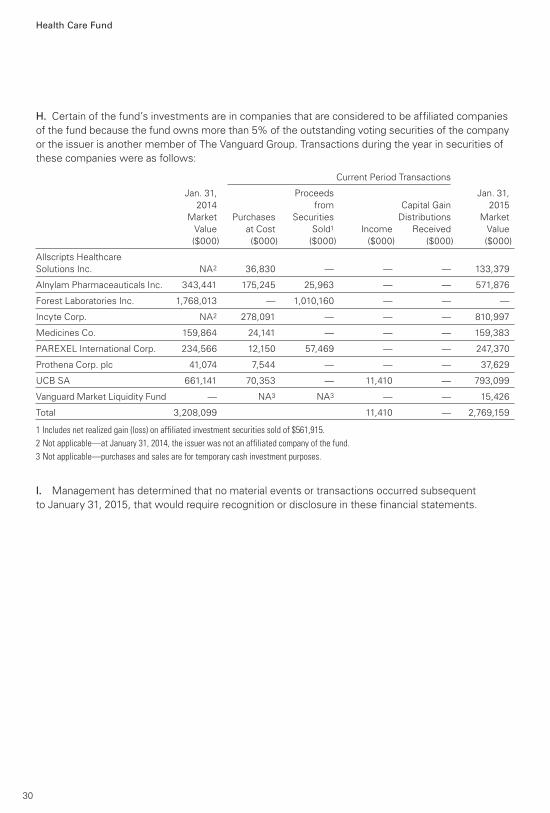
H. Certain of the fund’s investments are in companies that are considered to be affiliated companies
of the fund because the fund owns more than 5% of the outstanding voting securities of the company
or the issuer is another member of The Vanguard Group. Transactions during the year in securities of
these companies were as follows:
Current Period Transactions
Jan. 31, Proceeds Jan. 31,
2014 from Capital Gain 2015
Market Purchases Securities Distributions Market
Value at Cost Sold1 Income Received Value
($000) ($000) ($000) ($000) ($000) ($000)
Allscripts Healthcare
Solutions Inc. NA2 36,830 — — — 133,379
Alnylam Pharmaceauticals Inc. 343,441 175,245 25,963 — — 571,876
Forest Laboratories Inc. 1,768,013 — 1,010,160 — — —
Incyte Corp. NA2 278,091 — — — 810,997
Medicines Co. 159,864 24,141 — — — 159,383
PAREXEL International Corp. 234,566 12,150 57,469 — — 247,370
Prothena Corp. plc 41,074 7,544 — — — 37,629
UCB SA 661,141 70,353 — 11,410 — 793,099
Vanguard Market Liquidity Fund — NA3 NA3 — — 15,426
Total 3,208,099 11,410 — 2,769,159
1 Includes net realized gain (loss) on affiliated investment securities sold of $561,915.
2 Not applicable—at January 31, 2014, the issuer was not an affiliated company of the fund.
3 Not applicable—purchases and sales are for temporary cash investment purposes.
I. Management has determined that no material events or transactions occurred subsequent
to January 31, 2015, that would require recognition or disclosure in these financial statements.
31
To the Board of Trustees of Vanguard Specialized Funds and the Shareholders of Vanguard Health
Care Fund:
In our opinion, the accompanying statement of net assets, statement of assets and liabilities and
the related statements of operations and of changes in net assets and the financial highlights present
fairly, in all material respects, the financial position of Vanguard Health Care Fund (constituting a separate
portfolio of Vanguard Specialized Funds, hereafter referred to as the “Fund”) at January 31, 2015,
the results of its operations for the year then ended, the changes in its net assets for each of the two
years in the period then ended, and the financial highlights for each of the five years in the period then
ended, in conformity with accounting principles generally accepted in the United States of America.
These financial statements and financial highlights (hereafter referred to as “financial statements”)
are the responsibility of the Fund’s management. Our responsibility is to express an opinion on these
financial statements based on our audits. We conducted our audits of these financial statements in
accordance with the standards of the Public Company Accounting Oversight Board (United States).
Those standards require that we plan and perform the audit to obtain reasonable assurance about
whether the financial statements are free of material misstatement. An audit includes examining,
on a test basis, evidence supporting the amounts and disclosures in the financial statements,
assessing the accounting principles used and significant estimates made by management, and
evaluating the overall financial statement presentation. We believe that our audits, which included
confirmation of securities at January 31, 2015 by correspondence with the custodians and brokers,
by agreement to the underlying ownership records of the transfer agent and the application of
alternative auditing procedures where securities purchased had not been received, provide a
reasonable basis for our opinion.
/s/PricewaterhouseCoopers LLP
Philadelphia, Pennsylvania
March 13, 2015
Report of Independent Registered Public Accounting Firm
Special 2014 tax information (unaudited) for Vanguard Health Care Fund
This information for the fiscal year ended January 31, 2015, is included pursuant to provisions of the
Internal Revenue Code.
The fund distributed $4,703,298,000 as capital gain dividends (from net long-term capital gains) to
shareholders during the fiscal year.
For nonresident alien shareholders, 100% of short-term capital gain dividends distributed by the fund
are qualified short-term capital gains.
The fund distributed $528,059,000 of qualified dividend income to shareholders during the fiscal year.
For corporate shareholders, 38.8% of investment income (dividend income plus short-term gains, if
any) qualifies for the dividends-received deduction.
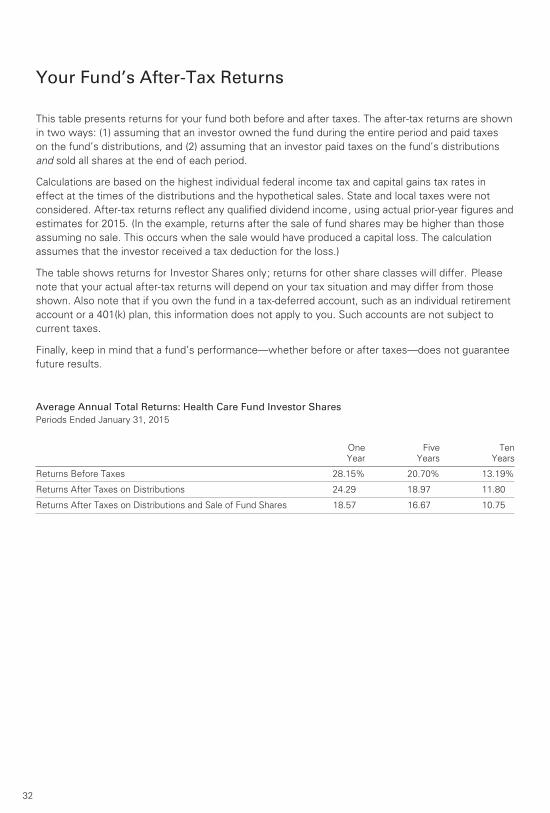
Your Fund’s After-Tax Returns
This table presents returns for your fund both before and after taxes. The after-tax returns are shown
in two ways: (1) assuming that an investor owned the fund during the entire period and paid taxes
on the fund’s distributions, and (2) assuming that an investor paid taxes on the fund’s distributions
and sold all shares at the end of each period.
Calculations are based on the highest individual federal income tax and capital gains tax rates in
effect at the times of the distributions and the hypothetical sales. State and local taxes were not
considered. After-tax returns reflect any qualified dividend income, using actual prior-year figures and
estimates for 2015. (In the example, returns after the sale of fund shares may be higher than those
assuming no sale. This occurs when the sale would have produced a capital loss. The calculation
assumes that the investor received a tax deduction for the loss.)
The table shows returns for Investor Shares only; returns for other share classes will differ. Please
note that your actual after-tax returns will depend on your tax situation and may differ from those
shown. Also note that if you own the fund in a tax-deferred account, such as an individual retirement
account or a 401(k) plan, this information does not apply to you. Such accounts are not subject to
current taxes.
Finally, keep in mind that a fund’s performance—whether before or after taxes—does not guarantee
future results.
Average Annual Total Returns: Health Care Fund Investor Shares Periods Ended January 31, 2015
32
One
Year
Five
Years
Ten
Years
Returns Before Taxes 28.15% 20.70% 13.19%
Returns After Taxes on Distributions 24.29 18.97 11.80
Returns After Taxes on Distributions and Sale of Fund Shares 18.57 16.67 10.75
About Your Fund’s Expenses
As a shareholder of the fund, you incur ongoing costs, which include costs for portfolio management,
administrative services, and shareholder reports (like this one), among others. Operating expenses,
which are deducted from a fund’s gross income, directly reduce the investment return of the fund.
A fund’s expenses are expressed as a percentage of its average net assets. This figure is known as the
expense ratio. The following examples are intended to help you understand the ongoing costs (in
dollars) of investing in your fund and to compare these costs with those of other mutual funds. The
examples are based on an investment of $1,000 made at the beginning of the period shown and held
for the entire period.
The accompanying table illustrates your fund’s costs in two ways:
• Based on actual fund return. This section helps you to estimate the actual expenses that you paid
over the period. The ”Ending Account Value“ shown is derived from the fund‘s actual return, and the
third column shows the dollar amount that would have been paid by an investor who started with
$1,000 in the fund. You may use the information here, together with the amount you invested, to
estimate the expenses that you paid over the period.
To do so, simply divide your account value by $1,000 (for example, an $8,600 account value divided by
$1,000 = 8.6), then multiply the result by the number given for your fund under the heading ”Expenses
Paid During Period.“
• Based on hypothetical 5% yearly return. This section is intended to help you compare your fund‘s
costs with those of other mutual funds. It assumes that the fund had a yearly return of 5% before
expenses, but that the expense ratio is unchanged. In this case—because the return used is not the
fund’s actual return—the results do not apply to your investment. The example is useful in making
comparisons because the Securities and Exchange Commission requires all mutual funds to calculate
expenses based on a 5% return. You can assess your fund’s costs by comparing this hypothetical
example with the hypothetical examples that appear in shareholder reports of other funds.
Note that the expenses shown in the table are meant to highlight and help you compare ongoingcosts only and do not reflect transaction costs incurred by the fund for buying and selling securities.Further, the expenses do not include any purchase, redemption, or account service fees described inthe fund prospectus. If such fees were applied to your account, your costs would be higher. Yourfund does not carry a “sales load.”
The calculations assume no shares were bought or sold during the period. Your actual costs may
have been higher or lower, depending on the amount of your investment and the timing of any
purchases or redemptions.
You can find more information about the fund’s expenses, including annual expense ratios, in the
Financial Statements section of this report. For additional information on operating expenses and
other shareholder costs, please refer to your fund’s current prospectus.
33
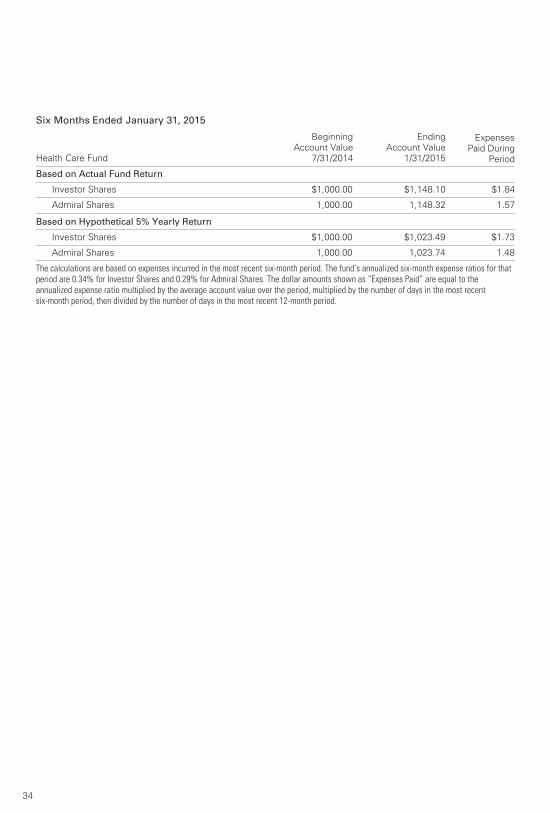
34
Six Months Ended January 31, 2015
Health Care Fund
Beginning
Account Value
7/31/2014
Ending
Account Value
1/31/2015
Expenses
Paid During
Period
Based on Actual Fund Return
Investor Shares $1,000.00 $1,148.10 $1.84
Admiral Shares 1,000.00 1,148.32 1.57
Based on Hypothetical 5% Yearly Return
Investor Shares $1,000.00 $1,023.49 $1.73
Admiral Shares 1,000.00 1,023.74 1.48
The calculations are based on expenses incurred in the most recent six-month period. The fund’s annualized six-month expense ratios for thatperiod are 0.34% for Investor Shares and 0.29% for Admiral Shares. The dollar amounts shown as “Expenses Paid” are equal to theannualized expense ratio multiplied by the average account value over the period, multiplied by the number of days in the most recentsix-month period, then divided by the number of days in the most recent 12-month period.
Glossary
35
30-Day SEC Yield. A fund’s 30-day SEC yield is derived using a formula specified by the U.S.
Securities and Exchange Commission. Under the formula, data related to the fund’s security
holdings in the previous 30 days are used to calculate the fund’s hypothetical net income for that
period, which is then annualized and divided by the fund’s estimated average net assets over the
calculation period. For the purposes of this calculation, a security’s income is based on its current
market yield to maturity (for bonds), its actual income (for asset-backed securities), or its projected
dividend yield (for stocks). Because the SEC yield represents hypothetical annualized income, it will
differ—at times significantly—from the fund’s actual experience. As a result, the fund’s income
distributions may be higher or lower than implied by the SEC yield.
Beta. A measure of the magnitude of a fund’s past share-price fluctuations in relation to the ups and
downs of a given market index. The index is assigned a beta of 1.00. Compared with a given index,
a fund with a beta of 1.20 typically would have seen its share price rise or fall by 12% when the
index rose or fell by 10%. For this report, beta is based on returns over the past 36 months for both
the fund and the index. Note that a fund’s beta should be reviewed in conjunction with its R-squared
(see definition). The lower the R-squared, the less correlation there is between the fund and the
index, and the less reliable beta is as an indicator of volatility.
Dividend Yield. Dividend income earned by stocks, expressed as a percentage of the aggregate
market value (or of net asset value, for a fund). The yield is determined by dividing the amount of the
annual dividends by the aggregate value (or net asset value) at the end of the period. For a fund, the
dividend yield is based solely on stock holdings and does not include any income produced by other
investments.
Earnings Growth Rate. The average annual rate of growth in earnings over the past five years for
the stocks now in a fund.
Equity Exposure. A measure that reflects a fund’s investments in stocks and stock futures. Any
holdings in short-term reserves are excluded.
Expense Ratio. A fund’s total annual operating expenses expressed as a percentage of the fund’s
average net assets. The expense ratio includes management and administrative expenses, but does
not include the transaction costs of buying and selling portfolio securities.
Foreign Holdings. The percentage of a fund represented by securities or depositary receipts of
companies based outside the United States.
Inception Date. The date on which the assets of a fund (or one of its share classes) are first
invested in accordance with the fund’s investment objective. For funds with a subscription period,
the inception date is the day after that period ends. Investment performance is measured from the
inception date.
Median Market Cap. An indicator of the size of companies in which a fund invests; the midpoint of
market capitalization (market price x shares outstanding) of a fund’s stocks, weighted by the
proportion of the fund’s assets invested in each stock. Stocks representing half of the fund’s assets
have market capitalizations above the median, and the rest are below it.
Price/Book Ratio. The share price of a stock divided by its net worth, or book value, per share. For a
fund, the weighted average price/book ratio of the stocks it holds.
36
Price/Earnings Ratio. The ratio of a stock’s current price to its per-share earnings over the past
year. For a fund, the weighted average P/E of the stocks it holds. P/E is an indicator of market
expectations about corporate prospects; the higher the P/E, the greater the expectations for a
company’s future growth.
R-Squared. A measure of how much of a fund’s past returns can be explained by the returns from
the market in general, as measured by a given index. If a fund’s total returns were precisely
synchronized with an index’s returns, its R-squared would be 1.00. If the fund’s returns bore no
relationship to the index’s returns, its R-squared would be 0. For this report, R-squared is based on
returns over the past 36 months for both the fund and the index.
Return on Equity. The annual average rate of return generated by a company during the past five
years for each dollar of shareholder’s equity (net income divided by shareholder’s equity). For a fund,
the weighted average return on equity for the companies whose stocks it holds.
Short-Term Reserves. The percentage of a fund invested in highly liquid, short-term securities that
can be readily converted to cash.
Turnover Rate. An indication of the fund’s trading activity. Funds with high turnover rates incur
higher transaction costs and may be more likely to distribute capital gains (which may be taxable to
investors). The turnover rate excludes in-kind transactions, which have minimal impact on costs.
Benchmark Information
Spliced Health Care Index: S&P 500 Index through December 31, 2001; S&P Health Care Index
through May 31, 2010; MSCI All Country World Health Care Index thereafter.
The People Who Govern Your Fund
The trustees of your mutual fund are there to see that the fund is operated and managed in your best
interests since, as a shareholder, you are a part owner of the fund. Your fund’s trustees also serve on
the board of directors of The Vanguard Group, Inc., which is owned by the Vanguard funds and
provides services to them on an at-cost basis.
A majority of Vanguard’s board members are independent, meaning that they have no affiliation with
Vanguard or the funds they oversee, apart from the sizable personal investments they have made as
private individuals. The independent board members have distinguished backgrounds in business,
academia, and public service. Each of the trustees and executive officers oversees 177 Vanguard funds.
The following table provides information for each trustee and executive officer of the fund. More
information about the trustees is in the Statement of Additional Information, which can be obtained,
without charge, by contacting Vanguard at 800-662-7447, or online at vanguard.com.
Interested Trustee1
F. William McNabb III
Born 1957. Trustee Since July 2009. Chairman of
the Board. Principal Occupation(s) During the Past
Five Years and Other Experience: Chairman of the
Board of The Vanguard Group, Inc., and of each of
the investment companies served by The Vanguard
Group, since January 2010; Director of The Vanguard
Group since 2008; Chief Executive Officer and
President of The Vanguard Group, and of each of
the investment companies served by The Vanguard
Group, since 2008; Director of Vanguard Marketing
Corporation; Managing Director of The Vanguard
Group (1995–2008).
Independent Trustees
Emerson U. Fullwood
Born 1948. Trustee Since January 2008. Principal
Occupation(s) During the Past Five Years and
Other Experience: Executive Chief Staff and
Marketing Officer for North America and Corporate
Vice President (retired 2008) of Xerox Corporation
(document management products and services);
Executive in Residence and 2009–2010 Distinguished
Minett Professor at the Rochester Institute of
Technology; Director of SPX Corporation (multi-industry
manufacturing), the United Way of Rochester,
Amerigroup Corporation (managed health care), the
University of Rochester Medical Center, Monroe
Community College Foundation, and North Carolina
A&T University.
Rajiv L. Gupta
Born 1945. Trustee Since December 2001.2 Principal
Occupation(s) During the Past Five Years and Other
Experience: Chairman and Chief Executive Officer
(retired 2009) and President (2006–2008) of
Rohm and Haas Co. (chemicals); Director of Tyco
International PLC (diversified manufacturing and
services), Hewlett-Packard Co. (electronic computer
manufacturing), and Delphi Automotive PLC
(automotive components); Senior Advisor at New
Mountain Capital.
Amy Gutmann
Born 1949. Trustee Since June 2006. Principal
Occupation(s) During the Past Five Years and
Other Experience: President of the University of
Pennsylvania; Christopher H. Browne Distinguished
Professor of Political Science, School of Arts and
Sciences, and Professor of Communication, Annenberg
School for Communication, with secondary faculty
appointments in the Department of Philosophy, School
of Arts and Sciences, and at the Graduate School of
Education, University of Pennsylvania; Trustee of the
National Constitution Center; Chair of the Presidential
Commission for the Study of Bioethical Issues.
JoAnn Heffernan Heisen
Born 1950. Trustee Since July 1998. Principal
Occupation(s) During the Past Five Years and Other
Experience: Corporate Vice President and Chief
Global Diversity Officer (retired 2008) and Member
of the Executive Committee (1997–2008) of Johnson
& Johnson (pharmaceuticals/medical devices/
consumer products); Director of Skytop Lodge
Corporation (hotels), the University Medical Center
at Princeton, the Robert Wood Johnson Foundation,
and the Center for Talent Innovation; Member of
the Advisory Board of the Institute for Women’s
Leadership at Rutgers University.
F. Joseph Loughrey
Born 1949. Trustee Since October 2009. Principal
Occupation(s) During the Past Five Years and Other
Experience: President and Chief Operating Officer
(retired 2009) of Cummins Inc. (industrial machinery);
Chairman of the Board of Hillenbrand, Inc. (specialized
consumer services), and of Oxfam America; Director
of SKF AB (industrial machinery), Hyster-Yale Materials
Handling, Inc. (forklift trucks), the Lumina Foundation
for Education, and the V Foundation for Cancer
Research; Member of the Advisory Council for the
College of Arts and Letters and of the Advisory Board
to the Kellogg Institute for International Studies, both
at the University of Notre Dame.
Mark Loughridge
Born 1953. Trustee Since March 2012. Principal
Occupation(s) During the Past Five Years and Other
Experience: Senior Vice President and Chief Financial
Officer (retired 2013) at IBM (information technology
services); Fiduciary Member of IBM’s Retirement Plan
Committee (2004–2013); Director of the Dow Chemical
Company; Member of the Council on Chicago Booth.
Scott C. Malpass
Born 1962. Trustee Since March 2012. Principal
Occupation(s) During the Past Five Years and Other
Experience: Chief Investment Officer and Vice
President at the University of Notre Dame; Assistant
Professor of Finance at the Mendoza College of
Business at Notre Dame; Member of the Notre Dame
403(b) Investment Committee; Board Member of
TIFF Advisory Services, Inc., and Catholic Investment
Services, Inc. (investment advisors); Member of
the Investment Advisory Committee of Major
League Baseball.
André F. Perold
Born 1952. Trustee Since December 2004. Principal
Occupation(s) During the Past Five Years and Other
Experience: George Gund Professor of Finance and
Banking, Emeritus at the Harvard Business School
(retired 2011); Chief Investment Officer and Managing
Partner of HighVista Strategies LLC (private investment
firm); Director of Rand Merchant Bank; Overseer of
the Museum of Fine Arts Boston.
Peter F. Volanakis
Born 1955. Trustee Since July 2009. Principal
Occupation(s) During the Past Five Years and Other
Experience: President and Chief Operating Officer
(retired 2010) of Corning Incorporated (communications
equipment); Trustee of Colby-Sawyer College;
Member of the Advisory Board of the Norris Cotton
Cancer Center and of the Advisory Board of the
Parthenon Group (strategy consulting).
Executive Officers
Glenn Booraem
Born 1967. Controller Since July 2010. Principal
Occupation(s) During the Past Five Years and Other
Experience: Principal of The Vanguard Group, Inc.;
Controller of each of the investment companies served
by The Vanguard Group; Assistant Controller of each of
the investment companies served by The Vanguard
Group (2001–2010).
Thomas J. Higgins
Born 1957. Chief Financial Officer Since September
2008. Principal Occupation(s) During the Past Five
Years and Other Experience: Principal of The Vanguard
Group, Inc.; Chief Financial Officer of each of the
investment companies served by The Vanguard Group;
Treasurer of each of the investment companies served
by The Vanguard Group (1998–2008).
Kathryn J. Hyatt
Born 1955. Treasurer Since November 2008. Principal
Occupation(s) During the Past Five Years and Other
Experience: Principal of The Vanguard Group, Inc.;
Treasurer of each of the investment companies served
by The Vanguard Group; Assistant Treasurer of each of
the investment companies served by The Vanguard
Group (1988–2008).
Heidi Stam
Born 1956. Secretary Since July 2005. Principal
Occupation(s) During the Past Five Years and Other
Experience: Managing Director of The Vanguard
Group, Inc.; General Counsel of The Vanguard Group;
Secretary of The Vanguard Group and of each of the
investment companies served by The Vanguard Group;
Director and Senior Vice President of Vanguard
Marketing Corporation.
Vanguard Senior Management Team
Mortimer J. Buckley Chris D. McIsaac
Kathleen C. Gubanich Michael S. Miller
Paul A. Heller James M. Norris
Martha G. King Glenn W. Reed
John T. Marcante
Chairman Emeritus and Senior Advisor
John J. Brennan
Chairman, 1996–2009
Chief Executive Officer and President, 1996–2008
Founder
John C. Bogle
Chairman and Chief Executive Officer, 1974–1996
1 Mr. McNabb is considered an “interested person,” as defined in the Investment Company Act of 1940, because he is an officer of the Vanguard funds.
2 December 2002 for Vanguard Equity Income Fund, the Vanguard Municipal Bond Funds, and the Vanguard State Tax-Exempt Funds.

P.O. Box 2600
Valley Forge, PA 19482-2600
Connect with Vanguard® > vanguard.com
Fund Information > 800-662-7447
Direct Investor Account Services > 800-662-2739
Institutional Investor Services > 800-523-1036
Text Telephone for PeopleWho Are Deaf or Hard of Hearing > 800-749-7273
This material may be used in conjunctionwith the offering of shares of any Vanguardfund only if preceded or accompanied bythe fund’s current prospectus.
All comparative mutual fund data are from Lipper, aThomson Reuters Company, or Morningstar, Inc., unlessotherwise noted.
You can obtain a free copy of Vanguard’s proxy votingguidelines by visiting vanguard.com/proxyreporting or bycalling Vanguard at 800-662-2739. The guidelines arealso available from the SEC’s website, sec.gov. Inaddition, you may obtain a free report on how your fundvoted the proxies for securities it owned during the 12months ended June 30. To get the report, visit eithervanguard.com/proxyreporting or sec.gov.
You can review and copy information about your fund atthe SEC’s Public Reference Room in Washington, D.C. Tofind out more about this public service, call the SEC at202-551-8090. Information about your fund is alsoavailable on the SEC’s website, and you can receivecopies of this information, for a fee, by sending arequest in either of two ways: via e-mail addressed [email protected] or via regular mail addressed to thePublic Reference Section, Securities and ExchangeCommission, Washington, DC 20549-1520.
© 2015 The Vanguard Group, Inc.All rights reserved.Vanguard Marketing Corporation, Distributor.
Q520 032015
CFA® is a registered trademark owned by CFA Institute.