Embed Size (px)
Citation preview
Vanguard Health Care Fund
Annual Report | January 31, 2018

Contents
Please note: The opinions expressed in this report are just that—informed opinions. They should not be considered promisesor advice. Also, please keep in mind that the information and opinions cover the period through the date on the front of thisreport. Of course, the risks of investing in your fund are spelled out in the prospectus.
See the Glossary for definitions of investment terms used in this report.About the cover: Nautical images have been part of Vanguard’s rich heritage since its start in 1975. For anincoming ship, a lighthouse offers a beacon and safe path to shore. You can similarly depend on Vanguard to putyou first––and light the way––as you strive to meet your financial goals. Our client focus and low costs,stemming from our unique ownership structure, assure that your interests are paramount.
Vanguard’s Principles for Investing Success
We want to give you the best chance of investment success. Theseprinciples, grounded in Vanguard’s research and experience, can put you onthe right path.
Goals. Create clear, appropriate investment goals.
Balance. Develop a suitable asset allocation using broadly diversified funds.
Cost. Minimize cost.
Discipline. Maintain perspective and long-term discipline.
A single theme unites these principles: Focus on the things you can control.We believe there is no wiser course for any investor.
Your Fund’s Performance at a Glance. . . . . . . . . . . . . . . . . . 1
CEO’s Perspective. . . . . . . . . . . . . . . . . . . . . . . . . . . . . . . . . 3
Advisor’s Report. . . . . . . . . . . . . . . . . . . . . . . . . . . . . . . . . . . 6
Results of Proxy Voting. . . . . . . . . . . . . . . . . . . . . . . . . . . . 10
Fund Profile. . . . . . . . . . . . . . . . . . . . . . . . . . . . . . . . . . . . . .12
Performance Summary. . . . . . . . . . . . . . . . . . . . . . . . . . . . .14
Financial Statements. . . . . . . . . . . . . . . . . . . . . . . . . . . . . . 16
Your Fund’s After-Tax Returns. . . . . . . . . . . . . . . . . . . . . . . 32
About Your Fund’s Expenses. . . . . . . . . . . . . . . . . . . . . . . . 33
Glossary. . . . . . . . . . . . . . . . . . . . . . . . . . . . . . . . . . . . . . . . 35

Your Fund’s Performance at a Glance
1
Total Returns: Fiscal Year Ended January 31, 2018
TotalReturns
Vanguard Health Care Fund
Investor Shares 22.29%
Admiral™ Shares 22.35
MSCI All Country World Health Care Index 24.26
Global Health/Biotechnology Funds Average 21.68
Global Health/Biotechnology Funds Average: Derived from data provided by Lipper, a Thomson Reuters Company. Admiral Shares carry lower expenses and are available to investors who meet certain account-balance requirements.
Total Returns: Ten Years Ended January 31, 2018
Average
Annual Return
Health Care Fund Investor Shares 12.68%
Spliced Health Care Index 10.23
Global Health/Biotechnology Funds Average 10.91
For a benchmark description, see the Glossary.Global Health/Biotechnology Funds Average: Derived from data provided by Lipper, a Thomson Reuters Company.
The figures shown represent past performance, which is not a guarantee of future results. (Current performance may be lower or higher than the performance data cited. For performance data current to the most recent month-end, visit our website at vanguard.com/performance.) Note, too, that both investment returns and principal value can fluctuate widely, so an investor’s shares, when sold, could be worth more or less than their original cost.
• For the 12 months ended January 31, 2018, Vanguard Health Care Fund returned
22.29% for Investors Shares and 22.35% for Admiral Shares. The fund’s results trailed
the return of the MSCI All Country World Health Care Index (+24.26%) but exceeded
the average return of peer funds (+21.68%).
• U.S. stocks hit record highs as investors cheered tax reform legislation, strong
corporate profits, low unemployment, and solid economic growth. Health care stocks
were among the period’s stronger performers.
• The fund’s advisor, Wellington Management Company LLP, takes a value-oriented
approach to its management of the portfolio.
• The fund’s pharmaceutical stocks lagged their counterparts in the benchmark, but
its biotechnology holdings outperformed.
• For the ten years ended January 31, 2018, the fund posted an average annual return
of about 13%, ahead of its comparative standards.

2
Expense RatiosYour Fund Compared With Its Peer Group
Investor
Shares
Admiral
Shares
Peer Group
Average
Health Care Fund 0.37% 0.32% 1.23%
The fund expense ratios shown are from the prospectus dated May 25, 2017, and represent estimated costs for the current fiscal year. Forthe fiscal year ended January 31, 2018, the fund’s expense ratios were 0.38% for Investor Shares and 0.33% for Admiral Shares. Thepeer-group expense ratio is derived from data provided by Lipper, a Thomson Reuters Company, and captures information throughyear-end 2017.
Peer group: Global Health/Biotechnology Funds.

Dear Shareholder,
When you start a new job, it’s natural
to reflect on both the past and the future.
And so it is in my case, having begun my
service as just the fourth chief executive
in Vanguard’s history.
I feel extremely fortunate to have the
chance to lead a company filled with people
who come to work every day passionate
about Vanguard’s core purpose: to take a
stand for all investors, to treat them fairly,
and to give them the best chance for
investment success.
Making a real difference
When I joined Vanguard in 1991, I found a
mission-driven team focused on improving
lives—helping people retire more com-
fortably, put their children through college,
and achieve financial security. I found
a company with purpose in an industry
ripe for improvement.
It was clear, even early in my career,
that the cards were stacked against most
investors. Hidden fees, performance-
chasing, and poor advice were relentlessly
eroding investors’ dreams.
We knew Vanguard could be different
and, as a result, could make a real
difference. Over the past 25 years, for
example, Vanguard has lowered our funds’
asset-weighted average expense ratio
CEO’s Perspective
Tim Buckley
President and Chief Executive Officer
3

from 0.31% to 0.12%. And over the past
decade, 94% of our funds have beaten
the average annual return of their peers.1
Focused on your success
Vanguard is built for Vanguard investors—
as a client-owned company, we focus
solely on you, our fund shareholders.
Everything we do is designed to give our
clients the best chance for investment
success. In my new role as CEO, I intend
to keep this priority front and center. We’re
proud of what we’ve achieved, but we’re
even more excited about what’s to come.
As I write this, we’ve experienced a
period of pronounced market volatility.
Strong economic growth and budding
signs of inflation have raised concerns
about a more aggressive Federal Reserve.
Although volatility can test investors’
nerves, we sometimes think of this as
“Vanguard weather”—a time when having
a disciplined, low-cost, and long-term
approach to investment management
serves investors well.
Market Barometer
Average Annual Total Returns
Periods Ended January 31, 2018
One Year Three Years Five Years
Stocks
Russell 1000 Index (Large-caps) 25.84% 14.28% 15.72%
Russell 2000 Index (Small-caps) 17.18 12.12 13.33
Russell 3000 Index (Broad U.S. market) 25.16 14.11 15.53
FTSE All-World ex US Index (International) 29.63 10.20 7.48
Bonds
Bloomberg Barclays U.S. Aggregate Bond Index
(Broad taxable market) 2.15% 1.14% 2.01%
Bloomberg Barclays Municipal Bond Index
(Broad tax-exempt market) 3.52 1.97 2.69
Citigroup Three-Month U.S. Treasury Bill Index 0.91 0.41 0.25
CPI
Consumer Price Index 2.07% 1.98% 1.48%
The performance data shown represent past performance, which is not a guarantee of future results.
1 For the ten-year period through December 31, 2017, 9 of 9 Vanguard money market funds, 56 of 60 bond funds, 21 of 22 balanced funds, and 131 of 140 stock funds, or 217 of 231 Vanguard funds, outperformed their peer-group averages. Sources: Vanguard, based on data from Lipper, a Thomson Reuters Company.
4

Steady, time-tested guidance
Our guidance for investors, as always, is
to stay the course, tune out the hyperbolic
headlines, and focus on your goals and
what you can control, such as costs and
how much you save. This time-tested
advice has served our clients well over
the decades.
Regardless of how the markets perform
in the short term, I’m incredibly optimistic
about the future for our investors. We have
a dedicated team serving you, and we will
never stop striving to make Vanguard the
best place for you to invest through our
high-quality funds and services, advice and
guidance to help you meet your financial
goals, and an experience that makes you
feel good about entrusting us with your
hard-earned savings.
Thank you for your continued loyalty.
Sincerely,
Mortimer J. Buckley
President and Chief Executive Officer
February 15, 2018
5

Advisor’s Report
6
For the fiscal year ended January 31,
2018, Vanguard Health Care Fund
returned 22.29% for Investor Shares and
22.35% for Admiral Shares. The fund
underper formed the 24.26% return of its
benchmark, the MSCI All Country World
Health Care Index, but outperformed the
21.68% average return of global health/
biotechnology funds.
The investment environmentWe view the health care sector through a
custom lens of subsectors. We combine
biotechnology and pharmaceuticals and
think of them in terms of capitalization:
biopharma small-cap, biopharma mid-
cap, and biopharma large-cap. The other
subsectors are health care services and
medical technology.
Medical technology was the index’s top-
performing subsector during the period;
health care services came in second.
Biopharma mid-caps and biopharma large-
caps lagged. Small-cap biopharma ceuticals
are not meaningfully represented in the
benchmark.
Our successesStock selection was strongest in the
biopharma mid-cap subsector. Our
underweighted allocation to biopharma
large-caps helped the fund’s relative
performance.
Alnylam Pharmaceuticals, in the biopharma
mid-cap subsector, was the fund’s top
relative performer. In the third quarter of
2017, Alnylam reported excellent Phase 3
results for its lead small interfering RNA
(siRNA) drug Patisiran for the treatment of
hereditary ATTR amyloidosis, a rare genetic
disorder that affects the heart and other
organs and the nervous system, leading
to early death. The results provide strong
proof of concept for Alnylam’s RNA
interference program and bode well for the
company’s other late-stage therapeutics,
including Givosiran and Inclisiran.
Another top contributor to the fund’s
relative performance during the period
was Vertex Pharmaceuticals, in the
biopharma large-cap subsector. Shares
of Vertex returned more than 94% for
the year as the company announced
positive clinical data from three different
three-drug combination regimens for cystic
fibrosis—a significant milestone in the
treatment of the disease. We trimmed
our large position into this strength but
remain enthusiastic about both the
breakthrough nature of the results and
the possibility that this combination
regimen could treat the majority of
cystic fibrosis patients.
Japanese large-cap biopharma Chugai
Pharmaceutical also boosted the fund’s
relative results, returning over 80% for
the year. Chugai, and its partner Roche,
received approval for novel hemophilia
drug Hemlibra for patients with factor
VIII inhibitors and also reported positive
Phase 3 results in patients without
inhibitors to factor VIII. We expect the
company to disrupt the hemophilia space.
7
Our shortfallsStock selection was weakest in the
biopharma large-cap and health care
services subsectors. An underweighted
allocation to medical technology stocks
(the benchmark’s best-performing
subsector) also detracted. And the
fund’s frictional cash position (roughly
3% of assets) held back relative results.
Among biopharma large-cap companies,
our positions in Allergan and Incyte
weighed on relative results, as did our
avoidance of benchmark constituents
AbbVie and Novo Nordisk, both of which
performed well during the period.
Allergan’s shares declined amid investor
concern over early generic entries for some
of its legacy franchises. Most notable of
these is the potential entry in 2018 of a
generic product for dry eye disease that
would compete with the company’s
blockbuster drug Restasis. We had already
factored in such competition into our base
case assumptions, but this competition did
come earlier than we originally expected.
Although the company’s near-term
earnings will decline, we believe the
market under estimates the durability and
growth rate of the majority of Allergan’s
business—especially its market-leading
medical aesthetics franchise. We also
believe that Allergan’s compelling pipeline
opportunities, particularly its Phase 3
migraine and depression assets, aren’t
adequately priced into its stock.
In the health care services subsector,
our positions in Walgreens Boots Alliance
and Envision Healthcare detracted most.
Shares of pharmacies, including Walgreens
Boots Alliance, fell on concerns that
Amazon might enter the drug supply chain
business. Amazon has shown no sign that
it intends to enter this space. Even if it
did so, however, we believe it would pose
more of a threat to the front-end of the
pharmacy business than it would to the
more specialized and heavily regulated
back-end prescription business. We
maintain conviction in Walgreens’ strategy
of entering into innovative partnerships,
such as its collaboration with UnitedHealth
Group on urgent care clinics, to drive
long-term profit growth.
The fund’s positioning and outlookAt the end of the fiscal year, we held
about 25% of the fund’s assets in
non-U.S. investments, a level that has
remained fairly stable over recent years.
Our non-U.S. holdings were primarily
domiciled in Japan, the United Kingdom,
Switzerland, Belgium, and Israel, but many
of them operate globally. We believe this
strategy provides diversification for
shareholders over the long term.
The portfolio consisted of 85 companies
across all subsectors of health care. This
figure was up from a year ago, when we
held 75 equity names, because we took
advantage of valuation opportunities to
initiate modest positions in a number

8
of Chinese health care and biopharma
stocks, including BeiGene, Bluebird Bio,
and Galapagos. The fund’s ten largest
holdings represented a significant
portion—about 40%—of its assets.
The health care sector has generally
performed well since the November 2016
U.S. elections. To an extent, its perfor-
mance has been driven by a recovery in
valuations as election-year worries abated.
There were, however, two other, more
important drivers at play: significant
biopharmaceutical innovation, and
better-than-expected growth trends
across medical technology and many
health care service subsectors.
We believe many of these trends will
continue into 2018, though we know
uncertainties remain. We are mindful
of the risks posed for some biopharma
companies by intensifying competition,
enhanced transparency, realigned
incentives, and ongoing challenges
with affordability.
Regarding efforts to repeal the Affordable
Care Act (ACA), we believe that many if
not most of the millions of Americans who
obtained insurance coverage in the past
few years will retain coverage in some
form. That said, with the 2017 Tax Cut and
Jobs Bill’s repeal of the ACA’s individual
mandate, the number of Americans
without health insurance is likely to trend
upward over time.
We seek companies that look to provide
solutions to the challenges facing the
health care delivery system globally by
shifting focus from volumes to value.
Over the long term, the tailwinds of
innovation, an aging population, and the
globalization of demand for cutting-edge,
Western-style health care should continue
to drive growth. And we believe that
we are favorably positioned with the
resources to capitalize on this.
A core tenet of our philosophy is the
importance of using a longer-term horizon
to evaluate secular themes and health care
trends, as well as individual companies, on
a global scale. This should enable our team
to identify pockets of opportunity in health
care that are best positioned to create
value and generate sustainable, innovation-
driven, differentiated growth. We will
remain diversified across subsectors and
regions, focused on the long haul, and
positioned in what we believe to be the
most attractive stocks as we seek to
generate strong, risk-adjusted returns.
As always, we thank you very much for
your continued confidence and support as
an investor in Vanguard Health Care Fund.
Jean M. Hynes, CFA
Senior Managing Director and
Portfolio Manager
Wellington Management Company LLP
February 16, 2018

9
Major Portfolio ChangesYear ended January 31, 2018
Additions Comments
Danaher Danaher Corporation has historically been seen as an industrials
company, but their business lines in the health care sector now
represent the majority of their revenue. Within life sciences,
they have targeted markets that offer good organic growth from
long-cycled industry trends and relatively low cyclicality, resulting
in high recurring revenues and free cash flow growth. We are
particularly attracted to Danaher’s strong management team,
corporate culture, and demonstrated ability to improve business
performance.
CVS Health We initiated a new position in CVS Health toward the end of the
period. The fund has held CVS previously. We decided to reenter
CVS in late 2017. The stock had underperformed significantly in
the prior 12 months, allowing us a nice valuation entry opportunity;
in addition, we believe the CVS/Aetna merger will allow CVS to
use its real estate footprint to move more aggressively to low-
acuity patient care in a low-cost setting.
Essilor We initiated a new position in French medical technology company
Essilor, which dominates the manufacturing of eyeglass lenses
globally. The proposed vertical merger of Luxottica, which
dominates eyeglass frames, should lead to increasingly innovative
solutions for vision correction.
Reductions Comments
Becton Dickinson We eliminated Becton Dickinson. While we remain positive
on its fundamentals, the company has a large integration ahead
of it with the Bard acquisition. Its near-term leverage has also
increased significantly. We are keeping our eye on this name
but have decided to not own it until we see a more positive
risk-reward profile.
Olympus We eliminated our position in Olympus, a Japan-based medical
equipment company, and invested the proceeds into Sysmex and
Terumo, as we believe their innovation in diagnostics (Sysmex)
and hospital supplies (Terumo) offer more upside.
Results of Proxy Voting
At a special meeting of shareholders on November 15, 2017, fund shareholders approved the
following proposals:
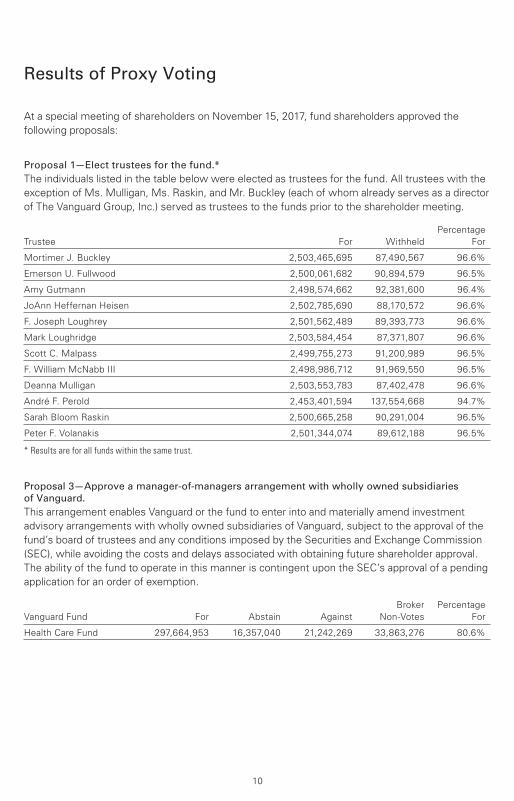
Proposal 1—Elect trustees for the fund.*
The individuals listed in the table below were elected as trustees for the fund. All trustees with the
exception of Ms. Mulligan, Ms. Raskin, and Mr. Buckley (each of whom already serves as a director
of The Vanguard Group, Inc.) served as trustees to the funds prior to the shareholder meeting.
Percentage
Trustee For Withheld For
Mortimer J. Buckley 2,503,465,695 87,490,567 96.6%
Emerson U. Fullwood 2,500,061,682 90,894,579 96.5%
Amy Gutmann 2,498,574,662 92,381,600 96.4%
JoAnn Heffernan Heisen 2,502,785,690 88,170,572 96.6%
F. Joseph Loughrey 2,501,562,489 89,393,773 96.6%
Mark Loughridge 2,503,584,454 87,371,807 96.6%
Scott C. Malpass 2,499,755,273 91,200,989 96.5%
F. William McNabb III 2,498,986,712 91,969,550 96.5%
Deanna Mulligan 2,503,553,783 87,402,478 96.6%
André F. Perold 2,453,401,594 137,554,668 94.7%
Sarah Bloom Raskin 2,500,665,258 90,291,004 96.5%
Peter F. Volanakis 2,501,344,074 89,612,188 96.5%
* Results are for all funds within the same trust.
Proposal 3—Approve a manager-of-managers arrangement with wholly owned subsidiaries of Vanguard.
This arrangement enables Vanguard or the fund to enter into and materially amend investment
advisory arrangements with wholly owned subsidiaries of Vanguard, subject to the approval of the
fund’s board of trustees and any conditions imposed by the Securities and Exchange Commission
(SEC), while avoiding the costs and delays associated with obtaining future shareholder approval.
The ability of the fund to operate in this manner is contingent upon the SEC’s approval of a pending
application for an order of exemption.
Broker Percentage
Vanguard Fund For Abstain Against Non-Votes For
Health Care Fund 297,664,953 16,357,040 21,242,269 33,863,276 80.6%
10

Fund shareholders did not approve the following proposal:
Proposal 7—Institute transparent procedures to avoid holding investments in companies that, in
management’s judgment, substantially contribute to genocide or crimes against humanity, the most
egregious violations of human rights. Such procedures may include time-limited engagement with
problem companies if management believes that their behavior can be changed.
The trustees recommended a vote against the proposal for the following reasons: (1) Vanguard
is fully compliant with all applicable U.S. laws and regulations that prohibit the investment in any
company owned or controlled by the government of Sudan; (2) the addition of further investment
constraints is not in fund shareholders’ best interests if those constraints are unrelated to a fund’s
stated investment objective, policies, and strategies; and (3) divestment is an ineffective means
to implement social change, as it often puts the shares into the hands of another owner with
no direct impact to the company’s capitalization.
Broker Percentage
Vanguard Fund For Abstain Against Non-Votes For
Health Care Fund 86,886,122 26,082,934 222,295,206 33,863,276 23.5%
11

Health Care Fund
Fund ProfileAs of January 31, 2018
1 The expense ratios shown are from the prospectus dated May 25, 2017, and represent estimated costs for the current fiscal year. For the fiscal year ended January 31, 2018, the expense ratios were 0.38% for Investor Shares and 0.33% for Admiral Shares.
12
Volatility Measures
MSCI
ACWI
Health
Care
DJ
U.S. Total
Market
FA Index
R-Squared 0.93 0.58
Beta 1.01 0.94
These measures show the degree and timing of the fund’s fluctuations compared with the indexes over 36 months.
Share-Class Characteristics
InvestorShares
AdmiralShares
Ticker Symbol VGHCX VGHAX
Expense Ratio1 0.37% 0.32%
30-Day SEC Yield 1.09% 1.14%
Ten Largest Holdings (% of total net assets)
Bristol-Myers Squibb Co. Pharmaceuticals 6.2%
UnitedHealth Group Inc. Managed Health
Care 5.9
AstraZeneca plc Pharmaceuticals 5.1
Allergan plc Pharmaceuticals 4.8
Eli Lilly & Co. Pharmaceuticals 4.1
Merck & Co. Inc. Pharmaceuticals 3.1
Vertex Pharmaceuticals
Inc. Biotechnology 2.8
Medtronic plc Health Care
Equipment 2.7
Mylan NV Pharmaceuticals 2.6
Biogen Inc. Biotechnology 2.6
Top Ten 39.9%
The holdings listed exclude any temporary cash investments andequity index products.
Portfolio Characteristics
Fund
MSCI
ACWI
Health
Care
DJ
U.S. Total
Market
FA Index
Number of Stocks 86 173 3,765
Median Market Cap $50.8B $89.9B $73.6B
Price/Earnings Ratio 26.1x 25.2x 23.8x
Price/Book Ratio 3.2x 3.8x 3.2x
Return on Equity 13.4% 16.6% 14.9%
Earnings Growth
Rate -0.4% 3.3% 9.1%
Dividend Yield 1.5% 1.8% 1.7%
Foreign Holdings 24.5% 33.4% 0.0%
Turnover Rate 11% — —
Short-Term Reserves 3.0% — —

Health Care Fund
Subindustry Diversification (% of equity exposure)
Fund
MSCIACWIHealth
Care
Biotechnology 15.4% 17.3%
Consumer Staples 1.9 0.0
Health Care Distributors 3.6 2.1
Health Care Equipment 11.8 15.2
Health Care Facilities 3.7 1.4
Health Care Services 0.4 3.2
Health Care Supplies 0.8 2.2
Health Care Technology 2.6 0.7
Life Sciences Tools &Services 3.0 4.6
Managed Health Care 11.6 9.1
Pharmaceuticals 44.9 44.2
Real Estate 0.3 0.0
Sector categories are based on the Global Industry ClassificationStandard (“GICS”), except for the “Other” category (if applicable),which includes securities that have not been provided a GICSclassification as of the effective reporting period.
13
Market Diversification (% of equity exposure)
Emerging Markets 0.4%
Europe
United Kingdom 5.8%
Switzerland 4.4
Belgium 2.2
Other 1.8
Subtotal 14.2%
Middle East
Israel 1.3%
North America
United States 74.7%
Pacific
Japan 9.4%

All of the returns in this report represent past performance, which is not a guarantee of future results that may be achieved by the fund. (Current performance may be lower or higher thanthe performance data cited. For performance data current to the most recent month-end, visitour website at vanguard.com/performance.) Note, too, that both investment returns and principal value can fluctuate widely, so an investor’s shares, when sold, could be worth more or less than their original cost. The returns shown do not reflect taxes that a shareholder would pay
on fund distributions or on the sale of fund shares.
Health Care Fund
Performance Summary
See Financial Highlights for dividend and capital gains information.
14
Cumulative Performance: January 31, 2008, Through January 31, 2018Initial Investment of $10,000
2018201720162015201420132012201120102009
$42,000
3,000
33,006
Average Annual Total Returns
Periods Ended January 31, 2018
OneYear
FiveYears
TenYears
Final Valueof a $10,000Investment
Health Care Fund Investor Shares 22.29% 17.36% 12.68% $33,006
• • • • • • • • Spliced Health Care Index 24.26 13.52 10.23 26,479
– – – – Global Health/Biotechnology FundsAverage 21.68 15.61 10.91 28,168
________ Dow Jones U.S. Total Stock MarketFloat Adjusted Index 25.16 15.48 9.91 25,724
For a benchmark description, see the Glossary.
Global Health/Biotechnology Funds Average: Derived from data provided by Lipper, a Thomson Reuters Company.
OneYear
FiveYears
TenYears
Final Valueof a $50,000Investment
Health Care Fund Admiral Shares 22.35% 17.42% 12.74% $165,926
Spliced Health Care Index 24.26 13.52 10.23 132,397
Dow Jones U.S. Total Stock Market FloatAdjusted Index 25.16 15.48 9.91 128,619

Health Care Fund
15
Fiscal-Year Total Returns (%): January 31, 2008, Through January 31, 2018
–17.44 –19.91
2009
23.63 21.80
2010
7.95 5.41
2011
12.50 10.99
2012
19.5923.08
2013
37.66
27.55
2014
28.15
20.22
2015
0.49
–4.19
2016
2.71 3.27
2017
22.29 24.26
2018
Health Care Fund Investor Shares
Spliced Health Care Index
For a benchmark description, see the Glossary.
Average Annual Total Returns: Periods Ended December 31, 2017 This table presents returns through the latest calendar quarter—rather than through the end of the fiscal period.
Securities and Exchange Commission rules require that we provide this information.
Inception Date One Year Five Years Ten Years
Investor Shares 5/23/1984 19.61% 17.68% 11.73%
Admiral Shares 11/12/2001 19.66 17.74 11.79

Market
Value•
Shares ($000)
Market
Value•
Shares ($000)
Common Stocks (97.0%)
United States (72.5%)
Biotechnology (14.2%) * Vertex Pharmaceuticals
Inc. 8,248,558 1,376,437* Biogen Inc. 3,636,003 1,264,638* Regeneron
Pharmaceuticals Inc. 2,905,225 1,065,201*,1 Alnylam
Pharmaceuticals Inc. 6,670,468 867,028* Incyte Corp. 9,466,973 854,773*,1 Alkermes plc 9,069,176 518,485*,1 Agios Pharmaceuticals
Inc. 4,353,124 342,852*,1 TESARO Inc. 2,996,631 202,153* Ionis Pharmaceuticals
Inc. 2,119,180 111,299* Portola Pharmaceuticals
Inc. 2,009,962 103,131*,^,1 Prothena Corp. plc 2,150,294 89,882* Bluebird Bio Inc. 378,528 77,560*,^ Ironwood
Pharmaceuticals Inc.
Class A 4,594,407 68,043* BeiGene Ltd. ADR 305,865 41,521
6,983,003
Equity Real Estate Investment Trusts
(REITs) (0.3%)
Alexandria Real Estate
Equities Inc. 1,162,300 150,750
Food & Staples Retailing (1.8%)
Walgreens Boots
Alliance Inc. 8,048,160 605,705
CVS Health Corp. 3,626,218 285,347
891,052
Health Care Equipment & Supplies (10.6%)
Medtronic plc 15,408,784 1,323,460
Abbott Laboratories 18,155,881 1,128,569* Boston Scientific Corp. 39,670,204 1,109,179
Baxter International Inc. 6,230,791 448,804
Danaher Corp. 3,798,100 384,672
Stryker Corp. 1,654,500 271,967* Hologic Inc. 4,014,000 171,398* DexCom Inc. 2,606,600 151,704* Intuitive Surgical Inc. 166,328 71,799
Dentsply Sirona Inc. 1,026,390 62,415* Edwards Lifesciences
Corp. 466,355 59,031
5,182,998
Health Care Providers & Services (18.8%)
UnitedHealth Group Inc. 12,196,185 2,887,813
McKesson Corp. 7,162,604 1,209,621
Cigna Corp. 5,049,352 1,052,032* HCA Healthcare Inc. 10,018,378 1,013,459
Aetna Inc. 4,051,023 756,812
Universal Health
Services Inc. Class B 4,644,600 564,319
Cardinal Health Inc. 6,936,246 497,953
Anthem Inc. 1,973,833 489,215* WellCare Health Plans
Inc. 1,061,400 223,297* Envision Healthcare
Corp. 5,773,390 207,784*,1 Acadia Healthcare
Co. Inc. 4,601,355 156,814* Centene Corp. 668,300 71,668
Humana Inc. 215,600 60,763* LifePoint Health Inc. 341,100 16,867* Community Health
Systems Inc. CVR 18,834,700 132
9,208,549
Financial Statements
Statement of Net AssetsAs of January 31, 2018
The fund reports a complete list of its holdings in regulatory filings four times in each fiscal year, at
the quarter-ends. For the second and fourth fiscal quarters, the lists appear in the fund’s semiannual
and annual reports to shareholders. For the first and third fiscal quarters, the fund files the lists with
the Securities and Exchange Commission on Form N-Q. Shareholders can look up the fund’s Forms
N-Q on the SEC’s website at sec.gov. Forms N-Q may also be reviewed and copied at the SEC’s
Public Reference Room (see the back cover of this report for further information).
Health Care Fund
16

Health Care Fund
Market
Value•
Shares ($000)
Market
Value•
Shares ($000)
Health Care Technology (2.5%) * Cerner Corp. 11,669,617 806,721*,1 athenahealth Inc. 2,234,165 279,963*,1 Allscripts Healthcare
Solutions Inc. 9,423,593 140,506
1,227,190
Life Sciences Tools & Services (2.9%)
Thermo Fisher
Scientific Inc. 3,389,165 759,546* Illumina Inc. 1,418,888 330,090* IQVIA Holdings Inc. 1,602,521 163,762
Agilent Technologies
Inc. 1,423,050 104,494* PRA Health Sciences
Inc. 601,636 54,785
1,412,677
Pharmaceuticals (21.4%)
Bristol-Myers Squibb
Co. 48,547,412 3,039,068
Allergan plc 13,074,873 2,356,876
Eli Lilly & Co. 24,660,415 2,008,591
Merck & Co. Inc. 25,838,244 1,530,916*,1 Mylan NV 29,844,042 1,278,817*,^,1 Medicines Co. 5,564,220 184,343* Nektar Therapeutics
Class A 1,334,600 111,586
10,510,197
Total United States 35,566,416
International (24.5%)
Belgium (2.2%) 1 UCB SA 11,830,703 1,031,202* Galapagos NV 282,879 33,595
1,064,797
China (0.3%)
Shanghai Fosun
Pharmaceutical Group
Co. Ltd. 15,039,500 87,392
Sino Biopharmaceutical
Ltd. 25,310,000 46,427*,2 Wuxi Biologics Cayman
Inc. 2,435,500 16,738
150,557
Denmark (0.8%) * Genmab A/S 1,423,515 260,483
H Lundbeck A/S 2,386,693 121,660
382,143
France (0.6%)
Essilor International
Cie Generale
d’Optique SA 2,204,229 312,925
Israel (1.3%) ^ Teva Pharmaceutical
Industries Ltd. ADR 30,844,901 629,544
Japan (9.1%) 1 Eisai Co. Ltd. 16,719,425 951,518
Chugai Pharmaceutical
Co. Ltd. 15,610,000 825,023
Shionogi & Co. Ltd. 13,215,654 731,494
Takeda Pharmaceutical
Co. Ltd. 10,581,700 619,810
Ono Pharmaceutical
Co. Ltd. 18,832,660 465,303
Astellas Pharma Inc. 34,367,700 451,977
Sysmex Corp. 1,716,700 135,135
Kyowa Hakko Kirin
Co. Ltd. 5,952,900 116,132
Nippon Shinyaku
Co. Ltd. 1,318,400 90,421
Terumo Corp. 1,799,300 88,066
4,474,879
Netherlands (0.3%)
Koninklijke Philips NV 3,110,045 126,766
South Africa (0.1%)
Aspen Pharmacare
Holdings Ltd. 1,140,383 26,059
Switzerland (4.2%)
Novartis AG 13,576,941 1,225,415
Roche Holding AG 2,938,470 726,021
Roche Holding AG
(Bearer) 376,066 93,972* Idorsia Ltd. 809,587 25,082
2,070,490
United Kingdom (5.6%)
AstraZeneca plc 35,892,482 2,491,449
Smith & Nephew plc 8,976,157 161,515^ Hikma Pharmaceuticals
plc 7,939,027 109,179
2,762,143
Total International 12,000,303
Total Common Stocks
(Cost $27,822,521) 47,566,719
17

Health Care Fund
Market
Value•
Shares ($000)
Face Market
Amount Value•
($000) ($000)
Temporary Cash Investments (3.3%)
Money Market Fund (0.3%)3,4 Vanguard Market
Liquidity Fund,
1.545% 1,664,276 166,428
Face
Amount
($000)
Repurchase Agreements (1.4%)
Bank of America
Securities, LLC
1.360%, 2/1/18 (Dated
1/31/18, Repurchase
Value $132,105,000,
collateralized by Federal
Home Loan Mortgage
Corp. 3.000%, 3/1/30,
Federal National Mortgage
Assn. 3.000%–3.500%,
6/1/30–1/1/48, with a
value of $134,742,000) 132,100 132,100
Bank of Nova Scotia
1.310%, 2/1/18 (Dated
1/31/18, Repurchase
Value $117,204,000,
collateralized by U.S.
Treasury Note/Bond
0.875%–1.875%, 7/31/19–
2/28/22, with a value of
$119,548,000) 117,200 117,200
Barclays Capital Inc.
1.350%, 2/1/18 (Dated
1/31/18, Repurchase
Value $112,404,000,
collateralized by U.S.
Treasury Note/Bond
0.000%–9.125%, 5/15/18–
5/15/43, with a value of
$114,648,000) 112,400 112,400
BNP Paribas Securities Corp.
1.330%, 2/1/18 (Dated
1/31/18, Repurchase Value
$85,503,000, collateralized
by U.S. Treasury Note/
Bond 1.375%–2.500%,
9/30/19–2/15/46,
Government National
Mortgage Assn. 2.250%–
4.500%, 5/20/35–12/20/47,
Federal National Mortgage
Assn. 2.846%–4.500%,
8/1/25–1/1/48, Federal
Home Loan Mortgage
Corp. 3.000%–6.000%,
12/1/25–2/1/48, with a
value of $87,210,000) 85,500 85,500
HSBC Bank USA
1.310%, 2/1/18 (Dated
1/31/18, Repurchase Value
$76,303,000, collateralized
by Federal National
Mortgage Assn. 4.000%,
12/1/41–7/1/47, with a
value of $77,828,000) 76,300 76,300
RBC Capital Markets LLC
1.310%, 2/1/18 (Dated
1/31/18, Repurchase Value
$106,504,000, collateralized
by Federal Home Loan
Mortgage Corp. 3.000%–
4.000%, 6/1/32–1/1/48,
Federal National Mortgage
Assn. 2.348%–4.500%,
11/1/32–2/1/48, with a
value of $108,630,000) 106,500 106,500
18

Health Care Fund
Face Market
Amount Value•
($000) ($000)
Amount
($000)
Wells Fargo & Co.
1.360%, 2/1/18 (Dated
1/31/18, Repurchase
Value $55,802,000,
collateralized by Federal
National Mortgage Assn.
3.500%, 12/1/47, with
a value of $56,916,000) 55,800 55,800
685,800
Commercial Paper (1.6%) 5 Apple Inc.,
1.493%, 2/7/18 250,000 249,9505 Apple Inc.,
1.534%, 3/13/18 75,000 74,871
General Electric Co.,
1.553%, 2/27/18 150,000 149,8365 Microsoft Corp.,
1.402%, 2/1/18 79,674 79,6715 Microsoft Corp.,
1.423%, 2/12/18 150,000 149,9375 Wal-Mart Stores, Inc.,
1.502%, 2/20/18 72,800 72,744
777,009
Total Temporary Cash Investments
(Cost $1,629,221) 1,629,237
Total Investments (100.3%)
(Cost $29,451,742) 49,195,956
Other Assets and Liabilities (-0.3%)
Other Assets4 244,787
Liabilities4 (373,921)
(129,134)
Net Assets (100%) 49,066,822
Statement of Assets and Liabilities
Assets
Investments in Securities, at Value
Unaffiliated Issuers 42,985,965
Affiliated Vanguard Funds 166,428
Other Affiliated Issuers 6,043,563
Total Investments in Securities 49,195,956
Investment in Vanguard 2,577
Receivables for Investment
Securities Sold 169,193
Receivables for Accrued Income 63,296
Receivables for Capital Shares Issued 9,617
Other Assets 104
Total Assets 49,440,743
Liabilities
Payables for Investment Securities
Purchased 75,456
Collateral for Securities on Loan 166,446
Payables to Investment Advisor 20,456
Payables for Capital Shares Redeemed 57,843
Payables to Vanguard 53,720
Total Liabilities 373,921
Net Assets 49,066,822
19

Health Care Fund
At January 31, 2018, net assets consisted of:
Amount
($000)
Paid-in Capital 28,323,291
Overdistributed Net Investment Income (102,645)
Accumulated Net Realized Gains 1,099,592
Unrealized Appreciation (Depreciation)
Investment Securities 19,744,214
Foreign Currencies 2,370
Net Assets 49,066,822
Investor Shares—Net Assets
Applicable to 45,625,299 outstanding
$.001 par value shares of beneficial
interest (unlimited authorization) 9,853,130
Net Asset Value Per Share—
Investor Shares $215.96
Admiral Shares—Net Assets
Applicable to 430,544,875 outstanding
$.001 par value shares of beneficial
interest (unlimited authorization) 39,213,692
Net Asset Value Per Share—
Admiral Shares $91.08
• See Note A in Notes to Financial Statements.
* Non-income-producing security.
^ Includes partial security positions on loan to broker-dealers. The total value of securities on loan is $154,466,000.
1 Considered an affiliated company of the fund as the fund owns more than 5% of the outstanding voting securities of such company.
2 Security exempt from registration under Rule 144A of the Securities Act of 1933. Such securities may be sold in transactions exempt from registration, normally to qualified institutional buyers. At January 31, 2018, the value of this security represented 0.0% of net assets.
3 Affiliated money market fund available only to Vanguard funds and certain trusts and accounts managed by Vanguard. Rate shown is the 7-day yield.
4 Includes $166,446,000 of collateral received for securities on loan, of which $166,428,000 is held in Vanguard Market Liquidity Fund and $18,000 is held in cash.
5 Security exempt from registration under Section 4(2) of the Securities Act of 1933. Such securities may be sold in transactions exempt from registration only to dealers in that program or other “accredited investors.” At January 31, 2018, the aggregate value of these securities was $627,173,000, representing 1.3% of net assets.
ADR—American Depositary Receipt.
CVR—Contingent Value Rights.
See accompanying Notes, which are an integral part of the Financial Statements.
20
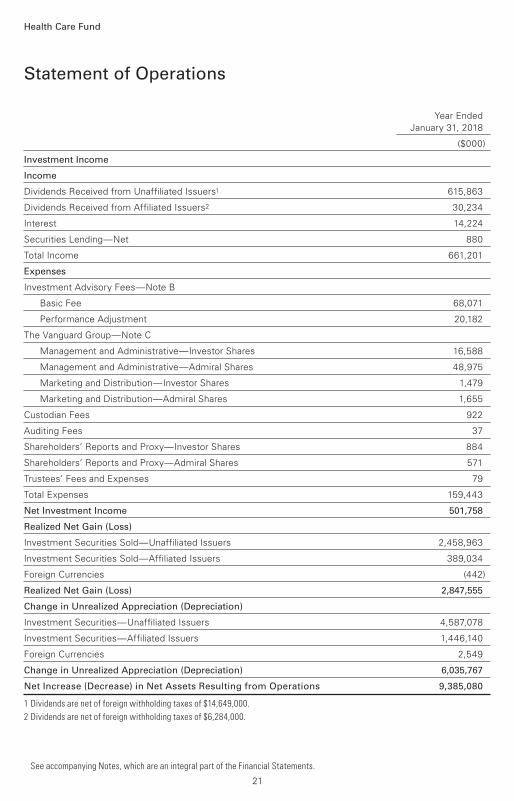
Year Ended
January 31, 2018
($000)
Investment Income
Income
Dividends Received from Unaffiliated Issuers1 615,863
Dividends Received from Affiliated Issuers2 30,234
Interest 14,224
Securities Lending—Net 880
Total Income 661,201
Expenses
Investment Advisory Fees—Note B
Basic Fee 68,071
Performance Adjustment 20,182
The Vanguard Group—Note C
Management and Administrative—Investor Shares 16,588
Management and Administrative—Admiral Shares 48,975
Marketing and Distribution—Investor Shares 1,479
Marketing and Distribution—Admiral Shares 1,655
Custodian Fees 922
Auditing Fees 37
Shareholders’ Reports and Proxy—Investor Shares 884
Shareholders’ Reports and Proxy—Admiral Shares 571
Trustees’ Fees and Expenses 79
Total Expenses 159,443
Net Investment Income 501,758
Realized Net Gain (Loss)
Investment Securities Sold—Unaffiliated Issuers 2,458,963
Investment Securities Sold—Affiliated Issuers 389,034
Foreign Currencies (442)
Realized Net Gain (Loss) 2,847,555
Change in Unrealized Appreciation (Depreciation)
Investment Securities—Unaffiliated Issuers 4,587,078
Investment Securities—Affiliated Issuers 1,446,140
Foreign Currencies 2,549
Change in Unrealized Appreciation (Depreciation) 6,035,767
Net Increase (Decrease) in Net Assets Resulting from Operations 9,385,080
1 Dividends are net of foreign withholding taxes of $14,649,000.
2 Dividends are net of foreign withholding taxes of $6,284,000.
Statement of Operations
Health Care Fund
See accompanying Notes, which are an integral part of the Financial Statements.
21

Statement of Changes in Net Assets
Health Care Fund
See accompanying Notes, which are an integral part of the Financial Statements.
Year Ended January 31,
2018 2017
($000) ($000)
Increase (Decrease) in Net Assets
Operations
Net Investment Income 501,758 476,102
Realized Net Gain (Loss) 2,847,555 3,502,054
Change in Unrealized Appreciation (Depreciation) 6,035,767 (2,688,729)
Net Increase (Decrease) in Net Assets Resulting from Operations 9,385,080 1,289,427
Distributions
Net Investment Income
Investor Shares (91,668) (91,432)
Admiral Shares (384,798) (337,537)
Realized Capital Gain1
Investor Shares (606,232) (710,003)
Admiral Shares (2,282,680) (2,437,191)
Total Distributions (3,365,378) (3,576,163)
Capital Share Transactions
Investor Shares (1,099,749) (780,048)
Admiral Shares 795,332 (1,103,458)
Net Increase (Decrease) from Capital Share Transactions (304,417) (1,883,506)
Total Increase (Decrease) 5,715,285 (4,170,242)
Net Assets
Beginning of Period 43,351,537 47,521,779
End of Period2 49,066,822 43,351,537
1 Includes fiscal 2018 and 2017 short-term gain distributions totaling $271,874,000 and $132,789,000, respectively. Short-term gain distributions are treated as ordinary income dividends for tax purposes.
2 Net Assets—End of Period includes undistributed (overdistributed) net investment income of ($102,645,000) and ($107,645,000).
22

Investor Shares
For a Share Outstanding Year Ended January 31,
Throughout Each Period 2018 2017 2016 2015 2014
Net Asset Value, Beginning of Period $189.88 $200.67 $216.14 $191.63 $152.58
Investment Operations
Net Investment Income 2.1621 2.039 1.934 2.941 2.350
Net Realized and Unrealized Gain (Loss)
on Investments 38.929 2.951 .566 49.127 53.058
Total from Investment Operations 41.091 4.990 2.500 52.068 55.408
Distributions
Dividends from Net Investment Income (2.059) (1.854) (2.611) (2.115) (2.357)
Distributions from Realized Capital Gains (12.952) (13.926) (15.359) (25.443) (14.001)
Total Distributions (15.011) (15.780) (17.970) (27.558) (16.358)
Net Asset Value, End of Period $215.96 $189.88 $200.67 $216.14 $191.63
Total Return2 22.29% 2.71% 0.49% 28.15% 37.66%
Ratios/Supplemental Data
Net Assets, End of Period (Millions) $9,853 $9,636 $10,916 $11,660 $9,905
Ratio of Total Expenses to Average Net Assets3 0.38% 0.37% 0.36% 0.34% 0.35%
Ratio of Net Investment Income to
Average Net Assets 1.02% 0.98% 0.84% 1.44% 1.33%
Portfolio Turnover Rate 11% 12% 18% 20% 21%
1 Calculated based on average shares outstanding.
2 Total returns do not include account service fees that may have applied in the periods shown. Fund prospectuses provide information about any applicable account service fees.
3 Includes performance-based investment advisory fee increases (decreases) of 0.04% for fiscal 2018, 0.04% for fiscal 2017, and 0.02% for fiscal 2016. Performance-based investment advisory fees did not apply before fiscal 2016.
Financial Highlights
See accompanying Notes, which are an integral part of the Financial Statements.
Health Care Fund
23
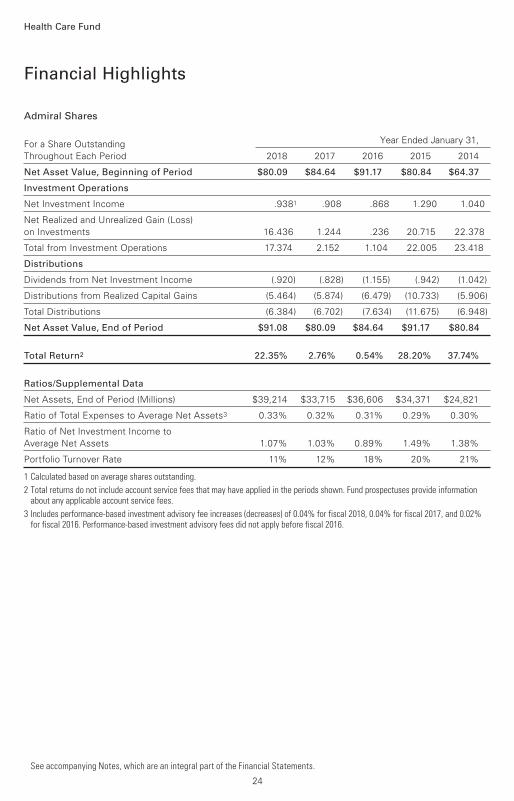
Admiral Shares
For a Share Outstanding Year Ended January 31,
Throughout Each Period 2018 2017 2016 2015 2014
Net Asset Value, Beginning of Period $80.09 $84.64 $91.17 $80.84 $64.37
Investment Operations
Net Investment Income .9381 .908 .868 1.290 1.040
Net Realized and Unrealized Gain (Loss)
on Investments 16.436 1.244 .236 20.715 22.378
Total from Investment Operations 17.374 2.152 1.104 22.005 23.418
Distributions
Dividends from Net Investment Income (.920) (.828) (1.155) (.942) (1.042)
Distributions from Realized Capital Gains (5.464) (5.874) (6.479) (10.733) (5.906)
Total Distributions (6.384) (6.702) (7.634) (11.675) (6.948)
Net Asset Value, End of Period $91.08 $80.09 $84.64 $91.17 $80.84
Total Return2 22.35% 2.76% 0.54% 28.20% 37.74%
Ratios/Supplemental Data
Net Assets, End of Period (Millions) $39,214 $33,715 $36,606 $34,371 $24,821
Ratio of Total Expenses to Average Net Assets3 0.33% 0.32% 0.31% 0.29% 0.30%
Ratio of Net Investment Income to
Average Net Assets 1.07% 1.03% 0.89% 1.49% 1.38%
Portfolio Turnover Rate 11% 12% 18% 20% 21%
1 Calculated based on average shares outstanding.
2 Total returns do not include account service fees that may have applied in the periods shown. Fund prospectuses provide information about any applicable account service fees.
3 Includes performance-based investment advisory fee increases (decreases) of 0.04% for fiscal 2018, 0.04% for fiscal 2017, and 0.02% for fiscal 2016. Performance-based investment advisory fees did not apply before fiscal 2016.
Financial Highlights
See accompanying Notes, which are an integral part of the Financial Statements.
Health Care Fund
24

Notes to Financial Statements
Health Care Fund
Vanguard Health Care Fund is registered under the Investment Company Act of 1940 as an
open-end investment company, or mutual fund. The fund invests in securities of foreign issuers,
which may subject it to investment risks not normally associated with investing in securities of U.S.
corporations. The fund offers two classes of shares: Investor Shares and Admiral Shares. Investor
Shares are available to any investor who meets the fund’s minimum purchase requirements.
Admiral Shares are designed for investors who meet certain administrative, service, and account-
size criteria.
A. The following significant accounting policies conform to generally accepted accounting
principles for U.S. investment companies. The fund consistently follows such policies in preparing
its financial statements.
1. Security Valuation: Securities are valued as of the close of trading on the New York Stock
Exchange (generally 4 p.m., Eastern time) on the valuation date. Equity securities are valued at
the latest quoted sales prices or official closing prices taken from the primary market in which
each security trades; such securities not traded on the valuation date are valued at the mean of the
latest quoted bid and asked prices. Securities for which market quotations are not readily available,
or whose values have been affected by events occurring before the fund’s pricing time but after
the close of the securities’ primary markets, are valued at their fair values calculated according to
procedures adopted by the board of trustees. These procedures include obtaining quotations from
an independent pricing service, monitoring news to identify significant market- or security-specific
events, and evaluating changes in the values of foreign market proxies (for example, ADRs, futures
contracts, or exchange-traded funds), between the time the foreign markets close and the fund’s
pricing time. When fair-value pricing is employed, the prices of securities used by a fund to calculate
its net asset value may differ from quoted or published prices for the same securities. Investments
in Vanguard Market Liquidity Fund are valued at that fund’s net asset value. Temporary cash
investments are valued using the latest bid prices or using valuations based on a matrix system
(which considers such factors as security prices, yields, maturities, and ratings), both as furnished
by independent pricing services.
2. Foreign Currency: Securities and other assets and liabilities denominated in foreign currencies
are translated into U.S. dollars using exchange rates obtained from an independent third party as
of the fund’s pricing time on the valuation date. Realized gains (losses) and unrealized appreciation
(depreciation) on investment securities include the effects of changes in exchange rates since the
securities were purchased, combined with the effects of changes in security prices. Fluctuations
in the value of other assets and liabilities resulting from changes in exchange rates are recorded
as unrealized foreign currency gains (losses) until the assets or liabilities are settled in cash, at
which time they are recorded as realized foreign currency gains (losses).
3. Repurchase Agreements: The fund enters into repurchase agreements with institutional
counterparties. Securities pledged as collateral to the fund under repurchase agreements are
held by a custodian bank until the agreements mature, and in the absence of a default, such
collateral cannot be repledged, resold, or rehypothecated. Each agreement requires that the
market value of the collateral be sufficient to cover payments of interest and principal. The fund
further mitigates its counterparty risk by entering into repurchase agreements only with a diverse
group of prequalified counterparties, monitoring their financial strength, and entering into master
25

Health Care Fund
repurchase agreements with its counterparties. The master repurchase agreements provide
that, in the event of a counterparty’s default (including bankruptcy), the fund may terminate
any repurchase agreements with that counterparty, determine the net amount owed, and sell
or retain the collateral up to the net amount owed to the fund. Such action may be subject to
legal proceedings, which may delay or limit the disposition of collateral.
4. Federal Income Taxes: The fund intends to continue to qualify as a regulated investment
company and distribute all of its taxable income. Management has analyzed the fund’s tax positions
taken for all open federal income tax years (January 31, 2015–2018), and has concluded that no
provision for federal income tax is required in the fund’s financial statements.
5. Distributions: Distributions to shareholders are recorded on the ex-dividend date.
6. Securities Lending: To earn additional income, the fund lends its securities to qualified institutional
borrowers. Security loans are subject to termination by the fund at any time, and are required to
be secured at all times by collateral in an amount at least equal to the market value of securities
loaned. Daily market fluctuations could cause the value of loaned securities to be more or less
than the value of the collateral received. When this occurs, the collateral is adjusted and settled
on the next business day. The fund further mitigates its counterparty risk by entering into securities
lending transactions only with a diverse group of prequalified counterparties, monitoring their
financial strength, and entering into master securities lending agreements with its counterparties.
The master securities lending agreements provide that, in the event of a counterparty’s default
(including bankruptcy), the fund may terminate any loans with that borrower, determine the net
amount owed, and sell or retain the collateral up to the net amount owed to the fund; however,
such actions may be subject to legal proceedings. While collateral mitigates counterparty risk,
in the event of a default, the fund may experience delays and costs in recovering the securities
loaned. The fund invests cash collateral received in Vanguard Market Liquidity Fund, and records
a liability in the Statement of Assets and Liabilities for the return of the collateral, during the period
the securities are on loan. Securities lending income represents fees charged to borrowers plus
income earned on invested cash collateral, less expenses associated with the loan. During the term
of the loan, the fund is entitled to all distributions made on or in respect of the loaned securities.
7. Credit Facility: The fund and certain other funds managed by The Vanguard Group (“Vanguard”)
participate in a $3.1 billion committed credit facility provided by a syndicate of lenders pursuant to
a credit agreement that may be renewed annually; each fund is individually liable for its borrowings,
if any, under the credit facility. Borrowings may be utilized for temporary and emergency purposes,
and are subject to the fund’s regulatory and contractual borrowing restrictions. The participating
funds are charged administrative fees and an annual commitment fee of 0.10% of the undrawn
amount of the facility; these fees are allocated to the funds based on a method approved by the
fund’s board of trustees and included in Management and Administrative expenses on the fund’s
Statement of Operations. Any borrowings under this facility bear interest at a rate based upon the
higher of the one-month London Interbank Offered Rate, federal funds effective rate, or overnight
bank funding rate plus an agreed-upon spread.
The fund had no borrowings outstanding at January 31, 2018, or at any time during the period
then ended.
26

Health Care Fund
8. Other: Dividend income is recorded on the ex-dividend date. Premiums and discounts on debt
securities purchased are amortized and accreted, respectively, to interest income over the lives of
the respective securities. Security transactions are accounted for on the date securities are bought
or sold. Costs used to determine realized gains (losses) on the sale of investment securities are
those of the specific securities sold.
Each class of shares has equal rights as to assets and earnings, except that each class separately
bears certain class-specific expenses related to maintenance of shareholder accounts (included
in Management and Administrative expenses), shareholder reporting, and the proxy. Marketing
and distribution expenses are allocated to each class of shares based on a method approved
by the board of trustees. Income, other non-class-specific expenses, and gains and losses on
investments are allocated to each class of shares based on its relative net assets.
B. Wellington Management Company LLP provides investment advisory services to the fund for
a fee calculated at an annual percentage rate of average net assets. The basic fee is subject to
quarterly adjustments based on the fund’s performance relative to the MSCI ACWI Health Care
Index since April 30, 2014. For the year ended January 31, 2018, the investment advisory fee
represented an effective annual basic rate of 0.14% of the fund’s average net assets before an
increase of $20,182,000 (0.04%) based on performance.
C. In accordance with the terms of a Funds’ Service Agreement (the “FSA”) between Vanguard
and the fund, Vanguard furnishes to the fund corporate management, administrative, marketing,
and distribution services at Vanguard’s cost of operations (as defined by the FSA). These costs
of operations are allocated to the fund based on methods and guidelines approved by the board
of trustees. Vanguard does not require reimbursement in the current period for certain costs of
operations (such as deferred compensation/benefits and risk/insurance costs); the fund’s liability
for these costs of operations is included in Payables to Vanguard on the Statement of Assets
and Liabilities.
Upon the request of Vanguard, the fund may invest up to 0.40% of its net assets as capital in
Vanguard. At January 31, 2018, the fund had contributed to Vanguard capital in the amount of
$2,577,000, representing 0.01% of the fund’s net assets and 1.03% of Vanguard’s capitalization.
The fund’s trustees and officers are also directors and employees, respectively, of Vanguard.
D. Various inputs may be used to determine the value of the fund’s investments. These inputs
are summarized in three broad levels for financial statement purposes. The inputs or methodologies
used to value securities are not necessarily an indication of the risk associated with investing in
those securities.
Level 1—Quoted prices in active markets for identical securities.
Level 2—Other significant observable inputs (including quoted prices for similar securities, interest
rates, prepayment speeds, credit risk, etc.).
Level 3—Significant unobservable inputs (including the fund’s own assumptions used to determine
the fair value of investments). Any investments valued with significant unobservable inputs are
noted on the Statement of Net Assets.
27

Health Care Fund
The following table summarizes the market value of the fund’s investments as of January 31, 2018,
based on the inputs used to value them: Level 1 Level 2 Level 3
Investments ($000) ($000) ($000)
Common Stocks—United States 35,566,416 — —
Common Stocks—International 629,544 11,370,759 —
Temporary Cash Investments 166,428 1,462,809 —
Total 36,362,388 12,833,568 —
E. Distributions are determined on a tax basis and may differ from net investment income and
realized capital gains for financial reporting purposes. Differences may be permanent or temporary.
Permanent differences are reclassified among capital accounts in the financial statements to reflect
their tax character. Temporary differences arise when certain items of income, expense, gain, or
loss are recognized in different periods for financial statement and tax purposes. These differences
will reverse at some time in the future. Differences in classification may also result from the
treatment of short-term gains as ordinary income for tax purposes.
The fund used a tax accounting practice to treat a portion of the price of capital shares redeemed
during the year as distributions from net investment income and realized capital gains. Accordingly,
the fund has reclassified $19,849,000 from overdistributed net investment income and $109,069,000
from accumulated net realized gains to paid-in capital.
For tax purposes, at January 31, 2018, the fund had $111,451,000 of ordinary income and
$1,024,203,000 of long-term capital gains available for distribution.
At January 31, 2018, the cost of investment securities for tax purposes was $29,540,605,000. Net
unrealized appreciation of investment securities for tax purposes was $19,655,351,000, consisting
of unrealized gains of $20,879,661,000 on securities that had risen in value since their purchase
and $1,224,310,000 in unrealized losses on securities that had fallen in value since their purchase.
F. During the year ended January 31, 2018, the fund purchased $4,972,161,000 of investment
securities and sold $8,541,671,000 of investment securities, other than temporary cash investments.
G. Capital share transactions for each class of shares were: Year Ended January 31,
2018 2017
Amount Shares Amount Shares
($000) (000) ($000) (000)
Investor Shares
Issued 1,154,125 5,549 1,313,938 6,581
Issued in Lieu of Cash Distributions 659,513 3,250 760,856 4,044
Redeemed (2,913,387) (13,922) (2,854,842) (14,276)
Net Increase (Decrease)—Investor Shares (1,099,749) (5,123) (780,048) (3,651)
Admiral Shares
Issued 2,793,811 31,646 2,173,067 25,669
Issued in Lieu of Cash Distributions 2,402,452 28,052 2,517,721 31,739
Redeemed (4,400,931) (50,129) (5,794,246) (68,911)
Net Increase (Decrease)—Admiral Shares 795,332 9,569 (1,103,458) (11,503)
28

Health Care Fund
H. Certain of the fund’s investments are in companies that are considered to be affiliated
companies of the fund because the fund owns more than 5% of the outstanding voting securities
of the company or the issuer is another member of The Vanguard Group. Transactions during the
period in securities of these companies were as follows:
Current Period Transactions
Jan. 31, Proceeds Realized Jan. 31,
2017 from Net Change in Capital Gain 2018
Market Purchases Securities Gain Unrealized Distributions Market
Value at Cost Sold (Loss) App. (Dep.) Income Received Value
($000) ($000) ($000) ($000) ($000) ($000) ($000) ($000)
Acadia Healthcare
Co. Inc. NA1 30,010 — — (15,114) — — 156,814
Agios
Pharmaceuticals Inc. 154,118 47,166 — — 141,568 — — 342,852
Alkermes plc 470,442 18,895 — — 29,148 — — 518,485
Allscripts Healthcare
Solutions Inc. 131,139 — 26,188 758 34,797 — — 140,506
Alnylam
Pharmaceuticals Inc. 341,889 — 212,806 35,109 702,836 — — 867,028
athenahealth Inc. 289,067 17,992 30,605 1,661 1,848 — — 279,963
Eisai Co. Ltd. 828,954 97,823 — — 24,741 18,157 — 951,518
Incyte Corp. 1,249,252 41,017 155,621 75,544 (355,419) — — NA2
Medicines Co. 200,590 — — — (16,247) — — 184,343
Mylan NV 1,144,717 16,789 34,017 (20,064) 171,392 — — 1,278,817
Prothena Corp. plc 105,278 — — — (15,396) — — 89,882
TESARO Inc. NA1 345,608 — — (143,455) — — 202,153
UCB SA 783,433 36,150 1,645 57 213,207 12,077 — 1,031,202
Vanguard Market
Liquidity Fund 88,012 NA3 NA3 (18) (1) — — 166,428
Vertex
Pharmaceuticals
Inc. 1,136,089 — 727,874 295,987 672,235 — — NA2
Total 6,922,980 389,034 1,446,140 30,234 — 6,209,991
1 Not applicable—at January 31, 2017, the issuer was not an affiliated company of the fund.
2 Not applicable—at January 31, 2018, the security was still held, but the issuer was not an affiliated company of the fund.
3 Not applicable—purchases and sales are for temporary cash investment purposes.
I. Management has determined that no material events or transactions occurred subsequent to
January 31, 2018, that would require recognition or disclosure in these financial statements.
29

To the Board of Trustees of Vanguard Specialized Funds and Shareholders of Vanguard Health
Care Fund
Opinion on the Financial Statements
We have audited the accompanying statement of net assets and statement of assets and liabilities
of Vanguard Health Care Fund (one of the funds constituting Vanguard Specialized Funds, referred
to hereafter as the “Fund”) as of January 31, 2018, the related statement of operations for the year
ended January 31, 2018, the statement of changes in net assets for each of the two years in the
period ended January 31, 2018, including the related notes, and the financial highlights for each
of the five years in the period ended January 31, 2018 (collectively referred to as the “financial
statements”). In our opinion, the financial statements present fairly, in all material respects, the
financial position of the Fund as of January 31, 2018, the results of its operations for the year then
ended, the changes in its net assets for each of the two years in the period ended January 31,
2018 and the financial highlights for each of the five years in the period ended January 31, 2018
in conformity with accounting principles generally accepted in the United States of America.
Basis for Opinion
These financial statements are the responsibility of the Fund’s management. Our responsibility
is to express an opinion on the Fund’s financial statements based on our audits. We are a public
accounting firm registered with the Public Company Accounting Oversight Board (United States)
(“PCAOB”) and are required to be independent with respect to the Fund in accordance with
the U.S. federal securities laws and the applicable rules and regulations of the Securities and
Exchange Commission and the PCAOB.
We conducted our audits of these financial statements in accordance with the standards of
the PCAOB. Those standards require that we plan and perform the audit to obtain reasonable
assurance about whether the financial statements are free of material misstatement, whether
due to error or fraud.
Our audits included performing procedures to assess the risks of material misstatement of the
financial statements, whether due to error or fraud, and performing procedures that respond to
those risks. Such procedures included examining, on a test basis, evidence regarding the amounts
and disclosures in the financial statements. Our audits also included evaluating the accounting
principles used and significant estimates made by management, as well as evaluating the overall
presentation of the financial statements. Our procedures included confirmation of securities owned
as of January 31, 2018 by correspondence with the custodian and brokers and by agreement to the
underlying ownership records of the transfer agent; when replies were not received from brokers,
we performed other auditing procedures. We believe that our audits provide a reasonable basis
for our opinion.
/s/PricewaterhouseCoopers LLP
Philadelphia, Pennsylvania
March 15, 2018
We have served as the auditor of one or more investment companies in The Vanguard Group
of Funds since 1975.
Report of Independent Registered Public Accounting Firm
30

Special 2017 tax information (unaudited) for Vanguard Health Care Fund
This information for the fiscal year ended January 31, 2018, is included pursuant to provisions
of the Internal Revenue Code.
The fund distributed $2,718,262,000 as capital gain dividends (20% rate gain distributions) to
shareholders during the fiscal year.
For nonresident alien shareholders, 100% of short-term capital gain dividends distributed by
the fund are qualified short-term capital gains.
The fund distributed $632,250,000 of qualified dividend income to shareholders during the
fiscal year.
For corporate shareholders, 45.3% of investment income (dividend income plus short-term
gains, if any) qualifies for the dividends-received deduction.
31
Your Fund’s After-Tax Returns
32
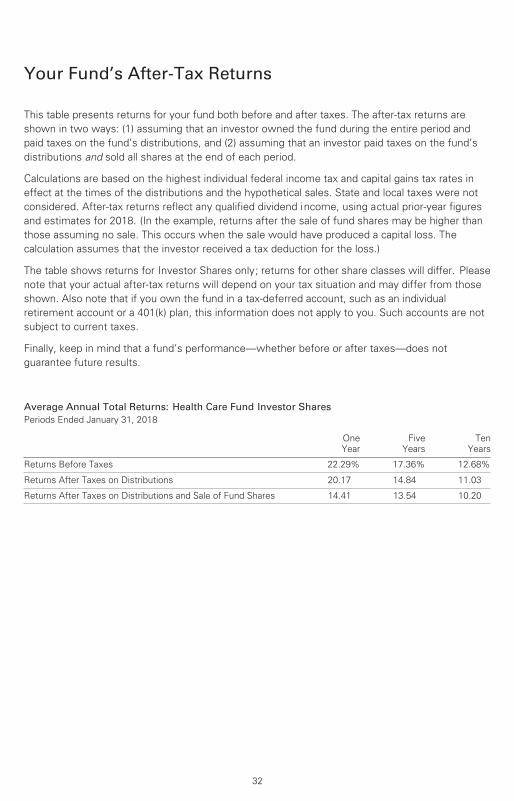
This table presents returns for your fund both before and after taxes. The after-tax returns are
shown in two ways: (1) assuming that an investor owned the fund during the entire period and
paid taxes on the fund’s distributions, and (2) assuming that an investor paid taxes on the fund’s
distributions and sold all shares at the end of each period.
Calculations are based on the highest individual federal income tax and capital gains tax rates in
effect at the times of the distributions and the hypothetical sales. State and local taxes were not
considered. After-tax returns reflect any qualified dividend income, using actual prior-year figures
and estimates for 2018. (In the example, returns after the sale of fund shares may be higher than
those assuming no sale. This occurs when the sale would have produced a capital loss. The
calculation assumes that the investor received a tax deduction for the loss.)
The table shows returns for Investor Shares only; returns for other share classes will differ. Please
note that your actual after-tax returns will depend on your tax situation and may differ from those
shown. Also note that if you own the fund in a tax-deferred account, such as an individual
retirement account or a 401(k) plan, this information does not apply to you. Such accounts are not
subject to current taxes.
Finally, keep in mind that a fund’s performance—whether before or after taxes—does not
guarantee future results.
Average Annual Total Returns: Health Care Fund Investor Shares Periods Ended January 31, 2018
One
Year
Five
Years
Ten
Years
Returns Before Taxes 22.29% 17.36% 12.68%
Returns After Taxes on Distributions 20.17 14.84 11.03
Returns After Taxes on Distributions and Sale of Fund Shares 14.41 13.54 10.20

About Your Fund’s Expenses
33
As a shareholder of the fund, you incur ongoing costs, which include costs for portfolio management,
administrative services, and shareholder reports (like this one), among others. Operating expenses,
which are deducted from a fund’s gross income, directly reduce the investment return of the fund.
A fund’s expenses are expressed as a percentage of its average net assets. This figure is known as
the expense ratio. The following examples are intended to help you understand the ongoing costs (in
dollars) of investing in your fund and to compare these costs with those of other mutual funds. The
examples are based on an investment of $1,000 made at the beginning of the period shown and held
for the entire period.
The accompanying table illustrates your fund’s costs in two ways:
• Based on actual fund return. This section helps you to estimate the actual expenses that you
paid over the period. The ”Ending Account Value“ shown is derived from the fund‘s actual return,
and the third column shows the dollar amount that would have been paid by an investor who started
with $1,000 in the fund. You may use the information here, together with the amount you invested,
to estimate the expenses that you paid over the period.
To do so, simply divide your account value by $1,000 (for example, an $8,600 account value divided
by $1,000 = 8.6), then multiply the result by the number given for your fund under the heading
”Expenses Paid During Period.“
• Based on hypothetical 5% yearly return. This section is intended to help you compare your
fund‘s costs with those of other mutual funds. It assumes that the fund had a yearly return of 5%
before expenses, but that the expense ratio is unchanged. In this case—because the return used is
not the fund’s actual return—the results do not apply to your investment. The example is useful in
making comparisons because the Securities and Exchange Commission requires all mutual funds to
calculate expenses based on a 5% return. You can assess your fund’s costs by comparing this
hypothetical example with the hypothetical examples that appear in shareholder reports of other
funds.
Note that the expenses shown in the table are meant to highlight and help you compare ongoingcosts only and do not reflect transaction costs incurred by the fund for buying and sellingsecurities. Further, the expenses do not include any purchase, redemption, or account servicefees described in the fund prospectus. If such fees were applied to your account, your costswould be higher. Your fund does not carry a “sales load.”
The calculations assume no shares were bought or sold during the period. Your actual costs may
have been higher or lower, depending on the amount of your investment and the timing of any
purchases or redemptions.
You can find more information about the fund’s expenses, including annual expense ratios, in the
Financial Statements section of this report. For additional information on operating expenses and
other shareholder costs, please refer to your fund’s current prospectus.

34
Six Months Ended January 31, 2018
Health Care Fund
Beginning
Account Value
7/31/2017
Ending
Account Value
1/31/2018
Expenses
Paid During
Period
Based on Actual Fund Return
Investor Shares $1,000.00 $1,060.09 $1.92
Admiral Shares 1,000.00 1,060.32 1.66
Based on Hypothetical 5% Yearly Return
Investor Shares $1,000.00 $1,023.34 $1.89
Admiral Shares 1,000.00 1,023.59 1.63
The calculations are based on expenses incurred in the most recent six-month period. The fund’s annualized six-month expense ratios forthat period are 0.37% for Investor Shares and 0.32% for Admiral Shares. The dollar amounts shown as “Expenses Paid” are equal to theannualized expense ratio multiplied by the average account value over the period, multiplied by the number of days in the most recentsix-month period, then divided by the number of days in the most recent 12-month period (184/365).

Glossary
35
30-Day SEC Yield. A fund’s 30-day SEC yield is derived using a formula specified by the U.S.
Securities and Exchange Commission. Under the formula, data related to the fund’s security
holdings in the previous 30 days are used to calculate the fund’s hypothetical net income for that
period, which is then annualized and divided by the fund’s estimated average net assets over the
calculation period. For the purposes of this calculation, a security’s income is based on its current
market yield to maturity (for bonds), its actual income (for asset-backed securities), or its
projected dividend yield (for stocks). Because the SEC yield represents hypothetical annualized
income, it will differ—at times significantly—from the fund’s actual experience. As a result, the
fund’s income distributions may be higher or lower than implied by the SEC yield.
Beta. A measure of the magnitude of a fund’s past share-price fluctuations in relation to the ups
and downs of a given market index. The index is assigned a beta of 1.00. Compared with a given
index, a fund with a beta of 1.20 typically would have seen its share price rise or fall by 12%
when the index rose or fell by 10%. For this report, beta is based on returns over the past 36
months for both the fund and the index. Note that a fund’s beta should be reviewed in conjunction
with its R-squared (see definition). The lower the R-squared, the less correlation there is between
the fund and the index, and the less reliable beta is as an indicator of volatility.
Dividend Yield. Dividend income earned by stocks, expressed as a percentage of the aggregate
market value (or of net asset value, for a fund). The yield is determined by dividing the amount of
the annual dividends by the aggregate value (or net asset value) at the end of the period. For a
fund, the dividend yield is based solely on stock holdings and does not include any income
produced by other investments.
Earnings Growth Rate. The average annual rate of growth in earnings over the past five years for
the stocks now in a fund.
Equity Exposure. A measure that reflects a fund’s investments in stocks and stock futures. Any
holdings in short-term reserves are excluded.
Expense Ratio. A fund’s total annual operating expenses expressed as a percentage of the fund’s
average net assets. The expense ratio includes management and administrative expenses, but
does not include the transaction costs of buying and selling portfolio securities.
Foreign Holdings. The percentage of a fund represented by securities or depositary receipts of
companies based outside the United States.
Inception Date. The date on which the assets of a fund (or one of its share classes) are first
invested in accordance with the fund’s investment objective. For funds with a subscription period,
the inception date is the day after that period ends. Investment performance is measured from
the inception date.
Median Market Cap. An indicator of the size of companies in which a fund invests; the midpoint
of market capitalization (market price x shares outstanding) of a fund’s stocks, weighted by the
proportion of the fund’s assets invested in each stock. Stocks representing half of the fund’s
assets have market capitalizations above the median, and the rest are below it.
Price/Book Ratio. The share price of a stock divided by its net worth, or book value, per share.
For a fund, the weighted average price/book ratio of the stocks it holds.

36
Price/Earnings Ratio. The ratio of a stock’s current price to its per-share earnings over the past
year. For a fund, the weighted average P/E of the stocks it holds. P/E is an indicator of market
expectations about corporate prospects; the higher the P/E, the greater the expectations for a
company’s future growth.
R-Squared. A measure of how much of a fund’s past returns can be explained by the returns
from the market in general, as measured by a given index. If a fund’s total returns were precisely
synchronized with an index’s returns, its R-squared would be 1.00. If the fund’s returns bore no
relationship to the index’s returns, its R-squared would be 0. For this report, R-squared is based
on returns over the past 36 months for both the fund and the index.
Return on Equity. The annual average rate of return generated by a company during the past five
years for each dollar of shareholder’s equity (net income divided by shareholder’s equity). For a
fund, the weighted average return on equity for the companies whose stocks it holds.
Short-Term Reserves. The percentage of a fund invested in highly liquid, short-term securities
that can be readily converted to cash.
Turnover Rate. An indication of the fund’s trading activity. Funds with high turnover rates incur
higher transaction costs and may be more likely to distribute capital gains (which may be taxable
to investors). The turnover rate excludes in-kind transactions, which have minimal impact on
costs.
Benchmark Information
Spliced Health Care Index: S&P 500 Index through December 31, 2001; S&P Health Care Index
through May 31, 2010; MSCI All Country World Health Care Index thereafter.

The Global Industry Classification Standard (“GICS”) was developed by and is the exclusive property and a service mark
of MSCI Inc. (“MSCI”) and Standard and Poor’s, a division of McGraw-Hill Companies, Inc. (“S&P”), and is licensed for use
by Vanguard. Neither MSCI, S&P nor any third party involved in making or compiling the GICS or any GICS classification
makes any express or implied warranties or representations with respect to such standard or classification (or the results
to be obtained by the use thereof), and all such parties hereby expressly disclaim all warranties of originality, accuracy,
completeness, merchantability or fitness for a particular purpose with respect to any such standard or classification.
Without limiting any of the foregoing, in no event shall MSCI, S&P, any of its affiliates or any third party involved in
making or compiling the GICS or any GICS classification have any liability for any direct, indirect, special, punitive,
consequential or any other damages (including lost profits) even if notified of the possibility of such damages.
37

The People Who Govern Your Fund
The trustees of your mutual fund are there to see that the fund is operated and managed in your
best interests since, as a shareholder, you are a part owner of the fund. Your fund’s trustees also
serve on the board of directors of The Vanguard Group, Inc., which is owned by the Vanguard
funds and provides services to them on an at-cost basis.
A majority of Vanguard’s board members are independent, meaning that they have no affiliation
with Vanguard or the funds they oversee, apart from the sizable personal investments they have
made as private individuals. The independent board members have distinguished backgrounds
in business, academia, and public service. Each of the trustees and executive officers oversees
201 Vanguard funds.
Information for each trustee and executive officer of the fund appears below. The mailing address
of the trustees and officers is P.O. Box 876, Valley Forge, PA 19482. More information about the
trustees is in the Statement of Additional Information, which can be obtained, without charge,
by contacting Vanguard at 800-662-7447, or online at vanguard.com.
Interested Trustees1
F. William McNabb III
Mr. McNabb has served as chairman of the board of
Vanguard and of each of the investment companies
served by Vanguard since January 2010; as a trustee of
each of the investment companies served by Vanguard
since 2009; and as director of Vanguard since 2008.
Mr. McNabb served as chief executive officer and
president of Vanguard and each of the investment
companies served by Vanguard from 2008 to 2017
and as a managing director of Vanguard from 1995
to 2008. Mr. McNabb also serves as a director of
Vanguard Marketing Corporation. He was born in 1957.
Mortimer J. Buckley
Mr. Buckley has served as chief executive officer
of Vanguard since January 2018; as chief executive
officer, president, and trustee of each of the
investment companies served by Vanguard since
January 2018; and as president and director of
Vanguard since 2017. Previous positions held by
Mr. Buckley at Vanguard include chief investment
officer (2013–2017), head of the Retail Investor
Group (2006–2012), and chief information officer
(2001–2006). Mr. Buckley also served as chairman
of the board of the Children’s Hospital of Philadelphia
from 2011 to 2017. He was born in 1969.
Independent Trustees
Emerson U. Fullwood
Mr. Fullwood has served as trustee since July 2008.
Mr. Fullwood is the former executive chief staff and
marketing officer for North America and corporate
vice president (retired 2008) of Xerox Corporation
(document management products and services).
Previous positions held at Xerox by Mr. Fullwood
include president of the Worldwide Channels Group,
president of Latin America, executive chief staff
officer of Developing Markets, and president of
Worldwide Customer Services. Mr. Fullwood is
the executive in residence at the Rochester Institute
of Technology, where he was the 2009–2010
Distinguished Minett Professor. Mr. Fullwood
serves as lead director of SPX FLOW, Inc. (multi-
industry manufacturing); director of the University of
Rochester Medical Center, the Monroe Community
College Foundation, the United Way of Rochester,
North Carolina A&T University, and Roberts Wesleyan
College; and a trustee of the University of Rochester.
He was born in 1948.
Amy Gutmann
Dr. Gutmann has served as trustee since June 2006.
Dr. Gutmann has served as the president of the
University of Pennsylvania since 2004. She is the
Christopher H. Browne Distinguished Professor of
Political Science, School of Arts and Sciences, and
Professor of Communication, Annenberg School for
1 Mr. McNabb and Mr. Buckley are considered “interested persons,” as defined in the Investment Company Act of 1940, because they are officers of the Vanguard funds.

Communication, with secondary faculty appointments
in the Department of Philosophy, School of Arts and
Sciences, and at the Graduate School of Education,
University of Pennsylvania. Dr. Gutmann also serves
as a trustee of the National Constitution Center. She
was born in 1949.
JoAnn Heffernan Heisen
Ms. Heisen has served as trustee since July 1998.
Ms. Heisen is the former corporate vice president
of Johnson & Johnson (pharmaceuticals/medical
devices/consumer products) and a former member
of its executive committee (1997–2008). During her
tenure at Johnson & Johnson, Ms. Heisen held
multiple roles, including: chief global diversity officer
(retired 2008), vice president and chief information
officer (1997–2006), controller (1995–1997), treasurer
(1991–1995), and assistant treasurer (1989–1991).
Ms. Heisen serves as a director of Skytop Lodge
Corporation (hotels) and the Robert Wood Johnson
Foundation and as a member of the advisory board
of the Institute for Women’s Leadership at Rutgers
University. She was born in 1950.
F. Joseph Loughrey
Mr. Loughrey has served as trustee since October
2009. Mr. Loughrey is the former president and chief
operating officer (retired 2009) and vice chairman of
the board (2008–2009) of Cummins Inc. (industrial
machinery). Mr. Loughrey serves as chairman of the
board of Hillenbrand, Inc. (specialized consumer
services), Oxfam America, and the Lumina Foundation
for Education; as a director of the V Foundation for
Cancer Research; and as a member of the advisory
council for the College of Arts and Letters and chair
of the advisory board to the Kellogg Institute for
International Studies, both at the University of Notre
Dame. He was born in 1949.
Mark Loughridge
Mr. Loughridge has served as trustee since March
2012. Mr. Loughridge is the former senior vice
president and chief financial officer (retired 2013) at
IBM (information technology services). Mr. Loughridge
also served as a fiduciary member of IBM’s retirement
plan committee (2004–2013). Previous positions held
by Mr. Loughridge at IBM include senior vice president
and general manager of Global Financing (2002–2004),
vice president and controller (1998–2002), and a
variety of management roles. Mr. Loughridge serves
as a member of the Council on Chicago Booth. He
was born in 1953.
Scott C. Malpass
Mr. Malpass has served as trustee since March 2012.
Mr. Malpass has served as chief investment officer
since 1989 and as vice president since 1996 at the
University of Notre Dame. Mr. Malpass serves as an
assistant professor of finance at the Mendoza College
of Business at the University of Notre Dame and is
a member of the Notre Dame 403(b) investment
committee. Mr. Malpass also serves as chairman
of the board of TIFF Advisory Services, Inc.; as a
member of the board of Catholic Investment Services,
Inc. (investment advisors); as a member of the board
of advisors for Spruceview Capital Partners; and as
a member of the board of superintendence of the
Institute for the Works of Religion. He was born
in 1962.
Deanna Mulligan
Ms. Mulligan has served as trustee since January
2018. Ms. Mulligan has served as president since
2010 and chief executive officer since 2011 at
The Guardian Life Insurance Company of America.
Previous positions held by Ms. Mulligan at The
Guardian Life Insurance Company of America include
chief operating officer (2010–2011) and executive vice
president of Individual Life and Disability (2008–2010).
Ms. Mulligan serves as a board member of The
Guardian Life Insurance Company of America, the
American Council of Life Insurers, the Partnership
for New York City (business leadership), and the
Committee Encouraging Corporate Philanthropy. She
also serves as a trustee of the Economic Club of New
York and the Bruce Museum (arts and science) and
as a member of the Advisory Council for the Stanford
Graduate School of Business. She was born in 1963.
André F. Perold
Dr. Perold has served as trustee since December
2004. Dr. Perold is the George Gund Professor of
Finance and Banking, Emeritus at the Harvard
Business School (retired 2011). Dr. Perold serves
as chief investment officer and co-managing partner
of HighVista Strategies LLC (private investment firm).
Dr. Perold also serves as an overseer of the Museum
of Fine Arts Boston. He was born in 1952.
Sarah Bloom Raskin
Ms. Raskin has served as trustee since January 2018.
Ms. Raskin served as deputy secretary of the United
States Department of the Treasury (2014–2017), as a
governor of the Federal Reserve Board (2010–2014),
and as commissioner of financial regulation of the
State of Maryland (2007–2010). Ms. Raskin also

served as a member of the Neighborhood
Reinvestment Corporation’s board of directors
(2012–2014). Ms. Raskin serves as a director
of i(x) Investments, LLC. She was born in 1961.
Peter F. Volanakis
Mr. Volanakis has served as trustee since July 2009.
Mr. Volanakis is the retired president and chief
operating officer (retired 2010) of Corning Incorporated
(communications equipment) and a former director of
Corning Incorporated (2000–2010) and Dow Corning
(2001–2010). Mr. Volanakis served as a director of
SPX Corporation (multi-industry manufacturing)
(2012) and as an overseer of the Amos Tuck School
of Business Administration at Dartmouth College
(2001–2013). Mr. Volanakis serves as chairman of
the board of trustees of Colby-Sawyer College and is
a member of the board of Hypertherm Inc. (industrial
cutting systems, software, and consumables). He
was born in 1955.
Executive Officers
Glenn Booraem
Mr. Booraem, a principal of Vanguard, has served
as investment stewardship officer of each of the
investment companies served by Vanguard since
February 2017. Mr. Booraem served as treasurer
(2015–2017), controller (2010–2015), and assistant
controller (2001–2010) of each of the investment
companies served by Vanguard. He was born in 1967.
Christine M. Buchanan
Ms. Buchanan, a principal of Vanguard, has served
as treasurer of each of the investment companies
served by Vanguard since November 2017. She
also serves as global head of Fund Administration
at Vanguard. Ms. Buchanan served as a partner at
KPMG LLP (audit, tax, and advisory services)
(2005–2017). She was born in 1970.
Thomas J. Higgins
Mr. Higgins, a principal of Vanguard, has served
as chief financial officer of each of the investment
companies served by Vanguard since 2008.
Mr. Higgins served as treasurer of each of the
investment companies served by Vanguard
(1998–2008). He was born in 1957.
Peter Mahoney
Mr. Mahoney, a principal of Vanguard, has served
as controller of each of the investment companies
served by Vanguard since May 2015. Mr. Mahoney
served as head of International Fund Services at
Vanguard (2008–2014). He was born in 1974.
Anne E. Robinson
Ms. Robinson has served as general counsel
of Vanguard since September 2016; as secretary
of Vanguard and of each of the investment companies
served by Vanguard since September 2016; as director
and senior vice president of Vanguard Marketing
Corporation since September 2016; and as a
managing director of Vanguard since August 2016.
Ms. Robinson served as managing director and
general counsel of Global Cards and Consumer
Services at Citigroup (2014–2016). She served
as counsel at American Express (2003–2014).
She was born in 1970.
Michael Rollings
Mr. Rollings, a managing director of Vanguard since
June 2016, has served as finance director of each
of the investment companies served by Vanguard
since November 2017 and as a director of Vanguard
Marketing Corporation since June 2016. Mr. Rollings
served as treasurer of each of the investment
companies served by Vanguard from February 2017 to
November 2017. He also served as the executive vice
president and chief financial officer of MassMutual
Financial Group (2006–2016). He was born in 1963.
Vanguard Senior Management Team
Mortimer J. Buckley James M. Norris
Gregory Davis Thomas M. Rampulla
John James Karin A. Risi
Martha G. King Anne E. Robinson
John T. Marcante Michael Rollins
Chris D. McIsaac
Chairman Emeritus and Senior Advisor
John J. Brennan
Chairman, 1996–2009
Chief Executive Officer and President, 1996–2008
Founder
John C. Bogle
Chairman and Chief Executive Officer, 1974–1996
P.O. Box 2600
Valley Forge, PA 19482-2600
Connect with Vanguard® > vanguard.com
Fund Information > 800-662-7447
Direct Investor Account Services > 800-662-2739
Institutional Investor Services > 800-523-1036
Text Telephone for PeopleWho Are Deaf or Hard of Hearing > 800-749-7273
This material may be used in conjunctionwith the offering of shares of any Vanguardfund only if preceded or accompanied bythe fund’s current prospectus.
All comparative mutual fund data are from Lipper, aThomson Reuters Company, or Morningstar, Inc., unlessotherwise noted.
You can obtain a free copy of Vanguard’s proxy votingguidelines by visiting vanguard.com/proxyreporting or bycalling Vanguard at 800-662-2739. The guidelines arealso available from the SEC’s website, sec.gov. Inaddition, you may obtain a free report on how your fundvoted the proxies for securities it owned during the 12months ended June 30. To get the report, visit eithervanguard.com/proxyreporting or sec.gov.
You can review and copy information about your fund atthe SEC’s Public Reference Room in Washington, D.C. Tofind out more about this public service, call the SEC at202-551-8090. Information about your fund is alsoavailable on the SEC’s website, and you can receivecopies of this information, for a fee, by sending arequest in either of two ways: via email addressed [email protected] or via regular mail addressed to thePublic Reference Section, Securities and ExchangeCommission, Washington, DC 20549-1520.
Source for Bloomberg Barclays indexes: BloombergIndex Services Limited. Copyright 2017, Bloomberg. Allrights reserved.
CFA® is a registered trademark owned by CFA Institute.
© 2018 The Vanguard Group, Inc.All rights reserved.Vanguard Marketing Corporation, Distributor.
Q520 032018