Embed Size (px)
Citation preview

Semiannual Report | February 28, 2021
Vanguard FTSE Social Index Fund
Contents
About Your Fund’s Expenses . . . . . . . . . . . . . . . . . . . . . . . . . .1
Financial Statements . . . . . . . . . . . . . . . . . . . . . . . . . . . . . . . . .4

As a shareholder of the fund, you incur ongoing costs, which include costs for portfolio
management, administrative services, and shareholder reports (like this one), among others.
Operating expenses, which are deducted from a fund’s gross income, directly reduce the
investment return of the fund.
A fund’s expenses are expressed as a percentage of its average net assets. This figure is known
as the expense ratio. The following examples are intended to help you understand the ongoing
costs (in dollars) of investing in your fund and to compare these costs with those of other mutual
funds. The examples are based on an investment of $1,000 made at the beginning of the period
shown and held for the entire period.
The accompanying table illustrates your fund’s costs in two ways:
• Based on actual fund return. This section helps you to estimate the actual expenses that you
paid over the period. The ”Ending Account Value“ shown is derived from the fund‘s actual return,
and the third column shows the dollar amount that would have been paid by an investor who
started with $1,000 in the fund. You may use the information here, together with the amount you
invested, to estimate the expenses that you paid over the period.
To do so, simply divide your account value by $1,000 (for example, an $8,600 account value
divided by $1,000 = 8.6), then multiply the result by the number given for your fund under the
heading ”Expenses Paid During Period.“
• Based on hypothetical 5% yearly return. This section is intended to help you compare your
fund‘s costs with those of other mutual funds. It assumes that the fund had a yearly return of 5%
before expenses, but that the expense ratio is unchanged. In this case—because the return used
is not the fund’s actual return—the results do not apply to your investment. The example is useful
in making comparisons because the Securities and Exchange Commission requires all mutual
funds to calculate expenses based on a 5% return. You can assess your fund’s costs by comparing
this hypothetical example with the hypothetical examples that appear in shareholder reports of
other funds.
Note that the expenses shown in the table are meant to highlight and help you compare ongoingcosts only and do not reflect transaction costs incurred by the fund for buying and selling
securities. Further, the expenses do not include any purchase, redemption, or account service fees
described in the fund prospectus. If such fees were applied to your account, your costs would be
higher. Your fund does not carry a “sales load.”
The calculations assume no shares were bought or sold during the period. Your actual costs may
have been higher or lower, depending on the amount of your investment and the timing of any
purchases or redemptions.
You can find more information about the fund’s expenses, including annual expense ratios, in the
Financial Statements section of this report. For additional information on operating expenses and
other shareholder costs, please refer to your fund’s current prospectus.
About Your Fund’s Expenses
1

Six Months Ended February 28, 2021
FTSE Social Index Fund
BeginningAccount Value
8/31/2020
EndingAccount Value
2/28/2021
ExpensesPaid During
Period
Based on Actual Fund Return
Admiral™ Shares $1,000.00 $ 1,091.50 $0.73
Institutional Shares 1,000.00 1,091.40 0.62
Based on Hypothetical 5% Yearly Return
Admiral Shares $1,000.00 $1,024.10 $0.70
Institutional Shares 1,000.00 1,024.20 0.60
The calculations are based on expenses incurred in the most recent six-month period. The fund’s annualized six-month expense ratios forthat period are 0.14% for Admiral Shares and 0.12% for Institutional Shares. The dollar amounts shown as “Expenses Paid” are equal tothe annualized expense ratio multiplied by the average account value over the period, multiplied by the number of days in the most recentsix-month period, then divided by the number of days in the most recent 12-month period (181/365).
2

Basic Materials 1.7%
Consumer Discretionary 18.0
Consumer Staples 5.0
Financials 10.6
Health Care 13.4
Industrials 11.1
Real Estate 2.9
Technology 32.5
Telecommunications 3.9
Utilities 0.9
The table reflects the fund’s investments, except short-terminvestments and derivatives. Sector categories are based on theIndustry Classification Benchmark (“ICB”), except for the “Other”category (if applicable), which includes securities that have notbeen provided an ICB classification as of the effective reportingperiod.
The fund may invest in derivatives (such as futures and swapcontracts) for various reasons, including, but not limited to,attempting to remain fully invested and tracking its target index asclosely as possible.
The Industry Classification Benchmark (“ICB”) is owned by FTSE. FTSE does not accept any liability to any person for anyloss or damage arising out of any error or omission in the ICB.
FTSE Social Index Fund
Fund AllocationAs of February 28, 2021
3

The fund files its complete schedule of portfolio holdings with the Securities and Exchange
Commission (SEC) for the first and third quarters of each fiscal year as an exhibit to its reports on
Form N-PORT. The fund’s Form N-PORT reports are available on the SEC’s website at
www.sec.gov.
Shares
MarketValue•
($000)
Common Stocks (99.7%)
Basic Materials (1.7%) Linde plc 208,077 50,827 Air Products and Chemicals Inc. 87,443 22,352 Dow Inc. 294,400 17,461 Newmont Corp. 318,226 17,305 International Flavors & Fragrances Inc. 98,453 13,341 Fastenal Co. 227,286 10,539 LyondellBasell Industries NV Class A 100,878 10,399 International Paper Co. 155,300 7,711 Nucor Corp. 119,194 7,130 Albemarle Corp. 45,118 7,093 Celanese Corp. Class A 46,200 6,418 Eastman Chemical Co. 53,800 5,878 Avery Dennison Corp. 33,140 5,806 FMC Corp. 51,210 5,208 CF Industries Holdings Inc. 83,139 3,765 Steel Dynamics Inc. 78,000 3,243 Westlake Chemical Corp. 13,200 1,130
195,606Consumer Discretionary (18.0%)* Amazon.com Inc. 167,910 519,334* Tesla Inc. 299,480 202,299 Walt Disney Co. 715,896 135,333 Home Depot Inc. 425,686 109,972* Netflix Inc. 168,461 90,775 NIKE Inc. Class B 485,682 65,460 McDonald's Corp. 294,932 60,797 Costco Wholesale Corp. 174,810 57,862 Starbucks Corp. 463,154 50,034 Lowe's Cos. Inc. 299,712 47,879* Booking Holdings Inc. 16,195 37,710 Target Corp. 197,590 36,246 TJX Cos. Inc. 473,732 31,262* MercadoLibre Inc. 18,100 29,650 Activision Blizzard Inc. 301,899 28,865* Uber Technologies Inc. 545,300 28,219 Estee Lauder Cos. Inc. Class A 87,731 25,079 Dollar General Corp. 99,683 18,839 Ford Motor Co. 1,546,347 18,092
FTSE Social Index Fund
Financial Statements (unaudited)
Schedule of InvestmentsAs of February 28, 2021
4

Shares
MarketValue•
($000)
Ross Stores Inc. 137,770 16,069* Chipotle Mexican Grill Inc. Class A 11,004 15,868* Spotify Technology SA 51,600 15,861 Aptiv plc 105,657 15,832 Electronic Arts Inc. 112,635 15,090 eBay Inc. 258,900 14,607* Lululemon Athletica Inc. 44,741 13,945 ViacomCBS Inc. Class B 214,601 13,840* O'Reilly Automotive Inc. 28,395 12,702 Yum! Brands Inc. 119,400 12,361* AutoZone Inc. 9,211 10,684* Etsy Inc. 46,800 10,309 VF Corp. 127,943 10,124 DR Horton Inc. 129,912 9,986 Yum China Holdings Inc. 159,382 9,537* Dollar Tree Inc. 92,276 9,061 Best Buy Co. Inc. 89,723 9,004* Copart Inc. 80,800 8,820 Lennar Corp. Class A 104,641 8,682 Expedia Group Inc. 53,390 8,596* Take-Two Interactive Software Inc. 44,800 8,264* Wayfair Inc. Class A 27,900 8,062* CarMax Inc. 64,164 7,668 Garmin Ltd. 58,928 7,308 Tractor Supply Co. 45,638 7,255 Darden Restaurants Inc. 51,367 7,054* Ulta Beauty Inc. 21,339 6,878* Burlington Stores Inc. 25,600 6,626* NVR Inc. 1,340 6,031 Genuine Parts Co. 55,709 5,869* Discovery Inc. Class C 130,398 5,868 Omnicom Group Inc. 84,433 5,803* Lyft Inc. Class A 98,000 5,459 Domino's Pizza Inc. 15,400 5,336* Live Nation Entertainment Inc. 56,500 5,021 Vail Resorts Inc. 15,900 4,916* LKQ Corp. 120,691 4,754 Hasbro Inc. 50,700 4,751 PulteGroup Inc. 104,380 4,709 Whirlpool Corp. 24,318 4,622 Fortune Brands Home & Security Inc. 54,831 4,559 BorgWarner Inc. 97,590 4,392 Fox Corp. Class A 126,530 4,215 Advance Auto Parts Inc. 26,125 4,189* Mohawk Industries Inc. 23,243 4,067 Interpublic Group of Cos. Inc. 155,013 4,049 Lear Corp. 23,256 3,863 Newell Brands Inc. 153,927 3,566 Southwest Airlines Co. 59,472 3,457 News Corp. Class A 145,200 3,405 Gentex Corp. 94,945 3,359 Aramark 88,587 3,288* Liberty Media Corp.- Liberty SiriusXM Class C 73,200 3,230 Autoliv Inc. 35,045 3,154 Nielsen Holdings plc 138,359 3,101
FTSE Social Index Fund
5

Shares
MarketValue•
($000)
Delta Air Lines Inc. 62,359 2,989* Discovery Inc. Class A 55,066 2,920 Rollins Inc. 86,700 2,876 Sirius XM Holdings Inc. 444,600 2,601 Fox Corp. Class B 64,872 2,071* United Airlines Holdings Inc. 28,541 1,503 News Corp. Class B 58,100 1,332* Liberty Media Corp.- Liberty SiriusXM Class A 29,200 1,297 American Airlines Group Inc. 52,994 1,110 Lennar Corp. Class B 8,300 549
2,032,081Consumer Staples (5.0%) Procter & Gamble Co. 965,047 119,212 Coca-Cola Co. 1,531,400 75,023 PepsiCo Inc. 549,800 71,029 CVS Health Corp. 517,116 35,231 Mondelez International Inc. Class A 558,327 29,681 Colgate-Palmolive Co. 333,566 25,084 Kimberly-Clark Corp. 133,950 17,190 Sysco Corp. 191,592 15,257 Walgreens Boots Alliance Inc. 286,380 13,726 Corteva Inc. 296,800 13,401 General Mills Inc. 239,999 13,202* Monster Beverage Corp. 145,945 12,805 McKesson Corp. 63,976 10,845 Kroger Co. 308,100 9,924 Kraft Heinz Co. 257,773 9,378 Clorox Co. 49,642 8,988 Hershey Co. 58,168 8,472 McCormick & Co. Inc. 97,828 8,245 Church & Dwight Co. Inc. 97,796 7,701 Tyson Foods Inc. Class A 113,454 7,677 Conagra Brands Inc. 192,604 6,535 AmerisourceBergen Corp. Class A 57,748 5,845 Kellogg Co. 99,475 5,741 Keurig Dr Pepper Inc. 177,506 5,418 Hormel Foods Corp. 110,725 5,134 J M Smucker Co. 43,853 4,912 Lamb Weston Holdings Inc. 58,118 4,636 Bunge Ltd. 54,099 4,143 Coca-Cola European Partners plc 79,498 4,050 Campbell Soup Co. 76,008 3,457 Ingredion Inc. 26,146 2,358* Herbalife Nutrition Ltd. 35,029 1,576
565,876Financials (10.6%) JPMorgan Chase & Co. 1,199,518 176,533 Bank of America Corp. 3,063,331 106,328 Citigroup Inc. 824,977 54,350 Morgan Stanley 553,892 42,578 Goldman Sachs Group Inc. 131,283 41,942 BlackRock Inc. 58,212 40,428 Charles Schwab Corp. 544,542 33,609 S&P Global Inc. 95,353 31,405 Truist Financial Corp. 532,973 30,358
FTSE Social Index Fund
6

Shares
MarketValue•
($000)
Chubb Ltd. 177,857 28,916 PNC Financial Services Group Inc. 167,898 28,267 CME Group Inc. 140,445 28,047 U.S. Bancorp 538,231 26,912 Intercontinental Exchange Inc. 219,032 24,161 Marsh & McLennan Cos. Inc. 200,291 23,078 Aon plc Class A 89,843 20,458 Progressive Corp. 231,470 19,895 Moody's Corp. 64,380 17,697 MetLife Inc. 303,620 17,489 American International Group Inc. 341,048 14,989 Travelers Cos. Inc. 100,005 14,551 T Rowe Price Group Inc. 89,298 14,479 IHS Markit Ltd. 156,929 14,149 Prudential Financial Inc. 156,525 13,574 MSCI Inc. Class A 32,250 13,368 Bank of New York Mellon Corp. 315,762 13,313 Aflac Inc. 275,122 13,176 Allstate Corp. 120,098 12,802 Discover Financial Services 121,577 11,437 First Republic Bank 68,537 11,291 Willis Towers Watson plc 51,026 11,258 Ameriprise Financial Inc. 46,846 10,364* SVB Financial Group 20,400 10,309 State Street Corp. 139,763 10,171 KKR & Co. Inc. 213,600 9,732 Fifth Third Bancorp 279,682 9,702 Arthur J Gallagher & Co. 75,089 8,996 MarketAxess Holdings Inc. 14,500 8,061 Regions Financial Corp. 378,883 7,816 KeyCorp. 383,573 7,725 M&T Bank Corp. 50,539 7,628 Citizens Financial Group Inc. 168,341 7,313 Northern Trust Corp. 75,710 7,202 Hartford Financial Services Group Inc. 141,325 7,164 Broadridge Financial Solutions Inc. 45,288 6,453 Nasdaq Inc. 45,356 6,272 Ally Financial Inc. 148,048 6,144 Huntington Bancshares Inc. 399,737 6,132 Principal Financial Group Inc. 107,645 6,091 Cincinnati Financial Corp. 59,551 5,828* Markel Corp. 5,352 5,827 Raymond James Financial Inc. 48,766 5,693* Arch Capital Group Ltd. 155,872 5,583 Credicorp Ltd. 31,900 5,104 Equitable Holdings Inc. 159,711 4,723 Annaly Capital Management Inc. 559,933 4,653 FactSet Research Systems Inc. 14,800 4,498 Lincoln National Corp. 76,883 4,372 Brown & Brown Inc. 94,000 4,315 Cboe Global Markets Inc. 43,100 4,265 Fidelity National Financial Inc. 109,213 4,181 Everest Re Group Ltd. 15,801 3,821 Comerica Inc. 55,604 3,787 W R Berkley Corp. 54,231 3,760
FTSE Social Index Fund
7
Shares
MarketValue•
($000)
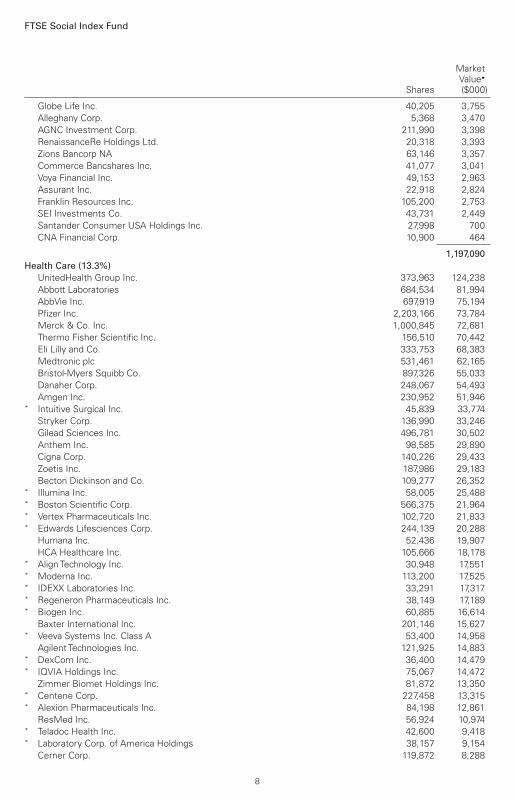
Globe Life Inc. 40,205 3,755 Alleghany Corp. 5,368 3,470 AGNC Investment Corp. 211,990 3,398 RenaissanceRe Holdings Ltd. 20,318 3,393 Zions Bancorp NA 63,146 3,357 Commerce Bancshares Inc. 41,077 3,041 Voya Financial Inc. 49,153 2,963 Assurant Inc. 22,918 2,824 Franklin Resources Inc. 105,200 2,753 SEI Investments Co. 43,731 2,449 Santander Consumer USA Holdings Inc. 27,998 700 CNA Financial Corp. 10,900 464
1,197,090Health Care (13.3%) UnitedHealth Group Inc. 373,963 124,238 Abbott Laboratories 684,534 81,994 AbbVie Inc. 697,919 75,194 Pfizer Inc. 2,203,166 73,784 Merck & Co. Inc. 1,000,845 72,681 Thermo Fisher Scientific Inc. 156,510 70,442 Eli Lilly and Co. 333,753 68,383 Medtronic plc 531,461 62,165 Bristol-Myers Squibb Co. 897,326 55,033 Danaher Corp. 248,067 54,493 Amgen Inc. 230,952 51,946* Intuitive Surgical Inc. 45,839 33,774 Stryker Corp. 136,990 33,246 Gilead Sciences Inc. 496,781 30,502 Anthem Inc. 98,585 29,890 Cigna Corp. 140,226 29,433 Zoetis Inc. 187,986 29,183 Becton Dickinson and Co. 109,277 26,352* Illumina Inc. 58,005 25,488* Boston Scientific Corp. 566,375 21,964* Vertex Pharmaceuticals Inc. 102,720 21,833* Edwards Lifesciences Corp. 244,139 20,288 Humana Inc. 52,436 19,907 HCA Healthcare Inc. 105,666 18,178* Align Technology Inc. 30,948 17,551* Moderna Inc. 113,200 17,525* IDEXX Laboratories Inc. 33,291 17,317* Regeneron Pharmaceuticals Inc. 38,149 17,189* Biogen Inc. 60,885 16,614 Baxter International Inc. 201,146 15,627* Veeva Systems Inc. Class A 53,400 14,958 Agilent Technologies Inc. 121,925 14,883* DexCom Inc. 36,400 14,479* IQVIA Holdings Inc. 75,067 14,472 Zimmer Biomet Holdings Inc. 81,872 13,350* Centene Corp. 227,458 13,315* Alexion Pharmaceuticals Inc. 84,198 12,861 ResMed Inc. 56,924 10,974* Teladoc Health Inc. 42,600 9,418* Laboratory Corp. of America Holdings 38,157 9,154 Cerner Corp. 119,872 8,288
FTSE Social Index Fund
8

Shares
MarketValue•
($000)
West Pharmaceutical Services Inc. 28,900 8,111* Exact Sciences Corp. 58,600 7,977* Seagen Inc. 49,900 7,540 Cooper Cos. Inc. 19,319 7,460 Teleflex Inc. 18,400 7,325* Hologic Inc. 101,027 7,283* Viatris Inc. 477,713 7,094* Alnylam Pharmaceuticals Inc. 45,488 6,737* Varian Medical Systems Inc. 35,863 6,286 Quest Diagnostics Inc. 52,797 6,103 Cardinal Health Inc. 115,713 5,962* Elanco Animal Health Inc. (XNYS) 180,407 5,928 STERIS plc 33,200 5,803* ABIOMED Inc. 17,580 5,706* Incyte Corp. 72,056 5,668* BioMarin Pharmaceutical Inc. 71,514 5,537* Bio-Rad Laboratories Inc. Class A 8,400 4,910* Masimo Corp. 19,500 4,889 DENTSPLY SIRONA Inc. 86,899 4,612 Universal Health Services Inc. Class B 29,470 3,694* Jazz Pharmaceuticals plc 21,054 3,538* Henry Schein Inc. 55,554 3,436* DaVita Inc. 29,723 3,036* Sarepta Therapeutics Inc. 29,100 2,533 Perrigo Co. plc 53,108 2,143
1,507,677Industrials (11.1%) Visa Inc. Class A 668,688 142,023 Mastercard Inc. Class A 349,462 123,657* PayPal Holdings Inc. 465,267 120,900 Accenture plc Class A 252,463 63,343 Union Pacific Corp. 268,889 55,380 Caterpillar Inc. 214,520 46,311 United Parcel Service Inc. Class B 283,809 44,794 Deere & Co. 124,146 43,342 American Express Co. 258,542 34,970 Fidelity National Information Services Inc. 244,307 33,714* Square Inc. Class A 146,000 33,584 Automatic Data Processing Inc. 170,096 29,600 CSX Corp. 301,626 27,614* Fiserv Inc. 227,326 26,227 Illinois Tool Works Inc. 124,734 25,219 FedEx Corp. 95,721 24,361 Global Payments Inc. 117,924 23,348 Sherwin-Williams Co. 32,654 22,216 Capital One Financial Corp. 179,782 21,608 Johnson Controls International plc 286,949 16,009 DuPont de Nemours Inc. 211,885 14,900 Trane Technologies plc 94,360 14,460 PACCAR Inc. 134,379 12,227 Paychex Inc. 127,500 11,611 Cintas Corp. 34,900 11,319 Rockwell Automation Inc. 45,568 11,086 Stanley Black & Decker Inc. 61,205 10,701* Keysight Technologies Inc. 74,266 10,510
FTSE Social Index Fund
9

Shares
MarketValue•
($000)
* Zebra Technologies Corp. Class A 20,800 10,388* Mettler-Toledo International Inc. 9,287 10,365 Verisk Analytics Inc. Class A 62,795 10,289* FleetCor Technologies Inc. 32,800 9,096 Synchrony Financial 229,353 8,871 Vulcan Materials Co. 52,006 8,684 Martin Marietta Materials Inc. 24,590 8,284 Old Dominion Freight Line Inc. 38,475 8,263 Kansas City Southern 36,751 7,804* Trimble Inc. 98,450 7,299 Xylem Inc. 70,653 7,034 Dover Corp. 56,818 7,003* Waters Corp. 24,209 6,630 WW Grainger Inc. 17,647 6,577 TransUnion 75,100 6,324 Expeditors International of Washington Inc. 66,687 6,124 IDEX Corp. 29,800 5,816 Masco Corp. 103,900 5,530 Westinghouse Air Brake Technologies Corp. 71,901 5,208* Fair Isaac Corp. 11,200 5,125 Packaging Corp. of America 37,320 4,927 JB Hunt Transport Services Inc. 33,451 4,913 CH Robinson Worldwide Inc. 52,797 4,797 Jack Henry & Associates Inc. 30,400 4,513 Westrock Co. 102,000 4,446 Snap-on Inc. 21,519 4,371* XPO Logistics Inc. 36,300 4,233 Allegion plc 36,959 4,020 Western Union Co. 159,627 3,706 Robert Half International Inc. 44,607 3,470
1,249,144Real Estate (2.9%) American Tower Corp. 174,485 37,711 Prologis Inc. 291,238 28,853 Crown Castle International Corp. 164,494 25,620 Equinix Inc. 35,210 22,828 Digital Realty Trust Inc. 110,246 14,853 Public Storage 59,637 13,952* CoStar Group Inc. 15,403 12,688 Welltower Inc. 165,837 11,260 SBA Communications Corp. Class A 43,900 11,200* CBRE Group Inc. Class A 131,274 9,947 AvalonBay Communities Inc. 55,321 9,723 Equity Residential 145,115 9,492* Zillow Group Inc. Class C 57,400 9,260 Alexandria Real Estate Equities Inc. 52,680 8,412 Realty Income Corp. 138,302 8,334 Ventas Inc. 147,198 7,787 Invitation Homes Inc. 221,441 6,453 Sun Communities Inc. 41,900 6,367 Extra Space Storage Inc. 50,000 6,285 Healthpeak Properties Inc. 213,150 6,201 Boston Properties Inc. 61,667 6,113 Mid-America Apartment Communities Inc. 45,126 6,080 Duke Realty Corp. 146,002 5,731
FTSE Social Index Fund
10

Shares
MarketValue•
($000)
UDR Inc. 116,433 4,794 WP Carey Inc. 67,700 4,640 Host Hotels & Resorts Inc. 278,900 4,627 Equity LifeStyle Properties Inc. 69,400 4,279 Iron Mountain Inc. 114,724 3,991* Zillow Group Inc. Class A 23,050 3,914 Regency Centers Corp. 67,402 3,692 VEREIT Inc. 85,018 3,316 Kimco Realty Corp. 166,644 3,055 Federal Realty Investment Trust 29,400 2,974 Vornado Realty Trust 68,358 2,935
327,367Technology (32.4%) Apple Inc. 6,392,064 775,102 Microsoft Corp. 2,965,878 689,211* Facebook Inc. Class A 951,177 245,042* Alphabet Inc. Class A 118,891 240,387* Alphabet Inc. Class C 115,136 234,516 NVIDIA Corp. 233,839 128,279 Intel Corp. 1,624,987 98,767* Adobe Inc. 190,560 87,595* salesforce.com Inc. 347,361 75,204 Broadcom Inc. 156,504 73,537 Texas Instruments Inc. 363,695 62,654 QUALCOMM Inc. 445,879 60,724 Oracle Corp. 746,951 48,186 Applied Materials Inc. 363,092 42,914 International Business Machines Corp. 351,460 41,799* ServiceNow Inc. 77,033 41,094* Micron Technology Inc. 439,670 40,243* Advanced Micro Devices Inc. 473,471 40,013 Intuit Inc. 99,838 38,951 Lam Research Corp. 57,371 32,540* Zoom Video Communications Inc. Class A 67,600 25,256* Autodesk Inc. 86,704 23,930* Twitter Inc. 308,499 23,773 Analog Devices Inc. 145,590 22,686* Twilio Inc. Class A 56,876 22,345 NXP Semiconductors NV 110,348 20,144 KLA Corp. 61,550 19,156* Workday Inc. Class A 69,856 17,127* DocuSign Inc. Class A 70,700 16,025 HP Inc. 542,787 15,725 Cognizant Technology Solutions Corp. Class A 212,237 15,595* Cadence Design Systems Inc. 108,800 15,351 Microchip Technology Inc. 98,700 15,065* Synopsys Inc. 59,615 14,618* Palo Alto Networks Inc. 36,818 13,192 Marvell Technology Group Ltd. 263,800 12,736 Xilinx Inc. 96,475 12,571* Atlassian Corp. plc Class A 52,000 12,360* Okta Inc. 45,500 11,896* RingCentral Inc. Class A 31,200 11,799 Skyworks Solutions Inc. 66,047 11,744 Maxim Integrated Products Inc. 105,596 9,838
FTSE Social Index Fund
11

Shares
MarketValue•
($000)
* Coupa Software Inc. 27,000 9,349* Splunk Inc. 62,458 8,932* Fortinet Inc. 52,400 8,848 CDW Corp. 55,908 8,771 Teradyne Inc. 65,100 8,373* Dell Technologies Class C 101,953 8,265 Western Digital Corp. 120,123 8,232* Qorvo Inc. 45,000 7,863* EPAM Systems Inc. 21,000 7,846* VeriSign Inc. 39,849 7,732* Yandex NV Class A 117,720 7,532 Hewlett Packard Enterprise Co. 509,361 7,416* Paycom Software Inc. 19,500 7,298* Wix.com Ltd. 19,100 6,658 Citrix Systems Inc. 48,738 6,510 Seagate Technology plc 88,871 6,508* Arista Networks Inc. 23,242 6,504* Slack Technologies Inc. Class A 151,000 6,180* Gartner Inc. 34,200 6,123* Akamai Technologies Inc. 63,303 5,982* Zscaler Inc. 28,600 5,864* Datadog Inc. Class A 60,200 5,744* PTC Inc. 41,300 5,656 NetApp Inc. 87,765 5,494* GoDaddy Inc. Class A 66,500 5,395* F5 Networks Inc. 24,244 4,606* Check Point Software Technologies Ltd. 41,658 4,592*,1 VMware Inc. Class A 32,174 4,447 NortonLifeLock Inc. 219,383 4,280 Amdocs Ltd. 51,025 3,868* Flex Ltd. 194,500 3,538* Arrow Electronics Inc. 29,188 2,926
3,667,022Telecommunications (3.8%) Comcast Corp. Class A 1,794,990 94,632 Verizon Communications Inc. 1,641,080 90,752 AT&T Inc. 2,825,280 78,797 Cisco Systems Inc. 1,682,185 75,480* Charter Communications Inc. Class A 57,340 35,173* T-Mobile US Inc. 217,623 26,108 Motorola Solutions Inc. 67,286 11,807 Lumen Technologies Inc. 434,300 5,338* Altice USA Inc. Class A 113,900 3,828* Liberty Global plc Class C 144,300 3,506* DISH Network Corp. Class A 95,700 3,016 Juniper Networks Inc. 127,625 2,971* Liberty Global plc Class A 72,200 1,778
433,186Utilities (0.9%) Waste Management Inc. 166,614 18,476 Sempra Energy 114,500 13,280 American Water Works Co. Inc. 71,797 10,187 Consolidated Edison Inc. 133,825 8,786 PPL Corp. 303,137 7,939 Edison International 141,400 7,634
FTSE Social Index Fund
12

Shares
MarketValue•
($000)
Republic Services Inc. Class A 82,932 7,388 AES Corp. 261,200 6,937 CMS Energy Corp. 113,205 6,125 Alliant Energy Corp. 99,300 4,584 Atmos Energy Corp. 49,800 4,214 CenterPoint Energy Inc. 196,416 3,818 NiSource Inc. 148,792 3,214 Avangrid Inc. 21,839 999
103,581
Total Common Stocks (Cost $6,671,659) 11,278,630
Temporary Cash Investments (0.2%)
Money Market Fund (0.2%)2,3 Vanguard Market Liquidity Fund, 0.099% (Cost $21,188) 211,879 21,188
Total Investments (99.9%) (Cost $6,692,847) 11,299,818
Other Assets and Liabilities—Net (0.1%) 7,628
Net Assets (100%) 11,307,446
Cost is in $000. • See Note A in Notes to Financial Statements.* Non-income-producing security.1 Includes partial security positions on loan to broker-dealers. The total value of securities on loan is $3,607,000.2 Affiliated money market fund available only to Vanguard funds and certain trusts and accounts managed by Vanguard. Rate shown is
the 7-day yield.3 Collateral of $3,837,000 was received for securities on loan.
Derivative Financial Instruments Outstanding as of Period End
Futures Contracts
($000)
Expiration
Number ofLong (Short)
ContractsNotionalAmount
Value andUnrealized
Appreciation(Depreciation)
Long Futures Contracts
E-mini S&P 500 Index March 2021 135 25,712 (320)
See accompanying Notes, which are an integral part of the Financial Statements.
FTSE Social Index Fund
13

($000s, except shares and per-share amounts) Amount
Assets
Investments in Securities, at Value
Unaffiliated Issuers (Cost $6,671,659) 11,278,630
Affiliated Issuers (Cost $21,188) 21,188
Total Investments in Securities 11,299,818
Investment in Vanguard 414
Cash Collateral Pledged—Futures Contracts 1,492
Receivables for Investment Securities Sold 78
Receivables for Accrued Income 9,767
Receivables for Capital Shares Issued 22,373
Total Assets 11,333,942
Liabilities
Due to Custodian 79
Payables for Investment Securities Purchased 17,559
Collateral for Securities on Loan 3,837
Payables for Capital Shares Redeemed 4,187
Payables to Vanguard 707
Variation Margin Payable—Futures Contracts 127
Total Liabilities 26,496
Net Assets 11,307,446
At February 28, 2021, net assets consisted of:
Paid-in Capital 7,168,339
Total Distributable Earnings (Loss) 4,139,107
Net Assets 11,307,446
Admiral Shares—Net Assets
Applicable to 174,833,297 outstanding $.001 par value shares ofbeneficial interest (unlimited authorization) 6,494,506
Net Asset Value Per Share—Admiral Shares $37.15
Institutional Shares—Net Assets
Applicable to 179,985,295 outstanding $.001 par value shares ofbeneficial interest (unlimited authorization) 4,812,940
Net Asset Value Per Share—Institutional Shares $26.74
See accompanying Notes, which are an integral part of the Financial Statements.
FTSE Social Index Fund
Statement of Assets and LiabilitiesAs of February 28, 2021
14

Six Months EndedFebruary 28, 2021
($000)
Investment Income
Income
Dividends1 67,642
Interest2 15
Securities Lending—Net 58
Total Income 67,715
Expenses
The Vanguard Group—Note B
Investment Advisory Services 760
Management and Administrative—Admiral Shares 3,369
Management and Administrative—Institutional Shares 2,161
Marketing and Distribution—Admiral Shares 146
Marketing and Distribution—Institutional Shares 74
Custodian Fees 36
Shareholders’ Reports—Admiral Shares 29
Shareholders’ Reports—Institutional Shares 11
Trustees’ Fees and Expenses 2
Total Expenses 6,588
Net Investment Income 61,127
Realized Net Gain (Loss)
Investment Securities Sold2 (21,661)
Futures Contracts 2,986
Realized Net Gain (Loss) (18,675)
Change in Unrealized Appreciation (Depreciation)
Investment Securities2 854,497
Futures Contracts (591)
Change in Unrealized Appreciation (Depreciation) 853,906
Net Increase (Decrease) in Net Assets Resulting from Operations 896,358
1 Dividends are net of foreign withholding taxes of $12,000.2 Interest income, realized net gain (loss), and change in unrealized appreciation (depreciation) from an affiliated company of the fund
were $14,000, $0, and $0, respectively. Purchases and sales are for temporary cash investment purposes.
See accompanying Notes, which are an integral part of the Financial Statements.
FTSE Social Index Fund
Statement of Operations
15

Six Months EndedFebruary 28,
2021
Year EndedAugust 31,
2020
($000) ($000)
Increase (Decrease) in Net Assets
Operations
Net Investment Income 61,127 118,476
Realized Net Gain (Loss) (18,675) (431,510)
Change in Unrealized Appreciation (Depreciation) 853,906 2,226,427
Net Increase (Decrease) in Net Assets Resulting from Operations 896,358 1,913,393
Distributions
Investor Shares — (124)
Admiral Shares (37,464) (65,035)
Institutional Shares (28,740) (50,308)
Total Distributions (66,204) (115,467)
Capital Share Transactions
Investor Shares — (59,575)
Admiral Shares 718,725 804,650
Institutional Shares 449,871 528,553
Net Increase (Decrease) from Capital Share Transactions 1,168,596 1,273,628
Total Increase (Decrease) 1,998,750 3,071,554
Net Assets
Beginning of Period 9,308,696 6,237,142
End of Period 11,307,446 9,308,696
See accompanying Notes, which are an integral part of the Financial Statements.
FTSE Social Index Fund
Statement of Changes in Net Assets
16

Admiral Shares
For a Share OutstandingThroughout Each Period
Six MonthsEnded
February 28,2021
Year Ended August 31,
February 7 ,20191 to
August 31,20192020
Net Asset Value, Beginning of Period $34.27 $27.27 $25.00
Investment Operations
Net Investment Income2 .212 .465 .273
Net Realized and Unrealized Gain (Loss) onInvestments 2.902 6.996 2.183
Total from Investment Operations 3.114 7.461 2.456
Distributions
Dividends from Net Investment Income (.234) (.461) (.186)
Distributions from Realized Capital Gains — — —
Total Distributions (.234) (.461) (.186)
Net Asset Value, End of Period $37.15 $34.27 $27.27
Total Return3 9.15% 27.83% 9.85%
Ratios/Supplemental Data
Net Assets, End of Period (Millions) $6,495 $5,305 $3,478
Ratio of Total Expenses to Average Net Assets 0.14% 0.14% 0.14%4
Ratio of Net Investment Income toAverage Net Assets 1.22% 1.60% 1.79%4
Portfolio Turnover Rate 2% 18% 11%5,6
The expense ratio and net investment income ratio for the current period have been annualized. 1 Inception.2 Calculated based on average shares outstanding.3 Total returns do not include account service fees that may have applied in the periods shown. Fund prospectuses provide information
about any applicable account service fees.4 Annualized.5 Reflects the fund’s portfolio turnover for the fiscal year ended August 31, 2019.6 Excludes the value of portfolio securities received or delivered as a result of in-kind purchases or redemptions of the fund’s capital
shares.
See accompanying Notes, which are an integral part of the Financial Statements.
FTSE Social Index Fund
Financial Highlights
17

Institutional Shares
For a Share OutstandingThroughout Each Period
Six MonthsEnded
February 28,2021
Year Ended August 31,
2020 2019 2018 2017 2016
Net Asset Value, Beginning of Period $24.67 $19.63 $19.28 $16.15 $13.96 $13.00
Investment Operations
Net Investment Income .1551 .3391 .3141 .3051 .2711 .254
Net Realized and Unrealized Gain (Loss) onInvestments 2.086 5.037 .351 3.105 2.175 1.029
Total from Investment Operations 2.241 5.376 .665 3.410 2.446 1.283
Distributions
Dividends from Net Investment Income (.171) (.336) (.315) (.280) (.256) (.323)
Distributions from Realized Capital Gains — — — — — —
Total Distributions (.171) (.336) (.315) (.280) (.256) (.323)
Net Asset Value, End of Period $26.74 $24.67 $19.63 $19.28 $16.15 $13.96
Total Return 9.14% 27.86% 3.58% 21.34% 17.72% 10.09%
Ratios/Supplemental Data
Net Assets, End of Period (Millions) $4,813 $4,003 $2,701 $2,349 $1,443 $876
Ratio of Total Expenses toAverage Net Assets 0.12% 0.12% 0.12% 0.12% 0.12% 0.12%
Ratio of Net Investment Income toAverage Net Assets 1.24% 1.62% 1.49% 1.71% 1.79% 1.97%
Portfolio Turnover Rate 2% 18% 11%2 8%2 11%2 16%2
The expense ratio and net investment income ratio for the current period have been annualized. 1 Calculated based on average shares outstanding.2 Excludes the value of portfolio securities received or delivered as a result of in-kind purchases or redemptions of the fund’s capital
shares.
See accompanying Notes, which are an integral part of the Financial Statements.
FTSE Social Index Fund
Financial Highlights
18

Vanguard FTSE Social Index Fund is registered under the Investment Company Act of 1940 as an
open-end investment company, or mutual fund. The fund offers two classes of shares: Admiral
Shares and Institutional Shares. Each of the share classes has different eligibility and minimum
purchase requirements, and is designed for different types of investors. Prior to November 7, 2019,
the fund offered Investor Shares. Effective at the close of business on November 7, 2019, the
remaining Investor Shares were converted to Admiral Shares.
Market disruptions associated with the COVID-19 pandemic have had a global impact, anduncertainty exists as to the long-term implications. Such disruptions can adversely affect assets ofthe fund and thus fund performance.
A. The following significant accounting policies conform to generally accepted accountingprinciples for U.S. investment companies. The fund consistently follows such policies in preparingits financial statements.
1. Security Valuation: Securities are valued as of the close of trading on the New York StockExchange (generally 4 p.m., Eastern time) on the valuation date. Equity securities are valued at thelatest quoted sales prices or official closing prices taken from the primary market in which eachsecurity trades; such securities not traded on the valuation date are valued at the mean of thelatest quoted bid and asked prices. Securities for which market quotations are not readily available,or whose values have been materially affected by events occurring before the fund’s pricing timebut after the close of the securities’ primary markets, are valued by methods deemed by the boardof trustees to represent fair value. Investments in Vanguard Market Liquidity Fund are valued atthat fund's net asset value. Temporary cash investments are valued using the latest bid prices orusing valuations based on a matrix system (which considers such factors as security prices, yields,maturities, and ratings), both as furnished by independent pricing services.
2. Futures Contracts: The fund uses index futures contracts to a limited extent, with the objectivesof maintaining full exposure to the stock market, maintaining liquidity, and minimizing transactioncosts. The fund may purchase futures contracts to immediately invest incoming cash in themarket, or sell futures in response to cash outflows, thereby simulating a fully invested position inthe underlying index while maintaining a cash balance for liquidity. The primary risks associatedwith the use of futures contracts are imperfect correlation between changes in market values ofstocks held by the fund and the prices of futures contracts, and the possibility of an illiquid market.Counterparty risk involving futures is mitigated because a regulated clearinghouse is thecounterparty instead of the clearing broker. To further mitigate counterparty risk, the fund tradesfutures contracts on an exchange, monitors the financial strength of its clearing brokers andclearinghouse, and has entered into clearing agreements with its clearing brokers. Theclearinghouse imposes initial margin requirements to secure the fund’s performance and requiresdaily settlement of variation margin representing changes in the market value of each contract. Anysecurities pledged as initial margin for open contracts are noted in the Schedule of Investments.
Futures contracts are valued at their quoted daily settlement prices. The notional amounts of thecontracts are not recorded in the Statement of Assets and Liabilities. Fluctuations in the value ofthe contracts are recorded in the Statement of Assets and Liabilities as an asset (liability) and inthe Statement of Operations as unrealized appreciation (depreciation) until the contracts areclosed, when they are recorded as realized gains (losses) on futures contracts.
FTSE Social Index Fund
Notes to Financial Statements
19

During the six months ended February 28, 2021, the fund’s average investments in long and shortfutures contracts represented less than 1% and 0% of net assets, respectively, based on theaverage of the notional amounts at each quarter-end during the period.
3. Federal Income Taxes: The fund intends to continue to qualify as a regulated investmentcompany and distribute all of its taxable income. The fund’s tax returns are open to examination bythe relevant tax authorities until expiration of the applicable statute of limitations, which isgenerally three years after the filing of the tax return. Management has analyzed the fund’s taxpositions taken for all open federal and state income tax years, and has concluded that noprovision for income tax is required in the fund’s financial statements.
4. Distributions: Distributions to shareholders are recorded on the ex-dividend date. Distributionsare determined on a tax basis at the fiscal year-end and may differ from net investment incomeand realized capital gains for financial reporting purposes.
5. Securities Lending: To earn additional income, the fund lends its securities to qualifiedinstitutional borrowers. Security loans are subject to termination by the fund at any time, and arerequired to be secured at all times by collateral in an amount at least equal to the market value ofsecurities loaned. Daily market fluctuations could cause the value of loaned securities to be moreor less than the value of the collateral received. When this occurs, the collateral is adjusted andsettled before the opening of the market on the next business day. The fund further mitigates itscounterparty risk by entering into securities lending transactions only with a diverse group ofprequalified counterparties, monitoring their financial strength, and entering into master securitieslending agreements with its counterparties. The master securities lending agreements providethat, in the event of a counterparty’s default (including bankruptcy), the fund may terminate anyloans with that borrower, determine the net amount owed, and sell or retain the collateral up tothe net amount owed to the fund; however, such actions may be subject to legal proceedings.While collateral mitigates counterparty risk, in the event of a default, the fund may experiencedelays and costs in recovering the securities loaned. The fund invests cash collateral received inVanguard Market Liquidity Fund, and records a liability in the Statement of Assets and Liabilitiesfor the return of the collateral, during the period the securities are on loan. Collateral investmentsin Vanguard Market Liquidity Fund are subject to market appreciation or depreciation. Securitieslending income represents fees charged to borrowers plus income earned on invested cashcollateral, less expenses associated with the loan. During the term of the loan, the fund is entitledto all distributions made on or in respect of the loaned securities.
6. Credit Facilities and Interfund Lending Program: The fund and certain other funds managed byThe Vanguard Group ("Vanguard") participate in a $4.3 billion committed credit facility provided by asyndicate of lenders pursuant to a credit agreement and an uncommitted credit facility provided byVanguard. Both facilities may be renewed annually. Each fund is individually liable for itsborrowings, if any, under the credit facilities. Borrowings may be utilized for temporary oremergency purposes, subject to the fund’s regulatory and contractual borrowing restrictions. Withrespect to the committed credit facility, the participating funds are charged administrative fees andan annual commitment fee of 0.10% of the undrawn committed amount of the facility; these feesare allocated to the funds based on a method approved by the fund’s board of trustees andincluded in Management and Administrative expenses on the fund’s Statement of Operations. Anyborrowings under either facility bear interest at a rate based upon the higher of the one-monthLondon Interbank Offered Rate (or an acceptable alternate rate, if necessary), federal funds
FTSE Social Index Fund
20

effective rate, or overnight bank funding rate plus an agreed-upon spread, except that borrowingsunder the uncommitted credit facility may bear interest based upon an alternate rate agreed to bythe fund and Vanguard.
In accordance with an exemptive order (the “Order”) from the SEC, the fund may participate in ajoint lending and borrowing program that allows registered open-end Vanguard funds to borrowmoney from and lend money to each other for temporary or emergency purposes (the “InterfundLending Program”), subject to compliance with the terms and conditions of the Order, and to theextent permitted by the fund’s investment objective and investment policies. Interfund loans andborrowings normally extend overnight, but can have a maximum duration of seven days. Loansmay be called on one business day’s notice. The interest rate to be charged is governed by theconditions of the Order and internal procedures adopted by the board of trustees. The board oftrustees is responsible for overseeing the Interfund Lending Program.
For the six months ended February 28, 2021, the fund did not utilize the credit facilities or theInterfund Lending Program.
7. Other: Dividend income is recorded on the ex-dividend date. Non-cash dividends included individend income, if any, are recorded at the fair value of the securities received. Interest incomeincludes income distributions received from Vanguard Market Liquidity Fund and is accrued daily.Premiums and discounts on debt securities are amortized and accreted, respectively, to interestincome over the lives of the respective securities, except for premiums on certain callable debtsecurities that are amortized to the earliest call date. Security transactions are accounted for onthe date securities are bought or sold. Costs used to determine realized gains (losses) on the saleof investment securities are those of the specific securities sold.
Each class of shares has equal rights as to assets and earnings, except that each class separatelybears certain class-specific expenses related to maintenance of shareholder accounts (included inManagement and Administrative expenses) and shareholder reporting. Marketing and distributionexpenses are allocated to each class of shares based on a method approved by the board oftrustees. Income, other non-class-specific expenses, and gains and losses on investments areallocated to each class of shares based on its relative net assets.
B. In accordance with the terms of a Funds' Service Agreement (the “FSA”) between Vanguardand the fund, Vanguard furnishes to the fund investment advisory, corporate management,administrative, marketing, and distribution services at Vanguard’s cost of operations (as defined bythe FSA). These costs of operations are allocated to the fund based on methods and guidelinesapproved by the board of trustees and are generally settled twice a month.
Upon the request of Vanguard, the fund may invest up to 0.40% of its net assets as capital inVanguard. At February 28, 2021, the fund had contributed to Vanguard capital in the amount of$414,000, representing less than 0.01% of the fund’s net assets and 0.17% of Vanguard’s capitalreceived pursuant to the FSA. The fund’s trustees and officers are also directors and employees,respectively, of Vanguard.
C. Various inputs may be used to determine the value of the fund’s investments and derivatives.These inputs are summarized in three broad levels for financial statement purposes. The inputs ormethodologies used to value securities are not necessarily an indication of the risk associated withinvesting in those securities.
Level 1—Quoted prices in active markets for identical securities.
FTSE Social Index Fund
21

Level 2—Other significant observable inputs (including quoted prices for similar securities, interestrates, prepayment speeds, credit risk, etc.).
Level 3—Significant unobservable inputs (including the fund’s own assumptions used todetermine the fair value of investments). Any investments and derivatives valued with significantunobservable inputs are noted on the Schedule of Investments.
At February 28, 2021, 100% of the market value of the fund’s investments and derivatives wasdetermined based on Level 1 inputs.
D. As of February 28, 2021, gross unrealized appreciation and depreciation for investments andderivatives based on cost for U.S. federal income tax purposes were as follows:
Amount($000)
Tax Cost 6,697,892
Gross Unrealized Appreciation 4,642,678
Gross Unrealized Depreciation (41,072)
Net Unrealized Appreciation (Depreciation) 4,601,606
The fund’s tax-basis capital gains and losses are determined only at the end of each fiscal year. Fortax purposes, at August 31, 2020, the fund had available capital losses totaling $467,063,000 thatmay be carried forward indefinitely to offset future net capital gains. The fund will use these capitallosses to offset net taxable capital gains, if any, realized during the year ending August 31, 2021;should the fund realize net capital losses for the year, the losses will be added to the losscarryforward balance above.
E. During the six months ended February 28, 2021, the fund purchased $1,313,446,000 ofinvestment securities and sold $149,924,000 of investment securities, other than temporary cashinvestments.
The fund purchased securities from and sold securities to other Vanguard funds or accountsmanaged by Vanguard or its affiliates, in accordance with procedures adopted by the board oftrustees in compliance with Rule 17a-7 of the Investment Company Act of 1940. For the sixmonths ended February 28, 2021, such purchases and sales were $53,107,000 and $37,122,000,respectively; these amounts, other than temporary cash investments, are included in thepurchases and sales of investment securities noted above.
F. Capital share transactions for each class of shares were:
Six Months EndedFebruary 28, 2021
Year EndedAugust 31, 2020
Amount($000)
Shares(000)
Amount($000)
Shares(000)
Investor Shares
Issued — — 922 45
Issued in Lieu of Cash Distributions — — 124 6
Redeemed1 — — (60,621) (3,047)
Net Increase (Decrease)—Investor Shares — — (59,575) (2,996)
FTSE Social Index Fund
22
Six Months EndedFebruary 28, 2021
Year EndedAugust 31, 2020
Amount($000)
Shares(000)
Amount($000)
Shares(000)
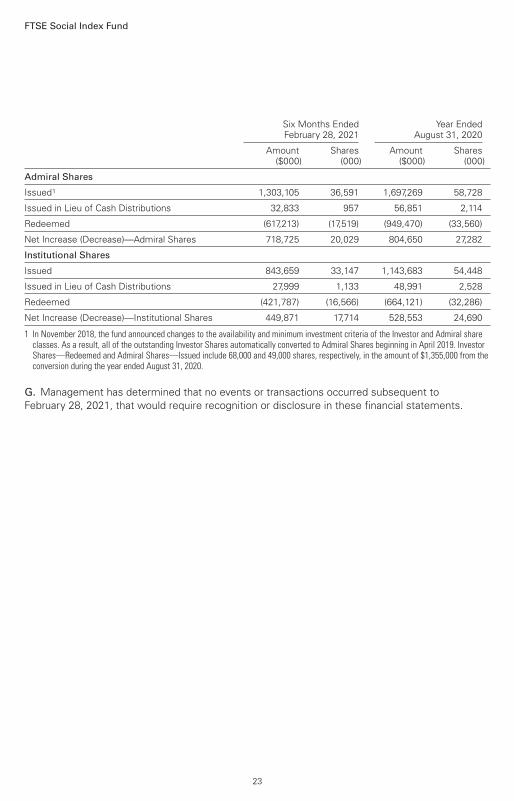
Admiral Shares
Issued1 1,303,105 36,591 1,697,269 58,728
Issued in Lieu of Cash Distributions 32,833 957 56,851 2,114
Redeemed (617,213) (17,519) (949,470) (33,560)
Net Increase (Decrease)—Admiral Shares 718,725 20,029 804,650 27,282
Institutional Shares
Issued 843,659 33,147 1,143,683 54,448
Issued in Lieu of Cash Distributions 27,999 1,133 48,991 2,528
Redeemed (421,787) (16,566) (664,121) (32,286)
Net Increase (Decrease)—Institutional Shares 449,871 17,714 528,553 24,690 1 In November 2018, the fund announced changes to the availability and minimum investment criteria of the Investor and Admiral share
classes. As a result, all of the outstanding Investor Shares automatically converted to Admiral Shares beginning in April 2019. InvestorShares—Redeemed and Admiral Shares—Issued include 68,000 and 49,000 shares, respectively, in the amount of $1,355,000 from theconversion during the year ended August 31, 2020.
G. Management has determined that no events or transactions occurred subsequent toFebruary 28, 2021, that would require recognition or disclosure in these financial statements.
FTSE Social Index Fund
23

London Stock Exchange Group companies include FTSE International Limited (“FTSE”), Frank Russell Company(“Russell”), MTS Next Limited (“MTS”), and FTSE TMX Global Debt Capital Markets Inc. (“FTSE TMX”). All rightsreserved. “FTSE®”, “Russell®”, “MTS®”, “FTSE TMX®” and “FTSE Russell” and other service marks and trademarksrelated to the FTSE or Russell indexes are trademarks of the London Stock Exchange Group companies and are used byFTSE, MTS, FTSE TMX and Russell under license. All information is provided for information purposes only. Every effort ismade to ensure that all information given in this publication is accurate, but no responsibility or liability can be acceptedby the London Stock Exchange Group companies nor its licensors for any errors or for any loss from use of thispublication. Neither the London Stock Exchange Group companies nor any of their licensors make any claim, prediction,warranty or representation whatsoever, expressly or impliedly, either as to the results to be obtained from the use of theIndices or the fitness or suitability of the Indices for any particular purpose to which they might be put. The London StockExchange Group companies do not provide investment advice and nothing in this document should be taken asconstituting financial or investment advice. The London Stock Exchange Group companies make no representationregarding the advisability of investing in any asset. A decision to invest in any such asset should not be made in relianceon any information herein. Indexes cannot be invested in directly. Inclusion of an asset in an index is not arecommendation to buy, sell or hold that asset. The general information contained in this publication should not be actedupon without obtaining specific legal, tax, and investment advice from a licensed professional. No part of thisinformation may be reproduced, stored in a retrieval system or transmitted in any form or by any means, electronic,mechanical, photocopying, recording or otherwise, without prior written permission of the London Stock Exchange Groupcompanies. Distribution of the London Stock Exchange Group companies’ index values and the use of their indexes tocreate financial products require a license with FTSE, FTSE TMX, MTS and/or Russell and/or its licensors.
24

This page intentionally left blank.

Connect with Vanguard® > vanguard.com
Fund Information > 800-662-7447
Direct Investor Account Services > 800-662-2739
Institutional Investor Services > 800-523-1036
Text Telephone for People Who Are Deaf or Hardof Hearing > 800-749-7273
This material may be used in conjunctionwith the offering of share of any Vanguardfund if preceded or accompanied by thefund's current prospectus.
You can obtain a free copy of Vanguard’s proxy votingguidelines by visiting vanguard.com/proxyreporting or bycalling Vanguard at 800-662-2739. The guidelines arealso available from the SEC’s website, www.sec.gov. Inaddition, you may obtain a free report on how your fundvoted the proxies for securities it owned during the 12months ended June 30. To get the report, visit eithervanguard.com/proxyreporting or www.sec.gov.
You can review information about your fund on the SEC’swebsite, and you can receive copies of this information,for a fee, by sending a request via email addressed [email protected].
© 2021 The Vanguard Group, Inc.All rights reserved.Vanguard Marketing Corporation, Distributor.
Q2132 042021