Embed Size (px)
Citation preview
See the inside front cover for important information about accessto your fund’s annual and semiannual shareholder reports.
Annual Report | September 30, 2020
Vanguard U.S. Value Fund
Contents
Please note: The opinions expressed in this report are just that—informed opinions. They should not be considered promisesor advice. Also, please keep in mind that the information and opinions cover the period through the date on the front of thisreport. Of course, the risks of investing in your fund are spelled out in the prospectus.
Important information about access to shareholder reports
Beginning on January 1, 2021, as permitted by regulations adopted by theSecurities and Exchange Commission, paper copies of your fund’s annual andsemiannual shareholder reports will no longer be sent to you by mail, unless youspecifically request them. Instead, you will be notified by mail each time a reportis posted on the website and will be provided with a link to access the report.
If you have already elected to receive shareholder reports electronically, you will notbe affected by this change and do not need to take any action. You may elect toreceive shareholder reports and other communications from the fund electronicallyby contacting your financial intermediary (such as a broker-dealer or bank) or, if youinvest directly with the fund, by calling Vanguard at one of the phone numbers onthe back cover of this report or by logging on to vanguard.com.
You may elect to receive paper copies of all future shareholder reports freeof charge. If you invest through a financial intermediary, you can contact theintermediary to request that you continue to receive paper copies. If you investdirectly with the fund, you can call Vanguard at one of the phone numbers on theback cover of this report or log on to vanguard.com. Your election to receive papercopies will apply to all the funds you hold through an intermediary or directly withVanguard.
Your Fund’s Performance at a Glance. . . . . . . . . . . . . . . . . . 1
Advisor’s Report. . . . . . . . . . . . . . . . . . . . . . . . . . . . . . . . . . . 2
About Your Fund’s Expenses. . . . . . . . . . . . . . . . . . . . . . . . . 4
Performance Summary. . . . . . . . . . . . . . . . . . . . . . . . . . . . . .6
Financial Statements. . . . . . . . . . . . . . . . . . . . . . . . . . . . . . . 8
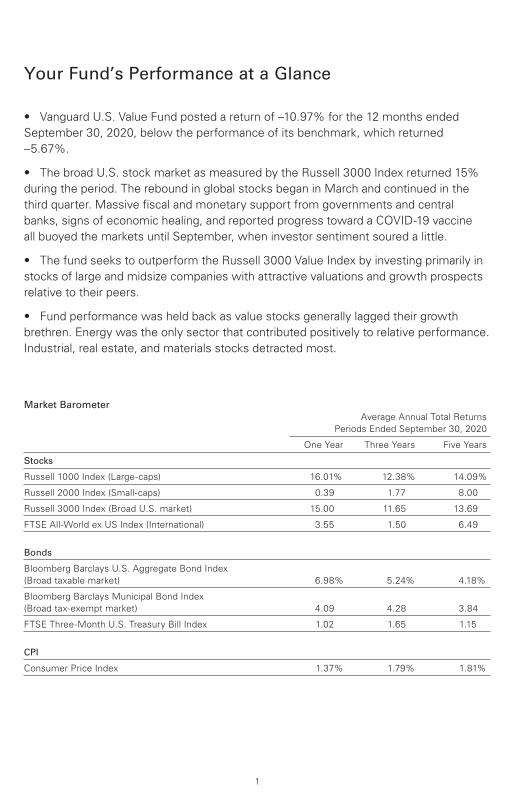
• Vanguard U.S. Value Fund posted a return of –10.97% for the 12 months ended
September 30, 2020, below the performance of its benchmark, which returned
–5.67%.
• The broad U.S. stock market as measured by the Russell 3000 Index returned 15%
during the period. The rebound in global stocks began in March and continued in the
third quarter. Massive fiscal and monetary support from governments and central
banks, signs of economic healing, and reported progress toward a COVID-19 vaccine
all buoyed the markets until September, when investor sentiment soured a little.
• The fund seeks to outperform the Russell 3000 Value Index by investing primarily in
stocks of large and midsize companies with attractive valuations and growth prospects
relative to their peers.
• Fund performance was held back as value stocks generally lagged their growth
brethren. Energy was the only sector that contributed positively to relative performance.
Industrial, real estate, and materials stocks detracted most.
Your Fund’s Performance at a Glance
Market Barometer Average Annual Total Returns
Periods Ended September 30, 2020
One Year Three Years Five Years
Stocks
Russell 1000 Index (Large-caps) 16.01% 12.38% 14.09%
Russell 2000 Index (Small-caps) 0.39 1.77 8.00
Russell 3000 Index (Broad U.S. market) 15.00 11.65 13.69
FTSE All-World ex US Index (International) 3.55 1.50 6.49
Bonds
Bloomberg Barclays U.S. Aggregate Bond Index
(Broad taxable market) 6.98% 5.24% 4.18%
Bloomberg Barclays Municipal Bond Index
(Broad tax-exempt market) 4.09 4.28 3.84
FTSE Three-Month U.S. Treasury Bill Index 1.02 1.65 1.15
CPI
Consumer Price Index 1.37% 1.79% 1.81%
1
Advisor’s Report
2
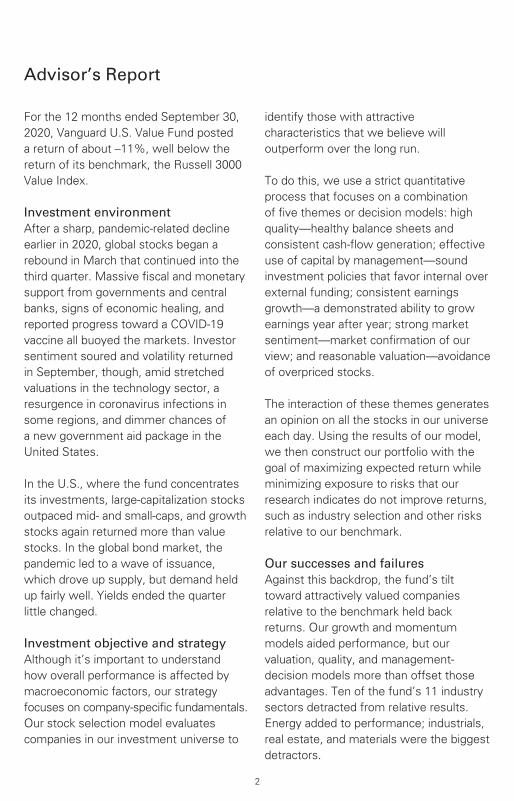
For the 12 months ended September 30, 2020, Vanguard U.S. Value Fund posted a return of about –11%, well below the return of its benchmark, the Russell 3000 Value Index.
Investment environmentAfter a sharp, pandemic-related decline earlier in 2020, global stocks began a rebound in March that continued into the third quarter. Massive fiscal and monetary support from governments and central banks, signs of economic healing, and reported progress toward a COVID-19 vaccine all buoyed the markets. Investor sentiment soured and volatility returned in September, though, amid stretched valuations in the technology sector, a resurgence in coronavirus infections in some regions, and dimmer chances of a new government aid package in the United States.
In the U.S., where the fund concentrates its investments, large-capitalization stocks outpaced mid- and small-caps, and growth stocks again returned more than value stocks. In the global bond market, the pandemic led to a wave of issuance, which drove up supply, but demand held up fairly well. Yields ended the quarter little changed.
Investment objective and strategyAlthough it’s important to understand how overall performance is affected by macroeconomic factors, our strategy focuses on company-specific fundamentals. Our stock selection model evaluates companies in our investment universe to
identify those with attractive characteristics that we believe will outperform over the long run.
To do this, we use a strict quantitative process that focuses on a combination of five themes or decision models: high quality—healthy balance sheets and consistent cash-flow generation; effective use of capital by management—sound investment policies that favor internal over external funding; consistent earnings growth—a demonstrated ability to grow earnings year after year; strong market sentiment—market confirmation of our view; and reasonable valuation—avoidance of overpriced stocks.
The interaction of these themes generates an opinion on all the stocks in our universe each day. Using the results of our model, we then construct our portfolio with the goal of maximizing expected return while minimizing exposure to risks that our research indicates do not improve returns, such as industry selection and other risks relative to our benchmark.
Our successes and failuresAgainst this backdrop, the fund’s tilt toward attractively valued companies relative to the benchmark held back returns. Our growth and momentum models aided performance, but our valuation, quality, and management-decision models more than offset those advantages. Ten of the fund’s 11 industry sectors detracted from relative results. Energy added to performance; industrials, real estate, and materials were the biggest detractors.
3
At the individual holding level, the portfolio benefited from information technology stocks Lam Research and Dell, as well as health care companies Abbott Laboratories, Amgen, and Anthem. The greatest shortfalls came from Capital One, Equitable Holdings, and Hanover in financials and Devon Energy and Chevron in energy.
As with any other form of active equity strategy, ours are designed to deliver long-term outperformance. We continue to believe that constructing a portfolio focused on the fundamentals we’ve described will benefit investors over the long term, although we recognize that
markets can reward or punish us in the near term. We believe the fund offers a strong mix of stocks with attractive valuation and growth characteristics.
Portfolio Managers:
James P. Stetler
Binbin Guo, Principal, Head of Alpha Equity Investments
Vanguard Quantitative Equity Group
October 15, 2020
About Your Fund’s Expenses
4
As a shareholder of the fund, you incur ongoing costs, which include costs for portfolio management, administrative services, and shareholder reports (like this one), among others. Operating expenses, which are deducted from a fund’s gross income, directly reduce the investment return of the fund.
A fund’s expenses are expressed as a percentage of its average net assets. This figure is known as the expense ratio. The following examples are intended to help you understand the ongoing costs (in dollars) of investing in your fund and to compare these costs with those of other mutual funds. The examples are based on an investment of $1,000 made at the beginning of the period shown and held for the entire period.
The accompanying table illustrates your fund’s costs in two ways:
• Based on actual fund return. This section helps you to estimate the actual expenses that you paid over the period. The ”Ending Account Value“ shown is derived from the fund‘s actual return, and the third column shows the dollar amount that would have been paid by an investor who started with $1,000 in the fund. You may use the information here, together with the amount you invested, to estimate the expenses that you paid over the period.
To do so, simply divide your account value by $1,000 (for example, an $8,600 account value divided by $1,000 = 8.6), then multiply the result by the number given for your fund under the heading ”Expenses Paid During Period.“
• Based on hypothetical 5% yearly return. This section is intended to help you compare your fund‘s costs with those of other mutual funds. It assumes that the fund had a yearly return of 5% before expenses, but that the expense ratio is unchanged. In this case—because the return used is not the fund’s actual return—the results do not apply to your investment. The example is useful in making comparisons because the Securities and Exchange Commission requires all mutual funds to calculate expenses based on a 5% return. You can assess your fund’s costs by comparing this hypothetical example with the hypothetical examples that appear in shareholder reports of other funds.
Note that the expenses shown in the table are meant to highlight and help you compare ongoing costs only and do not reflect transaction costs incurred by the fund for buying and sellingsecurities. Further, the expenses do not include any purchase, redemption, or account servicefees described in the fund prospectus. If such fees were applied to your account, your costswould be higher. Your fund does not carry a “sales load.”
The calculations assume no shares were bought or sold during the period. Your actual costs mayhave been higher or lower, depending on the amount of your investment and the timing of anypurchases or redemptions.
You can find more information about the fund’s expenses, including annual expense ratios, in theFinancial Statements section of this report. For additional information on operating expenses andother shareholder costs, please refer to your fund’s current prospectus.
5
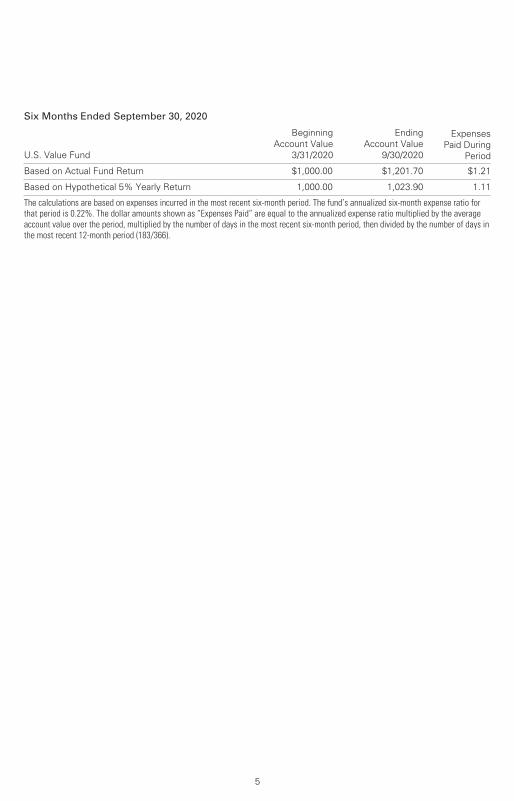
Six Months Ended September 30, 2020
U.S. Value Fund
BeginningAccount Value
3/31/2020
EndingAccount Value
9/30/2020
ExpensesPaid During
Period
Based on Actual Fund Return $1,000.00 $1,201.70 $1.21
Based on Hypothetical 5% Yearly Return 1,000.00 1,023.90 1.11
The calculations are based on expenses incurred in the most recent six-month period. The fund’s annualized six-month expense ratio forthat period is 0.22%. The dollar amounts shown as “Expenses Paid” are equal to the annualized expense ratio multiplied by the averageaccount value over the period, multiplied by the number of days in the most recent six-month period, then divided by the number of days inthe most recent 12-month period (183/366).
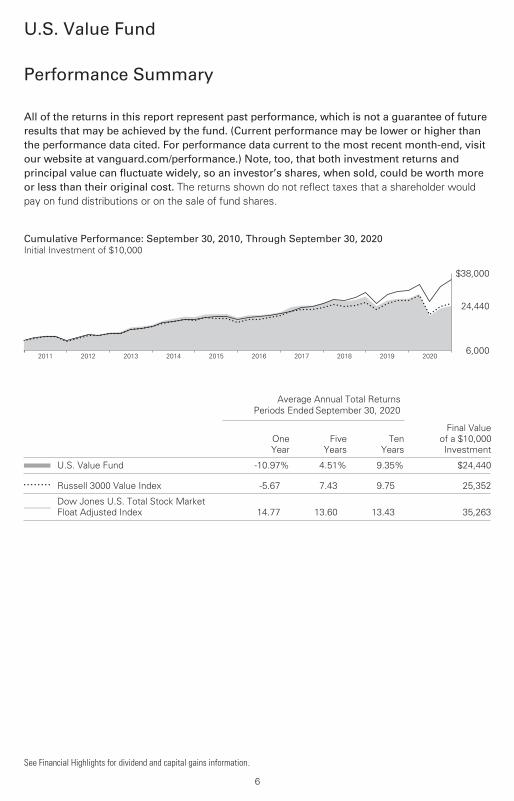
All of the returns in this report represent past performance, which is not a guarantee of future results that may be achieved by the fund. (Current performance may be lower or higher thanthe performance data cited. For performance data current to the most recent month-end, visitour website at vanguard.com/performance.) Note, too, that both investment returns and principal value can fluctuate widely, so an investor’s shares, when sold, could be worth more or less than their original cost. The returns shown do not reflect taxes that a shareholder would pay on fund distributions or on the sale of fund shares.
Performance Summary
See Financial Highlights for dividend and capital gains information.
U.S. Value Fund
6
Cumulative Performance: September 30, 2010, Through September 30, 2020Initial Investment of $10,000
2020201920182017201620152014201320122011
$38,000
6,000
24,440
Average Annual Total ReturnsPeriods Ended September 30, 2020
OneYear
FiveYears
TenYears
Final Valueof a $10,000Investment
U.S. Value Fund -10.97% 4.51% 9.35% $24,440
• • • • • • • • Russell 3000 Value Index -5.67 7.43 9.75 25,352
________ Dow Jones U.S. Total Stock MarketFloat Adjusted Index 14.77 13.60 13.43 35,263
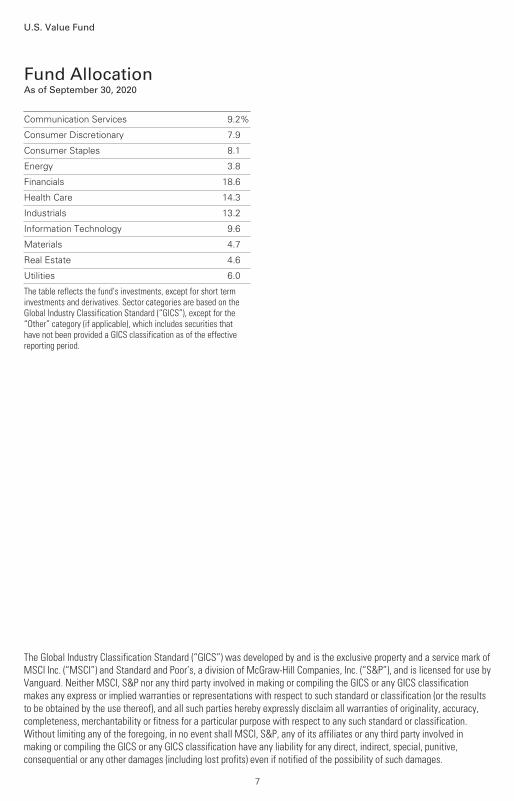
Fund AllocationAs of September 30, 2020
U.S. Value Fund
7
Communication Services 9.2%
Consumer Discretionary 7.9
Consumer Staples 8.1
Energy 3.8
Financials 18.6
Health Care 14.3
Industrials 13.2
Information Technology 9.6
Materials 4.7
Real Estate 4.6
Utilities 6.0
The table reflects the fund's investments, except for short terminvestments and derivatives. Sector categories are based on theGlobal Industry Classification Standard (“GICS”), except for the“Other” category (if applicable), which includes securities thathave not been provided a GICS classification as of the effectivereporting period.
The Global Industry Classification Standard (“GICS”) was developed by and is the exclusive property and a service mark of MSCI Inc. (“MSCI”) and Standard and Poor’s, a division of McGraw-Hill Companies, Inc. (“S&P”), and is licensed for use by Vanguard. Neither MSCI, S&P nor any third party involved in making or compiling the GICS or any GICS classification makes any express or implied warranties or representations with respect to such standard or classification (or the results to be obtained by the use thereof), and all such parties hereby expressly disclaim all warranties of originality, accuracy, completeness, merchantability or fitness for a particular purpose with respect to any such standard or classification. Without limiting any of the foregoing, in no event shall MSCI, S&P, any of its affiliates or any third party involved in making or compiling the GICS or any GICS classification have any liability for any direct, indirect, special, punitive, consequential or any other damages (including lost profits) even if notified of the possibility of such damages.
Market
Value•
Shares ($000)
Market
Value•
Shares ($000)
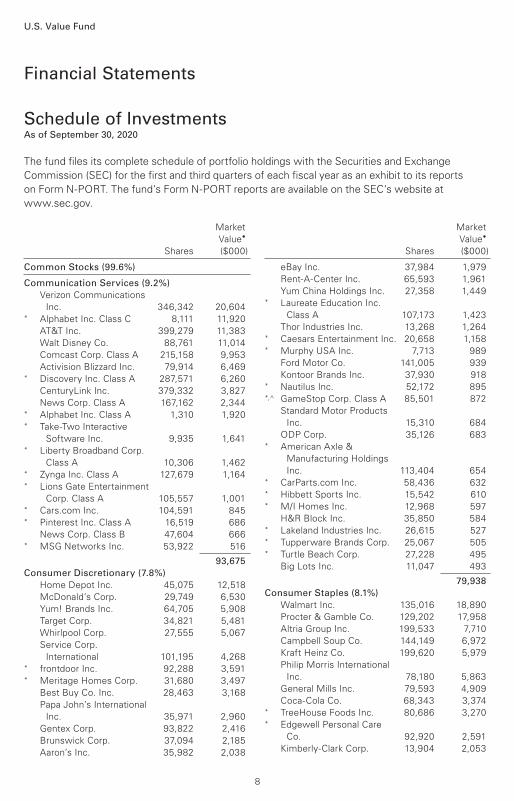
Common Stocks (99.6%)
Communication Services (9.2%)
Verizon Communications
Inc. 346,342 20,604* Alphabet Inc. Class C 8,111 11,920
AT&T Inc. 399,279 11,383
Walt Disney Co. 88,761 11,014
Comcast Corp. Class A 215,158 9,953
Activision Blizzard Inc. 79,914 6,469* Discovery Inc. Class A 287,571 6,260
CenturyLink Inc. 379,332 3,827
News Corp. Class A 167,162 2,344* Alphabet Inc. Class A 1,310 1,920* Take-Two Interactive
Software Inc. 9,935 1,641* Liberty Broadband Corp.
Class A 10,306 1,462* Zynga Inc. Class A 127,679 1,164* Lions Gate Entertainment
Corp. Class A 105,557 1,001* Cars.com Inc. 104,591 845* Pinterest Inc. Class A 16,519 686
News Corp. Class B 47,604 666* MSG Networks Inc. 53,922 516
93,675
Consumer Discretionary (7.8%)
Home Depot Inc. 45,075 12,518
McDonald’s Corp. 29,749 6,530
Yum! Brands Inc. 64,705 5,908
Target Corp. 34,821 5,481
Whirlpool Corp. 27,555 5,067
Service Corp.
International 101,195 4,268* frontdoor Inc. 92,288 3,591* Meritage Homes Corp. 31,680 3,497
Best Buy Co. Inc. 28,463 3,168
Papa John’s International
Inc. 35,971 2,960
Gentex Corp. 93,822 2,416
Brunswick Corp. 37,094 2,185
Aaron’s Inc. 35,982 2,038
eBay Inc. 37,984 1,979
Rent-A-Center Inc. 65,593 1,961
Yum China Holdings Inc. 27,358 1,449* Laureate Education Inc.
Class A 107,173 1,423
Thor Industries Inc. 13,268 1,264* Caesars Entertainment Inc. 20,658 1,158* Murphy USA Inc. 7,713 989
Ford Motor Co. 141,005 939
Kontoor Brands Inc. 37,930 918* Nautilus Inc. 52,172 895*,^ GameStop Corp. Class A 85,501 872
Standard Motor Products
Inc. 15,310 684
ODP Corp. 35,126 683* American Axle &
Manufacturing Holdings
Inc. 113,404 654* CarParts.com Inc. 58,436 632* Hibbett Sports Inc. 15,542 610* M/I Homes Inc. 12,968 597
H&R Block Inc. 35,850 584* Lakeland Industries Inc. 26,615 527* Tupperware Brands Corp. 25,067 505* Turtle Beach Corp. 27,228 495
Big Lots Inc. 11,047 493
79,938
Consumer Staples (8.1%)
Walmart Inc. 135,016 18,890
Procter & Gamble Co. 129,202 17,958
Altria Group Inc. 199,533 7,710
Campbell Soup Co. 144,149 6,972
Kraft Heinz Co. 199,620 5,979
Philip Morris International
Inc. 78,180 5,863
General Mills Inc. 79,593 4,909
Coca-Cola Co. 68,343 3,374* TreeHouse Foods Inc. 80,686 3,270* Edgewell Personal Care
Co. 92,920 2,591
Kimberly-Clark Corp. 13,904 2,053
Financial Statements
Schedule of InvestmentsAs of September 30, 2020
The fund files its complete schedule of portfolio holdings with the Securities and Exchange
Commission (SEC) for the first and third quarters of each fiscal year as an exhibit to its reports
on Form N-PORT. The fund’s Form N-PORT reports are available on the SEC’s website at
www.sec.gov.
U.S. Value Fund
8
U.S. Value Fund
Market
Value•
Shares ($000)
Market
Value•
Shares ($000)
* Hain Celestial Group Inc. 53,842 1,847
Casey’s General Stores Inc. 4,733 841
Conagra Brands Inc. 21,962 784
83,041
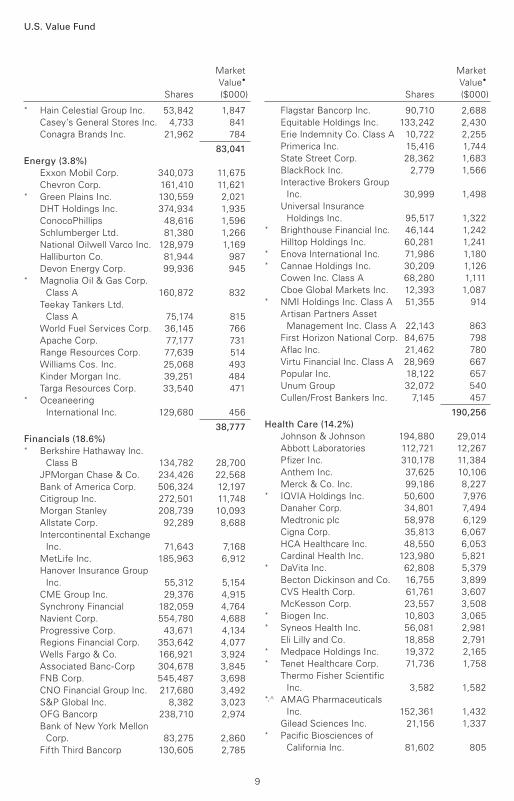
Energy (3.8%)
Exxon Mobil Corp. 340,073 11,675
Chevron Corp. 161,410 11,621* Green Plains Inc. 130,559 2,021
DHT Holdings Inc. 374,934 1,935
ConocoPhillips 48,616 1,596
Schlumberger Ltd. 81,380 1,266
National Oilwell Varco Inc. 128,979 1,169
Halliburton Co. 81,944 987
Devon Energy Corp. 99,936 945* Magnolia Oil & Gas Corp.
Class A 160,872 832
Teekay Tankers Ltd.
Class A 75,174 815
World Fuel Services Corp. 36,145 766
Apache Corp. 77,177 731
Range Resources Corp. 77,639 514
Williams Cos. Inc. 25,068 493
Kinder Morgan Inc. 39,251 484
Targa Resources Corp. 33,540 471* Oceaneering
International Inc. 129,680 456
38,777
Financials (18.6%) * Berkshire Hathaway Inc.
Class B 134,782 28,700
JPMorgan Chase & Co. 234,426 22,568
Bank of America Corp. 506,324 12,197
Citigroup Inc. 272,501 11,748
Morgan Stanley 208,739 10,093
Allstate Corp. 92,289 8,688
Intercontinental Exchange
Inc. 71,643 7,168
MetLife Inc. 185,963 6,912
Hanover Insurance Group
Inc. 55,312 5,154
CME Group Inc. 29,376 4,915
Synchrony Financial 182,059 4,764
Navient Corp. 554,780 4,688
Progressive Corp. 43,671 4,134
Regions Financial Corp. 353,642 4,077
Wells Fargo & Co. 166,921 3,924
Associated Banc-Corp 304,678 3,845
FNB Corp. 545,487 3,698
CNO Financial Group Inc. 217,680 3,492
S&P Global Inc. 8,382 3,023
OFG Bancorp 238,710 2,974
Bank of New York Mellon
Corp. 83,275 2,860
Fifth Third Bancorp 130,605 2,785
Flagstar Bancorp Inc. 90,710 2,688
Equitable Holdings Inc. 133,242 2,430
Erie Indemnity Co. Class A 10,722 2,255
Primerica Inc. 15,416 1,744
State Street Corp. 28,362 1,683
BlackRock Inc. 2,779 1,566
Interactive Brokers Group
Inc. 30,999 1,498
Universal Insurance
Holdings Inc. 95,517 1,322* Brighthouse Financial Inc. 46,144 1,242
Hilltop Holdings Inc. 60,281 1,241* Enova International Inc. 71,986 1,180* Cannae Holdings Inc. 30,209 1,126
Cowen Inc. Class A 68,280 1,111
Cboe Global Markets Inc. 12,393 1,087* NMI Holdings Inc. Class A 51,355 914
Artisan Partners Asset
Management Inc. Class A 22,143 863
First Horizon National Corp. 84,675 798
Aflac Inc. 21,462 780
Virtu Financial Inc. Class A 28,969 667
Popular Inc. 18,122 657
Unum Group 32,072 540
Cullen/Frost Bankers Inc. 7,145 457
190,256
Health Care (14.2%)
Johnson & Johnson 194,880 29,014
Abbott Laboratories 112,721 12,267
Pfizer Inc. 310,178 11,384
Anthem Inc. 37,625 10,106
Merck & Co. Inc. 99,186 8,227* IQVIA Holdings Inc. 50,600 7,976
Danaher Corp. 34,801 7,494
Medtronic plc 58,978 6,129
Cigna Corp. 35,813 6,067
HCA Healthcare Inc. 48,550 6,053
Cardinal Health Inc. 123,980 5,821* DaVita Inc. 62,808 5,379
Becton Dickinson and Co. 16,755 3,899
CVS Health Corp. 61,761 3,607
McKesson Corp. 23,557 3,508* Biogen Inc. 10,803 3,065* Syneos Health Inc. 56,081 2,981
Eli Lilly and Co. 18,858 2,791* Medpace Holdings Inc. 19,372 2,165* Tenet Healthcare Corp. 71,736 1,758
Thermo Fisher Scientific
Inc. 3,582 1,582*,^ AMAG Pharmaceuticals
Inc. 152,361 1,432
Gilead Sciences Inc. 21,156 1,337* Pacific Biosciences of
California Inc. 81,602 805
9
U.S. Value Fund
Market
Value•
Shares ($000)
Market
Value•
Shares ($000)
*,^ Precigen Inc. 97,922 343*,^ Mallinckrodt plc 264,465 257
145,447
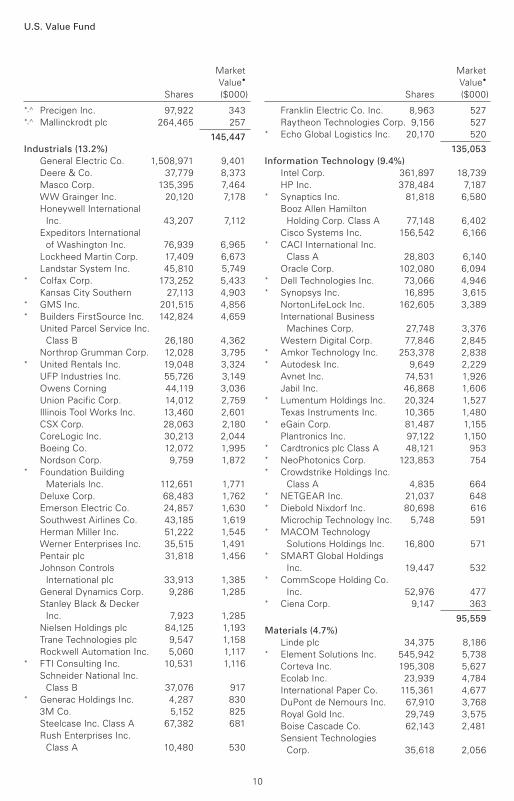
Industrials (13.2%)
General Electric Co. 1,508,971 9,401
Deere & Co. 37,779 8,373
Masco Corp. 135,395 7,464
WW Grainger Inc. 20,120 7,178
Honeywell International
Inc. 43,207 7,112
Expeditors International
of Washington Inc. 76,939 6,965
Lockheed Martin Corp. 17,409 6,673
Landstar System Inc. 45,810 5,749* Colfax Corp. 173,252 5,433
Kansas City Southern 27,113 4,903* GMS Inc. 201,515 4,856* Builders FirstSource Inc. 142,824 4,659
United Parcel Service Inc.
Class B 26,180 4,362
Northrop Grumman Corp. 12,028 3,795* United Rentals Inc. 19,048 3,324
UFP Industries Inc. 55,726 3,149
Owens Corning 44,119 3,036
Union Pacific Corp. 14,012 2,759
Illinois Tool Works Inc. 13,460 2,601
CSX Corp. 28,063 2,180
CoreLogic Inc. 30,213 2,044
Boeing Co. 12,072 1,995
Nordson Corp. 9,759 1,872* Foundation Building
Materials Inc. 112,651 1,771
Deluxe Corp. 68,483 1,762
Emerson Electric Co. 24,857 1,630
Southwest Airlines Co. 43,185 1,619
Herman Miller Inc. 51,222 1,545
Werner Enterprises Inc. 35,515 1,491
Pentair plc 31,818 1,456
Johnson Controls
International plc 33,913 1,385
General Dynamics Corp. 9,286 1,285
Stanley Black & Decker
Inc. 7,923 1,285
Nielsen Holdings plc 84,125 1,193
Trane Technologies plc 9,547 1,158
Rockwell Automation Inc. 5,060 1,117* FTI Consulting Inc. 10,531 1,116
Schneider National Inc.
Class B 37,076 917* Generac Holdings Inc. 4,287 830
3M Co. 5,152 825
Steelcase Inc. Class A 67,382 681
Rush Enterprises Inc.
Class A 10,480 530
Franklin Electric Co. Inc. 8,963 527
Raytheon Technologies Corp. 9,156 527* Echo Global Logistics Inc. 20,170 520
135,053
Information Technology (9.4%)
Intel Corp. 361,897 18,739
HP Inc. 378,484 7,187* Synaptics Inc. 81,818 6,580
Booz Allen Hamilton
Holding Corp. Class A 77,148 6,402
Cisco Systems Inc. 156,542 6,166* CACI International Inc.
Class A 28,803 6,140
Oracle Corp. 102,080 6,094* Dell Technologies Inc. 73,066 4,946* Synopsys Inc. 16,895 3,615
NortonLifeLock Inc. 162,605 3,389
International Business
Machines Corp. 27,748 3,376
Western Digital Corp. 77,846 2,845* Amkor Technology Inc. 253,378 2,838* Autodesk Inc. 9,649 2,229
Avnet Inc. 74,531 1,926
Jabil Inc. 46,868 1,606* Lumentum Holdings Inc. 20,324 1,527
Texas Instruments Inc. 10,365 1,480* eGain Corp. 81,487 1,155
Plantronics Inc. 97,122 1,150* Cardtronics plc Class A 48,121 953* NeoPhotonics Corp. 123,853 754* Crowdstrike Holdings Inc.
Class A 4,835 664* NETGEAR Inc. 21,037 648* Diebold Nixdorf Inc. 80,698 616
Microchip Technology Inc. 5,748 591* MACOM Technology
Solutions Holdings Inc. 16,800 571* SMART Global Holdings
Inc. 19,447 532* CommScope Holding Co.
Inc. 52,976 477* Ciena Corp. 9,147 363
95,559
Materials (4.7%)
Linde plc 34,375 8,186* Element Solutions Inc. 545,942 5,738
Corteva Inc. 195,308 5,627
Ecolab Inc. 23,939 4,784
International Paper Co. 115,361 4,677
DuPont de Nemours Inc. 67,910 3,768
Royal Gold Inc. 29,749 3,575
Boise Cascade Co. 62,143 2,481
Sensient Technologies
Corp. 35,618 2,056
10
U.S. Value Fund
Market
Value•
Shares ($000)
Market
Value•
Shares ($000)
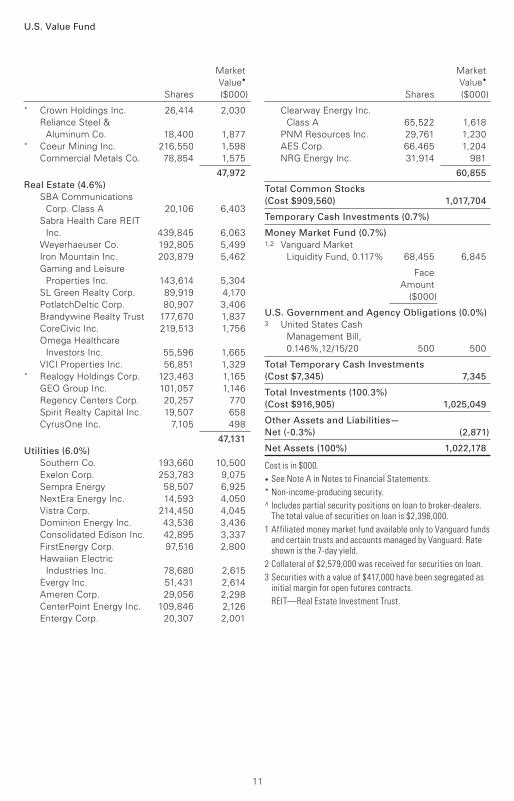
* Crown Holdings Inc. 26,414 2,030
Reliance Steel &
Aluminum Co. 18,400 1,877* Coeur Mining Inc. 216,550 1,598
Commercial Metals Co. 78,854 1,575
47,972
Real Estate (4.6%)
SBA Communications
Corp. Class A 20,106 6,403
Sabra Health Care REIT
Inc. 439,845 6,063
Weyerhaeuser Co. 192,805 5,499
Iron Mountain Inc. 203,879 5,462
Gaming and Leisure
Properties Inc. 143,614 5,304
SL Green Realty Corp. 89,919 4,170
PotlatchDeltic Corp. 80,907 3,406
Brandywine Realty Trust 177,670 1,837
CoreCivic Inc. 219,513 1,756
Omega Healthcare
Investors Inc. 55,596 1,665
VICI Properties Inc. 56,851 1,329* Realogy Holdings Corp. 123,463 1,165
GEO Group Inc. 101,057 1,146
Regency Centers Corp. 20,257 770
Spirit Realty Capital Inc. 19,507 658
CyrusOne Inc. 7,105 498
47,131
Utilities (6.0%)
Southern Co. 193,660 10,500
Exelon Corp. 253,783 9,075
Sempra Energy 58,507 6,925
NextEra Energy Inc. 14,593 4,050
Vistra Corp. 214,450 4,045
Dominion Energy Inc. 43,536 3,436
Consolidated Edison Inc. 42,895 3,337
FirstEnergy Corp. 97,516 2,800
Hawaiian Electric
Industries Inc. 78,680 2,615
Evergy Inc. 51,431 2,614
Ameren Corp. 29,056 2,298
CenterPoint Energy Inc. 109,846 2,126
Entergy Corp. 20,307 2,001
Clearway Energy Inc.
Class A 65,522 1,618
PNM Resources Inc. 29,761 1,230
AES Corp. 66,465 1,204
NRG Energy Inc. 31,914 981
60,855
Total Common Stocks
(Cost $909,560) 1,017,704
Temporary Cash Investments (0.7%)
Money Market Fund (0.7%)1,2 Vanguard Market
Liquidity Fund, 0.117% 68,455 6,845
Face
Amount
($000)
U.S. Government and Agency Obligations (0.0%) 3 United States Cash
Management Bill,
0.146%,12/15/20 500 500
Total Temporary Cash Investments
(Cost $7,345) 7,345
Total Investments (100.3%)
(Cost $916,905) 1,025,049
Other Assets and Liabilities—
Net (-0.3%) (2,871)
Net Assets (100%) 1,022,178
Cost is in $000.
• See Note A in Notes to Financial Statements.
* Non-income-producing security.
^ Includes partial security positions on loan to broker-dealers. The total value of securities on loan is $2,396,000.
1 Affiliated money market fund available only to Vanguard funds and certain trusts and accounts managed by Vanguard. Rate shown is the 7-day yield.
2 Collateral of $2,579,000 was received for securities on loan.
3 Securities with a value of $417,000 have been segregated as initial margin for open futures contracts.
REIT—Real Estate Investment Trust.
11
U.S. Value Fund
See accompanying Notes, which are an integral part of the Financial Statements.
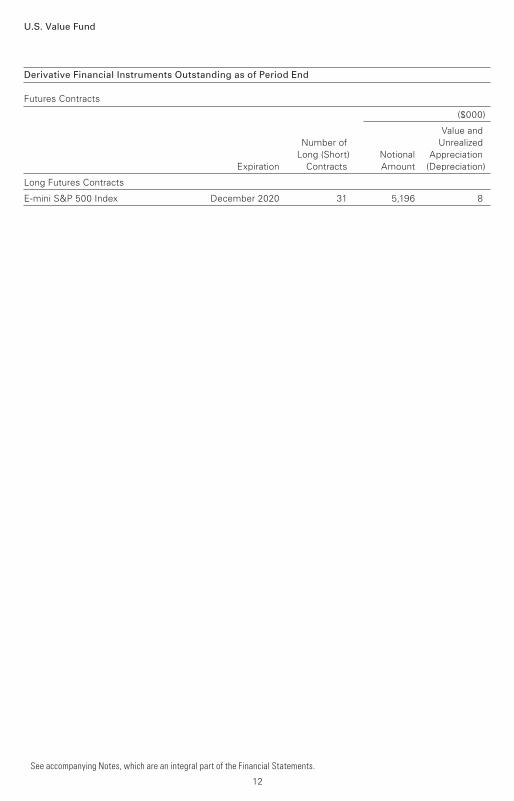
Derivative Financial Instruments Outstanding as of Period End
Futures Contracts
($000)
Value and Number of Unrealized Long (Short) Notional Appreciation Expiration Contracts Amount (Depreciation)
Long Futures Contracts
E-mini S&P 500 Index December 2020 31 5,196 8
12
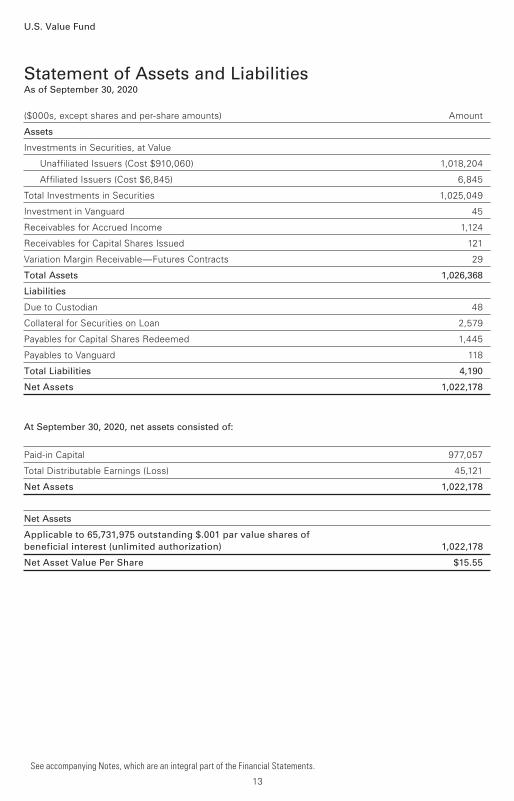
($000s, except shares and per-share amounts) Amount
Assets
Investments in Securities, at Value
Unaffiliated Issuers (Cost $910,060) 1,018,204
Affiliated Issuers (Cost $6,845) 6,845
Total Investments in Securities 1,025,049
Investment in Vanguard 45
Receivables for Accrued Income 1,124
Receivables for Capital Shares Issued 121
Variation Margin Receivable—Futures Contracts 29
Total Assets 1,026,368
Liabilities
Due to Custodian 48
Collateral for Securities on Loan 2,579
Payables for Capital Shares Redeemed 1,445
Payables to Vanguard 118
Total Liabilities 4,190
Net Assets 1,022,178
At September 30, 2020, net assets consisted of:
Paid-in Capital 977,057
Total Distributable Earnings (Loss) 45,121
Net Assets 1,022,178
Net Assets
Applicable to 65,731,975 outstanding $.001 par value shares of
beneficial interest (unlimited authorization) 1,022,178
Net Asset Value Per Share $15.55
Statement of Assets and LiabilitiesAs of September 30, 2020
U.S. Value Fund
See accompanying Notes, which are an integral part of the Financial Statements.
13
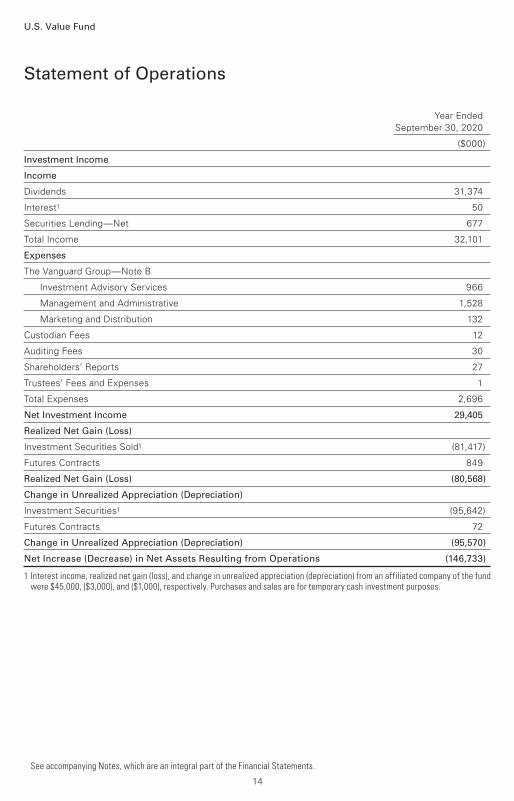
Year Ended
September 30, 2020
($000)
Investment Income
Income
Dividends 31,374
Interest1 50
Securities Lending—Net 677
Total Income 32,101
Expenses
The Vanguard Group—Note B
Investment Advisory Services 966
Management and Administrative 1,528
Marketing and Distribution 132
Custodian Fees 12
Auditing Fees 30
Shareholders’ Reports 27
Trustees’ Fees and Expenses 1
Total Expenses 2,696
Net Investment Income 29,405
Realized Net Gain (Loss)
Investment Securities Sold1 (81,417)
Futures Contracts 849
Realized Net Gain (Loss) (80,568)
Change in Unrealized Appreciation (Depreciation)
Investment Securities1 (95,642)
Futures Contracts 72
Change in Unrealized Appreciation (Depreciation) (95,570)
Net Increase (Decrease) in Net Assets Resulting from Operations (146,733)
1 Interest income, realized net gain (loss), and change in unrealized appreciation (depreciation) from an affiliated company of the fund were $45,000, ($3,000), and ($1,000), respectively. Purchases and sales are for temporary cash investment purposes.
Statement of Operations
U.S. Value Fund
See accompanying Notes, which are an integral part of the Financial Statements.
14
15
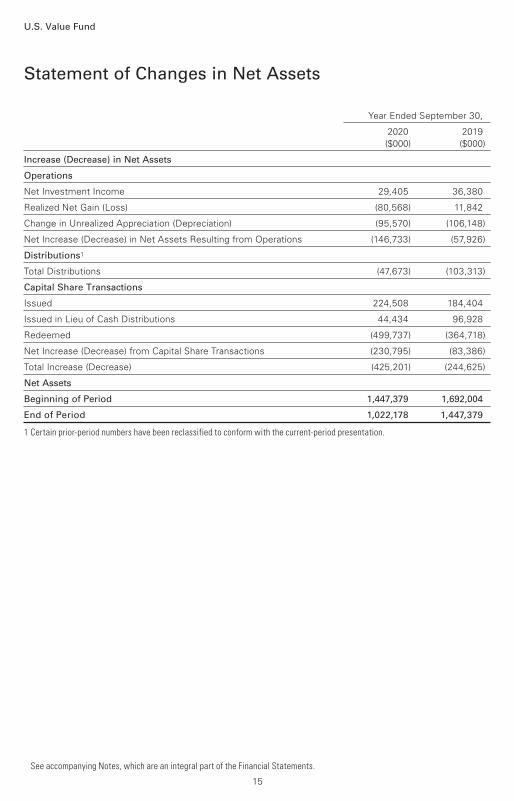
Statement of Changes in Net Assets
U.S. Value Fund
See accompanying Notes, which are an integral part of the Financial Statements.
Year Ended September 30,
2020 2019 ($000) ($000)
Increase (Decrease) in Net Assets
Operations
Net Investment Income 29,405 36,380
Realized Net Gain (Loss) (80,568) 11,842
Change in Unrealized Appreciation (Depreciation) (95,570) (106,148)
Net Increase (Decrease) in Net Assets Resulting from Operations (146,733) (57,926)
Distributions1
Total Distributions (47,673) (103,313)
Capital Share Transactions
Issued 224,508 184,404
Issued in Lieu of Cash Distributions 44,434 96,928
Redeemed (499,737) (364,718)
Net Increase (Decrease) from Capital Share Transactions (230,795) (83,386)
Total Increase (Decrease) (425,201) (244,625)
Net Assets
Beginning of Period 1,447,379 1,692,004
End of Period 1,022,178 1,447,379
1 Certain prior-period numbers have been reclassified to conform with the current-period presentation.
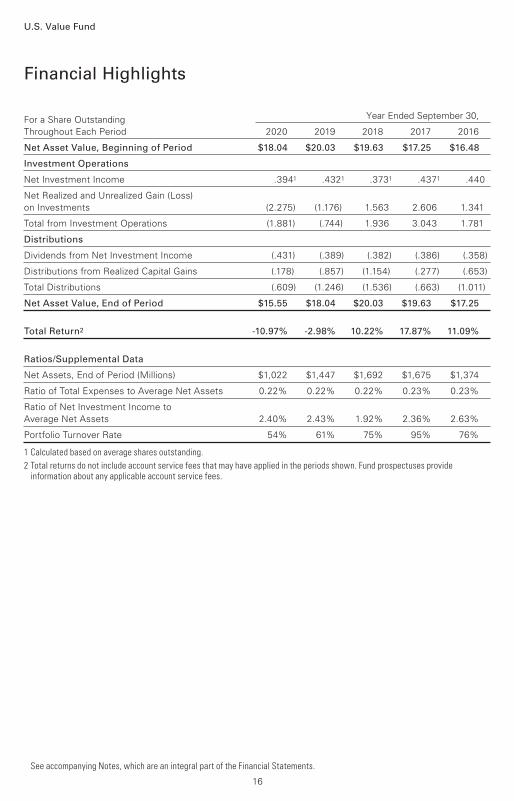
For a Share Outstanding Year Ended September 30,
Throughout Each Period 2020 2019 2018 2017 2016
Net Asset Value, Beginning of Period $18.04 $20.03 $19.63 $17.25 $16.48
Investment Operations
Net Investment Income .3941 .4321 .3731 .4371 .440
Net Realized and Unrealized Gain (Loss) on Investments (2.275) (1.176) 1.563 2.606 1.341
Total from Investment Operations (1.881) (.744) 1.936 3.043 1.781
Distributions
Dividends from Net Investment Income (.431) (.389) (.382) (.386) (.358)
Distributions from Realized Capital Gains (.178) (.857) (1.154) (.277) (.653)
Total Distributions (.609) (1.246) (1.536) (.663) (1.011)
Net Asset Value, End of Period $15.55 $18.04 $20.03 $19.63 $17.25
Total Return2 -10.97% -2.98% 10.22% 17.87% 11.09%
Ratios/Supplemental Data
Net Assets, End of Period (Millions) $1,022 $1,447 $1,692 $1,675 $1,374
Ratio of Total Expenses to Average Net Assets 0.22% 0.22% 0.22% 0.23% 0.23%
Ratio of Net Investment Income to Average Net Assets 2.40% 2.43% 1.92% 2.36% 2.63%
Portfolio Turnover Rate 54% 61% 75% 95% 76%
1 Calculated based on average shares outstanding.
2 Total returns do not include account service fees that may have applied in the periods shown. Fund prospectuses provide information about any applicable account service fees.
Financial Highlights
See accompanying Notes, which are an integral part of the Financial Statements.
U.S. Value Fund
16
Notes to Financial Statements
U.S. Value Fund
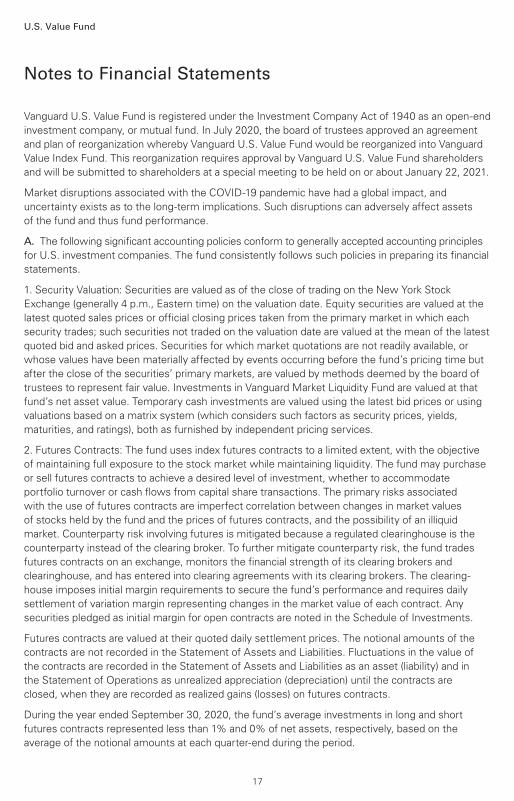
Vanguard U.S. Value Fund is registered under the Investment Company Act of 1940 as an open-end
investment company, or mutual fund. In July 2020, the board of trustees approved an agreement
and plan of reorganization whereby Vanguard U.S. Value Fund would be reorganized into Vanguard
Value Index Fund. This reorganization requires approval by Vanguard U.S. Value Fund shareholders
and will be submitted to shareholders at a special meeting to be held on or about January 22, 2021.
Market disruptions associated with the COVID-19 pandemic have had a global impact, and
uncertainty exists as to the long-term implications. Such disruptions can adversely affect assets
of the fund and thus fund performance.
A. The following significant accounting policies conform to generally accepted accounting principles
for U.S. investment companies. The fund consistently follows such policies in preparing its financial
statements.
1. Security Valuation: Securities are valued as of the close of trading on the New York Stock
Exchange (generally 4 p.m., Eastern time) on the valuation date. Equity securities are valued at the
latest quoted sales prices or official closing prices taken from the primary market in which each
security trades; such securities not traded on the valuation date are valued at the mean of the latest
quoted bid and asked prices. Securities for which market quotations are not readily available, or
whose values have been materially affected by events occurring before the fund’s pricing time but
after the close of the securities’ primary markets, are valued by methods deemed by the board of
trustees to represent fair value. Investments in Vanguard Market Liquidity Fund are valued at that
fund’s net asset value. Temporary cash investments are valued using the latest bid prices or using
valuations based on a matrix system (which considers such factors as security prices, yields,
maturities, and ratings), both as furnished by independent pricing services.
2. Futures Contracts: The fund uses index futures contracts to a limited extent, with the objective
of maintaining full exposure to the stock market while maintaining liquidity. The fund may purchase
or sell futures contracts to achieve a desired level of investment, whether to accommodate
portfolio turnover or cash flows from capital share transactions. The primary risks associated
with the use of futures contracts are imperfect correlation between changes in market values
of stocks held by the fund and the prices of futures contracts, and the possibility of an illiquid
market. Counterparty risk involving futures is mitigated because a regulated clearinghouse is the
counterparty instead of the clearing broker. To further mitigate counterparty risk, the fund trades
futures contracts on an exchange, monitors the financial strength of its clearing brokers and
clearinghouse, and has entered into clearing agreements with its clearing brokers. The clearing-
house imposes initial margin requirements to secure the fund’s performance and requires daily
settlement of variation margin representing changes in the market value of each contract. Any
securities pledged as initial margin for open contracts are noted in the Schedule of Investments.
Futures contracts are valued at their quoted daily settlement prices. The notional amounts of the
contracts are not recorded in the Statement of Assets and Liabilities. Fluctuations in the value of
the contracts are recorded in the Statement of Assets and Liabilities as an asset (liability) and in
the Statement of Operations as unrealized appreciation (depreciation) until the contracts are
closed, when they are recorded as realized gains (losses) on futures contracts.
During the year ended September 30, 2020, the fund’s average investments in long and short
futures contracts represented less than 1% and 0% of net assets, respectively, based on the
average of the notional amounts at each quarter-end during the period.
17
U.S. Value Fund
3. Federal Income Taxes: The fund intends to continue to qualify as a regulated investment
company and distribute all of its taxable income. The fund’s tax returns are open to examination
by the relevant tax authorities until expiration of the applicable statute of limitations, which is
generally three years after the filing of the tax return. Management has analyzed the fund’s tax
positions taken for all open federal and state income tax years, and has concluded that no provision
for income tax is required in the fund’s financial statements.
4. Distributions: Distributions to shareholders are recorded on the ex-dividend date. Distributions
are determined on a tax basis at the fiscal year-end and may differ from net investment income
and realized capital gains for financial reporting purposes.
5. Securities Lending: To earn additional income, the fund lends its securities to qualified
institutional borrowers. Security loans are subject to termination by the fund at any time, and are
required to be secured at all times by collateral in an amount at least equal to the market value of
securities loaned. Daily market fluctuations could cause the value of loaned securities to be more
or less than the value of the collateral received. When this occurs, the collateral is adjusted and
settled before the opening of the market on the next business day. The fund further mitigates its
counterparty risk by entering into securities lending transactions only with a diverse group of
prequalified counterparties, monitoring their financial strength, and entering into master securities
lending agreements with its counterparties. The master securities lending agreements provide that,
in the event of a counterparty’s default (including bankruptcy), the fund may terminate any loans
with that borrower, determine the net amount owed, and sell or retain the collateral up to the net
amount owed to the fund; however, such actions may be subject to legal proceedings. While
collateral mitigates counterparty risk, in the event of a default, the fund may experience delays and
costs in recovering the securities loaned. The fund invests cash collateral received in Vanguard
Market Liquidity Fund, and records a liability in the Statement of Assets and Liabilities for the return
of the collateral, during the period the securities are on loan. Collateral investments in Vanguard
Market Liquidity Fund are subject to market appreciation or depreciation. Securities lending income
represents fees charged to borrowers plus income earned on invested cash collateral, less
expenses associated with the loan. During the term of the loan, the fund is entitled to all
distributions made on or in respect of the loaned securities.
6. Credit Facilities and Interfund Lending Program: The fund and certain other funds managed
by The Vanguard Group (“Vanguard”) participate in a $4.3 billion committed credit facility provided
by a syndicate of lenders pursuant to a credit agreement and an uncommitted credit facility
provided by Vanguard. Both facilities may be renewed annually. Each fund is individually liable
for its borrowings, if any, under the credit facilities. Borrowings may be utilized for temporary or
emergency purposes, subject to the fund’s regulatory and contractual borrowing restrictions.
With respect to the committed credit facility, the participating funds are charged administrative
fees and an annual commitment fee of 0.10% of the undrawn committed amount of the facility;
these fees are allocated to the funds based on a method approved by the fund’s board of trustees
and included in Management and Administrative expenses on the fund’s Statement of Operations.
Any borrowings under either facility bear interest at a rate based upon the higher of the one-month
London Interbank Offered Rate (or an acceptable alternate rate, if necessary), federal funds
effective rate, or overnight bank funding rate plus an agreed-upon spread, except that borrowings
under the uncommitted credit facility may bear interest based upon an alternative rate agreed to by
the fund and Vanguard.
18
U.S. Value Fund
In accordance with an exemptive order (the “Order”) from the SEC, the fund may participate in a
joint lending and borrowing program that allows registered open-end Vanguard funds to borrow
money from and lend money to each other for temporary or emergency purposes (the “Interfund
Lending Program”), subject to compliance with the terms and conditions of the Order, and to the
extent permitted by the fund’s investment objective and investment policies. Interfund loans and
borrowings normally extend overnight, but can have a maximum duration of seven days. Loans
may be called on one business day’s notice. The interest rate to be charged is governed by the
conditions of the Order and internal procedures adopted by the board of trustees. The board of
trustees is responsible for overseeing the Interfund Lending Program.
For the year ended September 30, 2020, the fund did not utilize the credit facilities or the Interfund
Lending Program.
7. Other: Dividend income is recorded on the ex-dividend date. Interest income includes income
distributions received from Vanguard Market Liquidity Fund and is accrued daily. Premiums and
discounts on debt securities are amortized and accreted, respectively, to interest income over the
lives of the respective securities, except for premiums on certain callable debt securities that are
amortized to the earliest call date. Security transactions are accounted for on the date securities
are bought or sold. Costs used to determine realized gains (losses) on the sale of investment
securities are those of the specific securities sold.
B. In accordance with the terms of a Funds’ Service Agreement (the “FSA”) between Vanguard
and the fund, Vanguard furnishes to the fund investment advisory, corporate management,
administrative, marketing, and distribution services at Vanguard’s cost of operations (as defined
by the FSA). These costs of operations are allocated to the fund based on methods and guidelines
approved by the board of trustees and are generally settled twice a month.
Upon the request of Vanguard, the fund may invest up to 0.40% of its net assets as capital in
Vanguard. At September 30, 2020, the fund had contributed to Vanguard capital in the amount of
$45,000, representing less than 0.01% of the fund’s net assets and 0.02% of Vanguard’s capital
received pursuant to the FSA. The fund’s trustees and officers are also directors and employees,
respectively, of Vanguard.
C. Various inputs may be used to determine the value of the fund’s investments and derivatives.
These inputs are summarized in three broad levels for financial statement purposes. The inputs or
methodologies used to value securities are not necessarily an indication of the risk associated with
investing in those securities.
Level 1—Quoted prices in active markets for identical securities.
Level 2—Other significant observable inputs (including quoted prices for similar securities, interest
rates, prepayment speeds, credit risk, etc.).
Level 3—Significant unobservable inputs (including the fund’s own assumptions used to determine
the fair value of investments). Any investments and derivatives valued with significant unobservable
inputs are noted on the Schedule of Investments.
19
U.S. Value Fund
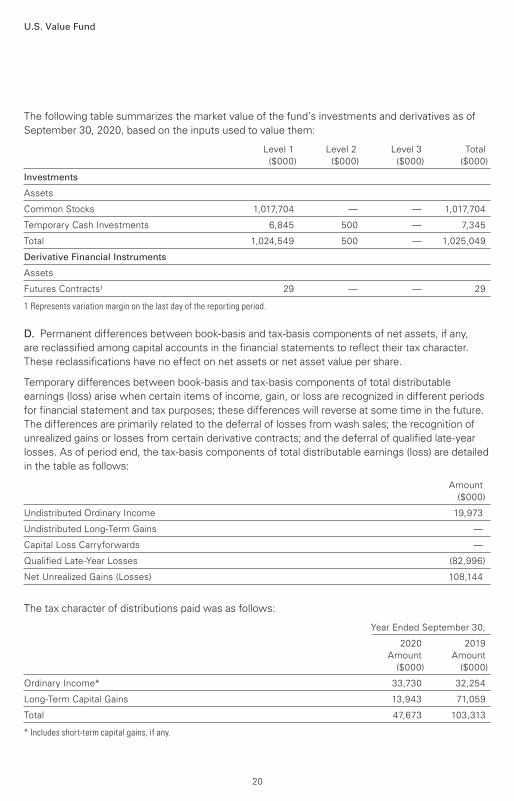
The following table summarizes the market value of the fund’s investments and derivatives as of
September 30, 2020, based on the inputs used to value them:
Level 1 Level 2 Level 3 Total
($000) ($000) ($000) ($000)
Investments
Assets
Common Stocks 1,017,704 — — 1,017,704
Temporary Cash Investments 6,845 500 — 7,345
Total 1,024,549 500 — 1,025,049
Derivative Financial Instruments
Assets
Futures Contracts1 29 — — 29
1 Represents variation margin on the last day of the reporting period.
D. Permanent differences between book-basis and tax-basis components of net assets, if any,
are reclassified among capital accounts in the financial statements to reflect their tax character.
These reclassifications have no effect on net assets or net asset value per share.
Temporary differences between book-basis and tax-basis components of total distributable
earnings (loss) arise when certain items of income, gain, or loss are recognized in different periods
for financial statement and tax purposes; these differences will reverse at some time in the future.
The differences are primarily related to the deferral of losses from wash sales; the recognition of
unrealized gains or losses from certain derivative contracts; and the deferral of qualified late-year
losses. As of period end, the tax-basis components of total distributable earnings (loss) are detailed
in the table as follows:
Amount
($000)
Undistributed Ordinary Income 19,973
Undistributed Long-Term Gains —
Capital Loss Carryforwards —
Qualified Late-Year Losses (82,996)
Net Unrealized Gains (Losses) 108,144
The tax character of distributions paid was as follows:
Year Ended September 30,
2020 2019
Amount Amount
($000) ($000)
Ordinary Income* 33,730 32,254
Long-Term Capital Gains 13,943 71,059
Total 47,673 103,313
* Includes short-term capital gains, if any.
20
U.S. Value Fund
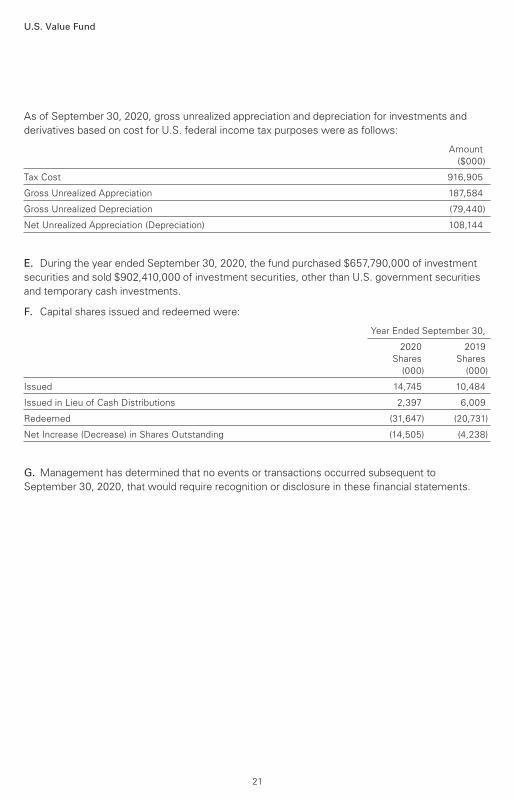
As of September 30, 2020, gross unrealized appreciation and depreciation for investments and
derivatives based on cost for U.S. federal income tax purposes were as follows:
Amount
($000)
Tax Cost 916,905
Gross Unrealized Appreciation 187,584
Gross Unrealized Depreciation (79,440)
Net Unrealized Appreciation (Depreciation) 108,144
E. During the year ended September 30, 2020, the fund purchased $657,790,000 of investment
securities and sold $902,410,000 of investment securities, other than U.S. government securities
and temporary cash investments.
F. Capital shares issued and redeemed were:
Year Ended September 30,
2020 2019
Shares Shares
(000) (000)
Issued 14,745 10,484
Issued in Lieu of Cash Distributions 2,397 6,009
Redeemed (31,647) (20,731)
Net Increase (Decrease) in Shares Outstanding (14,505) (4,238)
G. Management has determined that no events or transactions occurred subsequent to
September 30, 2020, that would require recognition or disclosure in these financial statements.
21
To the Board of Trustees of Vanguard Malvern Funds and Shareholders of Vanguard U.S. Value Fund
Opinion on the Financial Statements
We have audited the accompanying statement of assets and liabilities, including the schedule of
investments, of Vanguard U.S. Value Fund (one of the funds constituting Vanguard Malvern Funds,
referred to hereafter as the “Fund”) as of September 30, 2020, the related statement of operations
for the year ended September 30, 2020, the statement of changes in net assets for each of the
two years in the period ended September 30, 2020, including the related notes, and the financial
highlights for each of the five years in the period ended September 30, 2020 (collectively referred
to as the “financial statements”). In our opinion, the financial statements present fairly, in all
material respects, the financial position of the Fund as of September 30, 2020, the results of its
operations for the year then ended, the changes in its net assets for each of the two years in the
period ended September 30, 2020 and the financial highlights for each of the five years in the
period ended September 30, 2020 in conformity with accounting principles generally accepted in
the United States of America.
Basis for Opinion
These financial statements are the responsibility of the Fund’s management. Our responsibility is
to express an opinion on the Fund’s financial statements based on our audits. We are a public
accounting firm registered with the Public Company Accounting Oversight Board (United States)
(“PCAOB”) and are required to be independent with respect to the Fund in accordance with the
U.S. federal securities laws and the applicable rules and regulations of the Securities and Exchange
Commission and the PCAOB.
We conducted our audits of these financial statements in accordance with the standards of the
PCAOB. Those standards require that we plan and perform the audit to obtain reasonable assurance
about whether the financial statements are free of material misstatement, whether due to error
or fraud.
Our audits included performing procedures to assess the risks of material misstatement of the
financial statements, whether due to error or fraud, and performing procedures that respond to
those risks. Such procedures included examining, on a test basis, evidence regarding the amounts
and disclosures in the financial statements. Our audits also included evaluating the accounting
principles used and significant estimates made by management, as well as evaluating the overall
presentation of the financial statements. Our procedures included confirmation of securities owned
as of September 30, 2020 by correspondence with the custodian and brokers and by agreement
to the underlying ownership records of the transfer agent; when replies were not received from
brokers, we performed other auditing procedures. We believe that our audits provide a reasonable
basis for our opinion.
/s/PricewaterhouseCoopers LLP
Philadelphia, Pennsylvania
November 12, 2020
We have served as the auditor of one or more investment companies in The Vanguard Group of
Funds since 1975.
Report of Independent Registered Public Accounting Firm
22
23
Special 2020 tax information (unaudited) for Vanguard U.S. Value Fund
This information for the fiscal year ended September 30, 2020, is included pursuant to provisions of the Internal Revenue Code.
The fund distributed $13,943,000 as capital gain dividends (20% rate gain distributions) to shareholders during the fiscal year.
The fund distributed $32,897,000 of qualified dividend income to shareholders during the fiscal year.
The fund distributed $833,000 of qualified business income to shareholders during the fiscal year.
For corporate shareholders, 96.5% of investment income (dividend income plus short-term gains, if any) qualifies for the dividends-received deduction.

This page intentionally left blank.

This page intentionally left blank.

This page intentionally left blank.
The People Who Govern Your Fund
The trustees of your mutual fund are there to see that the fund is operated and managed in your best interests since, as a shareholder, you are a part owner of the fund. Your fund’s trustees also serve on the board of directors of The Vanguard Group, Inc., which is owned by the Vanguard funds and provides services to them.
A majority of Vanguard’s board members are independent, meaning that they have no affiliation with Vanguard or the funds they oversee, apart from the sizable personal investments they have made as private individuals. The independent board members have distinguished backgrounds in business, academia, and public service. Each of the trustees and executive officers oversees 213 Vanguard funds.
Information for each trustee and executive officer of the fund appears below. That information, as well as the Vanguard fund count, is as of the date on the cover of this fund report. The mailing address of the trustees and officers is P.O. Box 876, Valley Forge, PA 19482. More information about the trustees is in the Statement of Additional Information, which can be obtained, without charge, by contacting Vanguard at 800-662-7447, or online at vanguard.com.
Interested Trustee1
Mortimer J. Buckley
Born in 1969. Trustee since January 2018. Principal occupation(s) during the past five years and other experience: chairman of the board (2019–present) of Vanguard and of each of the investment companies served by Vanguard; chief executive officer (2018–present) of Vanguard; chief executive officer, president, and trustee (2018–present) of each of the investment companies served by Vanguard; president and director (2017–present) of Vanguard; and president (2018–present) of Vanguard Marketing Corporation. Chief investment officer (2013–2017), managing director (2002–2017), head of the Retail Investor Group (2006–2012), and chief information officer (2001–2006) of Vanguard. Chairman of the board (2011–2017) and trustee (2009–2017) of the Children’s Hospital of Philadelphia; and trustee (2018–present) and vice chair (2019–present) of The Shipley School.
Independent Trustees
Emerson U. Fullwood
Born in 1948. Trustee since January 2008. Principal occupation(s) during the past five years and other experience: executive chief staff and marketing officer for North America and corporate vice president (retired 2008) of Xerox Corporation (document management products and services). Former president of the Worldwide Channels Group, Latin America, and
Worldwide Customer Service and executive chief staff officer of Developing Markets of Xerox. Executive in residence and 2009–2010 Distinguished Minett Professor at the Rochester Institute of Technology. Director of SPX FLOW, Inc. (multi-industry manufac-turing). Director of the University of Rochester Medical Center, the Monroe Community College Foundation, the United Way of Rochester, North Carolina A&T University, and Roberts Wesleyan College. Trustee of the University of Rochester.
Amy Gutmann
Born in 1949. Trustee since June 2006. Principal occupation(s) during the past five years and other experience: president (2004–present) of the University of Pennsylvania. Christopher H. Browne Distinguished Professor of Political Science, School of Arts and Sciences, and professor of communication, Annenberg School for Communication, with secondary faculty appointments in the Department of Philosophy, School of Arts and Sciences, and at the Graduate School of Education, University of Pennsylvania.
F. Joseph Loughrey
Born in 1949. Trustee since October 2009. Principal occupation(s) during the past five years and other experience: president and chief operating officer (retired 2009) and vice chairman of the board (2008–2009) of Cummins Inc. (industrial machinery). Chairman of the board of Hillenbrand, Inc. (specialized consumer services) and the Lumina Foundation. Director of the V Foundation. Member of the advisory
1 Mr. Buckley is considered an “interested person,” as defined in the Investment Company Act of 1940, because he is an officer of the Vanguard funds.
council for the College of Arts and Letters and chair of the advisory board to the Kellogg Institute for International Studies, both at the University of Notre Dame.
Mark Loughridge
Born in 1953. Trustee since March 2012. Principal occupation(s) during the past five years and other experience: senior vice president and chief financial officer (retired 2013) of IBM (information technology services). Fiduciary member of IBM’s Retirement Plan Committee (2004–2013), senior vice president and general manager (2002–2004) of IBM Global Financing, vice president and controller (1998–2002) of IBM, and a variety of other prior management roles at IBM. Member of the Council on Chicago Booth.
Scott C. Malpass
Born in 1962. Trustee since March 2012. Principal occupation(s) during the past five years and other experience: chief investment officer (retired June 2020) and vice president (retired June 2020) of the University of Notre Dame. Assistant professor of finance at the Mendoza College of Business, University of Notre Dame, and member of the Notre Dame 403(b) Investment Committee (retired June 2020). Member of the board of Catholic Investment Services, Inc. (investment advisors) and the board of superintendence of the Institute for the Works of Religion.
Deanna Mulligan
Born in 1963. Trustee since January 2018. Principal occupation(s) during the past five years and other experience: board chair (2020–present), chief executive officer (2011–2020), and president (2010–2019) of The Guardian Life Insurance Company of America. Chief operating officer (2010–2011) and executive vice president (2008–2010) of the individual life and disability division of Guardian Life. Member of the board of the American Council of Life Insurers and the board of the Economic Club of New York. Trustee of the Partnership for New York City (business leadership), Chief Executives for Corporate Purpose, NewYork-Presbyterian Hospital, Catalyst, and the Bruce Museum (arts and science). Member of the Advisory Council for the Stanford Graduate School of Business.
André F. Perold
Born in 1952. Trustee since December 2004. Principal occupation(s) during the past five years and other experience: George Gund Professor of Finance and Banking, Emeritus at the Harvard Business School (retired 2011). Chief investment officer and co- managing partner of HighVista Strategies (private investment firm). Member of the board of advisors and member of the investment committee of the Museum of Fine Arts Boston. Member of the board (2018–present) of RIT Capital Partners (investment firm). Member of the investment committee of Partners Health Care System.
Sarah Bloom Raskin
Born in 1961. Trustee since January 2018. Principal occupation(s) during the past five years and other experience: deputy secretary (2014–2017) of the United States Department of the Treasury. Governor (2010–2014) of the Federal Reserve Board. Commissioner (2007–2010) of financial regulation for the State of Maryland. Member of the board of directors (2012–2014) of Neighborhood Reinvestment Corporation. Director (2017–present) of i(x) Investments, LLC; director (2017–present) of Reserve Trust. Rubenstein Fellow (2017–present) of Duke University; trustee (2017–present) of Amherst College, and trustee (2019–present) of the Folger Shakespeare Library.
Peter F. Volanakis
Born in 1955. Trustee since July 2009. Principal occupation(s) during the past five years and other experience: president and chief operating officer (retired 2010) of Corning Incorporated (communications equipment) and director of Corning Incorporated (2000–2010) and Dow Corning (2001–2010). Director (2012) of SPX Corporation (multi-industry manufacturing). Overseer of the Amos Tuck School of Business Administration, Dartmouth College (2001–2013). Chairman of the board of trustees of Colby-Sawyer College. Member of the board of Hypertherm Inc. (industrial cutting systems, software, and consumables).
Executive Officers
John Bendl
Born in 1970. Principal occupation(s) during the past five years and other experience: principal of Vanguard. Chief financial officer (2019–present) of each of the investment companies served by Vanguard. Chief accounting officer, treasurer, and controller of Vanguard (2017–present). Partner (2003–2016) at KPMG (audit, tax, and advisory services).
Christine M. Buchanan
Born in 1970. Principal occupation(s) during the past five years and other experience: principal of Vanguard. Treasurer (2017–present) of each of the investment companies served by Vanguard. Partner (2005–2017) at KPMG (audit, tax, and advisory services).
David Cermak
Born in 1960. Principal occupation(s) during the past five years and other experience: principal of Vanguard. Finance director (2019–present) of each of the investment companies served by Vanguard. Managing director and head (2017–present) of Vanguard Investments Singapore. Managing director and head (2017–2019) of Vanguard Investments Hong Kong. Representative director and head (2014–2017) of Vanguard Investments Japan.
John Galloway
Born in 1973. Principal occupation(s) during the past five years and other experience: principal of Vanguard. Investment stewardship officer (September 2020–present) of each of the investment companies served by Vanguard. Head of Investor Advocacy (February 2020–present) and head of Marketing Strategy and Planning (2017–2020) at Vanguard. Deputy assistant to the President of the United States (2015).
Thomas J. Higgins
Born in 1957. Principal occupation(s) during the past five years and other experience: principal of Vanguard. Finance director (2019–present), chief financial officer (2008–2019), and treasurer (1998–2008) of each of the investment companies served by Vanguard.
Peter Mahoney
Born in 1974. Principal occupation(s) during the past five years and other experience: principal of Vanguard. Controller (2015–present) of each of the investment companies served by Vanguard. Head of International Fund Services (2008–2014) at Vanguard.
Anne E. Robinson
Born in 1970. Principal occupation(s) during the past five years and other experience: general counsel (2016–present) of Vanguard. Secretary (2016–present) of Vanguard and of each of the investment companies served by Vanguard. Managing director (2016–present) of Vanguard. Managing director and general counsel of Global Cards and Consumer Services (2014–2016) at Citigroup. Counsel (2003–2014) at American Express.
Michael Rollings
Born in 1963. Principal occupation(s) during the past five years and other experience: finance director (2017–present) and treasurer (2017) of each of the investment companies served by Vanguard. Managing director (2016–present) of Vanguard. Chief financial officer (2016–present) of Vanguard. Director (2016–present) of Vanguard Marketing Corporation. Executive vice president and chief financial officer (2006–2016) of MassMutual Financial Group.
John E. Schadl
Born in 1972. Principal occupation(s) during the past five years and other experience: principal of Vanguard. Chief compliance officer (2019–present) of Vanguard and of each of the investment companies served by Vanguard. Assistant vice president (2019–present) of Vanguard Marketing Corporation.
Vanguard Senior Management Team
Joseph Brennan James M. Norris
Mortimer J. Buckley Thomas M. Rampulla
Gregory Davis Karin A. Risi
John James Anne E. Robinson
John T. Marcante Michael Rollings
Chris D. McIsaac Lauren Valente
Connect with Vanguard® > vanguard.com
Fund Information > 800-662-7447
Direct Investor Account Services > 800-662-2739
Institutional Investor Services > 800-523-1036
Text Telephone for PeopleWho Are Deaf or Hard of Hearing > 800-749-7273
This material may be used in conjunctionwith the offering of shares of any Vanguardfund only if preceded or accompanied bythe fund’s current prospectus.
All comparative mutual fund data are from Morningstar,Inc., unless otherwise noted.
You can obtain a free copy of Vanguard’s proxy votingguidelines by visiting vanguard.com/proxyreporting or bycalling Vanguard at 800-662-2739. The guidelines arealso available from the SEC’s website, www.sec.gov. Inaddition, you may obtain a free report on how your fundvoted the proxies for securities it owned during the 12months ended June 30. To get the report, visit eithervanguard.com/proxyreporting or www.sec.gov.
You can review information about your fund on theSEC’s website, and you can receive copies of thisinformation, for a fee, by sending a request via emailaddressed to [email protected].
Source for Bloomberg Barclays indexes: BloombergIndex Services Limited. Copyright 2020, Bloomberg. Allrights reserved.
© 2020 The Vanguard Group, Inc.All rights reserved.Vanguard Marketing Corporation, Distributor.
Q1240 112020