Embed Size (px)
Citation preview
Vanguard Common Contractual Fund
Annual Report | 31 December 2020
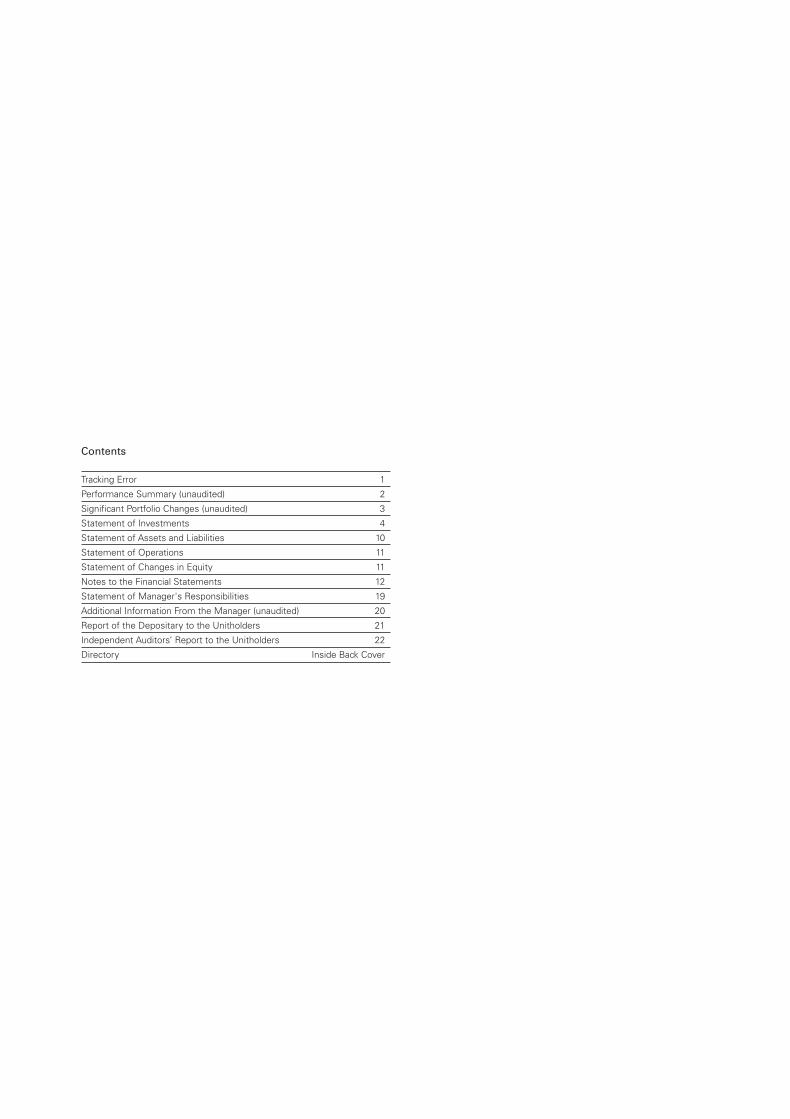
Contents
Tracking Error 1
Performance Summary (unaudited) 2
Significant Portfolio Changes (unaudited) 3
Statement of Investments 4
Statement of Assets and Liabilities 10
Statement of Operations 11
Statement of Changes in Equity 11
Notes to the Financial Statements 12
Statement of Manager's Responsibilities 19
Additional Information From the Manager (unaudited) 20
Report of the Depositary to the Unitholders 21
Independent Auditors’ Report to the Unitholders 22
Directory Inside Back Cover

The Sub-Fund listed in the table employs a “passive” investment strategy designed to replicate the performance of its benchmark index. TheSub-Fund attempts to replicate the index by investing all, or substantially all, of its assets in the securities that make up the index, holding eachin approximately the same proportion as its weighting in the index. Tracking error measures the volatility of the return difference between thefund and the index. It is calculated as the standard deviation of the tracking difference between the Sub-Fund and the index (gross of fees forthe trailing 36-month period). Realised tracking error may vary from the anticipated tracking error, depending on a range of circumstances.These include transaction costs, securities lending income, and withholding tax differences. The anticipated tracking error and realised trackingerror are not expected to vary significantly under normal circumstances.
For the Year Ended31 December 2020
Sub-FundAnticipated
Tracking ErrorRealised
Tracking Error Explanation for Divergence
Vanguard U.S. Equity Index CommonContractual Fund
0.500% 0.016% The Sub-Fund has tracked its benchmark within acceptabletolerances of its anticipated tracking error.
Tracking Error
1
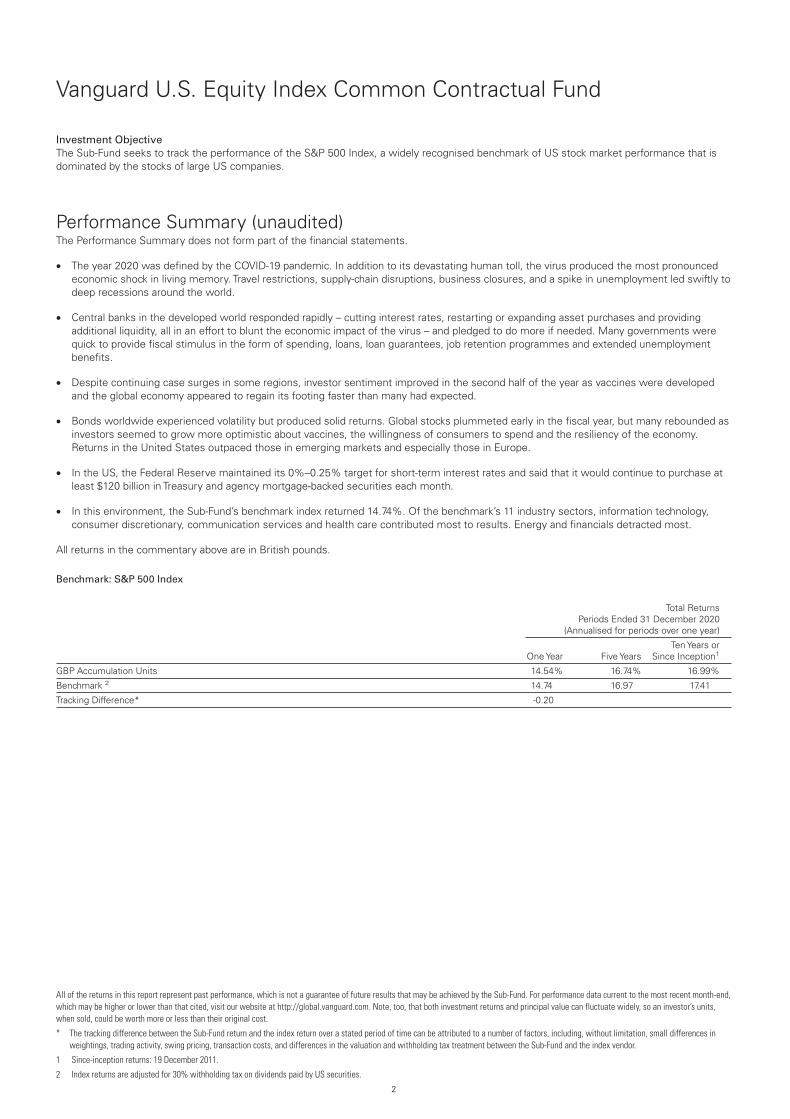
Investment Objective
The Sub-Fund seeks to track the performance of the S&P 500 Index, a widely recognised benchmark of US stock market performance that isdominated by the stocks of large US companies.
Performance Summary (unaudited)The Performance Summary does not form part of the financial statements.
• The year 2020 was defined by the COVID-19 pandemic. In addition to its devastating human toll, the virus produced the most pronouncedeconomic shock in living memory. Travel restrictions, supply-chain disruptions, business closures, and a spike in unemployment led swiftly todeep recessions around the world.
• Central banks in the developed world responded rapidly – cutting interest rates, restarting or expanding asset purchases and providingadditional liquidity, all in an effort to blunt the economic impact of the virus – and pledged to do more if needed. Many governments werequick to provide fiscal stimulus in the form of spending, loans, loan guarantees, job retention programmes and extended unemploymentbenefits.
• Despite continuing case surges in some regions, investor sentiment improved in the second half of the year as vaccines were developedand the global economy appeared to regain its footing faster than many had expected.
• Bonds worldwide experienced volatility but produced solid returns. Global stocks plummeted early in the fiscal year, but many rebounded asinvestors seemed to grow more optimistic about vaccines, the willingness of consumers to spend and the resiliency of the economy.Returns in the United States outpaced those in emerging markets and especially those in Europe.
• In the US, the Federal Reserve maintained its 0%–0.25% target for short-term interest rates and said that it would continue to purchase atleast $120 billion in Treasury and agency mortgage-backed securities each month.
• In this environment, the Sub-Fund’s benchmark index returned 14.74%. Of the benchmark’s 11 industry sectors, information technology,consumer discretionary, communication services and health care contributed most to results. Energy and financials detracted most.
All returns in the commentary above are in British pounds.
Benchmark: S&P 500 Index
Total ReturnsPeriods Ended 31 December 2020
(Annualised for periods over one year)
One Year Five YearsTen Years or
Since Inception1
GBP Accumulation Units 14.54% 16.74% 16.99%
Benchmark 2 14.74 16.97 17.41
Tracking Difference* -0.20
All of the returns in this report represent past performance, which is not a guarantee of future results that may be achieved by the Sub-Fund. For performance data current to the most recent month-end,which may be higher or lower than that cited, visit our website at http://global.vanguard.com. Note, too, that both investment returns and principal value can fluctuate widely, so an investor’s units,when sold, could be worth more or less than their original cost.
* The tracking difference between the Sub-Fund return and the index return over a stated period of time can be attributed to a number of factors, including, without limitation, small differences inweightings, trading activity, swing pricing, transaction costs, and differences in the valuation and withholding tax treatment between the Sub-Fund and the index vendor.
1 Since-inception returns: 19 December 2011.
2 Index returns are adjusted for 30% withholding tax on dividends paid by US securities.
Vanguard U.S. Equity Index Common Contractual Fund
2

SharesCost
US Dollars ($)
Purchases
Tesla Inc. 59,791 41,336,144Apple Inc. 121,214 18,393,145Microsoft Corp. 85,436 16,863,794Amazon.com Inc. 5,765 16,015,499Facebook Inc. 28,317 6,853,139Alphabet Inc. Class C 3,788 5,816,902Berkshire Hathaway Inc. Class B 23,733 4,946,145Alphabet Inc. Class A 2,916 4,370,876Johnson & Johnson 29,232 4,241,068AbbVie Inc. 45,887 3,995,626DexCom Inc. 9,506 3,955,912Visa Inc. 18,864 3,690,047JPMorgan Chase & Co. 33,930 3,623,418Procter & Gamble Co. 26,330 3,394,177UnitedHealth Group Inc. 11,069 3,374,688NVIDIA Corp. 7,703 3,272,454Mastercard Inc. 10,125 3,190,659Home Depot Inc. 12,268 3,121,089T-Mobile US Inc. 27,531 2,903,299Walt Disney Co. 22,547 2,889,788
SharesProceeds
US Dollars($)
Sales
Apple Inc. 182,855 29,568,865Microsoft Corp. 113,745 22,524,906Amazon.com Inc. 6,102 17,330,443Facebook Inc. 35,773 8,616,129Alphabet Inc. Class C 5,156 7,844,468Berkshire Hathaway Inc. Class B 30,613 6,257,218Allergan plc 31,355 6,013,818Alphabet Inc. Class A 4,022 5,965,046Johnson & Johnson 37,892 5,518,267JPMorgan Chase & Co. 50,202 5,090,987Visa Inc. 25,171 4,869,369Procter & Gamble Co. 35,552 4,530,431Intel Corp. 84,249 4,491,830Home Depot Inc. 16,728 4,185,189Mastercard Inc. 13,346 4,146,665UnitedHealth Group Inc. 13,661 4,145,607NVIDIA Corp. 8,905 3,792,243AT&T Inc. 120,340 3,581,745Walt Disney Co. 27,086 3,396,285Bank of America Corp. 135,984 3,384,370
The Central Bank of Ireland requires a schedule of material changes in the composition of the portfolio during the year. These are defined as aggregate purchases of a security exceeding 1% of the totalvalue of purchases for the year and aggregate disposals greater than 1% of the total value of sales. At a minimum, the largest 20 purchases and 20 sales must be shown; all purchases and sales mustbe shown if there are fewer than 20. A full listing of the portfolio changes for the year is available, upon request, at no extra cost from the Administrator, State Street Fund Services (Ireland) Limited.
Vanguard U.S. Equity Index Common Contractual Fund
Significant Portfolio Changes (unaudited)For the Year Ended 31 December 2020
3
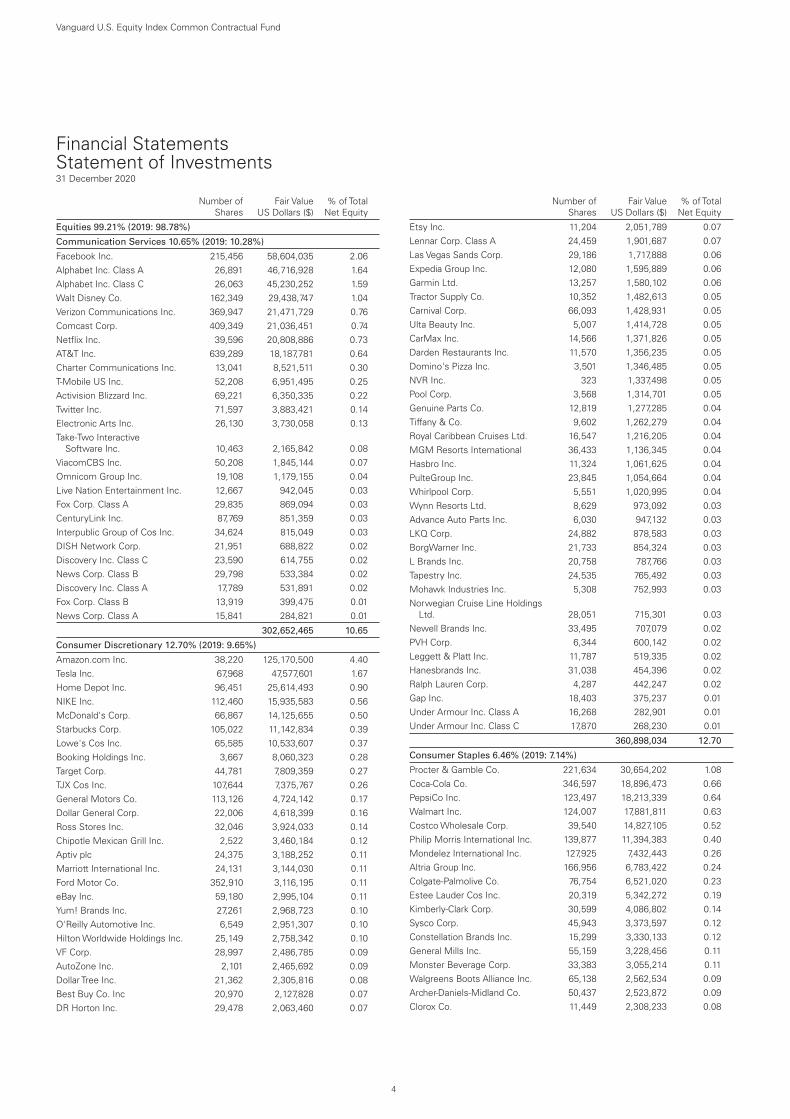
Financial StatementsStatement of Investments31 December 2020
Number ofShares
Fair ValueUS Dollars ($)
% of TotalNet Equity
Equities 99.21% (2019: 98.78%)
Communication Services 10.65% (2019: 10.28%)
Facebook Inc. 215,456 58,604,035 2.06Alphabet Inc. Class A 26,891 46,716,928 1.64Alphabet Inc. Class C 26,063 45,230,252 1.59Walt Disney Co. 162,349 29,438,747 1.04Verizon Communications Inc. 369,947 21,471,729 0.76Comcast Corp. 409,349 21,036,451 0.74Netflix Inc. 39,596 20,808,886 0.73AT&T Inc. 639,289 18,187,781 0.64Charter Communications Inc. 13,041 8,521,511 0.30T-Mobile US Inc. 52,208 6,951,495 0.25Activision Blizzard Inc. 69,221 6,350,335 0.22Twitter Inc. 71,597 3,883,421 0.14Electronic Arts Inc. 26,130 3,730,058 0.13Take-Two Interactive
Software Inc. 10,463 2,165,842 0.08ViacomCBS Inc. 50,208 1,845,144 0.07Omnicom Group Inc. 19,108 1,179,155 0.04Live Nation Entertainment Inc. 12,667 942,045 0.03Fox Corp. Class A 29,835 869,094 0.03CenturyLink Inc. 87,769 851,359 0.03Interpublic Group of Cos Inc. 34,624 815,049 0.03DISH Network Corp. 21,951 688,822 0.02Discovery Inc. Class C 23,590 614,755 0.02News Corp. Class B 29,798 533,384 0.02Discovery Inc. Class A 17,789 531,891 0.02Fox Corp. Class B 13,919 399,475 0.01News Corp. Class A 15,841 284,821 0.01
302,652,465 10.65
Consumer Discretionary 12.70% (2019: 9.65%)
Amazon.com Inc. 38,220 125,170,500 4.40Tesla Inc. 67,968 47,577,601 1.67Home Depot Inc. 96,451 25,614,493 0.90NIKE Inc. 112,460 15,935,583 0.56McDonald's Corp. 66,867 14,125,655 0.50Starbucks Corp. 105,022 11,142,834 0.39Lowe's Cos Inc. 65,585 10,533,607 0.37Booking Holdings Inc. 3,667 8,060,323 0.28Target Corp. 44,781 7,809,359 0.27TJX Cos Inc. 107,644 7,375,767 0.26General Motors Co. 113,126 4,724,142 0.17Dollar General Corp. 22,006 4,618,399 0.16Ross Stores Inc. 32,046 3,924,033 0.14Chipotle Mexican Grill Inc. 2,522 3,460,184 0.12Aptiv plc 24,375 3,188,252 0.11Marriott International Inc. 24,131 3,144,030 0.11Ford Motor Co. 352,910 3,116,195 0.11eBay Inc. 59,180 2,995,104 0.11Yum! Brands Inc. 27,261 2,968,723 0.10O'Reilly Automotive Inc. 6,549 2,951,307 0.10Hilton Worldwide Holdings Inc. 25,149 2,758,342 0.10VF Corp. 28,997 2,486,785 0.09AutoZone Inc. 2,101 2,465,692 0.09Dollar Tree Inc. 21,362 2,305,816 0.08Best Buy Co. Inc 20,970 2,127,828 0.07DR Horton Inc. 29,478 2,063,460 0.07
Number ofShares
Fair ValueUS Dollars ($)
% of TotalNet Equity
Etsy Inc. 11,204 2,051,789 0.07Lennar Corp. Class A 24,459 1,901,687 0.07Las Vegas Sands Corp. 29,186 1,717,888 0.06Expedia Group Inc. 12,080 1,595,889 0.06Garmin Ltd. 13,257 1,580,102 0.06Tractor Supply Co. 10,352 1,482,613 0.05Carnival Corp. 66,093 1,428,931 0.05Ulta Beauty Inc. 5,007 1,414,728 0.05CarMax Inc. 14,566 1,371,826 0.05Darden Restaurants Inc. 11,570 1,356,235 0.05Domino's Pizza Inc. 3,501 1,346,485 0.05NVR Inc. 323 1,337,498 0.05Pool Corp. 3,568 1,314,701 0.05Genuine Parts Co. 12,819 1,277,285 0.04Tiffany & Co. 9,602 1,262,279 0.04Royal Caribbean Cruises Ltd. 16,547 1,216,205 0.04MGM Resorts International 36,433 1,136,345 0.04Hasbro Inc. 11,324 1,061,625 0.04PulteGroup Inc. 23,845 1,054,664 0.04Whirlpool Corp. 5,551 1,020,995 0.04Wynn Resorts Ltd. 8,629 973,092 0.03Advance Auto Parts Inc. 6,030 947,132 0.03LKQ Corp. 24,882 878,583 0.03BorgWarner Inc. 21,733 854,324 0.03L Brands Inc. 20,758 787,766 0.03Tapestry Inc. 24,535 765,492 0.03Mohawk Industries Inc. 5,308 752,993 0.03Norwegian Cruise Line Holdings
Ltd. 28,051 715,301 0.03Newell Brands Inc. 33,495 707,079 0.02PVH Corp. 6,344 600,142 0.02Leggett & Platt Inc. 11,787 519,335 0.02Hanesbrands Inc. 31,038 454,396 0.02Ralph Lauren Corp. 4,287 442,247 0.02Gap Inc. 18,403 375,237 0.01Under Armour Inc. Class A 16,268 282,901 0.01Under Armour Inc. Class C 17,870 268,230 0.01
360,898,034 12.70
Consumer Staples 6.46% (2019: 7.14%)
Procter & Gamble Co. 221,634 30,654,202 1.08Coca-Cola Co. 346,597 18,896,473 0.66PepsiCo Inc. 123,497 18,213,339 0.64Walmart Inc. 124,007 17,881,811 0.63Costco Wholesale Corp. 39,540 14,827,105 0.52Philip Morris International Inc. 139,877 11,394,383 0.40Mondelez International Inc. 127,925 7,432,443 0.26Altria Group Inc. 166,956 6,783,422 0.24Colgate-Palmolive Co. 76,754 6,521,020 0.23Estee Lauder Cos Inc. 20,319 5,342,272 0.19Kimberly-Clark Corp. 30,599 4,086,802 0.14Sysco Corp. 45,943 3,373,597 0.12Constellation Brands Inc. 15,299 3,330,133 0.12General Mills Inc. 55,159 3,228,456 0.11Monster Beverage Corp. 33,383 3,055,214 0.11Walgreens Boots Alliance Inc. 65,138 2,562,534 0.09Archer-Daniels-Midland Co. 50,437 2,523,872 0.09Clorox Co. 11,449 2,308,233 0.08
Vanguard U.S. Equity Index Common Contractual Fund
4
Number ofShares
Fair ValueUS Dollars ($)
% of TotalNet Equity
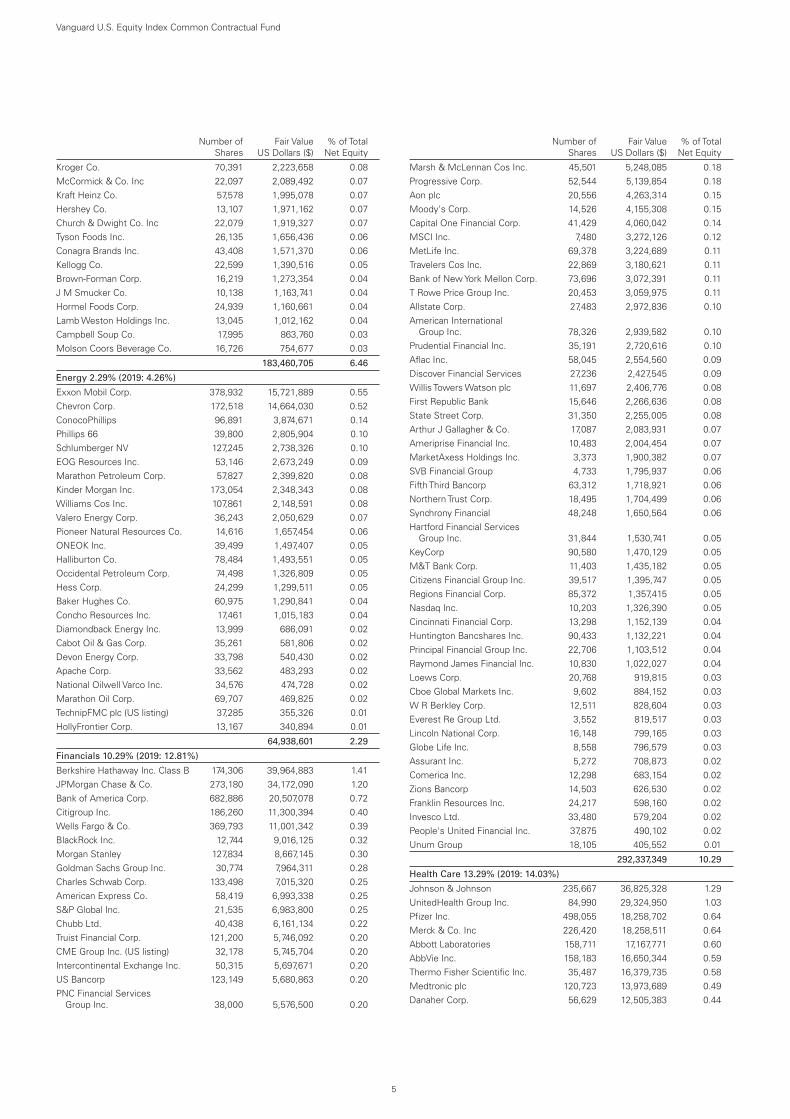
Kroger Co. 70,391 2,223,658 0.08McCormick & Co. Inc 22,097 2,089,492 0.07Kraft Heinz Co. 57,578 1,995,078 0.07Hershey Co. 13,107 1,971,162 0.07Church & Dwight Co. Inc 22,079 1,919,327 0.07Tyson Foods Inc. 26,135 1,656,436 0.06Conagra Brands Inc. 43,408 1,571,370 0.06Kellogg Co. 22,599 1,390,516 0.05Brown-Forman Corp. 16,219 1,273,354 0.04J M Smucker Co. 10,138 1,163,741 0.04Hormel Foods Corp. 24,939 1,160,661 0.04Lamb Weston Holdings Inc. 13,045 1,012,162 0.04Campbell Soup Co. 17,995 863,760 0.03Molson Coors Beverage Co. 16,726 754,677 0.03
183,460,705 6.46
Energy 2.29% (2019: 4.26%)
Exxon Mobil Corp. 378,932 15,721,889 0.55Chevron Corp. 172,518 14,664,030 0.52ConocoPhillips 96,891 3,874,671 0.14Phillips 66 39,800 2,805,904 0.10Schlumberger NV 127,245 2,738,326 0.10EOG Resources Inc. 53,146 2,673,249 0.09Marathon Petroleum Corp. 57,827 2,399,820 0.08Kinder Morgan Inc. 173,054 2,348,343 0.08Williams Cos Inc. 107,861 2,148,591 0.08Valero Energy Corp. 36,243 2,050,629 0.07Pioneer Natural Resources Co. 14,616 1,657,454 0.06ONEOK Inc. 39,499 1,497,407 0.05Halliburton Co. 78,484 1,493,551 0.05Occidental Petroleum Corp. 74,498 1,326,809 0.05Hess Corp. 24,299 1,299,511 0.05Baker Hughes Co. 60,975 1,290,841 0.04Concho Resources Inc. 17,461 1,015,183 0.04Diamondback Energy Inc. 13,999 686,091 0.02Cabot Oil & Gas Corp. 35,261 581,806 0.02Devon Energy Corp. 33,798 540,430 0.02Apache Corp. 33,562 483,293 0.02National Oilwell Varco Inc. 34,576 474,728 0.02Marathon Oil Corp. 69,707 469,825 0.02TechnipFMC plc (US listing) 37,285 355,326 0.01HollyFrontier Corp. 13,167 340,894 0.01
64,938,601 2.29
Financials 10.29% (2019: 12.81%)
Berkshire Hathaway Inc. Class B 174,306 39,964,883 1.41JPMorgan Chase & Co. 273,180 34,172,090 1.20Bank of America Corp. 682,886 20,507,078 0.72Citigroup Inc. 186,260 11,300,394 0.40Wells Fargo & Co. 369,793 11,001,342 0.39BlackRock Inc. 12,744 9,016,125 0.32Morgan Stanley 127,834 8,667,145 0.30Goldman Sachs Group Inc. 30,774 7,964,311 0.28Charles Schwab Corp. 133,498 7,015,320 0.25American Express Co. 58,419 6,993,338 0.25S&P Global Inc. 21,535 6,983,800 0.25Chubb Ltd. 40,438 6,161,134 0.22Truist Financial Corp. 121,200 5,746,092 0.20CME Group Inc. (US listing) 32,178 5,745,704 0.20Intercontinental Exchange Inc. 50,315 5,697,671 0.20US Bancorp 123,149 5,680,863 0.20PNC Financial Services
Group Inc. 38,000 5,576,500 0.20
Number ofShares
Fair ValueUS Dollars ($)
% of TotalNet Equity
Marsh & McLennan Cos Inc. 45,501 5,248,085 0.18Progressive Corp. 52,544 5,139,854 0.18Aon plc 20,556 4,263,314 0.15Moody's Corp. 14,526 4,155,308 0.15Capital One Financial Corp. 41,429 4,060,042 0.14MSCI Inc. 7,480 3,272,126 0.12MetLife Inc. 69,378 3,224,689 0.11Travelers Cos Inc. 22,869 3,180,621 0.11Bank of New York Mellon Corp. 73,696 3,072,391 0.11T Rowe Price Group Inc. 20,453 3,059,975 0.11Allstate Corp. 27,483 2,972,836 0.10American International
Group Inc. 78,326 2,939,582 0.10Prudential Financial Inc. 35,191 2,720,616 0.10Aflac Inc. 58,045 2,554,560 0.09Discover Financial Services 27,236 2,427,545 0.09Willis Towers Watson plc 11,697 2,406,776 0.08First Republic Bank 15,646 2,266,636 0.08State Street Corp. 31,350 2,255,005 0.08Arthur J Gallagher & Co. 17,087 2,083,931 0.07Ameriprise Financial Inc. 10,483 2,004,454 0.07MarketAxess Holdings Inc. 3,373 1,900,382 0.07SVB Financial Group 4,733 1,795,937 0.06Fifth Third Bancorp 63,312 1,718,921 0.06Northern Trust Corp. 18,495 1,704,499 0.06Synchrony Financial 48,248 1,650,564 0.06Hartford Financial Services
Group Inc. 31,844 1,530,741 0.05KeyCorp 90,580 1,470,129 0.05M&T Bank Corp. 11,403 1,435,182 0.05Citizens Financial Group Inc. 39,517 1,395,747 0.05Regions Financial Corp. 85,372 1,357,415 0.05Nasdaq Inc. 10,203 1,326,390 0.05Cincinnati Financial Corp. 13,298 1,152,139 0.04Huntington Bancshares Inc. 90,433 1,132,221 0.04Principal Financial Group Inc. 22,706 1,103,512 0.04Raymond James Financial Inc. 10,830 1,022,027 0.04Loews Corp. 20,768 919,815 0.03Cboe Global Markets Inc. 9,602 884,152 0.03W R Berkley Corp. 12,511 828,604 0.03Everest Re Group Ltd. 3,552 819,517 0.03Lincoln National Corp. 16,148 799,165 0.03Globe Life Inc. 8,558 796,579 0.03Assurant Inc. 5,272 708,873 0.02Comerica Inc. 12,298 683,154 0.02Zions Bancorp 14,503 626,530 0.02Franklin Resources Inc. 24,217 598,160 0.02Invesco Ltd. 33,480 579,204 0.02People's United Financial Inc. 37,875 490,102 0.02Unum Group 18,105 405,552 0.01
292,337,349 10.29
Health Care 13.29% (2019: 14.03%)
Johnson & Johnson 235,667 36,825,328 1.29UnitedHealth Group Inc. 84,990 29,324,950 1.03Pfizer Inc. 498,055 18,258,702 0.64Merck & Co. Inc 226,420 18,258,511 0.64Abbott Laboratories 158,711 17,167,771 0.60AbbVie Inc. 158,183 16,650,344 0.59Thermo Fisher Scientific Inc. 35,487 16,379,735 0.58Medtronic plc 120,723 13,973,689 0.49Danaher Corp. 56,629 12,505,383 0.44
Vanguard U.S. Equity Index Common Contractual Fund
5
Number ofShares
Fair ValueUS Dollars ($)
% of TotalNet Equity
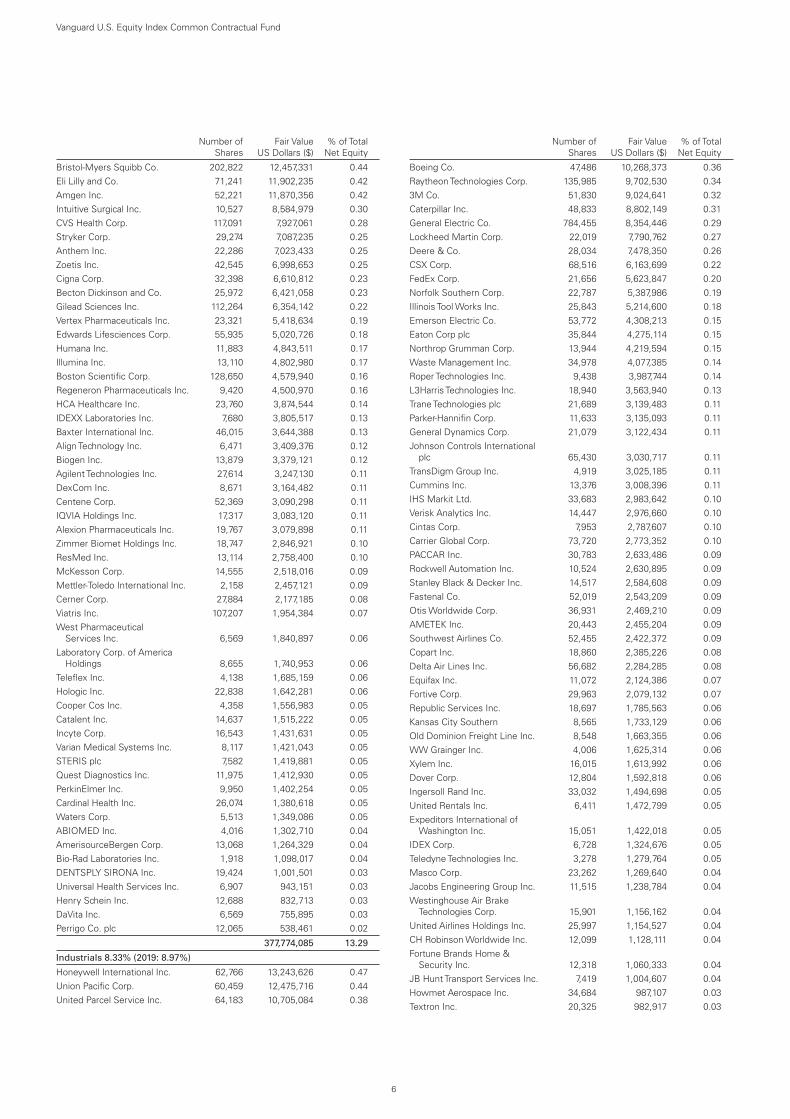
Bristol-Myers Squibb Co. 202,822 12,457,331 0.44Eli Lilly and Co. 71,241 11,902,235 0.42Amgen Inc. 52,221 11,870,356 0.42Intuitive Surgical Inc. 10,527 8,584,979 0.30CVS Health Corp. 117,091 7,927,061 0.28Stryker Corp. 29,274 7,087,235 0.25Anthem Inc. 22,286 7,023,433 0.25Zoetis Inc. 42,545 6,998,653 0.25Cigna Corp. 32,398 6,610,812 0.23Becton Dickinson and Co. 25,972 6,421,058 0.23Gilead Sciences Inc. 112,264 6,354,142 0.22Vertex Pharmaceuticals Inc. 23,321 5,418,634 0.19Edwards Lifesciences Corp. 55,935 5,020,726 0.18Humana Inc. 11,883 4,843,511 0.17Illumina Inc. 13,110 4,802,980 0.17Boston Scientific Corp. 128,650 4,579,940 0.16Regeneron Pharmaceuticals Inc. 9,420 4,500,970 0.16HCA Healthcare Inc. 23,760 3,874,544 0.14IDEXX Laboratories Inc. 7,680 3,805,517 0.13Baxter International Inc. 46,015 3,644,388 0.13Align Technology Inc. 6,471 3,409,376 0.12Biogen Inc. 13,879 3,379,121 0.12Agilent Technologies Inc. 27,614 3,247,130 0.11DexCom Inc. 8,671 3,164,482 0.11Centene Corp. 52,369 3,090,298 0.11IQVIA Holdings Inc. 17,317 3,083,120 0.11Alexion Pharmaceuticals Inc. 19,767 3,079,898 0.11Zimmer Biomet Holdings Inc. 18,747 2,846,921 0.10ResMed Inc. 13,114 2,758,400 0.10McKesson Corp. 14,555 2,518,016 0.09Mettler-Toledo International Inc. 2,158 2,457,121 0.09Cerner Corp. 27,884 2,177,185 0.08Viatris Inc. 107,207 1,954,384 0.07West Pharmaceutical
Services Inc. 6,569 1,840,897 0.06Laboratory Corp. of America
Holdings 8,655 1,740,953 0.06Teleflex Inc. 4,138 1,685,159 0.06Hologic Inc. 22,838 1,642,281 0.06Cooper Cos Inc. 4,358 1,556,983 0.05Catalent Inc. 14,637 1,515,222 0.05Incyte Corp. 16,543 1,431,631 0.05Varian Medical Systems Inc. 8,117 1,421,043 0.05STERIS plc 7,582 1,419,881 0.05Quest Diagnostics Inc. 11,975 1,412,930 0.05PerkinElmer Inc. 9,950 1,402,254 0.05Cardinal Health Inc. 26,074 1,380,618 0.05Waters Corp. 5,513 1,349,086 0.05ABIOMED Inc. 4,016 1,302,710 0.04AmerisourceBergen Corp. 13,068 1,264,329 0.04Bio-Rad Laboratories Inc. 1,918 1,098,017 0.04DENTSPLY SIRONA Inc. 19,424 1,001,501 0.03Universal Health Services Inc. 6,907 943,151 0.03Henry Schein Inc. 12,688 832,713 0.03DaVita Inc. 6,569 755,895 0.03Perrigo Co. plc 12,065 538,461 0.02
377,774,085 13.29
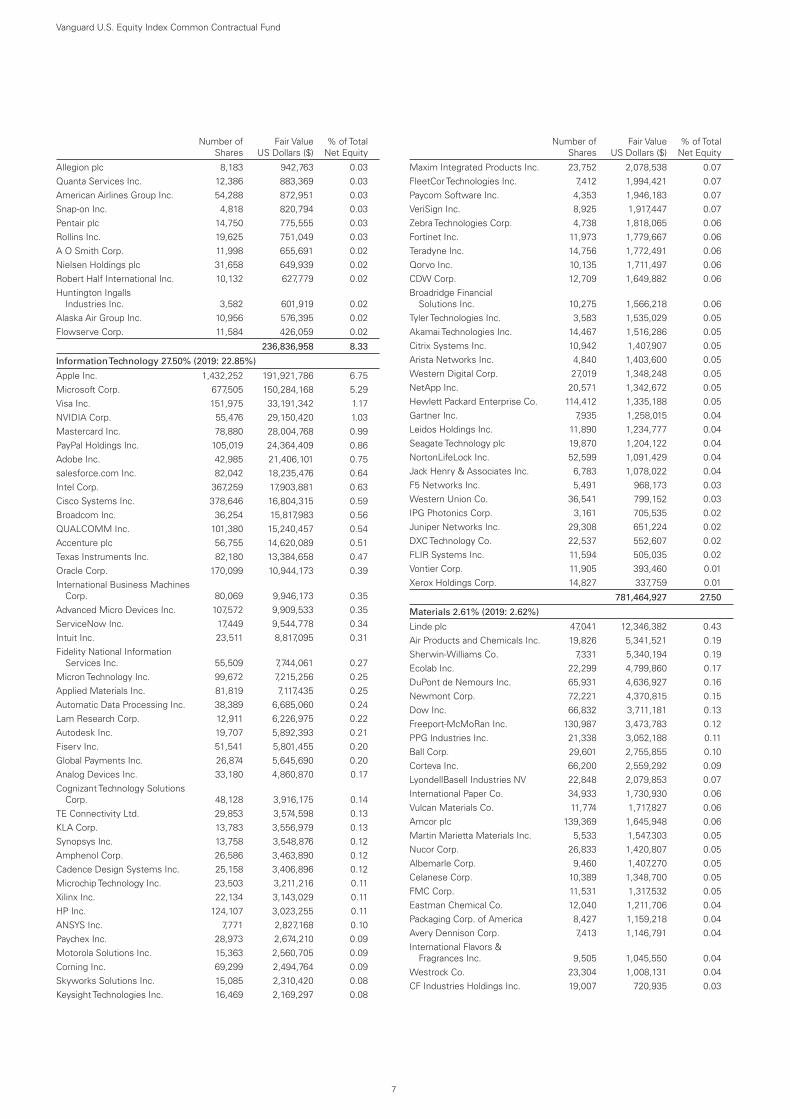
Industrials 8.33% (2019: 8.97%)
Honeywell International Inc. 62,766 13,243,626 0.47Union Pacific Corp. 60,459 12,475,716 0.44United Parcel Service Inc. 64,183 10,705,084 0.38
Number ofShares
Fair ValueUS Dollars ($)
% of TotalNet Equity
Boeing Co. 47,486 10,268,373 0.36Raytheon Technologies Corp. 135,985 9,702,530 0.343M Co. 51,830 9,024,641 0.32Caterpillar Inc. 48,833 8,802,149 0.31General Electric Co. 784,455 8,354,446 0.29Lockheed Martin Corp. 22,019 7,790,762 0.27Deere & Co. 28,034 7,478,350 0.26CSX Corp. 68,516 6,163,699 0.22FedEx Corp. 21,656 5,623,847 0.20Norfolk Southern Corp. 22,787 5,387,986 0.19Illinois Tool Works Inc. 25,843 5,214,600 0.18Emerson Electric Co. 53,772 4,308,213 0.15Eaton Corp plc 35,844 4,275,114 0.15Northrop Grumman Corp. 13,944 4,219,594 0.15Waste Management Inc. 34,978 4,077,385 0.14Roper Technologies Inc. 9,438 3,987,744 0.14L3Harris Technologies Inc. 18,940 3,563,940 0.13Trane Technologies plc 21,689 3,139,483 0.11Parker-Hannifin Corp. 11,633 3,135,093 0.11General Dynamics Corp. 21,079 3,122,434 0.11Johnson Controls International
plc 65,430 3,030,717 0.11TransDigm Group Inc. 4,919 3,025,185 0.11Cummins Inc. 13,376 3,008,396 0.11IHS Markit Ltd. 33,683 2,983,642 0.10Verisk Analytics Inc. 14,447 2,976,660 0.10Cintas Corp. 7,953 2,787,607 0.10Carrier Global Corp. 73,720 2,773,352 0.10PACCAR Inc. 30,783 2,633,486 0.09Rockwell Automation Inc. 10,524 2,630,895 0.09Stanley Black & Decker Inc. 14,517 2,584,608 0.09Fastenal Co. 52,019 2,543,209 0.09Otis Worldwide Corp. 36,931 2,469,210 0.09AMETEK Inc. 20,443 2,455,204 0.09Southwest Airlines Co. 52,455 2,422,372 0.09Copart Inc. 18,860 2,385,226 0.08Delta Air Lines Inc. 56,682 2,284,285 0.08Equifax Inc. 11,072 2,124,386 0.07Fortive Corp. 29,963 2,079,132 0.07Republic Services Inc. 18,697 1,785,563 0.06Kansas City Southern 8,565 1,733,129 0.06Old Dominion Freight Line Inc. 8,548 1,663,355 0.06WW Grainger Inc. 4,006 1,625,314 0.06Xylem Inc. 16,015 1,613,992 0.06Dover Corp. 12,804 1,592,818 0.06Ingersoll Rand Inc. 33,032 1,494,698 0.05United Rentals Inc. 6,411 1,472,799 0.05Expeditors International of
Washington Inc. 15,051 1,422,018 0.05IDEX Corp. 6,728 1,324,676 0.05Teledyne Technologies Inc. 3,278 1,279,764 0.05Masco Corp. 23,262 1,269,640 0.04Jacobs Engineering Group Inc. 11,515 1,238,784 0.04Westinghouse Air Brake
Technologies Corp. 15,901 1,156,162 0.04United Airlines Holdings Inc. 25,997 1,154,527 0.04CH Robinson Worldwide Inc. 12,099 1,128,111 0.04Fortune Brands Home &
Security Inc. 12,318 1,060,333 0.04JB Hunt Transport Services Inc. 7,419 1,004,607 0.04Howmet Aerospace Inc. 34,684 987,107 0.03Textron Inc. 20,325 982,917 0.03
Vanguard U.S. Equity Index Common Contractual Fund
6
Number ofShares
Fair ValueUS Dollars ($)
% of TotalNet Equity
Allegion plc 8,183 942,763 0.03Quanta Services Inc. 12,386 883,369 0.03American Airlines Group Inc. 54,288 872,951 0.03Snap-on Inc. 4,818 820,794 0.03Pentair plc 14,750 775,555 0.03Rollins Inc. 19,625 751,049 0.03A O Smith Corp. 11,998 655,691 0.02Nielsen Holdings plc 31,658 649,939 0.02Robert Half International Inc. 10,132 627,779 0.02Huntington Ingalls
Industries Inc. 3,582 601,919 0.02Alaska Air Group Inc. 10,956 576,395 0.02Flowserve Corp. 11,584 426,059 0.02
236,836,958 8.33
InformationTechnology 27.50% (2019: 22.85%)
Apple Inc. 1,432,252 191,921,786 6.75Microsoft Corp. 677,505 150,284,168 5.29Visa Inc. 151,975 33,191,342 1.17NVIDIA Corp. 55,476 29,150,420 1.03Mastercard Inc. 78,880 28,004,768 0.99PayPal Holdings Inc. 105,019 24,364,409 0.86Adobe Inc. 42,985 21,406,101 0.75salesforce.com Inc. 82,042 18,235,476 0.64Intel Corp. 367,259 17,903,881 0.63Cisco Systems Inc. 378,646 16,804,315 0.59Broadcom Inc. 36,254 15,817,983 0.56QUALCOMM Inc. 101,380 15,240,457 0.54Accenture plc 56,755 14,620,089 0.51Texas Instruments Inc. 82,180 13,384,658 0.47Oracle Corp. 170,099 10,944,173 0.39International Business Machines
Corp. 80,069 9,946,173 0.35Advanced Micro Devices Inc. 107,572 9,909,533 0.35ServiceNow Inc. 17,449 9,544,778 0.34Intuit Inc. 23,511 8,817,095 0.31Fidelity National Information
Services Inc. 55,509 7,744,061 0.27Micron Technology Inc. 99,672 7,215,256 0.25Applied Materials Inc. 81,819 7,117,435 0.25Automatic Data Processing Inc. 38,389 6,685,060 0.24Lam Research Corp. 12,911 6,226,975 0.22Autodesk Inc. 19,707 5,892,393 0.21Fiserv Inc. 51,541 5,801,455 0.20Global Payments Inc. 26,874 5,645,690 0.20Analog Devices Inc. 33,180 4,860,870 0.17Cognizant Technology Solutions
Corp. 48,128 3,916,175 0.14TE Connectivity Ltd. 29,853 3,574,598 0.13KLA Corp. 13,783 3,556,979 0.13Synopsys Inc. 13,758 3,548,876 0.12Amphenol Corp. 26,586 3,463,890 0.12Cadence Design Systems Inc. 25,158 3,406,896 0.12Microchip Technology Inc. 23,503 3,211,216 0.11Xilinx Inc. 22,134 3,143,029 0.11HP Inc. 124,107 3,023,255 0.11ANSYS Inc. 7,771 2,827,168 0.10Paychex Inc. 28,973 2,674,210 0.09Motorola Solutions Inc. 15,363 2,560,705 0.09Corning Inc. 69,299 2,494,764 0.09Skyworks Solutions Inc. 15,085 2,310,420 0.08Keysight Technologies Inc. 16,469 2,169,297 0.08
Number ofShares
Fair ValueUS Dollars ($)
% of TotalNet Equity
Maxim Integrated Products Inc. 23,752 2,078,538 0.07FleetCor Technologies Inc. 7,412 1,994,421 0.07Paycom Software Inc. 4,353 1,946,183 0.07VeriSign Inc. 8,925 1,917,447 0.07Zebra Technologies Corp. 4,738 1,818,065 0.06Fortinet Inc. 11,973 1,779,667 0.06Teradyne Inc. 14,756 1,772,491 0.06Qorvo Inc. 10,135 1,711,497 0.06CDW Corp. 12,709 1,649,882 0.06Broadridge Financial
Solutions Inc. 10,275 1,566,218 0.06Tyler Technologies Inc. 3,583 1,535,029 0.05Akamai Technologies Inc. 14,467 1,516,286 0.05Citrix Systems Inc. 10,942 1,407,907 0.05Arista Networks Inc. 4,840 1,403,600 0.05Western Digital Corp. 27,019 1,348,248 0.05NetApp Inc. 20,571 1,342,672 0.05Hewlett Packard Enterprise Co. 114,412 1,335,188 0.05Gartner Inc. 7,935 1,258,015 0.04Leidos Holdings Inc. 11,890 1,234,777 0.04Seagate Technology plc 19,870 1,204,122 0.04NortonLifeLock Inc. 52,599 1,091,429 0.04Jack Henry & Associates Inc. 6,783 1,078,022 0.04F5 Networks Inc. 5,491 968,173 0.03Western Union Co. 36,541 799,152 0.03IPG Photonics Corp. 3,161 705,535 0.02Juniper Networks Inc. 29,308 651,224 0.02DXC Technology Co. 22,537 552,607 0.02FLIR Systems Inc. 11,594 505,035 0.02Vontier Corp. 11,905 393,460 0.01Xerox Holdings Corp. 14,827 337,759 0.01
781,464,927 27.50
Materials 2.61% (2019: 2.62%)
Linde plc 47,041 12,346,382 0.43Air Products and Chemicals Inc. 19,826 5,341,521 0.19Sherwin-Williams Co. 7,331 5,340,194 0.19Ecolab Inc. 22,299 4,799,860 0.17DuPont de Nemours Inc. 65,931 4,636,927 0.16Newmont Corp. 72,221 4,370,815 0.15Dow Inc. 66,832 3,711,181 0.13Freeport-McMoRan Inc. 130,987 3,473,783 0.12PPG Industries Inc. 21,338 3,052,188 0.11Ball Corp. 29,601 2,755,855 0.10Corteva Inc. 66,200 2,559,292 0.09LyondellBasell Industries NV 22,848 2,079,853 0.07International Paper Co. 34,933 1,730,930 0.06Vulcan Materials Co. 11,774 1,717,827 0.06Amcor plc 139,369 1,645,948 0.06Martin Marietta Materials Inc. 5,533 1,547,303 0.05Nucor Corp. 26,833 1,420,807 0.05Albemarle Corp. 9,460 1,407,270 0.05Celanese Corp. 10,389 1,348,700 0.05FMC Corp. 11,531 1,317,532 0.05Eastman Chemical Co. 12,040 1,211,706 0.04Packaging Corp. of America 8,427 1,159,218 0.04Avery Dennison Corp. 7,413 1,146,791 0.04International Flavors &
Fragrances Inc. 9,505 1,045,550 0.04Westrock Co. 23,304 1,008,131 0.04CF Industries Holdings Inc. 19,007 720,935 0.03
Vanguard U.S. Equity Index Common Contractual Fund
7
Number ofShares
Fair ValueUS Dollars ($)
% of TotalNet Equity
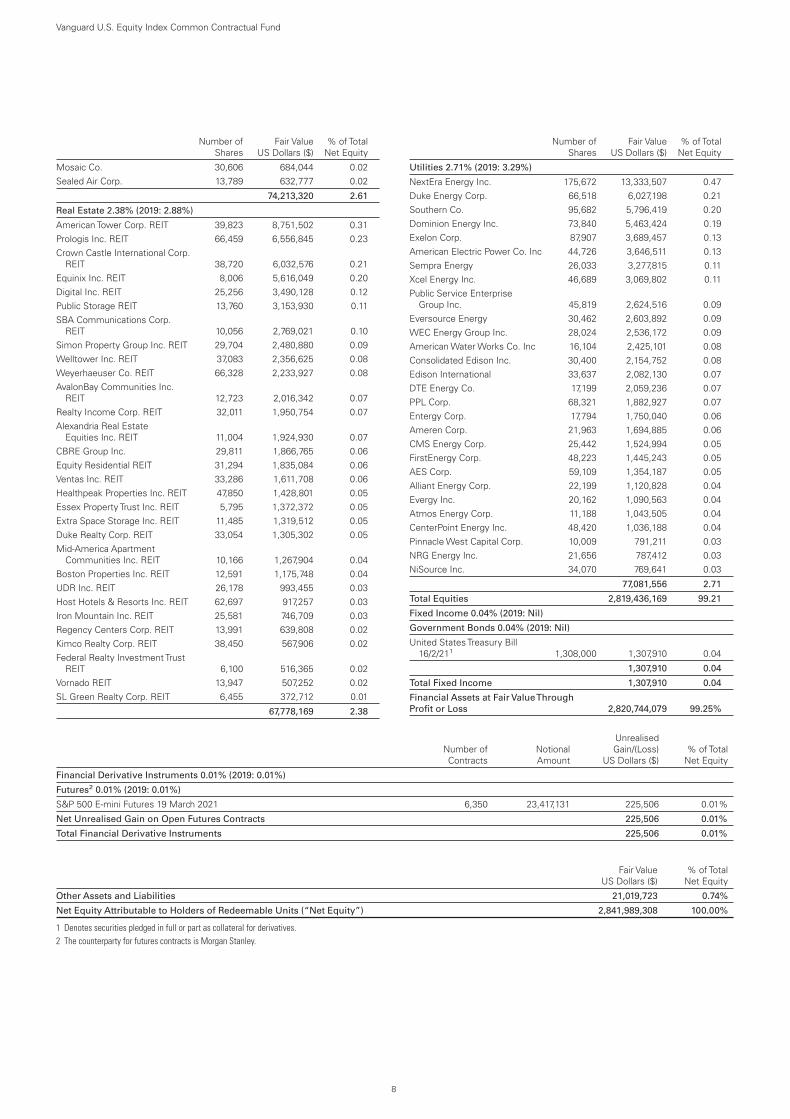
Mosaic Co. 30,606 684,044 0.02Sealed Air Corp. 13,789 632,777 0.02
74,213,320 2.61
Real Estate 2.38% (2019: 2.88%)
American Tower Corp. REIT 39,823 8,751,502 0.31Prologis Inc. REIT 66,459 6,556,845 0.23Crown Castle International Corp.
REIT 38,720 6,032,576 0.21Equinix Inc. REIT 8,006 5,616,049 0.20Digital Inc. REIT 25,256 3,490,128 0.12Public Storage REIT 13,760 3,153,930 0.11SBA Communications Corp.
REIT 10,056 2,769,021 0.10Simon Property Group Inc. REIT 29,704 2,480,880 0.09Welltower Inc. REIT 37,083 2,356,625 0.08Weyerhaeuser Co. REIT 66,328 2,233,927 0.08AvalonBay Communities Inc.
REIT 12,723 2,016,342 0.07Realty Income Corp. REIT 32,011 1,950,754 0.07Alexandria Real Estate
Equities Inc. REIT 11,004 1,924,930 0.07CBRE Group Inc. 29,811 1,866,765 0.06Equity Residential REIT 31,294 1,835,084 0.06Ventas Inc. REIT 33,286 1,611,708 0.06Healthpeak Properties Inc. REIT 47,850 1,428,801 0.05Essex Property Trust Inc. REIT 5,795 1,372,372 0.05Extra Space Storage Inc. REIT 11,485 1,319,512 0.05Duke Realty Corp. REIT 33,054 1,305,302 0.05Mid-America Apartment
Communities Inc. REIT 10,166 1,267,904 0.04Boston Properties Inc. REIT 12,591 1,175,748 0.04UDR Inc. REIT 26,178 993,455 0.03Host Hotels & Resorts Inc. REIT 62,697 917,257 0.03Iron Mountain Inc. REIT 25,581 746,709 0.03Regency Centers Corp. REIT 13,991 639,808 0.02Kimco Realty Corp. REIT 38,450 567,906 0.02Federal Realty Investment Trust
REIT 6,100 516,365 0.02Vornado REIT 13,947 507,252 0.02SL Green Realty Corp. REIT 6,455 372,712 0.01
67,778,169 2.38
Number ofShares
Fair ValueUS Dollars ($)
% of TotalNet Equity
Utilities 2.71% (2019: 3.29%)
NextEra Energy Inc. 175,672 13,333,507 0.47Duke Energy Corp. 66,518 6,027,198 0.21Southern Co. 95,682 5,796,419 0.20Dominion Energy Inc. 73,840 5,463,424 0.19Exelon Corp. 87,907 3,689,457 0.13American Electric Power Co. Inc 44,726 3,646,511 0.13Sempra Energy 26,033 3,277,815 0.11Xcel Energy Inc. 46,689 3,069,802 0.11Public Service Enterprise
Group Inc. 45,819 2,624,516 0.09Eversource Energy 30,462 2,603,892 0.09WEC Energy Group Inc. 28,024 2,536,172 0.09American Water Works Co. Inc 16,104 2,425,101 0.08Consolidated Edison Inc. 30,400 2,154,752 0.08Edison International 33,637 2,082,130 0.07DTE Energy Co. 17,199 2,059,236 0.07PPL Corp. 68,321 1,882,927 0.07Entergy Corp. 17,794 1,750,040 0.06Ameren Corp. 21,963 1,694,885 0.06CMS Energy Corp. 25,442 1,524,994 0.05FirstEnergy Corp. 48,223 1,445,243 0.05AES Corp. 59,109 1,354,187 0.05Alliant Energy Corp. 22,199 1,120,828 0.04Evergy Inc. 20,162 1,090,563 0.04Atmos Energy Corp. 11,188 1,043,505 0.04CenterPoint Energy Inc. 48,420 1,036,188 0.04Pinnacle West Capital Corp. 10,009 791,211 0.03NRG Energy Inc. 21,656 787,412 0.03NiSource Inc. 34,070 769,641 0.03
77,081,556 2.71
Total Equities 2,819,436,169 99.21
Fixed Income 0.04% (2019: Nil)
Government Bonds 0.04% (2019: Nil)
United States Treasury Bill16/2/211 1,308,000 1,307,910 0.04
1,307,910 0.04
Total Fixed Income 1,307,910 0.04
Financial Assets at Fair ValueThrough
Profit or Loss 2,820,744,079 99.25%
Number ofContracts
NotionalAmount
UnrealisedGain/(Loss)
US Dollars ($)% of Total
Net Equity
Financial Derivative Instruments 0.01% (2019: 0.01%)
Futures2 0.01% (2019: 0.01%)
S&P 500 E-mini Futures 19 March 2021 6,350 23,417,131 225,506 0.01%
Net Unrealised Gain on Open Futures Contracts 225,506 0.01%
Total Financial Derivative Instruments 225,506 0.01%
Fair ValueUS Dollars ($)
% of TotalNet Equity
Other Assets and Liabilities 21,019,723 0.74%
Net Equity Attributable to Holders of Redeemable Units (“Net Equity”) 2,841,989,308 100.00%
1 Denotes securities pledged in full or part as collateral for derivatives.2 The counterparty for futures contracts is Morgan Stanley.
Vanguard U.S. Equity Index Common Contractual Fund
8
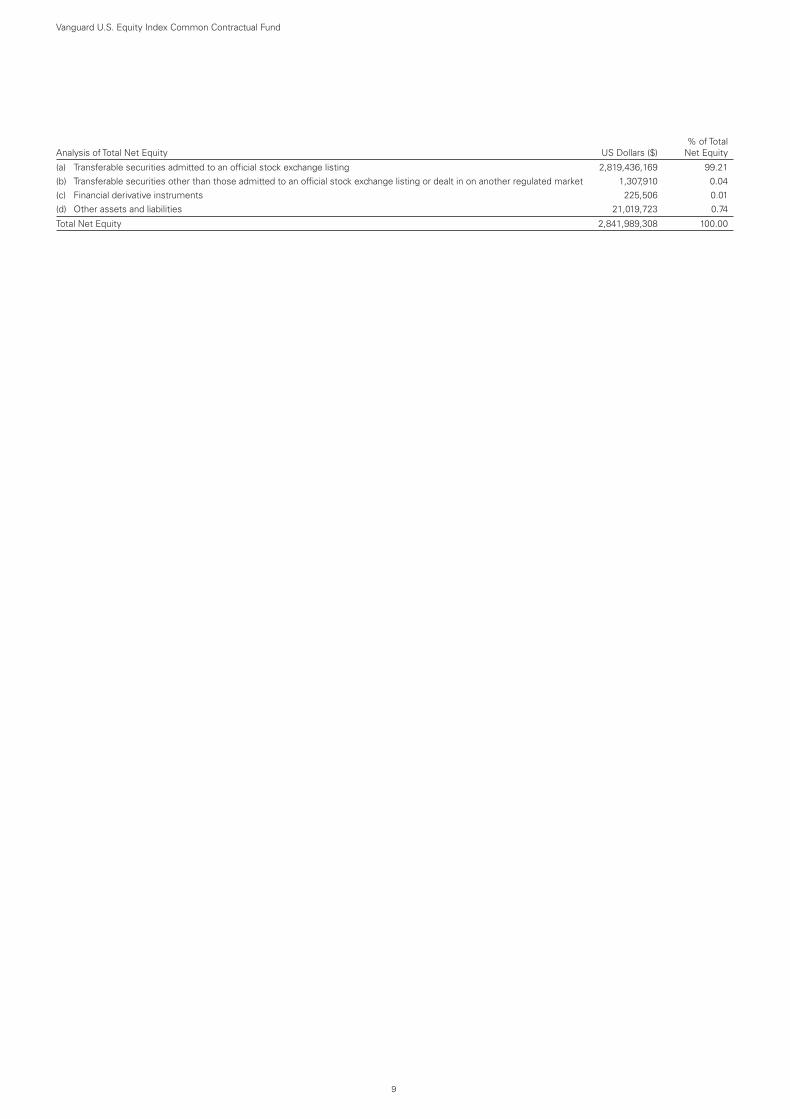
Analysis of Total Net Equity US Dollars ($)% of Total
Net Equity
(a) Transferable securities admitted to an official stock exchange listing 2,819,436,169 99.21(b) Transferable securities other than those admitted to an official stock exchange listing or dealt in on another regulated market 1,307,910 0.04(c) Financial derivative instruments 225,506 0.01(d) Other assets and liabilities 21,019,723 0.74
Total Net Equity 2,841,989,308 100.00
Vanguard U.S. Equity Index Common Contractual Fund
9
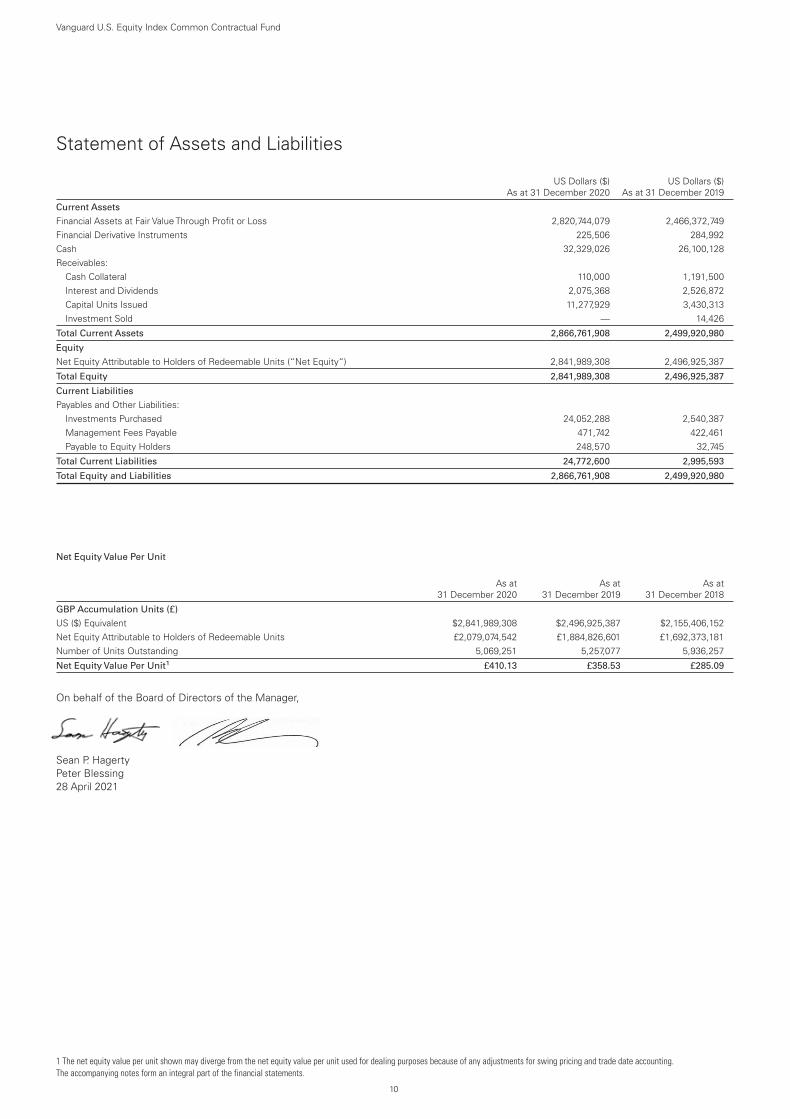
US Dollars ($)As at 31 December 2020
US Dollars ($)As at 31 December 2019
Current Assets
Financial Assets at Fair Value Through Profit or Loss 2,820,744,079 2,466,372,749Financial Derivative Instruments 225,506 284,992Cash 32,329,026 26,100,128Receivables:
Cash Collateral 110,000 1,191,500Interest and Dividends 2,075,368 2,526,872Capital Units Issued 11,277,929 3,430,313Investment Sold — 14,426
Total Current Assets 2,866,761,908 2,499,920,980
Equity
Net Equity Attributable to Holders of Redeemable Units (“Net Equity“) 2,841,989,308 2,496,925,387
Total Equity 2,841,989,308 2,496,925,387
Current Liabilities
Payables and Other Liabilities:Investments Purchased 24,052,288 2,540,387Management Fees Payable 471,742 422,461Payable to Equity Holders 248,570 32,745
Total Current Liabilities 24,772,600 2,995,593
Total Equity and Liabilities 2,866,761,908 2,499,920,980
Net Equity Value Per Unit
As at31 December 2020
As at31 December 2019
As at31 December 2018
GBP Accumulation Units (£)
US ($) Equivalent $2,841,989,308 $2,496,925,387 $2,155,406,152Net Equity Attributable to Holders of Redeemable Units £2,079,074,542 £1,884,826,601 £1,692,373,181Number of Units Outstanding 5,069,251 5,257,077 5,936,257
Net Equity Value Per Unit1 £410.13 £358.53 £285.09
On behalf of the Board of Directors of the Manager,
Sean P. HagertyPeter Blessing28 April 2021
1 The net equity value per unit shown may diverge from the net equity value per unit used for dealing purposes because of any adjustments for swing pricing and trade date accounting.The accompanying notes form an integral part of the financial statements.
Vanguard U.S. Equity Index Common Contractual Fund
Statement of Assets and Liabilities
10
US Dollars ($)Year Ended
31 December 2020
US Dollars ($)Year Ended
31 December 2019
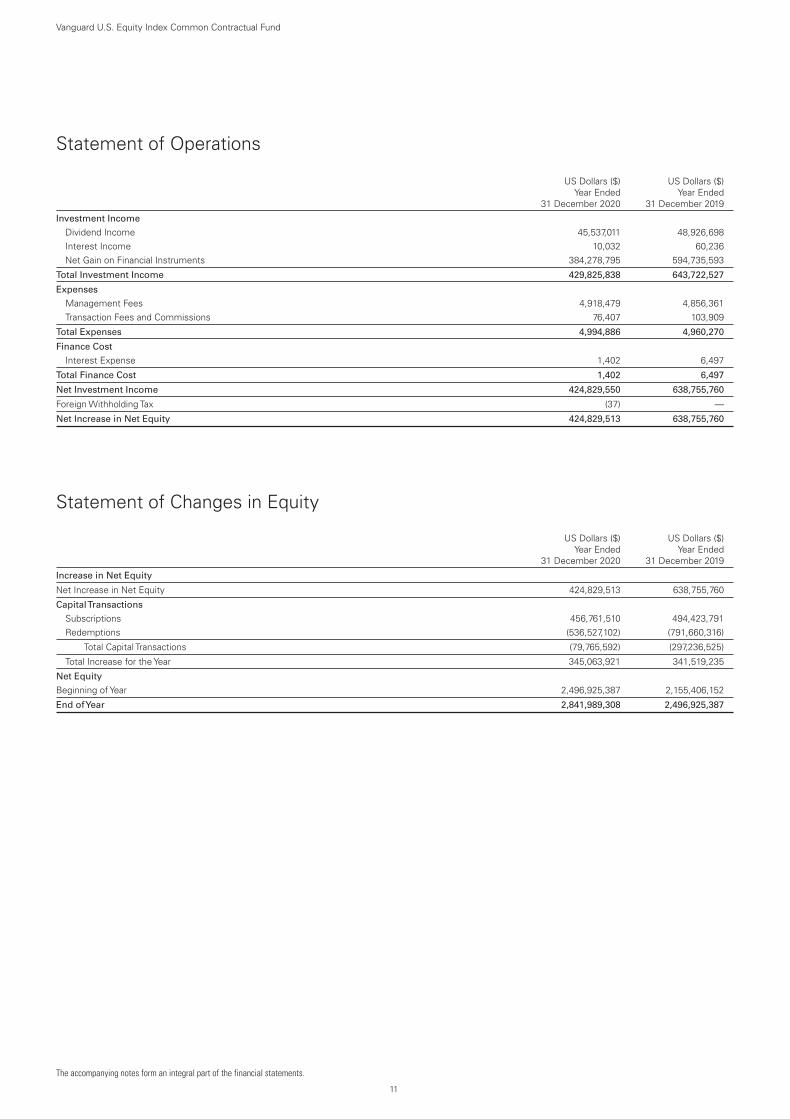
Investment Income
Dividend Income 45,537,011 48,926,698Interest Income 10,032 60,236Net Gain on Financial Instruments 384,278,795 594,735,593
Total Investment Income 429,825,838 643,722,527
Expenses
Management Fees 4,918,479 4,856,361Transaction Fees and Commissions 76,407 103,909
Total Expenses 4,994,886 4,960,270
Finance Cost
Interest Expense 1,402 6,497
Total Finance Cost 1,402 6,497
Net Investment Income 424,829,550 638,755,760
Foreign Withholding Tax (37) —
Net Increase in Net Equity 424,829,513 638,755,760
Statement of Changes in Equity
US Dollars ($)Year Ended
31 December 2020
US Dollars ($)Year Ended
31 December 2019
Increase in Net Equity
Net Increase in Net Equity 424,829,513 638,755,760
CapitalTransactions
Subscriptions 456,761,510 494,423,791Redemptions (536,527,102) (791,660,316)
Total Capital Transactions (79,765,592) (297,236,525)
Total Increase for the Year 345,063,921 341,519,235
Net Equity
Beginning of Year 2,496,925,387 2,155,406,152
End ofYear 2,841,989,308 2,496,925,387
The accompanying notes form an integral part of the financial statements.
Vanguard U.S. Equity Index Common Contractual Fund
Statement of Operations
11
1. General Information. Vanguard Common Contractual Fund (the “Fund”) is a common contractual fund constituted by a Deed of Constitutiongoverned by the laws of Ireland. The Fund is constituted as an umbrella fund insofar as the units of the Fund (the “Units”) will be divided intodifferent series of Units with each series of Units representing a separate investment portfolio of assets which will constitute a separate sub-fund(each a “Sub-Fund”, collectively “Sub-Funds”). Units of any particular series may be divided into different classes to accommodate differentsubscription and redemption provisions, other charges, dividends and fee arrangements, including different total ongoing charges figures.
The Fund was authorised by the Central Bank of Ireland (the “Central Bank”) on 24 February 2006 as an Undertaking for Collective Investmentin Transferable Securities (UCITS) under the European Communities (Undertakings for Collective Investment in Transferable Securities)Regulations, 2019 (the “UCITS Regulations”).
Vanguard Group (Ireland) Limited (the “Manager”) acts as Manager to the Sub-Fund. The registered office of the Manager is 70 Sir JohnRogerson’s Quay, Dublin D02 HD32, Ireland.
At 31 December 2020 one Sub-Fund was in issue:
Commenced Operations
Vanguard U.S. Equity Index Common Contractual Fund 19 December 2011
The following Sub-Fund has received Central Bank approval but has not yet commenced trading:
Central Bank Approval
Vanguard North America Stock Index Fund (the “North America Stock Index Fund”) 24 February 2006
2. Basis of Preparation. These audited annual financial statements have been prepared in accordance with Financial Reporting Standard102 (“FRS 102”), the Financial Reporting Standard applicable in the UK and the Republic of Ireland, the Central Bank (Supervision andEnforcement) Act 2013 (Section 48(1)) (Undertakings for Collective Investment in Transferable Securities) Regulations 2019 (the "CBI UCITSRegulations") and the UCITS Regulations. Accounting standards generally accepted in Ireland in preparing financial statements giving a true andfair view are those published by the Institute of Chartered Accountants in Ireland and issued by the Financial Reporting Council (“FRC”).
The Sub-Fund has availed of the exemption contained in FRS 102, Section 7.1A, Cash Flow Statements, and have presented a Statement ofChanges in Equity or Statement of Changes in Net Assets to Holders of Redeemable Units, as applicable, in place of a cash flow statement. Inthe opinion of the Directors of the Manager (the “Directors”), this information also satisfies the requirement of FRS 102, Section 10.4,Reporting Financial Performance, in relation to a reconciliation of movements in Unitholders’ Equity or Net Assets.
These financial statements have been prepared on a going concern basis, subject to the historical cost convention, as modified by the revaluationof financial assets and liabilities at fair value through profit or loss (“FVTPL”).
3. Significant Accounting Policies.
(a) Critical Accounting Estimates and Judgements. The preparation of financial statements requires the use of certain critical accountingestimates. It also requires the Board of the Manager to exercise judgement when applying accounting policies. The estimates and associatedjudgements are based on historical experience and various other factors that are believed to be reasonable under the circumstances, the resultsof which form the basis of making the judgements about the classification of financial assets and liabilities, the carrying values of financialinstruments, as well as the fair value of financial instruments in instances where information is not readily apparent from other sources.
(b) Revenue Recognition. Dividends, whether cash or stock, are recognised when the securities are quoted ex-dividend. Special dividendsare treated as either capital or revenue depending on the facts of each particular case.
In the case of debt securities, any difference between acquisition cost and maturity value is recognised as revenue over the life of the securityusing the effective yield basis of calculating amortisation. Revenue from debt securities is accounted for on a basis which takes account of theamortisation of any discount or premium between the purchase price and the expected final maturity price over the remaining life of the security.
The treatment of returns from derivatives is dependent upon the nature of the transaction and considers both motives and circumstances todetermine whether returns should be treated as capital or revenue. Where positions are undertaken to protect or enhance capital, the returns areconsidered capital. Similarly, where positions are undertaken for generating or protecting revenue, the returns are considered revenue. Wherepositions generate total returns, an apportionment of any such return between capital and revenue is made to properly reflect the nature ofthe transaction.
Bank interest is recognised on an accrual basis.
Revenue is recognised gross of any withholding taxes incurred.
(c) Taxation. Current tax is recognised as the amount of income tax paid or payable in respect of the taxable overseas net profit. Deferredtaxation is provided on all timing differences that have originated but not reversed by the reporting date. Deferred tax is measured at the ratesexpected to apply for the year in which the timing differences will reverse. Deferred taxes are not discounted to reflect the time value ofmoney and are only recognised to the extent they are expected to crystallise.
Vanguard U.S. Equity Index Common Contractual Fund
Notes to the Financial Statements
12
Withholding taxes on foreign dividends and capital gains have been provided for in accordance with the Sub-Fund’s understanding of the applicablecountries’ tax rules and rates. Foreign capital gains tax is accounted for based upon net unrealised gains.
(d) Financial Assets and Financial Liabilities. FRS 102 requires a reporting entity to apply either (a) the full requirements of FRS 102 relatingto Basic Financial Instruments and Other Financial Instruments Issues; (b) the recognition and measurement provisions of InternationalAccounting Standards (“IAS”) 39, Financial Instruments: Recognition and Measurement (“IAS 39”), and only the disclosure requirements of FRS102 relating to Basic Financial Instruments and Other Financial Instruments; or (c) the recognition and measurement provisions of InternationalFinancial Reporting Standards (“IFRS”) 9, Financial Instruments, and only the disclosure requirements of FRS 102 relating to Basic FinancialInstruments and Other Financial Instruments. The Fund has elected to apply the recognition and measurement provisions of IAS 39 and thedisclosure requirements of FRS 102.
Classification and Measurement. Financial assets and financial liabilities, including derivative investments, are classified and measured at FVTPLfrom the launch date. Obligations for net assets attributable to holders of redeemable units are presented at the redemption amount, whichapproximates their fair value. All other financial assets and liabilities are measured at amortised cost, which approximates fair value.
Recognition and Derecognition. Purchases and sales of financial instruments are recognised on the trade date, being the date on which theSub-Fund commits itself to the purchase or sale. Financial instruments at FVTPL are initially recognised when the Sub-Fund become party to thecontractual provisions of the instrument. Financial instruments are derecognised when the contractual rights to the cash flows from theinstruments expire, or when substantially all the risks and rewards of ownership have been transferred. Realised gains and losses are specificallyidentified when securities are derecognised.
Equities. Equities (including warrants and rights) are valued at the latest available last traded value at year-end. Instruments traded on a recognisedmarket are valued on the basis of valuations provided by a principal market maker or a pricing service. When applicable, unlisted and suspendedinstruments are based on the assessment of Vanguard Global Advisers, LLC (“the Investment Manager”) on their net realisable value or the lasttraded price from broker-dealers for non-exchange-trade purposes.
Fixed Income. Fixed income securities traded in recognised markets are valued using the latest bid prices on the securities exchange in whichthey are principally traded or using valuations based on a matrix system (which considers such factors as security prices, yields, maturities andratings), both as furnished by independent pricing services. The Sub-Fund holds a fixed income security as at 31 December 2020, please see theStatement of Investments for further details (31 December 2019: Nil).
Derivatives. Futures contracts are valued in an active market if quoted prices are readily and regularly available; this represents the amount thatwould be required to close the position.
(e) Fair Value Measurement. The Sub-Funds classify financial instruments measured at fair value using a three-level hierarchy. Instrumentsare categorised in their entirety based on the lowest level input that is significant to the fair value measurement. Assessing the significance andobservability of a particular input requires significant judgement specific to an asset or liability. Inputs are considered to be observable whenthey are readily available, regularly distributed or updated, reliable and verifiable, not proprietary, and provided by independent sources that areactively involved in the relevant market.
Level 1 – Quoted prices in active markets for identical securities.
Level 2 – Other significant observable inputs (including quoted prices for similar securities, interest rates, prepayment speeds, credit risk, etc.).
Level 3 – Significant unobservable inputs (including the fund’s own assumptions used to determine the fair value of investments).
(f) Transaction Costs. Transaction costs are incremental costs that are directly attributable to the acquisition, issue or disposal of an investment.These costs include fees and commissions paid to agents, advisors, brokers and dealers. Transaction costs incurred in the purchase and sale ofsecurities designated at FVTPL are expensed on an accrual basis.
(g) Foreign Currency. All transactions in foreign currencies are translated into the Sub-Fund’s functional currency, the US dollar ($), at theexchange rates prevailing on the date of the transaction. At the reporting date, monetary assets and liabilities denominated in foreign currenciesare translated at the prevailing exchange rates. Gains and losses arising on translation are included in total return and are reported on a net basis.
(h) Cash and Bank Overdrafts. Cash is composed of demand deposits with financial institutions or bank overdrafts. Bank overdrafts, whenapplicable, are presented as current liabilities. Cash held or pledged as collateral against financial transactions or derivative instruments is notincluded within Cash and Bank Overdrafts but is segregated and presented separately on the Statement of Assets and Liabilities as CashCollateral.
In respect to unit issuances or redemptions, the Fund operates an umbrella cash account. Monies received or proceeds due will be held andtransmitted through this account and are included in Cash and Bank Overdrafts.
Margin. Upon entering into futures contracts, cash deposits are required (initial margin) in an amount equal to a certain percentage of the contractvalue. Subsequent payments (variation margin) are made or received by the Sub-Funds each day. Margin against these derivative instrumentsis not included within Cash or Bank Overdrafts but is segregated and presented separately as Futures Margin Cash or Futures Margin Cash Dueto Broker, as applicable.
Vanguard U.S. Equity Index Common Contractual Fund
13
(i) Redeemable Participating Units. Redeemable participating units provide Unitholders with the right to redeem their units for cash.
(j) Trade Date Reporting. Investment transactions for financial statement purposes as at 31 December 2020 are accounted for on the tradedate. This is different from the basis used for the daily dealing net asset value, which is accounted for using the trade date plus one businessday.
(k) Offsetting. Financial assets and liabilities are offset and the net amount reported when there is both a legally enforceable right to set offthe recognised amounts and an intention to settle on a net basis, or realise the assets and settle the liability simultaneously. As at 31 December2020, there were no financial assets or liabilities offset (31 December 2019: None).
(l) Swing Pricing. The Sub-Fund employs swing pricing as a means to prevent dilution. Swing pricing results from the Fund’s determination toadjust the Sub-Fund’s net asset value, on any dealing day, following a consideration of dealing activity (i.e. level of subscriptions and redemptions)and the level of costs associated with such activity. A dilution adjustment is exercised only for the purpose of reducing the negative effects oftransaction charges in the interest of the non-dealing unit holders in the Sub-Fund and is applied consistently in respect of the Sub-Fund, and inrespect of all assets of the Sub-Fund. The direction of the swing depends on whether there are net subscriptions or net redemptions in theSub-Fund on the relevant dealing day, while the magnitude of the swing is based on pre-determined estimates of the average execution costsin the relevant asset classes in which the Sub-Fund is invested.
The dilution adjustment did not exceed 2% of the original net asset value per unit of the Sub-Fund during the year (31 December 2019: 2%).
4. Financial Risk Management.
Risk Management Policies.
Price Risk. Price risk is the risk that the value of financial instruments will fluctuate because of changes in the market. The Investment Managerconsiders the asset allocation of the portfolio in order to minimise the risk associated with particular countries or industry sectors whilecontinuing to follow the stated investment objective.
The investment objective for an index Sub-Fund is to seek to track as closely as reasonably possible the performance of the benchmark index.In order to achieve this objective, an index Sub-Fund invests primarily in securities held in the relevant benchmark index. An index Sub-Fundplaces limitations on the amount by which a holding may deviate from the proportion in the benchmark to limit the market risk from mismatchedpositions.
All investments present a risk of loss of capital.The Investment Manager assesses market risk volatility to ensure that the effect of using financialderivative instruments is not significant enough to cause disproportionate losses to overall value. The Investment Manager moderates this riskthrough careful selection of financial instruments.
Currency Risk. Currency risk is the risk that the value of the Sub-Fund’s investments will fluctuate as a result of changes in currency exchangerates. Local interest rates and monetary policy, as well as other government fiscal and labour policies, can also adversely impact currencyvalues. The Sub-Fund may enter into foreign currency contracts for hedging purposes, which can include the economic hedging of all or a portionof the currency exposure of an investment or group of investments. The Sub-Fund may also enter into these contracts for non-hedgingpurposes, which can include increasing the exposure to a foreign currency, or the shifting of exposure to foreign currency fluctuations from onecountry to another.
Interest Rate Risk. Revenue on fixed income securities may be affected by changes in interest rates relevant to particular securities or as a resultof the Investment Manager’s being unable to secure similar returns on the expiry of contracts or sale of securities. The value of fixed ratesecurities may be affected by interest rate movements or the expectation of such movements in the future. Interest receivable on bank depositsor payable on bank overdraft positions will also be affected by fluctuations in interest rates. Interest rate risk is not significant to the Sub-Fund.
Management of Market Risk (Including Price, Currency and Interest Rate Risks). The Investment Manager performs daily reviews of portfolioattributes, such as sector diversification, maturity, and credit quality, and makes adjustments where necessary to ensure that the riskcomponents of the Sub-Fund closely match those of the benchmark. In addition, the Investment Manager and State Street Fund Services (Ireland)Limited (the “Administrator”) perform daily checks of Sub-Fund performance against the benchmark. Potential tracking errors are raised anddiscussed by the Investment Manager and the Administrator for investigation and resolution. Market impact, currency discrepancies and interestrate exposure are investigated as possible causes.
Currency positions in a Sub-Fund’s account are reconciled daily and discrepancies are immediately resolved. Procedures are established withthe Investment Manager to trade currency as closely as possible to the close of the markets, so as to obtain exchange rates that closelyapproximate the rates used in the valuation of the Sub-Fund.
Market disruptions associated with the COVID-19 pandemic have had a global impact, and uncertainty exists as to the long-term implications.Such disruptions can adversely affect assets of the Sub-Fund and thus performance of the Sub-Fund.
Market Risk Sensitivity Analysis. Market risk exposures to the Sub-Funds are measured using value at risk (“VaR”), which estimates themaximum expected loss over a defined period given a specified confidence level.The VaR methodology is a statistically defined, probability basedapproach that takes into account estimates for market volatilities and correlations between assets in the portfolio. Risks can be measuredconsistently across markets and products, and risk measures can be aggregated to arrive at a single risk number. For the purpose of this annual
Vanguard U.S. Equity Index Common Contractual Fund
14
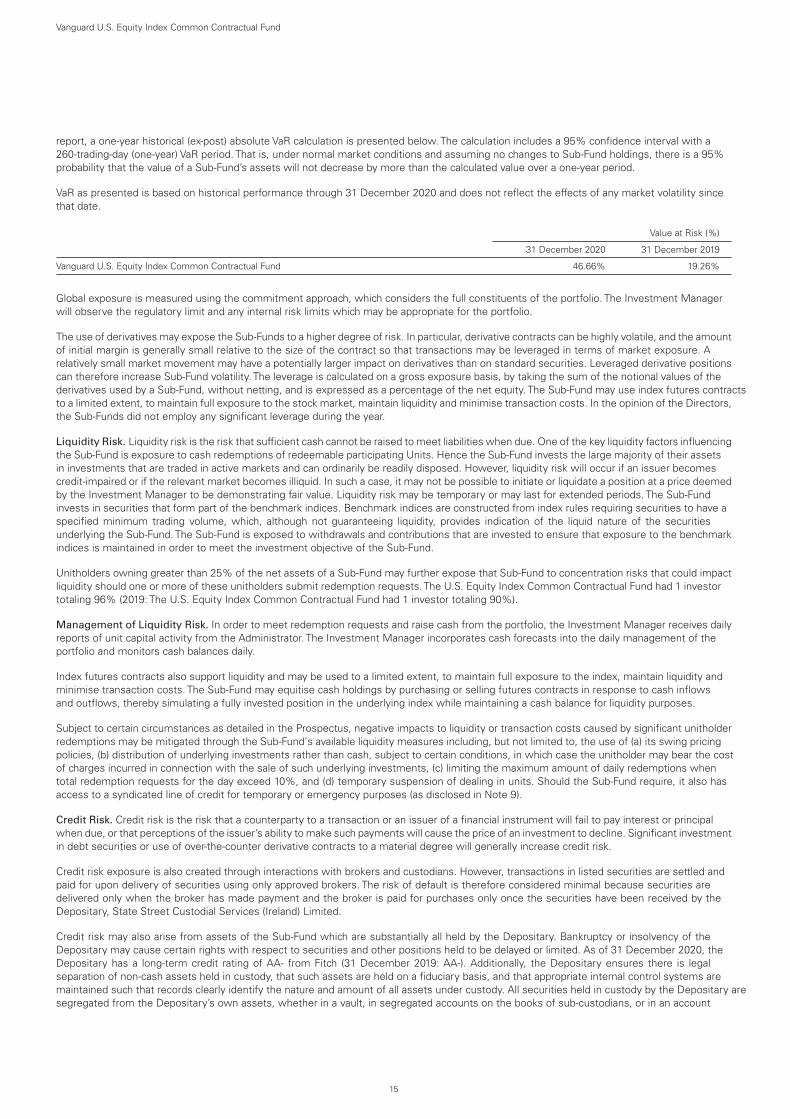
report, a one-year historical (ex-post) absolute VaR calculation is presented below. The calculation includes a 95% confidence interval with a260-trading-day (one-year) VaR period. That is, under normal market conditions and assuming no changes to Sub-Fund holdings, there is a 95%probability that the value of a Sub-Fund’s assets will not decrease by more than the calculated value over a one-year period.
VaR as presented is based on historical performance through 31 December 2020 and does not reflect the effects of any market volatility sincethat date.
Value at Risk (%)
31 December 2020 31 December 2019
Vanguard U.S. Equity Index Common Contractual Fund 46.66% 19.26%
Global exposure is measured using the commitment approach, which considers the full constituents of the portfolio. The Investment Managerwill observe the regulatory limit and any internal risk limits which may be appropriate for the portfolio.
The use of derivatives may expose the Sub-Funds to a higher degree of risk. In particular, derivative contracts can be highly volatile, and the amountof initial margin is generally small relative to the size of the contract so that transactions may be leveraged in terms of market exposure. Arelatively small market movement may have a potentially larger impact on derivatives than on standard securities. Leveraged derivative positionscan therefore increase Sub-Fund volatility. The leverage is calculated on a gross exposure basis, by taking the sum of the notional values of thederivatives used by a Sub-Fund, without netting, and is expressed as a percentage of the net equity. The Sub-Fund may use index futures contractsto a limited extent, to maintain full exposure to the stock market, maintain liquidity and minimise transaction costs. In the opinion of the Directors,the Sub-Funds did not employ any significant leverage during the year.
Liquidity Risk. Liquidity risk is the risk that sufficient cash cannot be raised to meet liabilities when due. One of the key liquidity factors influencingthe Sub-Fund is exposure to cash redemptions of redeemable participating Units. Hence the Sub-Fund invests the large majority of their assetsin investments that are traded in active markets and can ordinarily be readily disposed. However, liquidity risk will occur if an issuer becomescredit-impaired or if the relevant market becomes illiquid. In such a case, it may not be possible to initiate or liquidate a position at a price deemedby the Investment Manager to be demonstrating fair value. Liquidity risk may be temporary or may last for extended periods. The Sub-Fundinvests in securities that form part of the benchmark indices. Benchmark indices are constructed from index rules requiring securities to have aspecified minimum trading volume, which, although not guaranteeing liquidity, provides indication of the liquid nature of the securitiesunderlying the Sub-Fund. The Sub-Fund is exposed to withdrawals and contributions that are invested to ensure that exposure to the benchmarkindices is maintained in order to meet the investment objective of the Sub-Fund.
Unitholders owning greater than 25% of the net assets of a Sub-Fund may further expose that Sub-Fund to concentration risks that could impactliquidity should one or more of these unitholders submit redemption requests.The U.S. Equity Index Common Contractual Fund had 1 investortotaling 96% (2019: The U.S. Equity Index Common Contractual Fund had 1 investor totaling 90%).
Management of Liquidity Risk. In order to meet redemption requests and raise cash from the portfolio, the Investment Manager receives dailyreports of unit capital activity from the Administrator. The Investment Manager incorporates cash forecasts into the daily management of theportfolio and monitors cash balances daily.
Index futures contracts also support liquidity and may be used to a limited extent, to maintain full exposure to the index, maintain liquidity andminimise transaction costs. The Sub-Fund may equitise cash holdings by purchasing or selling futures contracts in response to cash inflowsand outflows, thereby simulating a fully invested position in the underlying index while maintaining a cash balance for liquidity purposes.
Subject to certain circumstances as detailed in the Prospectus, negative impacts to liquidity or transaction costs caused by significant unitholderredemptions may be mitigated through the Sub-Fund's available liquidity measures including, but not limited to, the use of (a) its swing pricingpolicies, (b) distribution of underlying investments rather than cash, subject to certain conditions, in which case the unitholder may bear the costof charges incurred in connection with the sale of such underlying investments, (c) limiting the maximum amount of daily redemptions whentotal redemption requests for the day exceed 10%, and (d) temporary suspension of dealing in units. Should the Sub-Fund require, it also hasaccess to a syndicated line of credit for temporary or emergency purposes (as disclosed in Note 9).
Credit Risk. Credit risk is the risk that a counterparty to a transaction or an issuer of a financial instrument will fail to pay interest or principalwhen due, or that perceptions of the issuer’s ability to make such payments will cause the price of an investment to decline. Significant investmentin debt securities or use of over-the-counter derivative contracts to a material degree will generally increase credit risk.
Credit risk exposure is also created through interactions with brokers and custodians. However, transactions in listed securities are settled andpaid for upon delivery of securities using only approved brokers. The risk of default is therefore considered minimal because securities aredelivered only when the broker has made payment and the broker is paid for purchases only once the securities have been received by theDepositary, State Street Custodial Services (Ireland) Limited.
Credit risk may also arise from assets of the Sub-Fund which are substantially all held by the Depositary. Bankruptcy or insolvency of theDepositary may cause certain rights with respect to securities and other positions held to be delayed or limited. As of 31 December 2020, theDepositary has a long-term credit rating of AA- from Fitch (31 December 2019: AA-). Additionally, the Depositary ensures there is legalseparation of non-cash assets held in custody, that such assets are held on a fiduciary basis, and that appropriate internal control systems aremaintained such that records clearly identify the nature and amount of all assets under custody. All securities held in custody by the Depositary aresegregated from the Depositary’s own assets, whether in a vault, in segregated accounts on the books of sub-custodians, or in an account
Vanguard U.S. Equity Index Common Contractual Fund
15
maintained at a central securities depositary. The Depositary maintains segregated accounts per client on its own books as well as on the booksof sub-custodians in local markets, where possible.
Management of Credit Risk. Credit risk is managed by investment policies which restrict or place limits on acceptable portfolio and net assetconcentrations as well as exposure to certain instruments, credit institutions and counterparties. The Investment Manager performs dailyreviews of portfolio attributes, such as sector diversification and credit quality, and makes adjustments where necessary to ensure that the creditrisk components closely match those of the respective benchmarks. Credit ratings of debt instruments and counterparties are monitored andevaluated periodically by the Investment Manager; an approved counterparty list is maintained, and trading with approved counterparties isenforced.
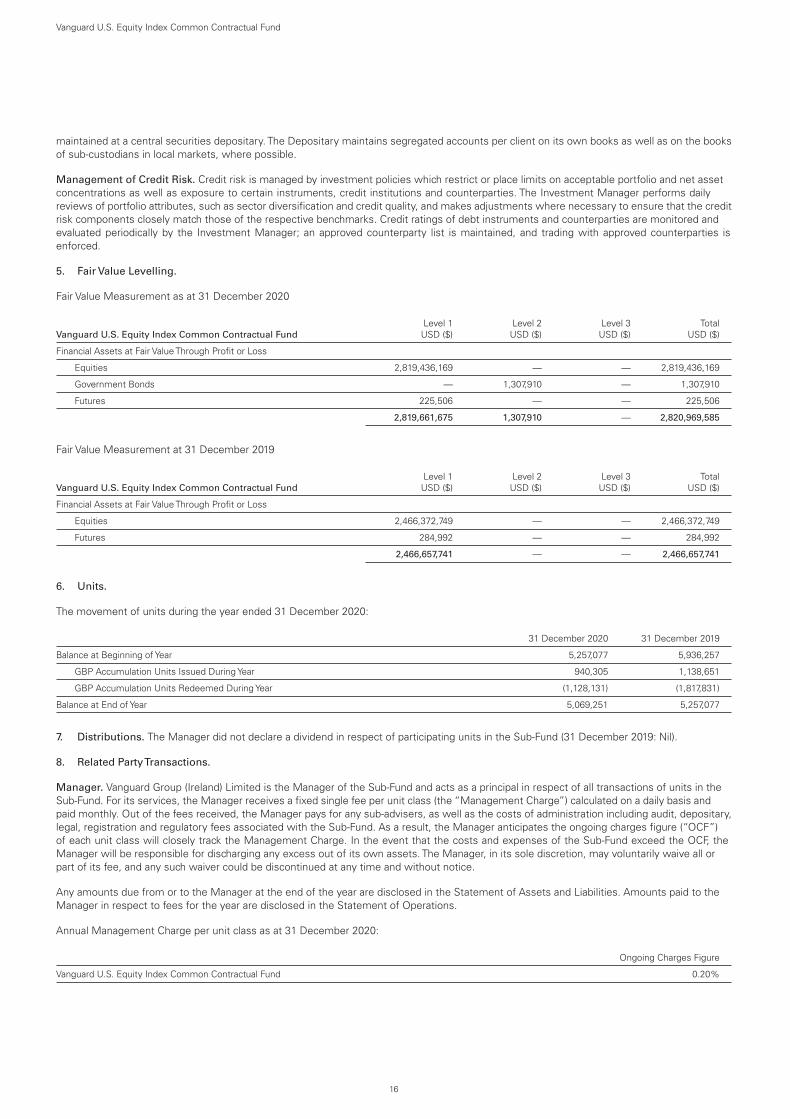
5. Fair Value Levelling.
Fair Value Measurement as at 31 December 2020
Vanguard U.S. Equity Index Common Contractual Fund
Level 1USD ($)
Level 2USD ($)
Level 3USD ($)
TotalUSD ($)
Financial Assets at Fair Value Through Profit or Loss
Equities 2,819,436,169 — — 2,819,436,169
Government Bonds — 1,307,910 — 1,307,910
Futures 225,506 — — 225,506
2,819,661,675 1,307,910 — 2,820,969,585
Fair Value Measurement at 31 December 2019
Vanguard U.S. Equity Index Common Contractual Fund
Level 1USD ($)
Level 2USD ($)
Level 3USD ($)
TotalUSD ($)
Financial Assets at Fair Value Through Profit or Loss
Equities 2,466,372,749 — — 2,466,372,749
Futures 284,992 — — 284,992
2,466,657,741 — — 2,466,657,741
6. Units.
The movement of units during the year ended 31 December 2020:
31 December 2020 31 December 2019
Balance at Beginning of Year 5,257,077 5,936,257
GBP Accumulation Units Issued During Year 940,305 1,138,651
GBP Accumulation Units Redeemed During Year (1,128,131) (1,817,831)
Balance at End of Year 5,069,251 5,257,077
7. Distributions. The Manager did not declare a dividend in respect of participating units in the Sub-Fund (31 December 2019: Nil).
8. Related PartyTransactions.
Manager. Vanguard Group (Ireland) Limited is the Manager of the Sub-Fund and acts as a principal in respect of all transactions of units in theSub-Fund. For its services, the Manager receives a fixed single fee per unit class (the “Management Charge”) calculated on a daily basis andpaid monthly. Out of the fees received, the Manager pays for any sub-advisers, as well as the costs of administration including audit, depositary,legal, registration and regulatory fees associated with the Sub-Fund. As a result, the Manager anticipates the ongoing charges figure (“OCF”)of each unit class will closely track the Management Charge. In the event that the costs and expenses of the Sub-Fund exceed the OCF, theManager will be responsible for discharging any excess out of its own assets. The Manager, in its sole discretion, may voluntarily waive all orpart of its fee, and any such waiver could be discontinued at any time and without notice.
Any amounts due from or to the Manager at the end of the year are disclosed in the Statement of Assets and Liabilities. Amounts paid to theManager in respect to fees for the year are disclosed in the Statement of Operations.
Annual Management Charge per unit class as at 31 December 2020:
Ongoing Charges Figure
Vanguard U.S. Equity Index Common Contractual Fund 0.20%
Vanguard U.S. Equity Index Common Contractual Fund
16
Annual Management Charge per unit class as at 31 December 2019:
Ongoing Charges Figure
Vanguard U.S. Equity Index Common Contractual Fund 0.20%
Directors’ Fees. The aggregate emolument of the Directors paid by the Manager out of the Management Charge on behalf of the Sub-Fundand other funds managed by the Manager (including expenses) for the year ended 31 December 2020 was $350,020 (31 December 2019:$309,686), with $0 outstanding at 31 December 2020 (31 December 2019: $0).
The Fund had eight Directors as at 31 December 2020, three of whom were independent. The interests of the Directors in related parties areas follows:
Mr James M. Norris was a Managing Director of Vanguard International, a division within The Vanguard Group, Inc. as he resigned as a Directorwith effect from 31 December 2020; Mr Sean P. Hagerty is Managing Director of Vanguard Asset Management, Limited; and Mr Michael Millerretired as a Managing Director ofThe Vanguard Group, Inc., in 2015. Mr Richard Wane is Managing Director, Ireland; Ms Robyn Laidlaw is Head ofDistribution, Europe; Ms Tara Doyle is a partner in the legal advisory firm acting as the Manager's Secretary and serving the activities of theManager.
Subsequent to year end Richard Wane resigned as a Director with effect from 31 March 2021 and Ann Stock was appointed as a Director witheffect from 1 April 2021.
Investment Manager. Vanguard Global Advisers, LLC, is the Investment Manager of the Fund and is compensated by the Manager. TheInvestment Manager or the Manager, at their discretion, may appoint other companies from within the Vanguard Group of Companies to provideinvestment management and advisory services with respect to the Sub-Fund.
Inter-FundTrading. There were no inter-fund trades between the Sub-Fund and certain other funds also managed by the Investment Managerduring the year ended 31 December 2020 (31 December 2019: None). There were no amounts outstanding between these parties at31 December 2020 (31 December 2019: None).
9. Credit Facility. The Sub-Fund and certain other funds managed by the Manager or its affiliates participates in an annually renewableUS$4.3 billion (2019: US$4.3 billion) committed credit facility. Each participating fund is individually liable for its borrowings under the credit facility.Borrowings may be utilised for temporary or emergency purposes, and are subject to the Sub-Fund’s regulatory and contractual borrowingrestrictions. Participating funds are allocated an annual commitment fee of 0.10% of the undrawn amount of the facility as well as certainadministrative fees. Any fees allocated to the Sub-Fund are paid by the Manager. Interest and direct borrowing costs associated with draws on thecredit facility borrowing are charged to the Sub-Fund and recorded in the Statement of Operations.
The Sub-Fund did not have any borrowings outstanding at 31 December 2020 or at any time during the year then ended (31 December 2019: Nil).
10. Taxation. The Sub-Fund does have a separate legal personality and is transparent for tax purposes. The Sub-Fund is a common contractualfund (“CCF”) within the meaning of Section 739(1) of the Taxes Consolidation Act, 1997 (“TCA”), in which the unitholders by contractualarrangement participate and share in the property of the Sub-Fund as co-owners. Therefore, the Sub-Fund is not chargeable to Irish tax on itsrelevant income or relevant gains (“relevant profits”). Instead, the relevant profits of the Sub-Fund are treated as arising or, as the case maybe, accruing to each unitholder of the Sub-Fund in proportion to the value of the units beneficially owned by the unitholder, as if the relevant profitshad arisen, or as the case may be, accrued to the unitholders in the CCF without passing through the hands of the CCF. This tax treatment issubject to each of the units of the Sub-Fund being:
(a) a pension fund; or(b) beneficially owned by a person (other than an individual); or(c) a custodian or trustee holding units of the Fund or of a Sub-Fund for the benefit of such person(s) as referred to in (a) or (b).
No stamp duty, documentary, transfer or registration tax is payable by the Sub-Fund on the issue, transfer, redemption, repurchase or cancellationof or subscription for units in the Sub-Fund. Where any subscription for or redemption of units is satisfied by in-specie transfer of any Irish situatesecurities, property or other types of assets, Irish stamp duty may arise on the transfer of such assets.
11. Efficient Portfolio Management. The Sub-Fund may employ investment techniques and use financial derivative instruments (such as futurescontracts, forward foreign currency contracts, options and swaps) for efficient portfolio management purposes including hedging against marketprice movements, and foreign currency, interest rate and liquidity risks. Any such technique or instrument must be one which (alone or incombination with one or more other techniques or instruments) is believed by the Investment Manager to be economically appropriate to theefficient portfolio management of the Sub-Fund; i.e. the use of a technique or instrument may only be undertaken for the purposes of one or moreof the following:
(a) a reduction in risk,(b) a reduction in costs,(c) an increase in capital or income returns to the Sub-Fund.
Futures contracts at the year end are disclosed on each Sub-Fund’s Statement of Investments. Realised and unrealised gains or losses arisingfrom financial derivative transactions are accounted for through the Statement of Operations as Net Gain/(Loss) on Financial Instruments.
Vanguard U.S. Equity Index Common Contractual Fund
17
12. Collateral.
Cash Collateral. Cash collateral pledged or held is disclosed on the Statement of Assets and Liabilities and is valued at its fair value.A corresponding liability to repay cash collateral received (if any) is recorded as a liability on the Statement of Assets and Liabilities and is alsovalued at its fair value.
The counterparty for Cash Collateral is Morgan Stanley (31 December 2019: Morgan Stanley).
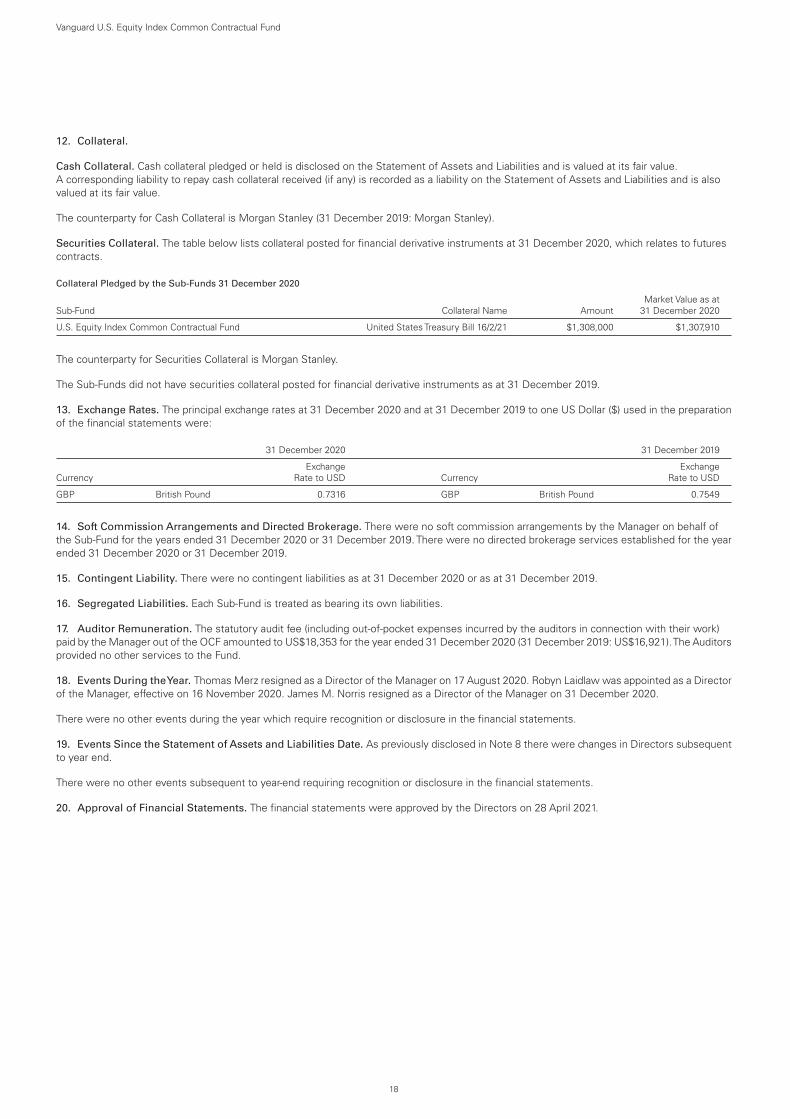
Securities Collateral. The table below lists collateral posted for financial derivative instruments at 31 December 2020, which relates to futurescontracts.
Collateral Pledged by the Sub-Funds 31 December 2020
Sub-Fund Collateral Name AmountMarket Value as at
31 December 2020
U.S. Equity Index Common Contractual Fund United States Treasury Bill 16/2/21 $1,308,000 $1,307,910
The counterparty for Securities Collateral is Morgan Stanley.
The Sub-Funds did not have securities collateral posted for financial derivative instruments as at 31 December 2019.
13. Exchange Rates. The principal exchange rates at 31 December 2020 and at 31 December 2019 to one US Dollar ($) used in the preparationof the financial statements were:
31 December 2020 31 December 2019
CurrencyExchange
Rate to USD CurrencyExchange
Rate to USD
GBP British Pound 0.7316 GBP British Pound 0.7549
14. Soft Commission Arrangements and Directed Brokerage. There were no soft commission arrangements by the Manager on behalf ofthe Sub-Fund for the years ended 31 December 2020 or 31 December 2019. There were no directed brokerage services established for the yearended 31 December 2020 or 31 December 2019.
15. Contingent Liability. There were no contingent liabilities as at 31 December 2020 or as at 31 December 2019.
16. Segregated Liabilities. Each Sub-Fund is treated as bearing its own liabilities.
17. Auditor Remuneration. The statutory audit fee (including out-of-pocket expenses incurred by the auditors in connection with their work)paid by the Manager out of the OCF amounted to US$18,353 for the year ended 31 December 2020 (31 December 2019: US$16,921).The Auditorsprovided no other services to the Fund.
18. Events During theYear. Thomas Merz resigned as a Director of the Manager on 17 August 2020. Robyn Laidlaw was appointed as a Directorof the Manager, effective on 16 November 2020. James M. Norris resigned as a Director of the Manager on 31 December 2020.
There were no other events during the year which require recognition or disclosure in the financial statements.
19. Events Since the Statement of Assets and Liabilities Date. As previously disclosed in Note 8 there were changes in Directors subsequentto year end.
There were no other events subsequent to year-end requiring recognition or disclosure in the financial statements.
20. Approval of Financial Statements. The financial statements were approved by the Directors on 28 April 2021.
Vanguard U.S. Equity Index Common Contractual Fund
18
The Manager is responsible for preparing the annual report andfinancial statements of Vanguard Common Contractual Fund (the"Fund") in accordance with applicable law and regulations.
Irish law requires the Manager of the Fund to prepare financialstatements for each financial year. The Manager has elected toprepare the financial statements in accordance with FRS 102, theFinancial Reporting Standard applicable in the Republic of Ireland,comprising applicable law and the accounting standards issued bythe Financial Reporting Council and published by the Institute ofChartered Accountants in Ireland.
The financial statements are required to give a true and fair view ofthe state of affairs of the Fund and of the profit or loss for thatperiod.
In preparing those financial statements, the Manager:
• selects suitable accounting policies and then applies themconsistently;
• makes judgements and estimates that are reasonable andprudent;
• states whether applicable accounting standards have beenfollowed, subject to any material departures disclosed andexplained in the financial statements; and
• prepares the financial statements on the going concern basisunless it is inappropriate to presume that the Fund will continuein business.
The Manager is responsible for keeping proper books of accountwhich disclose with reasonable accuracy at any time the financialposition of the Fund and enable it to ensure that the financialstatements are prepared in accordance with the Deed ofConstitution, the Investment Funds, Companies and MiscellaneousProvisions Act 2005, the European Union Regulations 2013 and theCommission Delegated (EU) No. 231/2013. It has generalresponsibility for taking such steps as are reasonably open to it toprevent and detect fraud and other irregularities.
The Manager is responsible for the maintenance and integrity of thecorporate and financial information included on the Funds website.
On behalf of the Board of Directors of the Manager,
Sean P. HagertyPeter BlessingVanguard Group (Ireland) Limited70 Sir John Rogerson’s QuayDublin 2Ireland
28 April 2021
Statement of Manager’s Responsibilities
19

Remuneration Disclosure
Vanguard personnel providing services to the Manager aresubject to the Vanguard European Remuneration Policy (the“Remuneration Policy”). The Remuneration Policy includesthe remuneration requirements of the UCITS V Directive(2014/91/EU). Details of the Remuneration Policy areavailable throughhttps://www.vanguard.co.uk/uk/portal/investment-information.jsp, which will be updated periodically to reflectchanges to the policy.
The governance of remuneration within Vanguard Europe isundertaken through a tiered structure, including Vanguard’sGlobal Remuneration Committee and the EuropeanLeadership Team. The Global Remuneration Committee alsooperates at The Vanguard Group level and oversees theoverall compensation programmes of The Vanguard Group.The European Leadership Team is responsible forimplementing the remuneration programmes in accordancewith Vanguard’s total rewards philosophy and globalorganisation, including overseeing the Remuneration Policy.
The Remuneration Policy provides for an appropriate balanceof fixed salary; benefits, such as pension; and annual bonusand long-term incentive arrangements. Incentives are basedon the overall business performance of The Vanguard Group,or individual, team, business unit and fund performance. Theincentive plans are reviewed and approved by the EuropeanLeadership Team (and other applicable groups) in order toensure that plans appropriately assess financial and non-financial performance and do not encourage conflicts ofinterest, and to ensure that risk or compliance issues areappropriately reflected.
The European Leadership Team also reviews and approvesthe list of UCITS code staff annually. Identified code staff arenotified and understand the code staff responsibilities.
Under the UCITS V Directive, the Manager is required todisclose information relating to the remuneration paid to itsstaff for the financial year, split into fixed and variableremuneration. The table below presents the aggregate totalremuneration paid to staff who provide services to the Sub-Fund and other funds managed by the Manager and theaggregate total remuneration paid to all relevant UCITS codestaff.
Headcount1, 2
TotalRemuneration
(£000)3
Funds, of which 49 9,741
Fixed Remuneration 49 6,758
Variable Remuneration 49 2,983
Performance Fees n/a n/a
Code Staff 5 1,879
Fixed Remuneration 5 1,124
Variable Remuneration 5 755
Performance Fees n/a n/a
1 This is the total number of employees who are employed through VGIL.2 The staff in this table provide services to the Irish Funds.3 The remuneration disclosed is the total remuneration earned for the 2020 Irish Funds fiscal
year.
Connected Persons Transactions
Transactions carried out with the Fund by the InvestmentManager, Manager, Depositary, Investment Adviser and/orassociated or group companies of these (“ConnectedPersons”) during the year ended 31 December 2020 werecarried out as if negotiated at arm’s length and were in thebest interests of the Fund’s Unitholders. The Directors of theFund are satisfied that there are arrangements (evidenced bywritten procedures) in place to ensure that all transactionsentered into by the Fund with Connected Persons are carriedout as if negotiated at arm’s length and in the best interestsof the Fund’s Unitholders.
Potential Implications of Brexit
The United Kingdom is no longer a member state of theEuropean Union. Despite the negotiation of the UK-EU Tradeand Cooperation Agreement in December 2020, the futureeconomic and political relationship between the UnitedKingdom and the European Union (and between the UnitedKingdom and other countries) remains uncertain and subjectto further negotiation in many respects, and a period ofeconomic and political uncertainty may therefore continue inthe United Kingdom and the European Union.
Political and economic uncertainty may lead to speculationand subsequent market volatility, particularly for assetsdenominated in British pounds. Vanguard continues toencourage investors to follow its core investing principles,including maintaining long-term discipline. The implicationsof Brexit extend beyond the UK economy and financialmarkets, affecting multinational organisations globally. Therelevant regulatory authorities in the United Kingdom may inthe future make changes to their rules which deviate fromthe standards applicable in the European Union. This couldresult in changes being made to the rules applicable in theEuropean Union.
The nature and extent of the impact of these factors on theFund are uncertain, but may be adverse. Vanguard remainscommitted to safeguarding our investors' assets and theirlong-term interests and has devoted significant resources todeveloping plans to manage the impact of Brexit.
Coronavirus (COVID-19)
Market disruptions associated with the COVID-19 pandemichave had a global impact, and uncertainty exists as to thelong-term implications. Such disruptions can adversely affectassets of the Fund and thus performance of the Fund.Vanguard continues to encourage investors to follow its coreinvestment principles, including maintaining long-termdiscipline. Vanguard is committed to safeguarding the assetsof investors and their long-term interests.
Additional Information From the Manager (unaudited)
20
We have enquired into the conduct of the Manager in respect of
Vanguard Common Contractual Fund (the "Fund") for the year ended
31 December 2020, in our capacity as Depositary to the Fund.
This report including the opinion has been prepared for and solely
for the unitholders in the Fund, in accordance with Regulation 34,
(1), (3) and (4) in Part 5 of the European Communities (Undertakings
for Collective Investment in Transferable Securities) Regulations
2011, as amended, ("the UCITS Regulations"), and for no other
purpose.We do not, in giving this opinion, accept or assume
responsibility for any other purpose or to any other person to whom
this report is shown.
Responsibilities of the Depositary
Our duties and responsibilities are outlined in Regulation 34, (1),
(3) and (4) in Part 5 of the UCITS Regulations. One of those duties is
to enquire into the conduct of the Manager in each annual
accounting period and report thereon to the unitholders.
Our report shall state whether, in our opinion, the Fund has been
managed in that period in accordance with the provisions of the
Fund's Deed of Constitution and the UCITS Regulations. It is the
overall responsibility of the Manager to comply with these
provisions. If the Manager has not so complied, we as Depositary
must state why this is the case and outline the steps which we
have taken to rectify the situation.
Basis of Depositary’s Opinion
The Depositary conducts such reviews as it, in its reasonable
opinion, considers necessary in order to comply with its duties as
outlined in Regulation 34, (1), (3) and (4) in Part 5 of the UCITS
Regulations and to ensure that, in all material respects, the Sub-
Fund has been managed (i) in accordance with the limitations
imposed on its investment and borrowing powers by the provisions
of the Deed of Constitution and the appropriate regulations and
(ii) otherwise in accordance with the Sub-Fund’s constitutional
documentation and the appropriate regulations.
Opinion
In our opinion, the Fund has been managed during the year, in all
material respects:
(i) in accordance with the limitations imposed on the investment
and borrowing powers of the Manager and the Depositary by
the Deed of Constitution, the UCITS Regulations and the Central
Bank (Supervision and Enforcement) Act 2013 (Section 480))
(Undertakings for Collective Investment in Transferable
Securities) Regulations 2015 ('the Central Bank UCITS
Regulations'); and
(ii) otherwise in accordance with the provisions of the Deed of
Constitution, the UCITS Regulations and the Central Bank UCITS
Regulations.
State Street Custodial Services (Ireland) Limited
78 Sir John Rogerson's Quay
Dublin D02 HD32
Ireland
28 April 2021
Report of the Depositary to the Unitholders
21
Report on the audit of the financialstatements
Opinion
In our opinion, Vanguard Common Contractual Fund’s financialstatements:
• give a true and fair view of the Common Contractual Fund’sassets, liabilities and financial position as at 31 December2020 and of its results for the year then ended;
• have been properly prepared in accordance with GenerallyAccepted Accounting Practice in Ireland (accounting standardsissued by the Financial Reporting Council of the UK, includingFinancial Reporting Standard 102 “The Financial ReportingStandard applicable in the UK and Republic of Ireland” and Irishlaw); and
• have been properly prepared in accordance with the requirementsof the European Communities (Undertakings for CollectiveInvestment in Transferable Securities) Regulations 2011 (asamended).
We have audited the financial statements, included within theAnnual Report, which comprise:
• the Statement of Assets and Liabilities as at 31 December 2020;
• the Statement of Operations for the year then ended;
• the Statement of Changes in Equity for the year then ended;
• the Statement of Investments as at 31 December 2020; and
• the notes to the financial statements, which include a descriptionof the significant accounting policies.
Basis for opinion
We conducted our audit in accordance with International Standardson Auditing (Ireland) (“ISAs (Ireland)”) and applicable law.
Our responsibilities under ISAs (Ireland) are further described in theAuditors’ responsibilities for the audit of the financial statementssection of our report. We believe that the audit evidence we haveobtained is sufficient and appropriate to provide a basis for ouropinion.
Independence
We remained independent of the Common Contractual Fund inaccordance with the ethical requirements that are relevant to ouraudit of the financial statements in Ireland, which includes IAASA’sEthical Standard, and we have fulfilled our other ethicalresponsibilities in accordance with these requirements.
Conclusions relating to going concern
Based on the work we have performed, we have not identified anymaterial uncertainties relating to events or conditions that,individually or collectively, may cast significant doubt on theCommon Contractual Fund’s ability to continue as a going concernfor a period of at least twelve months from the date on which thefinancial statements are authorised for issue.
In auditing the financial statements, we have concluded that themanager’s use of the going concern basis of accounting in thepreparation of the financial statements is appropriate.
However, because not all future events or conditions can bepredicted, this conclusion is not a guarantee as to the CommonContractual Fund’s ability to continue as a going concern.
Our responsibilities and the responsibilities of the manager withrespect to going concern are described in the relevant sections ofthis report.
Reporting on other informationThe other information comprises all of the information in the AnnualReport other than the financial statements and our auditors’ reportthereon. The manager is responsible for the other information. Ouropinion on the financial statements does not cover the otherinformation and, accordingly, we do not express an audit opinion or,except to the extent otherwise explicitly stated in this report, anyform of assurance thereon. In connection with our audit of thefinancial statements, our responsibility is to read the otherinformation and, in doing so, consider whether the other informationis materially inconsistent with the financial statements or ourknowledge obtained in the audit, or otherwise appears to bematerially misstated. If we identify an apparent materialinconsistency or material misstatement, we are required to performprocedures to conclude whether there is a material misstatement ofthe financial statements or a material misstatement of the otherinformation. If, based on the work we have performed, we concludethat there is a material misstatement of this other information, weare required to report that fact. We have nothing to report based onthese responsibilities.
Responsibilities for the financialstatements and the audit
Responsibilities of the manager for the financial
statements
As explained more fully in the Statement of Manager’sResponsibilities set out on page 19, the manager is responsible forthe preparation of the financial statements in accordance with theapplicable framework giving a true and fair view.
The manager is also responsible for such internal control as themanager determines is necessary to enable the preparation offinancial statements that are free from material misstatement,whether due to fraud or error.
In preparing the financial statements, the manager is responsible forassessing the Common Contractual Fund’s ability to continue as agoing concern, disclosing as applicable, matters related to goingconcern and using the going concern basis of accounting unless themanager intends to cease operations, or has no realistic alternativebut to do so.
Independent Auditors' Report to the Unitholdersof Vanguard Common Contractual Fund
22
Independent Auditors Report to the Unitholders of Vanguard Common Contractual Fund
Auditors’ responsibilities for the audit of the financial statements
Our objectives are to obtain reasonable assurance about whetherthe financial statements as a whole are free from materialmisstatement, whether due to fraud or error, and to issue anauditors’ report that includes our opinion. Reasonable assurance is ahigh level of assurance, but is not a guarantee that an auditconducted in accordance with ISAs (Ireland) will always detect amaterial misstatement when it exists. Misstatements can arisefrom fraud or error and are considered material if, individually or inthe aggregate, they could reasonably be expected to influence the economic decisions of users taken on the basis of these financial statements.
Our audit testing might include testing complete populations ofcertain transactions and balances, possibly using data auditingtechniques. However, it typically involves selecting a limited numberof items for testing, rather than testing complete populations. Wewill often seek to target particular items for testing based on theirsize or risk characteristics. In other cases, we will use auditsampling to enable us to draw a conclusion about the populationfrom which the sample is selected.
A further description of our responsibilities for the audit of thefinancial statements is located on the IAASA website at:
https://www.iaasa.ie/getmedia/b2389013-1cf6-458b-9b8f-a98202dc9c3a/Description_of_auditors_responsibilities_for_audit.pdf.
This description forms part of our auditors’ report.
Use of this report
This report, including the opinion, has been prepared for and only forthe unitholders as a body in accordance with the EuropeanCommunities (Undertakings for Collective Investment in Transferable Securities) Regulations 2011 (as amended) and for no other purpose.We do not, in giving this opinion, accept or assume responsibility forany other purpose or to any other person to whom this report isshown or into whose hands it may come save where expresslyagreed by our prior consent in writing.
PricewaterhouseCoopersChartered Accountants and Registered AuditorsDublin
28 April 2021
23
Board of Directors1,2
Peter Blessing3 (Irish)Michael S. Miller (American)James M. Norris4 (American)William Slattery3 (Irish)Sean P. Hagerty (American)Tara Doyle3 (Irish)Richard Wane5 (British)Robyn Laidlaw6 (New Zealand)
Manager
Vanguard Group (Ireland) Limited70 Sir John Rogerson’s QuayDublin 2Ireland
Depositary
State Street Custodial Services (Ireland) Limited78 Sir John Rogerson’s QuayDublin 2Ireland
Distributor
Vanguard Asset Management, Limited4th FloorThe Walbrook Building25 WalbrookLondonEC4N 8AFUnited Kingdom
Investment Manager
Vanguard Global Advisers, LLC100 Vanguard BoulevardMalvern, PA 19355USA
Administrator
State Street Fund Services (Ireland) Limited78 Sir John Rogerson’s QuayDublin 2Ireland
Legal Advisers as to Matters of Irish Law
Matheson70 Sir John Rogerson’s QuayDublin 2Ireland
Independent Auditors
PricewaterhouseCoopersChartered Accountants & Registered AuditorsOne Spencer DockNorth Wall QuayDublin 1Ireland
Secretary for the Fund and the Manager
Matsack Trust Limited70 Sir John Rogerson’s QuayDublin 2Ireland
1 Thomas Merz resigned as a Director of the Manager on 17 August 2020.2 Ann Stock was appointed as a Director on 1 April 2021.3 Served in an independent non-executive capacity during the year.4 Resigned as Director on 31 December 2020.5 Resigned as Director on 31 March 2021.6 Appointed as Director of the Manager on 16 November 2020.
Investor Information and Services (Ireland)
Fax: 353-1-612-3067Phone: 353-1-612-3226
World Wide Web
http://global.vanguard.com
This report is intended for the fund’s unitholders. It may not be distrib-uted to prospective investors unless it is preceded or accompanied bythe current fund prospectus.
All comparative mutual fund data are from Lipper, a Thomson ReutersCompany, or Morningstar, Inc., unless otherwise noted.
The S&P 500 Index is a product of S&P Dow Jones Indices LLC(“SPDJI”), and has been licensed for use by Vanguard. Standard &Poor’s® and S&P® are registered trademarks of Standard & Poor’sFinancial Services LLC (“S&P”); Dow Jones® is a registered trademarkof Dow Jones Trademark Holdings LLC (“Dow Jones”); S&P® and S&P500® are trademarks of S&P; and these trademarks have been li-censed for use by SPDJI and sublicensed for certain purposes by Van-guard. Vanguard’s product is not sponsored, endorsed, sold or pro-moted by SPDJI, Dow Jones, S&P, or their respective affiliates andnone of such parties make any representation regarding the advisabil-ity of investing in such product(s) nor do they have any liability for anyerrors, omissions, or interruptions of the S&P 500 Index.
c⁄o State Street Custodial Services(Ireland) Limited78 Sir John Rogerson’s QuayDublin D02 HD32Ireland
Connect with Vanguard® > vanguard.com
© 2021 Vanguard Group (Ireland) Limited.All rights reserved.
VCCF 042021