Embed Size (px)
Citation preview

Using MS Excel PivotTables with OSP Grant Reports
Chris G. Green, CPADirector, Sponsored Programs

Topics
• How to access OSP Portal Grant Reports.• What is a MS Excel PivotTable?• How to Create a MS Excel PivotTable. • How to make updates to a PivotTable. • Suggested Reference Material.
OSP Portal Grant Reports
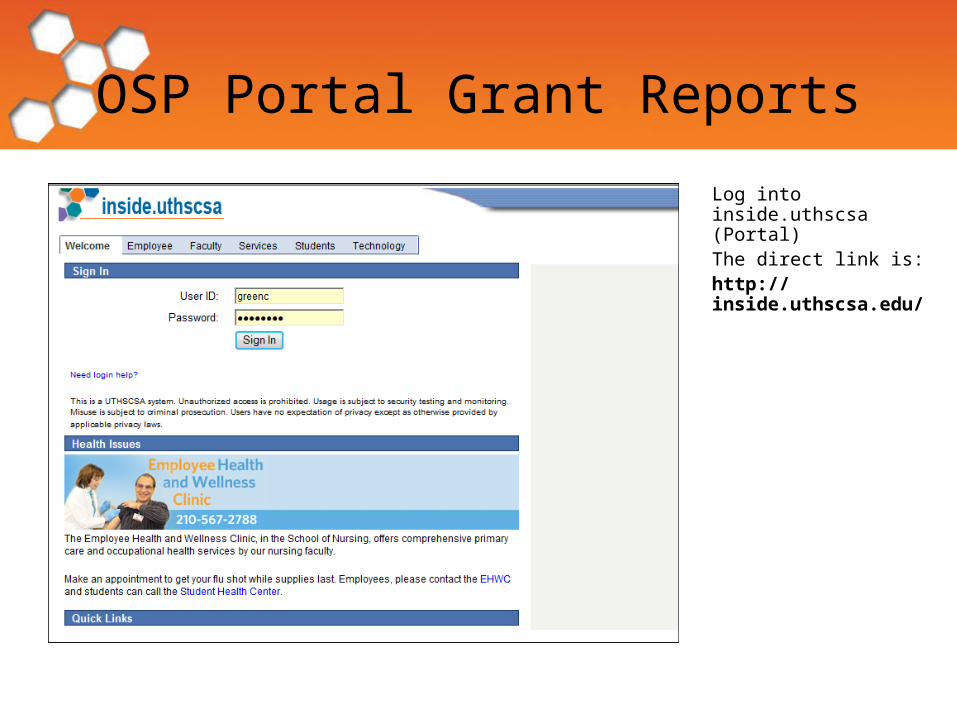
Log into inside.uthscsa (Portal)The direct link is: http://inside.uthscsa.edu/

OSP Portal Grant Reports
Select HSC Business Applications link

OSP Portal Grant Reports
Select Office of Sponsored Programs link

OSP Portal Grant Reports
The four OSP reports will be displayed
To open the Project Grant Listing, select the link

OSP Portal Grant Reports
Project Grant Listing will open in MS Excel

What is a PivotTable?
A PivotTable is a special type of summary table that's unique to Excel. PivotTables are great for summarizing values in a table because they do their magic without making you create formulas to perform the calculations. Pivot tables also let you play around with the arrangement of the summarized data. It's this capability of changing the arrangement of the summarized data on the fly simply by rotating row and column headings that gives the pivot table its name.

Creating a PivotTable
To help demonstrate how to create a PivotTable using the Project Grant Listing, the following scenario will be used:
You received a request from your Chair requesting the number R01 grants that have been awarded to your department (G1700).

Creating a PivotTable
Before creating the PivotTable, ensure that the data has no blank rows or columns and that each column has a header
Since the Project Grant Listing has report details above its column headers, we must delete these two rows before we create the PivotTable. This deletion of rows is necessary for all OSP reports on the Portal. Remember each column must always have a header.
Simply highlight the first two rows and select Delete

Creating a PivotTable
Click any cell within the data field. Select the "Insert" tab at the top of the screen, and then click the "PivotTable" button on the left end of the ribbon.
*Shortcut ALT + DPF

Creating a PivotTable
Excel opens the Create PivotTable dialog box and selects all the table data, as indicated by a marquee around the cell range
No updates are necessary, just select OK

Creating a PivotTable
By default, Excel builds the pivot table on a new worksheet
Excel adds a blank grid for the new pivot table and displays a PivotTable Field List task pane on the right side of the worksheet
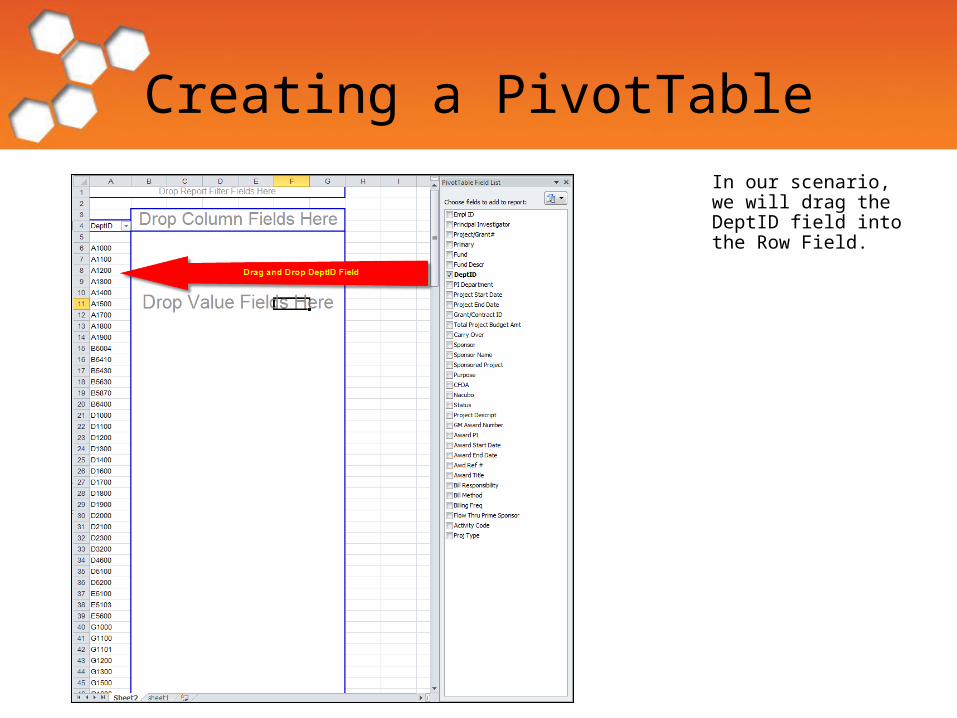
Creating a PivotTableIn our scenario, we will drag the DeptID field into the Row Field.

Creating a PivotTableFilter the DeptID by clicking on the drop-down button. Uncheck (Select All)
Next, select only DeptID G1700, then click OK

Creating a PivotTableDrag and Drop the Activity Code field into the Row Field
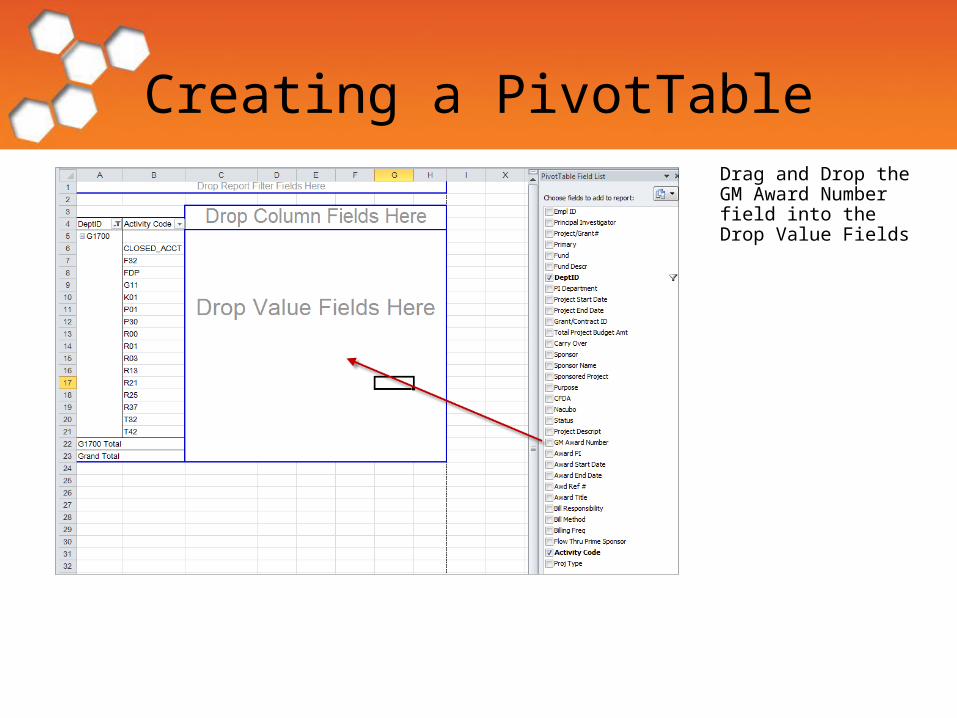
Creating a PivotTableDrag and Drop the GM Award Number field into the Drop Value Fields

Creating a PivotTableThe total number of R01’s for G1700 is “46”

Formatting a Pivot Table
To help demonstrate how to update a Pivot Table, we will continue to use the Grant Project Listing using the following scenario:
You received a request from your Chair requesting grant information for Rachell E. Booth who is in your department. Your Chair wants you to provide the data in a easily readable format.

Formatting a Pivot TableAfter setting up the PivotTable by dragging & dropping multiple fields and filtering by Rachell Booth, your PivotTable will have multiple subtotals as show. In addition, the “expand & collapse” buttons are displayed as follows:
The subtotals and the expand & collapse button makes the PivotTable confusing.

Formatting a PivotTableFormatting is accomplished by clicking anywhere inside the PivotTable. Once clicked, the PivotTable Tools will be available so that updates can be made to the PivotTable.

Formatting a PivotTableDelete multiple subtotals by using the “Subtotals” option

Formatting a PivotTableMultiple Subtotals have been removed
Next update the Grand Total by clicking the “Grand Totals” option

Formatting a PivotTableMultiple Subtotals have been removed
Next update the “expand & collapse” option by clicking the Options tab

Formatting a PivotTableClick the “expand & collapse” option

Formatting a PivotTableThe data is now formatted and ready to be used/copied

Suggested Reference Material
Excel PivotTables and PivotCharts: Your visual blueprint for creating dynamic spreadsheets, 2nd Edition (Paul McFedries, 2010)

Questions about OSP Reports?
• Contact Chris Green in OSP at 567-4938 or via email at [email protected].