Embed Size (px)
Citation preview
Use of Multiphoton FLIM as an Assay Technique for Carcinogenesis and Pharmacological Efficacy

Outline
• Review of technical aspects of FLIM and implementation in Bruker FM multiphoton systems. Muhammad Nazir, PhD, Applications Engineer, Bruker FM
• Cellular-Level Metabolic Imaging to Predict Anti-Cancer Drug Response, Dr. Melissa Skala, Vanderbilt University
• Assistant Professor Biomedical Engineering
• Development and translation of optical imaging and spectroscopy techniques to quantify changes in optical biomarkers including cellular metabolism, blood oxygenation and concentration, microvessel network structure and perfusion, and collagen content
• Focus on cancer and cardiovascular disease
• Questions
• Type in questions at any time during presentation
9/11/2014 2 Bruker Confidential

Fluorescence
• Emission of a photon from a molecule in ‘singlet’ excited state
• Properties:
• Intensity (photon flux)
• Wavelength
• Lifetime
• Polarization state of molecule
9/11/2014 3 Bruker Confidential
http://www.shsu.edu/~chm_tgc/chemilumdir/JABLON.GIF

Lifetime
• Measure of how long a molecule stays in the excited state
• Independent of Concentration
• Altered by Micro-environment
• Frequency-domain and Time-domain measurements
9/11/2014 4 Bruker Confidential

Single Exponential Decay
9/11/2014 5 Bruker Confidential
0
0.2
0.4
0.6
0.8
1
1.2
0 5 10 15 20 25 30 35
Flu
ore
sce
nce
/A
U
Time/nsec
Fluorescence Decay Curve
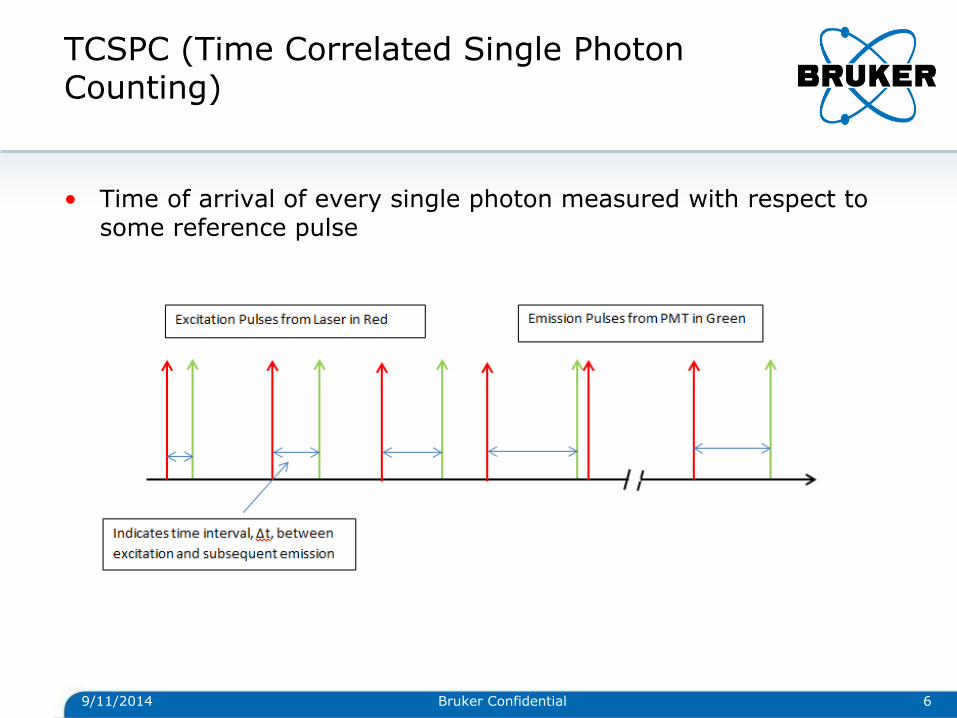
TCSPC (Time Correlated Single Photon Counting)
• Time of arrival of every single photon measured with respect to some reference pulse
9/11/2014 6 Bruker Confidential

TCSPC
• By sampling the single photon emission after a large number of excitation pulses, the experiment constructs a probability distribution
9/11/2014 7 Bruker Confidential

TCSPC
• Very good at low light level signals
• Fitting an exponential decay curve to the data
9/11/2014 8

9/11/2014 9 Bruker Confidential
Components of a TCSPC based FLIM system

Constant Fraction Discriminator (CFD)
Straight Threshold Detection Constant Fraction Detection
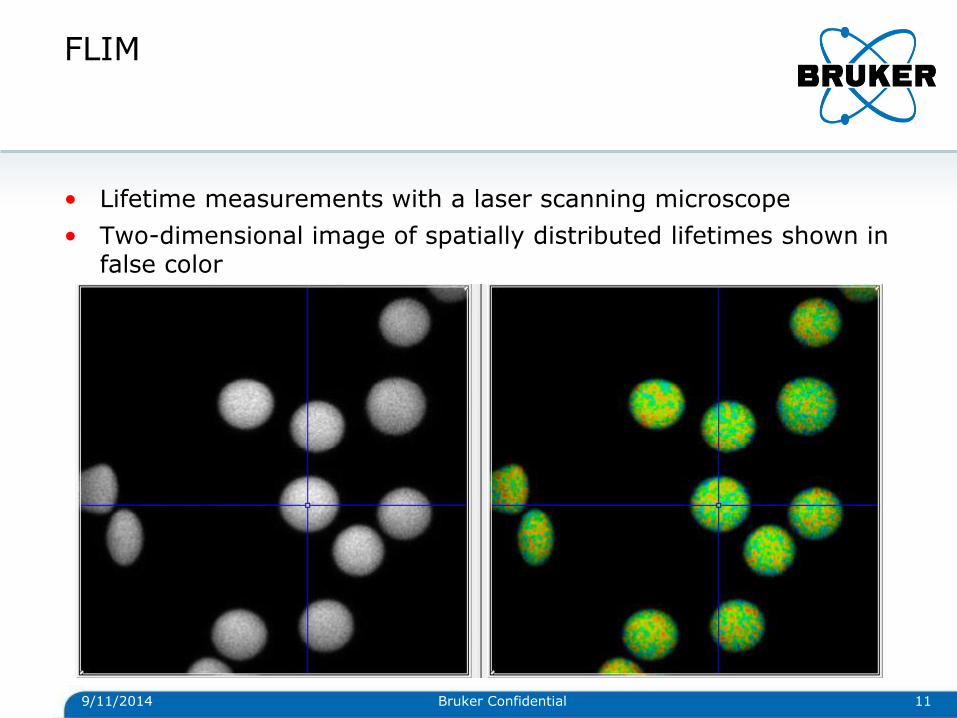
FLIM
• Lifetime measurements with a laser scanning microscope
• Two-dimensional image of spatially distributed lifetimes shown in false color
9/11/2014 11 Bruker Confidential

Integration of FLIM to Bruker’s Multiphoton systems
• TCSPC based FLIM systems are generally stand alone systems
• LSM software runs on one computer and the FLIM software runs on another computer
• FLIM data is stored on a different computer than the intensity data
• Capabilities of LSM software can not be extended to FLIM
• Bruker has developed a FLIM system that is fully integrated with our MP systems
• One computer and one software (PrairieView) for intensity and FLIM acquisition
• Switching between intensity and FLIM is transparent to user
• System features for intensity are available in FLIM mode as well
9/11/2014 12 Bruker Confidential

Bruker’s implementation
• Elegant and simple
• SPC-150 (housed in the same computer as other scanning cards)
• GaAsP PMTs (or Hybrid PMTs) used for detection
• FIFO mode
• Spatial information and Triggering signals are provided by signals from the scanning system
• Lifetime data streamed directly to shared memory accessible by PrairieView
• Data saved in B&H sdt format
• Switch box
• Curve fitting and analysis is done offline with Becker & Hickl SPCImage software
• Other features offered by SPC-150 are still available
9/11/2014 13 Bruker Confidential

Software Implementation
• Raster Scanned Image
• ROIs
• Z-series
• T-series
• Line scans
• Tiled Images
(Montages)
• Control over key FLIM parameters
9/11/2014 14 Bruker Confidential

Analysis software: SPCImage from Becker & Hickl
9/11/2014 15 Bruker Confidential

Cellular-Level Metabolic Imaging to Predict Anti-
Cancer Drug Response
Alex J. Walsh, Rebecca S. Cook, Melinda E. Sanders, Carlos L. Arteaga,
Melissa C. Skala
Assistant Professor
Department of Biomedical Engineering
Vanderbilt University
Nashville, TN
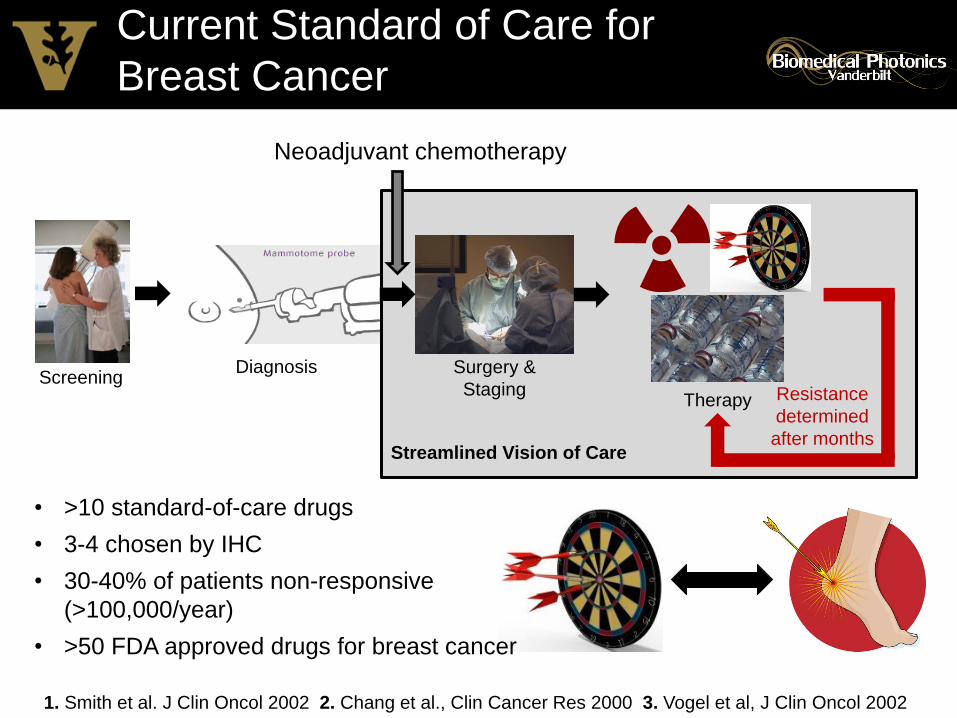
Streamlined Vision of Care
Current Standard of Care for
Breast Cancer
Screening Diagnosis Surgery &
Staging Therapy Resistance
determined
after months
Neoadjuvant chemotherapy
• >10 standard-of-care drugs
• 3-4 chosen by IHC
• 30-40% of patients non-responsive
(>100,000/year)
• >50 FDA approved drugs for breast cancer
1. Smith et al. J Clin Oncol 2002 2. Chang et al., Clin Cancer Res 2000 3. Vogel et al, J Clin Oncol 2002

Optical Screens for Optimal
Clinical Treatment
Breast tumor
biopsy
Apply multiple drug
combinations
Optical metabolic
imaging
Efficacy of drugs &
drug combinations
Optimal treatment
regimen
Remission-free
survival
0
0.5
1
1.5
Cell
ula
r M
eta
bo
lism
Untreated Treated
* *
**

0%
20%
40%
60%
80%
100%
Pro
ba
bili
ty o
f tr
ansitio
n
to n
ext
sta
ge
Paul et al., Nat Rev Drug Disc. 2010
0
500
1000
1500
2000Submission
to launch Phase III
Phase II
Phase I Preclinical
Lead optimization
Hit-to-lead Target-to-hit
Co
st
(mill
ion
s $
)
$1.8B
Goal: Leverage functional
optical imaging to monitor
tumor response to therapy
in pre-clinical models
Demand for biomarkers
that improve selection of
drugs for clinical trials
The Challenges of Drug
Development

Tumor Metabolism as a Marker
of Drug Response
• Cellular-resolution images of metabolism
may identify sub-populations responsible
for relapse
• Therefore, microscopic metabolic imaging
is an attractive assessment tool
Locasale et al., Mol Systems Biol 2012
Sensitive cells Resistant cells
Kleppe et al., Nat Med 2014
Therapy
• Most anti-cancer
therapies disrupt
cellular metabolism
• Metabolic changes
likely precede
changes in tumor size
(standard measure)

Some Metabolic Imaging
Technologies
1. Ueda S, et al. Cancer Res. 2012;72(17):4318-28. 2. O’Sullivan et al. Breast Cancer Res. 2013;15:R14
Photoacoustic imaging, MRI, etc…
Method Endpoint Advantages Limitations
IHC
Protein
expression
- High resolution
- Molecularly
specific
- Ex vivo; no dynamics
- Protein expression, not
function
FDG-
PET
FDG uptake - In vivo
- Requires radiotracers
- Low sensitivity and
resolution
DOT1,2 Tissue
Optical Index
- In vivo
- No contrast agent
- Low resolution
TOI = ctHHb × water / (% lipid)

Optical Metabolic Imaging (OMI)
Method Endpoint Advantages Limitations
IHC
Protein
expression
- High resolution
- Molecularly
specific
- Ex vivo; no dynamics
- Protein expression, not
function
FDG-
PET
FDG uptake - In vivo
- Requires radiotracers
- Low sensitivity and
resolution
DOT1,2 Tissue
Optical Index
- In vivo
- No contrast agent
- Low resolution
Optical
Metabolic
Imaging
NAD(P)H
and FAD
fluorescence
- In vivo
- Cellular
resolution
- No contrast agent
- Low penetration depth
1. Ueda S, et al. Cancer Res. 2012;72(17):4318-28. 2. O’Sullivan et al. Breast Cancer Res. 2013;15:R14

FADH2 FAD
Optical Metabolic Imaging (OMI):
Redox Ratio
1. Chance et al., J Biol Chem 1979 2. Georgakoudi, Ann. Rev Biomed. Eng. 2012 3. Varone, Georgakoudi, Cancer Res 2014
Fatty Acid
Oxidation
NAD+
FADH2
FAD
NADH
Lipid & Amino
Acid Synthesis
NADPH
NADP+
Pentose Phosphate
Pathway
2NADP+
2NADPH
ROS
scavenging
NADP+ NADPH
IFAD
INAD(P)H Redox Ratio =

FADH2 FAD
Optical Metabolic Imaging (OMI):
Redox Ratio
Fatty Acid
Oxidation
NAD+
FADH2
FAD
NADH
Lipid & Amino
Acid Synthesis
NADPH
NADP+
Pentose Phosphate
Pathway
2NADP+
2NADPH
ROS
scavenging
NADP+ NADPH
FAD NADH
autofluorescent
molecules
NADPH
IFAD
INAD(P)H Redox Ratio =
1. Chance et al., J Biol Chem 1979 2. Georgakoudi, Ann. Rev Biomed. Eng. 2012 3. Varone, Georgakoudi, Cancer Res 2014

OMI: Fluorescence Lifetimes of
NAD(P)H and FAD
Data
Fit
System
Response
𝐼 𝑡 = 𝛼1𝑒𝑥𝑝−𝑡/𝜏1 + 𝛼2𝑒𝑥𝑝−𝑡/𝜏2 + 𝐶
𝜏𝑚 = 𝛼1𝜏1 + 𝛼2𝜏2
1.7 ns
0.5 ns
Example NAD(P)H tm Images:
Fluorescence lifetime reports
microenvironment (protein binding) of
NAD(P)H and FAD :
NAD(P)H t1 Free NAD(P)H1
NAD(P)H t2 Bound NAD(P)H1
FAD t1 Bound FAD2
FAD t2 Free FAD2
a Fractional
component
3. Nakashima N, et al. J Biol Chem. 1980;255(11):5261-3.
4. Blacker, Duchen et al., Nature communications 5 (2014).
1. Lakowicz JR, et al. P Natl Acad Sci USA. 1992;89(4):1271-5.
2. Konig K, et al. J Biomed Opt, 2003; 8:432–439.
OMI Endpoints
IFAD
INAD(P)H Redox Ratio =
𝐼 𝑡 = 𝛼1𝑒𝑥𝑝−𝑡/𝜏1 + 𝛼2𝑒𝑥𝑝−𝑡/𝜏2 + 𝐶
𝜏𝑚 = 𝛼1𝜏1 + 𝛼2𝜏2
𝑂𝑀𝐼 𝐼𝑛𝑑𝑒𝑥 =𝑅𝑅𝑖
𝑅𝑅+
𝑁𝐴𝐷(𝑃)𝐻𝜏𝑚𝑖
𝑁𝐴𝐷(𝑃)𝐻𝜏𝑚
−𝐹𝐴𝐷𝜏
𝑚𝑖
𝐹𝐴𝐷𝜏𝑚
Relative amounts of
NAD(P)H and FAD
Enzyme activity of
NAD(P)H
Enzyme activity of
FAD
Walsh et al. Cancer Res 2013
Resistant
Responsive
[glucose uptake]/[lactate secreted]

OMI Instrumentation
2-Photon Fluorescence Microscope by Bruker FM
• 40X/1.3 NA oil immersion objective
• 750 nm excitation (400-480 nm emission) for NAD(P)H fluorescence
• 890 nm excitation (500-600 nm emission) for FAD fluorescence
• 7-9 mW power at the sample
• TCSPC for FLIM imaging
• B&H SPC150 board; GaAsP PMT
Scanning Galvos
PMT
Emission Filter
Objective
(40X oil, 1.3 NA)
Laser Laser

Use mask to extract for each cell:
1) NAD(P)H t1
2) NAD(P)H t2
3) NAD(P)H a1
4) FAD t1
5) FAD t2
6) FAD a1
7) NAD(P)H photon count
8) FAD photon count
Calculate combination variables:
Redox ratio, NAD(P)H tm , FAD tm
Single Cell Analysis
1 2 3 4 5
1. NAD(P)H
intensity image
2. Threshold to
identify nuclei
3. Set nuclei as
primary objects
4. Propagate out
from nuclei to
identify cells
5. Cytoplasm =
cell - nuclei
1. Cell Profiler. www.cellprofiler.org 2. Walsh et al. Proc SPIE 2014;8948
Redox Ratio
Num
ber
of
Cells
Akaike H. IEEE Transactions on. 1974;19(6):716-23.
OMI Index
Identify cell sub-populations
with AIC criteria

In vivo validation studies
• Trastuzumab: HER2 inhibitor given to ~20% of patients that
over-express HER2
• 30-40% of patients de novo resistant to trastuzumab
• Xenograft models: HER2+ human breast tumor cells that are
responsive (BT474) and resistant (HR6) to trastuzumab
BT474:
HER2+ trastuzumab-
responsive
HR6:
HER2+ trastuzumab-
resistant

50
150
250
0 5 10 15
Tum
or
Siz
e (
mm
3)
Days Post Treatment
* * *
2.5 ns
0.5 ns
FD
G U
pta
ke
(%
ID/g
)
2 5 1 2
0
2
4
6
D a y s P o s t T re a tm e n t
100 mm
In vivo Tests of Anti-HER2
Drug Response BT474 (responsive)
Walsh et al. Cancer Res 2013
0
0.5
1
1.5
2
2 5 14
OM
I In
dex
Days of Treatment
**
** *
T
bladder
heart
T
* p<0.05 vs. Control IgG

0
100
200
300
400
0 5 10 15
Tum
or
Siz
e (
mm
3)
Days Post Treatment
2.5 ns
0.5 ns 100 mm
HR6 (non-responsive)
0
0.5
1
1.5
2 5 14
OM
I In
dex
Days of Treatment
Walsh et al. Cancer Res 2013
In vivo Tests of Anti-HER2
Drug Response
FD
G U
pta
ke
(%
ID/g
)
2 5 1 2
0
2
4
6
D a y s P o s t T re a tm e n t
*
T T
MDA-MB-361
(partially-responsive)
0
0.4
0.8
1.2
1.6
-1 4N
orm
aliz
ed
Num
ber
of C
ells
OMI Index
*
*
* p<0.05 vs. Control IgG
High-throughput drug screening:
validation in animal models

Primary Tumor Organoids
• Include cancer cells as well as native stromal components – Enable communication between cell types
– Fibroblasts and immune cells 1, 2
• Grow in 3D structure – More closely mimic in vivo conditions
– Microenvironment replicates tumor-like gradients
of oxygen, glucose, and pH 3
• Non-invasive cellular-level imaging can identify sub-populations of response within intact organoids
• Patient tissue can be grown in organoids, incubated with several therapies, and measured with OMI to predict optimum treatment regimens
1. Birgersdotter, et al. Semin Cancer Biol (2005) 2. Bates, et al. Molec Biol Cell (2003) 3. Sutherland, et al. Science (1988)
170 µm

Mince
Partial
Digest
Organoids mammary
gland
(epithelia
& stroma)
Mince
Partial
Digest
-Ad.H2BmCherry
Fluorescent
imaging of cell division
-Embed
in 3D
matrix
Optical imaging of metabolism
-Embed in 3D
matrix
-Wash
-Pellet
-Filter
Single cell suspensions
Phospho-
Flow/CyTOF
-Enrich for
epithelial
cells
Organoids
-Wash
-Pellet
Complete
Digest
mammary
gland
(epithelia
& stroma)
Mince
Partial
Digest
-Ad.H2BmCherry
Fluorescent
imaging of cell division
-Embed
in 3D
matrix
Optical imaging of metabolism
-Embed in 3D
matrix
-Wash
-Pellet
-Filter
Single cell suspensions
Phospho-
Flow/CyTOF
-Enrich for
epithelial
cells
Organoids
-Wash
-Pellet
Complete
Digest
Mammary
gland (epithelia
& stroma) Wash
Pellet
Embed in
3D matrix
Organoid Generation Sample Estrogen
Receptor
Progesterone
Receptor
HER2
Trastuzumab-
responsive xenograft
+ + +
Trastuzumab-
resistant xenograft
+ + +
Patient 1 + + -
Patient 2 + + -
Patient 3 + + -
Patient 4 + + -
Patient 5 - - +
Patient 6 - - -
Treat with
Anti-cancer
drugs
Paclitaxel (chemotherapy)
Tamoxifen (anti-ER)
Trastuzumab (anti-HER2)
XL147 (anti-PI3K) Image 24, 48, 72 hrs
For in vivo validation, see:
Walsh et al. Cancer Res 2012
Walsh et al. Cancer Res 2014

Trastuzumab-Responsive
(BT474) Xenograft
72 hours 72 hours 72 hours
N=21 mice
N=1 mouse
In vivo validation
* p<0.05 vs. Control IgG Walsh et al. Cancer Res 2014

Trastuzumab-Resistant (HR6)
Xenograft
24 hours 72 hours 72 hours
In vivo validation
* p<0.05 vs. Control IgG Walsh et al. Cancer Res 2014

Cellular-level Response in
Trastuzumab-Resistant Xenograft
0
1
2
3
-1 1 3
Norm
aliz
ed N
um
ber
of
Cells
OMI Index
Control
Trastuzumab (H)
0
1
2
3
-1 1 3
Norm
aliz
ed N
um
ber
of
C
ells
OMI Index
24 hours 72 hours
Walsh et al. Cancer Res 2014

Cellular-level Response in
Trastuzumab-Resistant Xenograft
0
1
2
3
-1 1 3
Norm
aliz
ed N
um
ber
of
Cells
OMI Index
Control
Paclitaxel (P)
Trastuzumab (H)
0
1
2
3
-1 1 3
Norm
aliz
ed N
um
ber
of
C
ells
OMI Index
24 hours 72 hours
Walsh et al. Cancer Res 2014

Cellular-level Response in
Trastuzumab-Resistant Xenograft
0
1
2
3
-1 1 3
Norm
aliz
ed N
um
ber
of
Cells
OMI Index
Control
Paclitaxel (P)
Trastuzumab (H)
H + P + X
0
1
2
3
-1 1 3
Norm
aliz
ed N
um
ber
of
C
ells
OMI Index
24 hours 72 hours
Walsh et al. Cancer Res 2014

Multi-drug screens in patients

0.3 ns
1.7 ns
0.3 ns
1.7 ns
ER+ HER2+ TNBC
0
10 Redox
Ratio
(NAD(P)H
/FAD)
NAD(P)H
tm
FAD tm
Human Tissue Derived Organoids
6 organoids/group imaged; n ~=50-150 cells/group
100mm
Walsh et al. Cancer Res 2014
0
0.5
1
1.5
2
2.5
3
TNBC ER+ HER2+
OM
I In
dex
*
*
0
0.2
0.4
0.6
0.8
1
1.2
1.4
TNBC ER+ HER2+
OM
I In
dex *
*
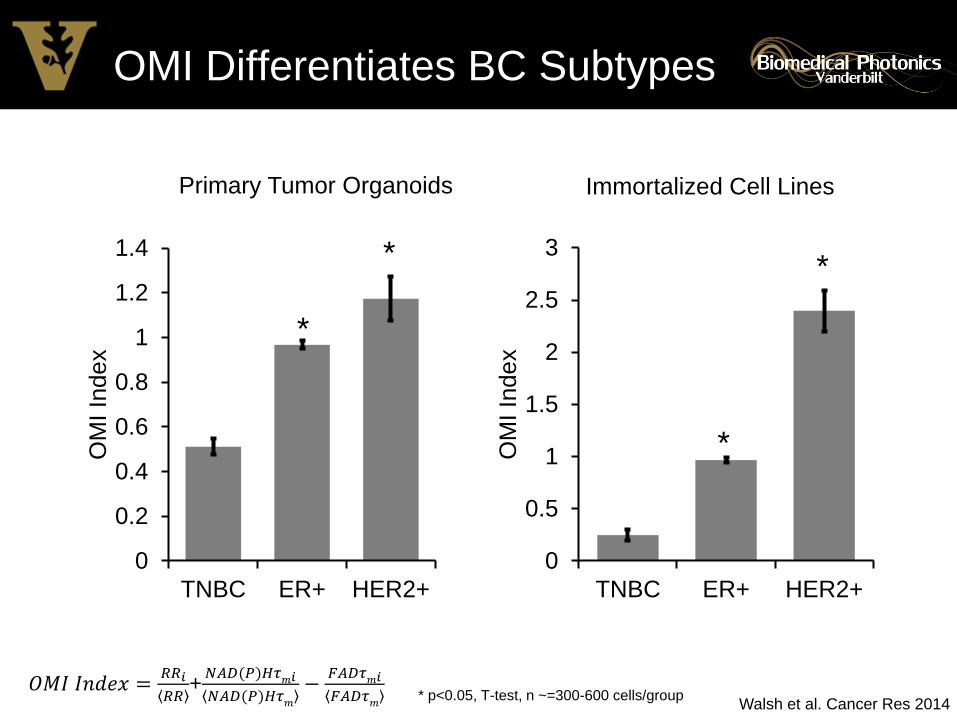
OMI Differentiates BC Subtypes
Primary Tumor Organoids Immortalized Cell Lines
* p<0.05, T-test, n ~=300-600 cells/group 𝑂𝑀𝐼 𝐼𝑛𝑑𝑒𝑥 =
𝑅𝑅𝑖
𝑅𝑅+
𝑁𝐴𝐷(𝑃)𝐻𝜏𝑚𝑖
𝑁𝐴𝐷(𝑃)𝐻𝜏𝑚
−𝐹𝐴𝐷𝜏
𝑚𝑖
𝐹𝐴𝐷𝜏𝑚
Walsh et al. Cancer Res 2014

A
Patient 1: Estrogen Receptor +
P = Paclitaxel (chemotherapy) T = Tamoxifen (anti-ER)
H = Trastuzumab (anti-HER2) X = XL147 (anti-PI3K) 72hr
Redox Ratio NAD(P)H tm FAD tm
0
1
2
3
4
5
-0.5 1.5
No
rma
lize
d N
um
ber
o
f C
ells
OMI Index
Control
H+P+X
H+P+T+X
H+P+X has
two peaks
0
0.5
1
1.5
2
OM
I In
dex
*
* * *
* *
*
• OMI detects drug-induced changes in
human organoids
• Single cell analysis allows identification
of cellular subpopulations
• Population curves are broader for
human vs. xenograft tumors greater
heterogeneity in human tumors
* p<0.05 vs. Control IgG Walsh et al. Cancer Res 2014

Validation for Patient 1
% C
lea
ve
d C
as
pa
se
-3 +
Contr
ol
Paclit
axel (P
)
Tam
oxifen (
T)
Tra
stu
zum
ab (
H)
XL147 (
X)
H +
X
H +
P +
T
H +
P +
X
H +
P +
T +
X
0 .0
0 .1
0 .2
0 .3
0 .4
0 .5
* *
*
*
*
* *
0
0.5
1
1.5
2
OM
I In
dex
*
* * *
* *
*
OMI measured drug response
correlates with cleaved caspase 3
staining of cell death
P = Paclitaxel (chemotherapy) T = Tamoxifen (anti-ER)
H = Trastuzumab (anti-HER2) X = XL147 (anti-PI3K)
72hr
72hr
* p<0.05, T-test, n ~=100-300 cells/group
* p<0.05, T-test, n= 5 images; quantified as number
+ stained cells / total number cells in image Walsh et al. Cancer Res 2014

0
0.5
1
1.5
2
OM
I In
dex
* * *
*
* *
Patients 2-4: Estrogen
Receptor +
0
0.5
1
1.5
OM
I In
dex
* * * * *
0
0.5
1
1.5
2
2.5
OM
I In
dex
*
*
* *
• No response of any
ER+ tumor to
trastuzumab (anti-
HER2)
• Varied response to
Paclitaxel
(chemotherapy) and
tamoxifen (anti-ER)
suggests de novo
resistance
• Combination therapies
induce greatest change P = Paclitaxel (chemotherapy) T = Tamoxifen (anti-ER)
H = Trastuzumab (anti-HER2) X = XL147 (anti-PI3K)
HTS2-72hr HTS3-24hr
HTS4-72hr
* p<0.05, T-test, n ~=75-150 cells/group
100mm
Walsh et al. Cancer Res 2014
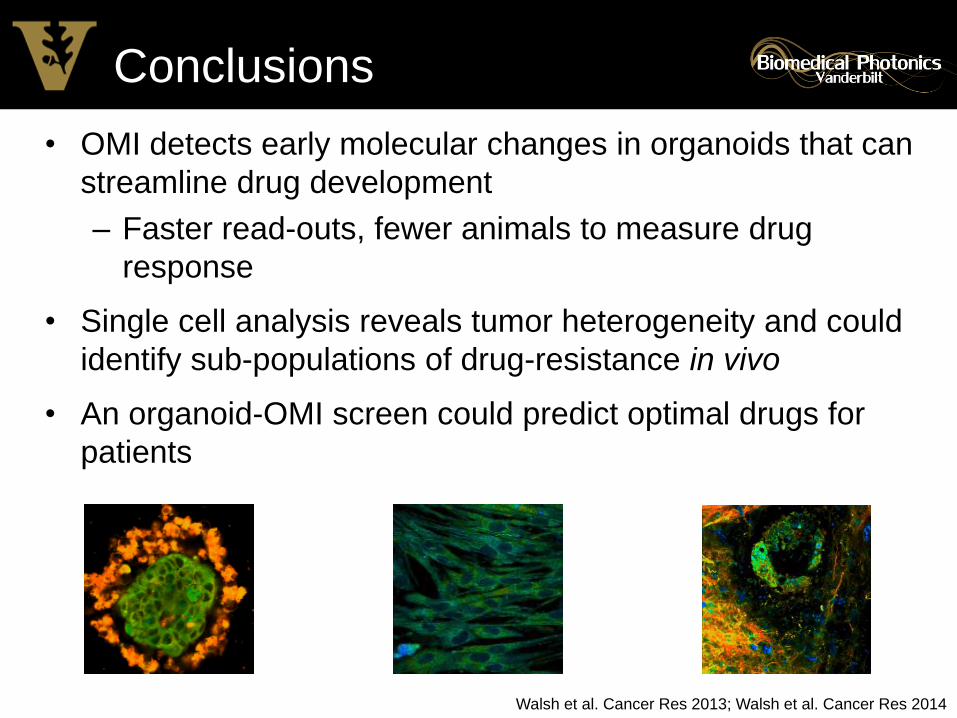
Conclusions
• OMI detects early molecular changes in organoids that can
streamline drug development
– Faster read-outs, fewer animals to measure drug
response
• Single cell analysis reveals tumor heterogeneity and could
identify sub-populations of drug-resistance in vivo
• An organoid-OMI screen could predict optimal drugs for
patients
Walsh et al. Cancer Res 2013; Walsh et al. Cancer Res 2014

Acknowledgments
Collaborators:
Rebecca Cook, Charles Manning,
Carlos Arteaga, Donna Hicks, Nipun
Merchant, Jason Castellanos,
Jonathan Irish
Lab Members: Alex Walsh, Wesley
Sit, Alec Lafontant, Kristin Poole,
Amy Shah, Jason Tucker-Schwartz,
Chetan Patil, Devin McCormack,
Constance Lents, Joe Sharick,
Maryse Lapierre-Landry
We are currently recruiting graduate students and postdocs;
please email [email protected] if interested.
research.vuse.vanderbilt.edu/skalalab
NCI R01 CA185747
Breast Cancer SPORE
P50 CA098131


![Biochimica et Biophysica Acta - CORE · fluorescence imaging with pioneering works by Skala et al. [10–12], Gratton et al.[15–20], and others. Multiphoton and FLIM imaging makeit](https://img.pdfslide.us/doc/110x75/5e65076e698709731d2158f6/biochimica-et-biophysica-acta-core-iuorescence-imaging-with-pioneering-works.jpg)