Embed Size (px)
Citation preview
Update on Armor Simulation Experiments
At Dragonfire Facility
Farrokh Najmabadi, John Pulsifer, Mark Tillack
HAPL MeetingAugust 8-9, 2006General Atomic
Electronic copy: http://aries.ucsd.edu/najmabadi/TALKSUCSD IFE Web Site: http://aries.ucsd.edu/IFE
Summary of the Activities
Homework from MWG:
1) Measure the vertical size of hills/valleys on the exposed samples Done. Issues with profiling
2) Sample test on a variety of temperatures and material. Waiting for samples from ORNL
We had found a definite change in sample response at ~2,500k.
Plans from Previous Meeting:
1) Improve Experimental set up to improve overall accuracy. New sample positioning system and heater New optical train for the thermometer Capability to perform experiments with Nd:YAG (IR) and KrF (UV)
lasers. In-situ and real-time optical microscopy of sample evolution
Profilmetery of Exposed Samples
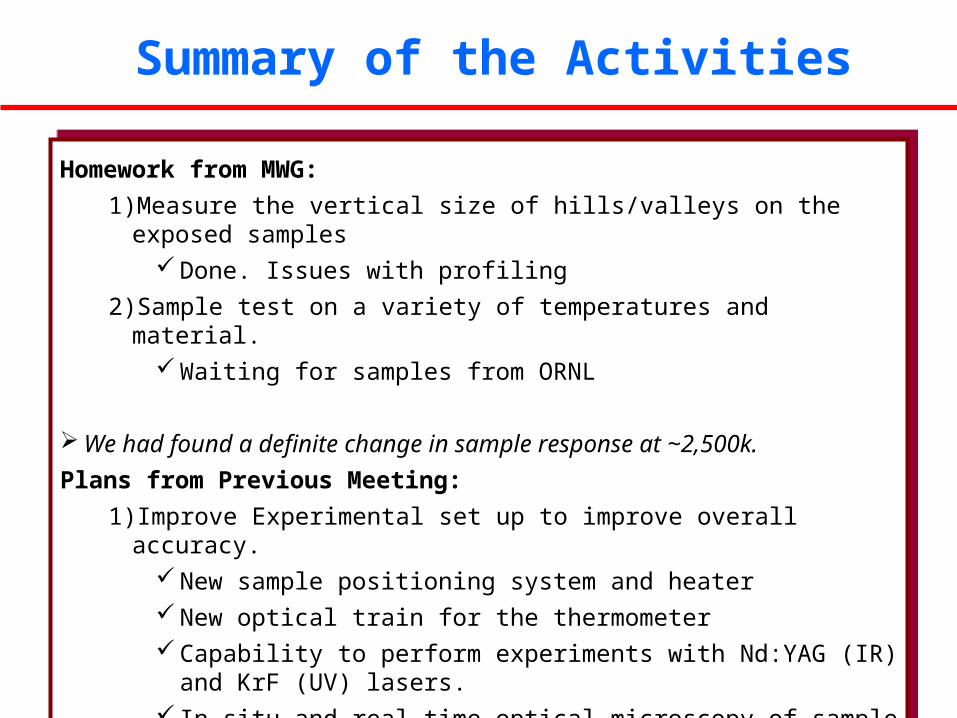
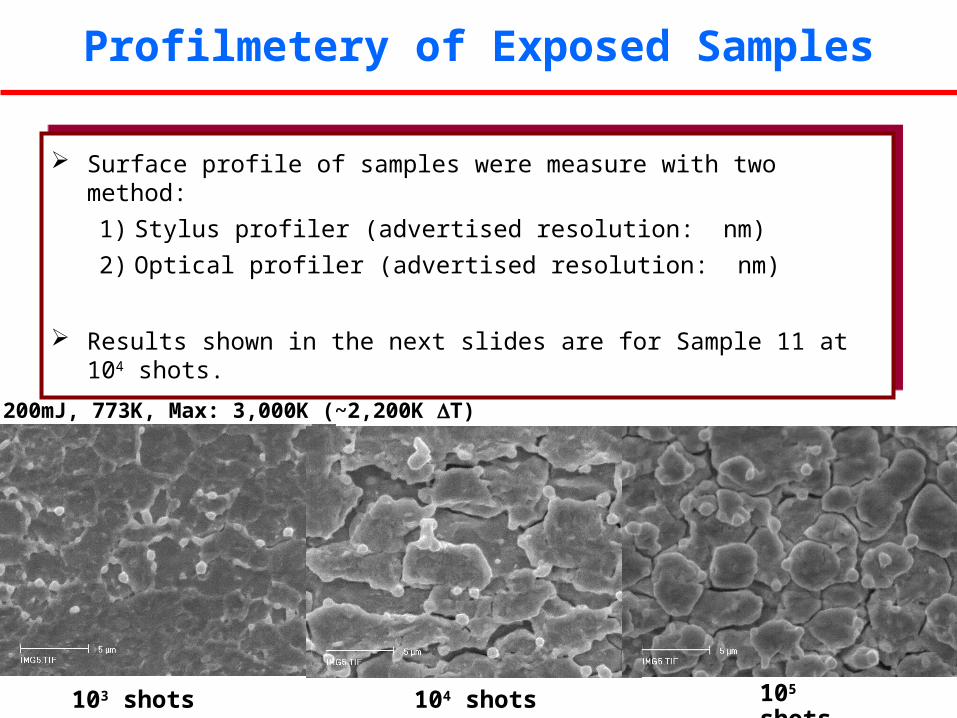
103 shots 105 shots104 shots
11, 200mJ, 773K, Max: 3,000K (~2,200K T)
Surface profile of samples were measure with two method:
1) Stylus profiler (advertised resolution: nm)
2) Optical profiler (advertised resolution: nm)
Results shown in the next slides are for Sample 11 at 104 shots.
Surface profile of samples were measure with two method:
1) Stylus profiler (advertised resolution: nm)
2) Optical profiler (advertised resolution: nm)
Results shown in the next slides are for Sample 11 at 104 shots.
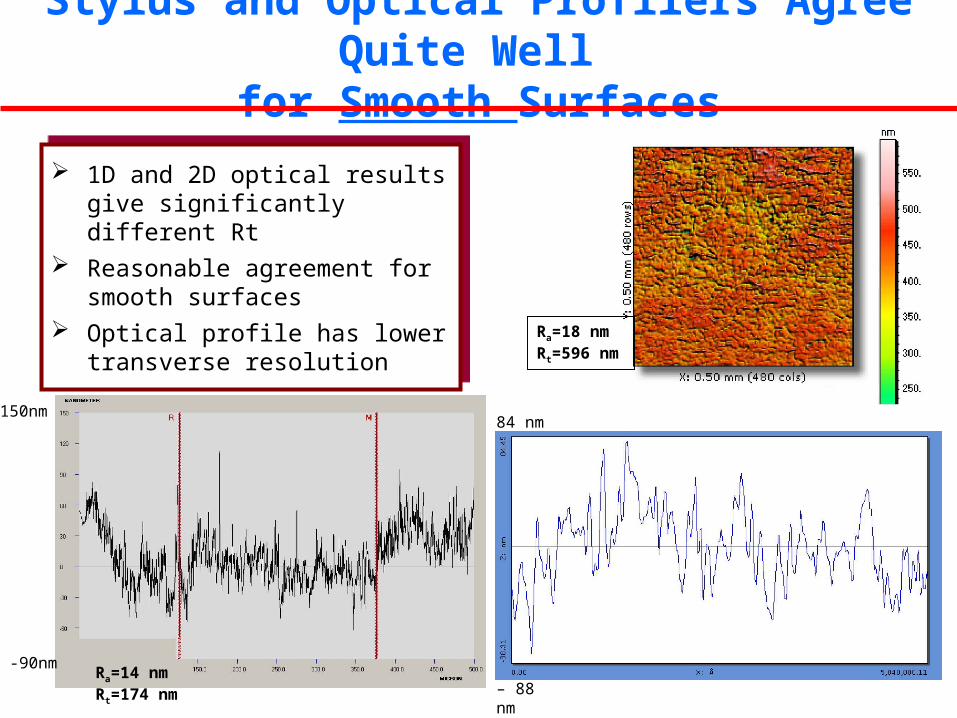
Stylus and Optical Profilers Agree Quite Well for Smooth Surfaces
1D and 2D optical results give significantly different Rt
Reasonable agreement for smooth surfaces
Optical profile has lower transverse resolution
1D and 2D optical results give significantly different Rt
Reasonable agreement for smooth surfaces
Optical profile has lower transverse resolution
Ra=23 nmRt=173 nm
84 nm
– 88 nm
Ra=18 nmRt=596 nm
Ra=14 nmRt=174 nm
150nm
-90nm
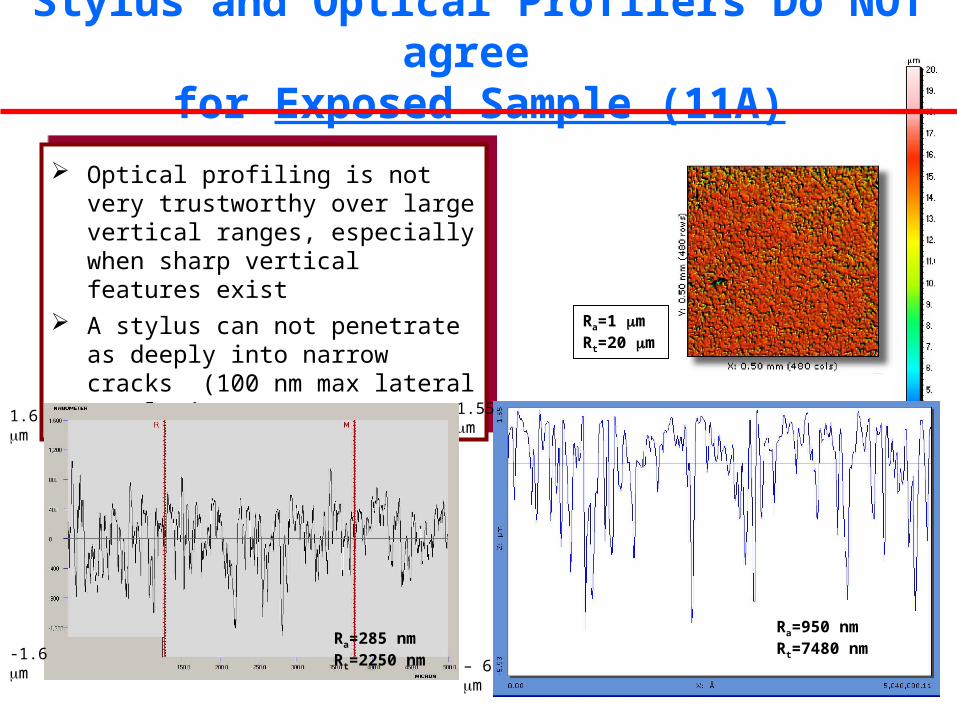
Stylus and Optical Profilers Do NOT agree for Exposed Sample (11A)
Optical profiling is not very trustworthy over large vertical ranges, especially when sharp vertical features exist
A stylus can not penetrate as deeply into narrow cracks (100 nm max lateral resolution)
Optical profiling is not very trustworthy over large vertical ranges, especially when sharp vertical features exist
A stylus can not penetrate as deeply into narrow cracks (100 nm max lateral resolution)
Ra=950 nmRt=7480 nm
Ra=1 mRt=20 m
1.55 m
– 6 m
Ra=285 nmRt=2250 nm-1.6
m
1.6m

Surface Profile Measurement
There is a factor of four difference in Ra between Stylus and Optical profilers.
Neither profilers are “meant” to be used to measure the depth of deep cracks.
Optical microscopy/SEM of a cut section of a sample can be used to calibrate the surface profile measurement.
There is a factor of four difference in Ra between Stylus and Optical profilers.
Neither profilers are “meant” to be used to measure the depth of deep cracks.
Optical microscopy/SEM of a cut section of a sample can be used to calibrate the surface profile measurement.
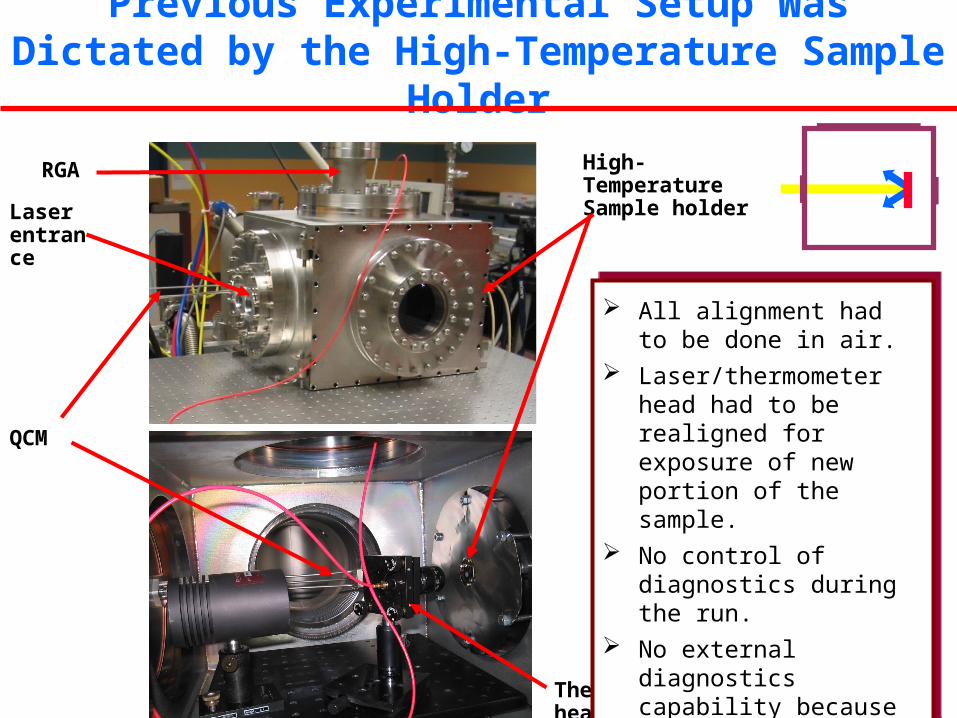
Previous Experimental Setup Was Dictated by the High-Temperature Sample Holder
High-Temperature Sample holder
Thermometer head
QCM
RGA
Laser entrance
All alignment had to be done in air.
Laser/thermometer head had to be realigned for exposure of new portion of the sample.
No control of diagnostics during the run.
No external diagnostics capability because sample was too far from windows.
All alignment had to be done in air.
Laser/thermometer head had to be realigned for exposure of new portion of the sample.
No control of diagnostics during the run.
No external diagnostics capability because sample was too far from windows.

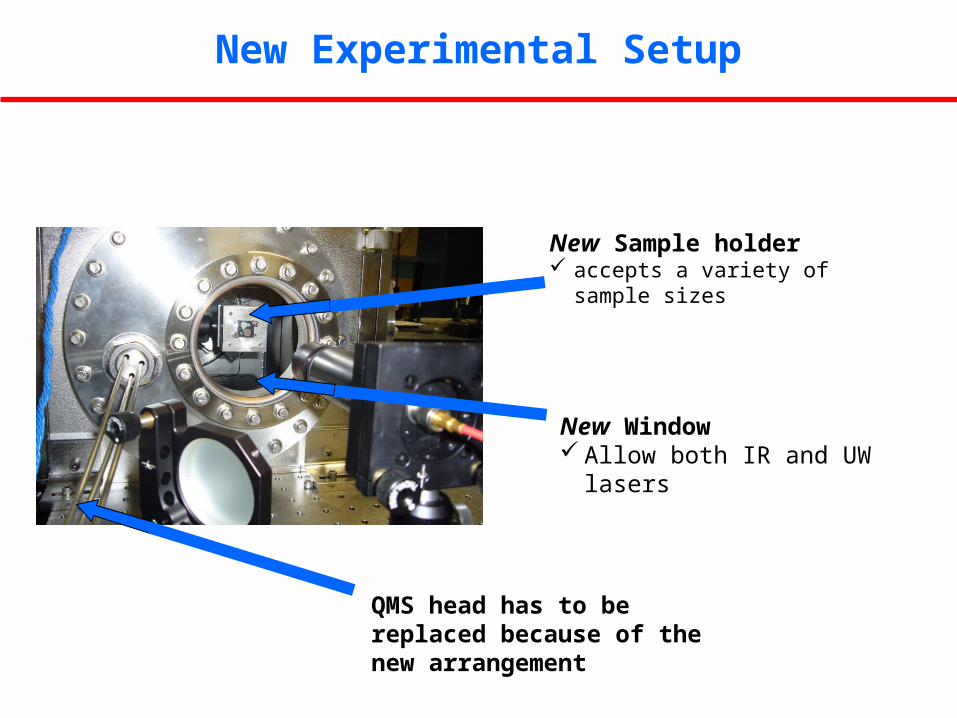
New Experimental Setup
New in-situ microscopy <25 m resolution large standoff K2 Infinity
optics
translator electronics
New heater halogen lamp 100 W (300 W available) ~500˚C base
temperature
New external thermometer head locationNew optics under development
New sample manipulator
xy translation external control located closer to window
New Experimental Setup
New Sample holder accepts a variety of
sample sizes
New Window Allow both IR and UW
lasers
QMS head has to be replaced because of the new arrangement

Precise temperature measurement requires small enough spot size and sharp image.
h1 h2
s1 s2d
m = h2/h1 = s2/s1 = NA1/NA2 f = (s1+s2) x m/(m+1)2
optical system
= 2.44 f/d
Target
Laser intensity
distribution
Object spot
Objective lens
Two-lens formulas were used to roughly size the thermometer head and compute the spot size (~100 m).
The thermometer head was focused on the sample by coupling a diode laser to the fiber and adjusting the objective to get a sharp image. The diode laser spot was roughly centered in the middle of drive laser foot-print.
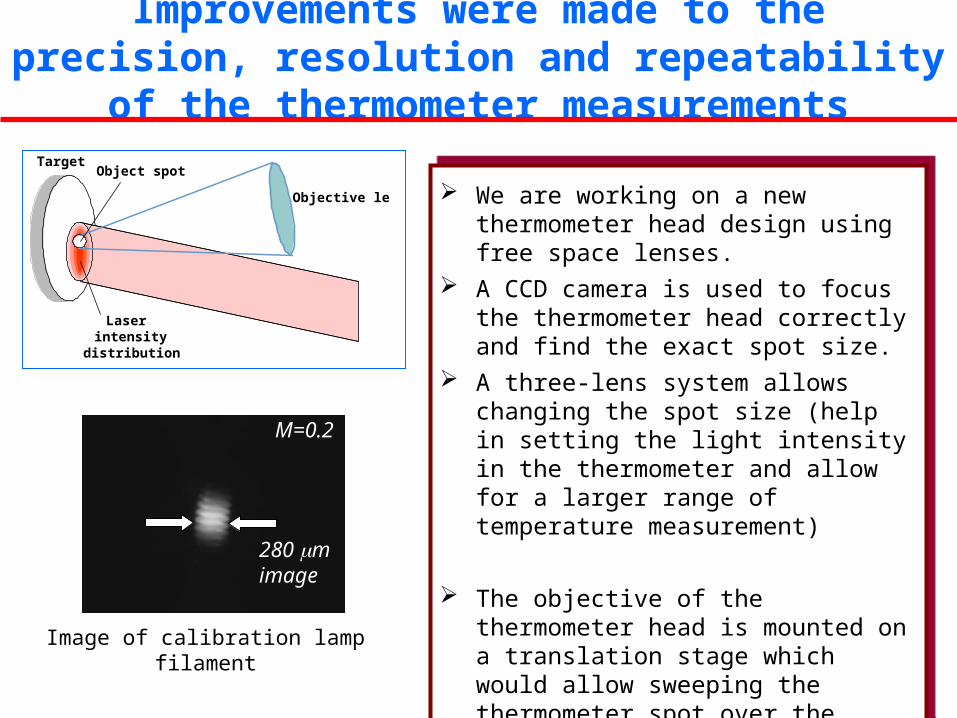
Improvements were made to the precision, resolution and repeatability of the thermometer measurements
Image of calibration lamp filament
280 mimage
M=0.2
Target
Laser intensity
distribution
Object spot
Objective lens We are working on a new thermometer head
design using free space lenses. A CCD camera is used to focus the
thermometer head correctly and find the exact spot size.
A three-lens system allows changing the spot size (help in setting the light intensity in the thermometer and allow for a larger range of temperature measurement)
The objective of the thermometer head is mounted on a translation stage which would allow sweeping the thermometer spot over the laser beam spot and measure temperature profile of the target in real time.
We are working on a new thermometer head design using free space lenses.
A CCD camera is used to focus the thermometer head correctly and find the exact spot size.
A three-lens system allows changing the spot size (help in setting the light intensity in the thermometer and allow for a larger range of temperature measurement)
The objective of the thermometer head is mounted on a translation stage which would allow sweeping the thermometer spot over the laser beam spot and measure temperature profile of the target in real time.
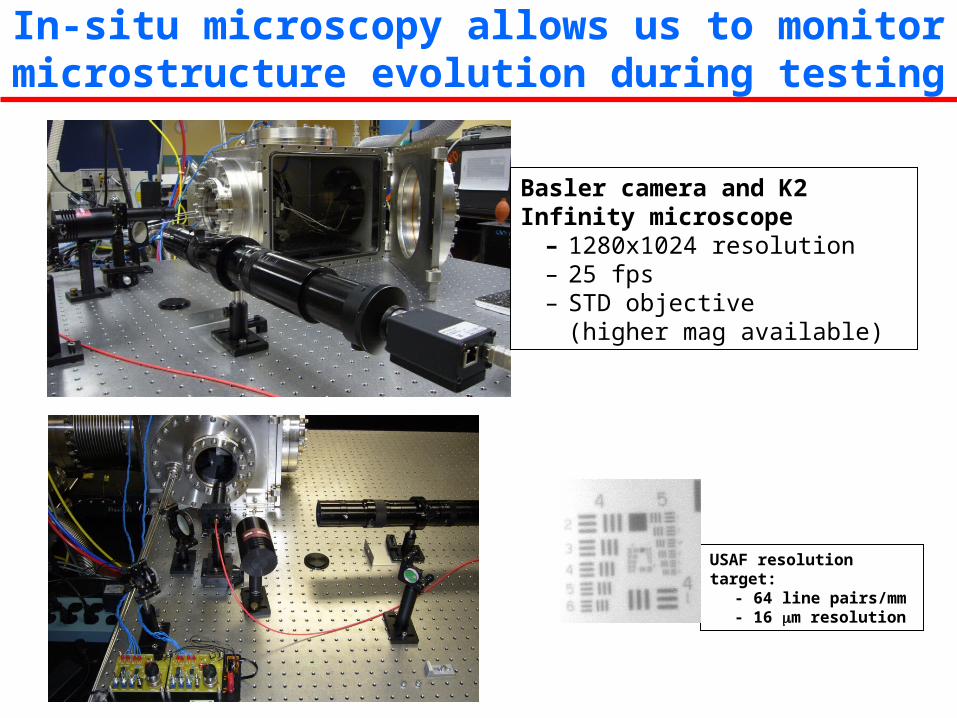
In-situ microscopy allows us to monitor microstructure evolution during testing
Basler camera and K2 Infinity microscope
– 1280x1024 resolution– 25 fps– STD objective
(higher mag available)
USAF resolution target:
- 64 line pairs/mm- 16 m resolution
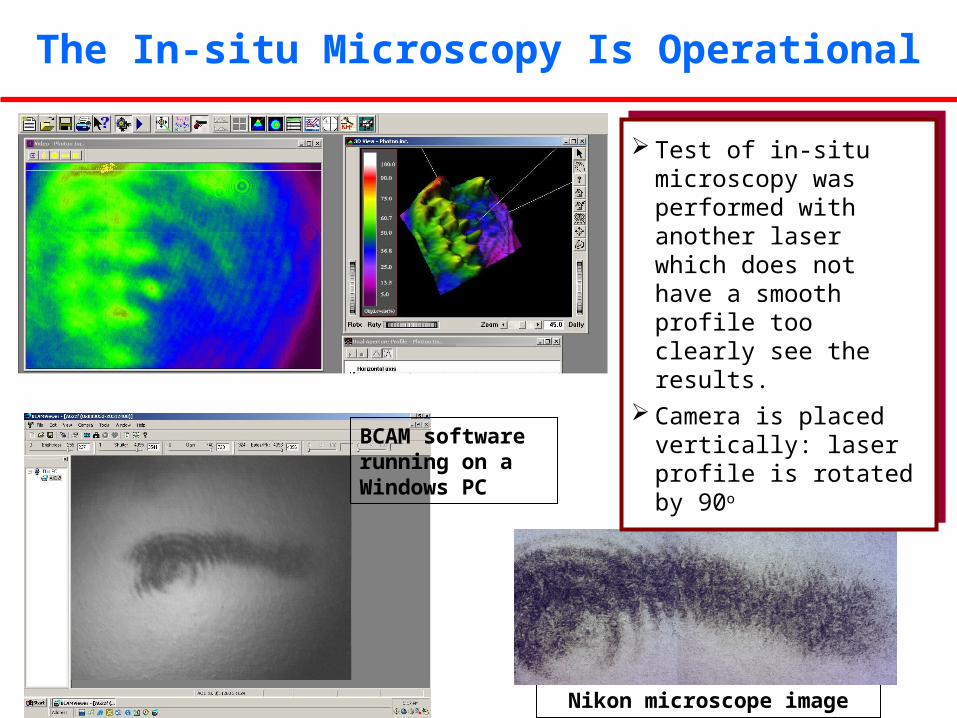
The In-situ Microscopy Is Operational
Nikon microscope image
BCAM software running on a Windows PC
Test of in-situ microscopy was performed with another laser which does not have a smooth profile too clearly see the results.
Camera is placed vertically: laser profile is rotated by 90o
Test of in-situ microscopy was performed with another laser which does not have a smooth profile too clearly see the results.
Camera is placed vertically: laser profile is rotated by 90o
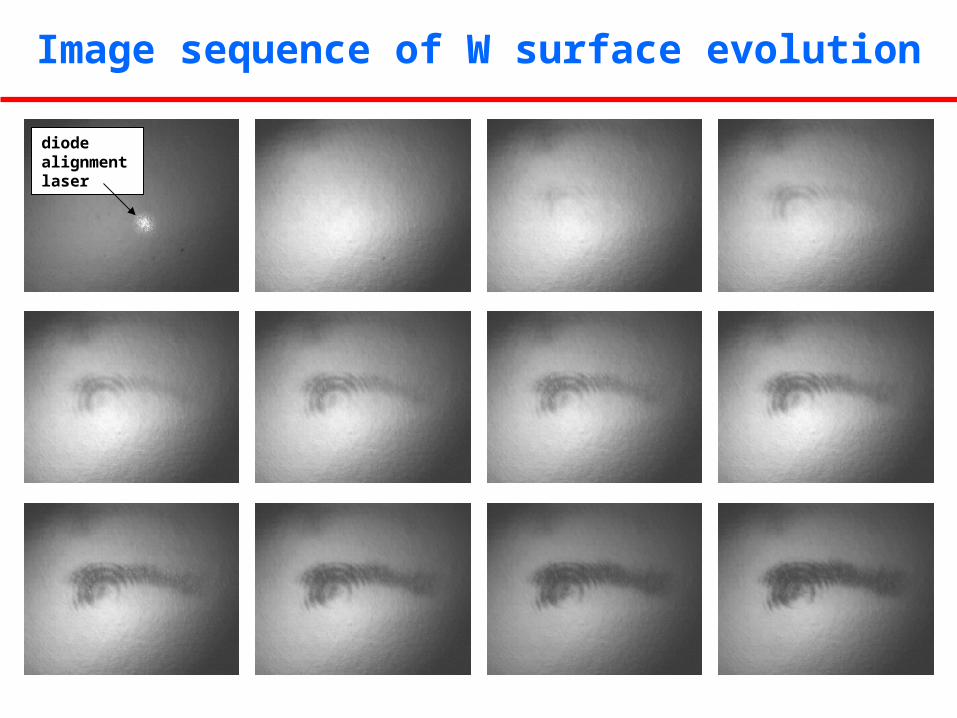
Image sequence of W surface evolution
diode alignment laser
Plans
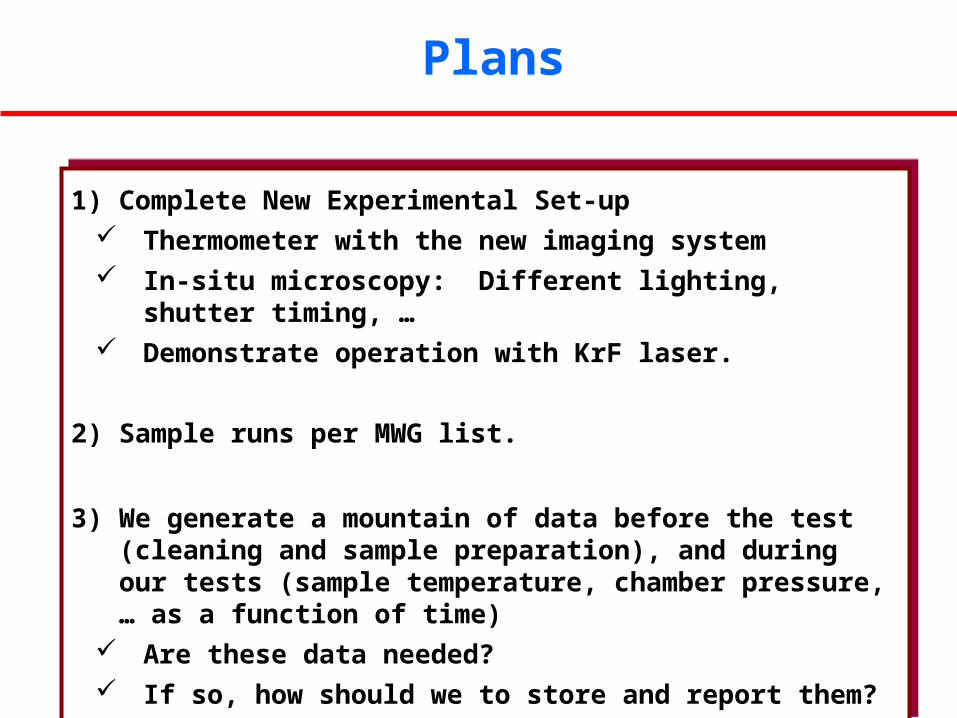
1) Complete New Experimental Set-up Thermometer with the new imaging system In-situ microscopy: Different lighting, shutter timing, … Demonstrate operation with KrF laser.
2) Sample runs per MWG list.
3) We generate a mountain of data before the test (cleaning and sample preparation), and during our tests (sample temperature, chamber pressure, … as a function of time)
Are these data needed? If so, how should we to store and report them?
Extra Slides
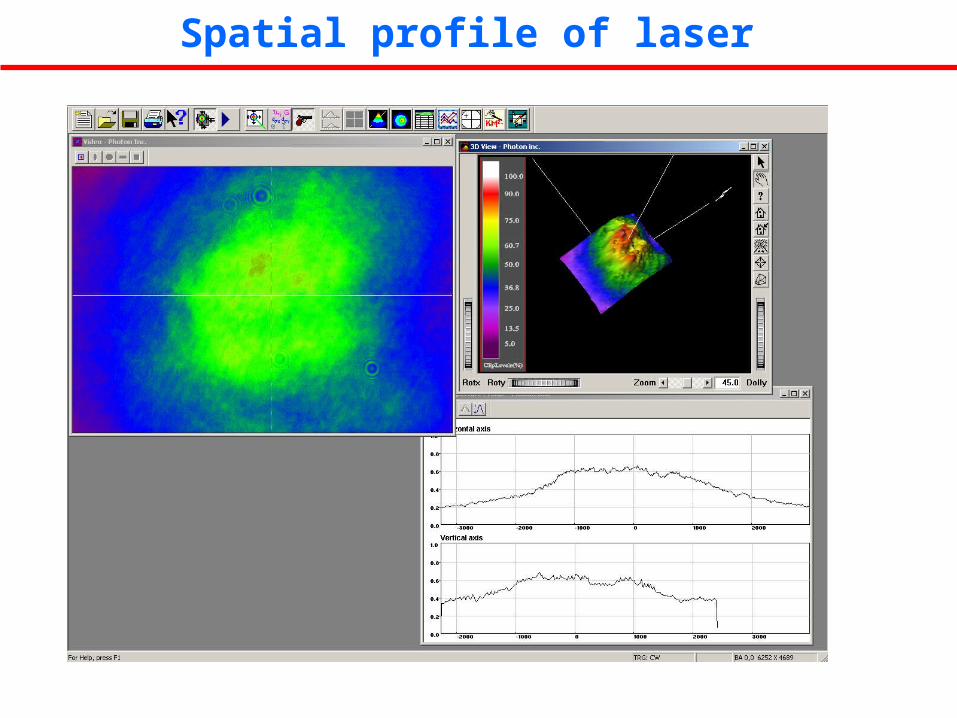
Spatial profile of laser

Spatial profile of laser
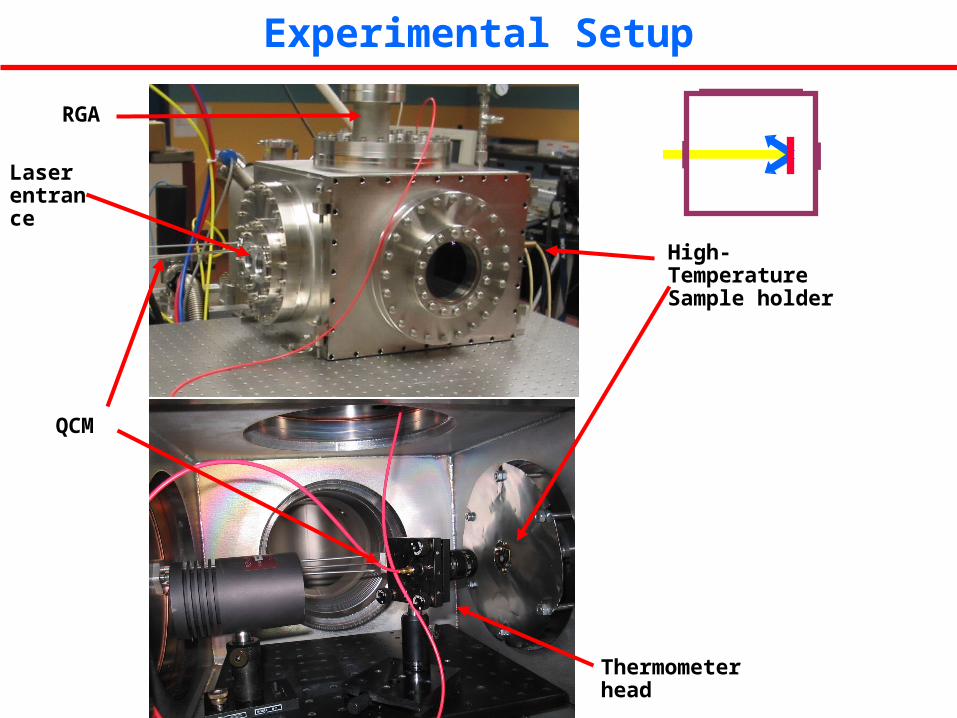
Experimental Setup
High-Temperature Sample holder
Thermometer head
QCM
RGA
Laser entrance
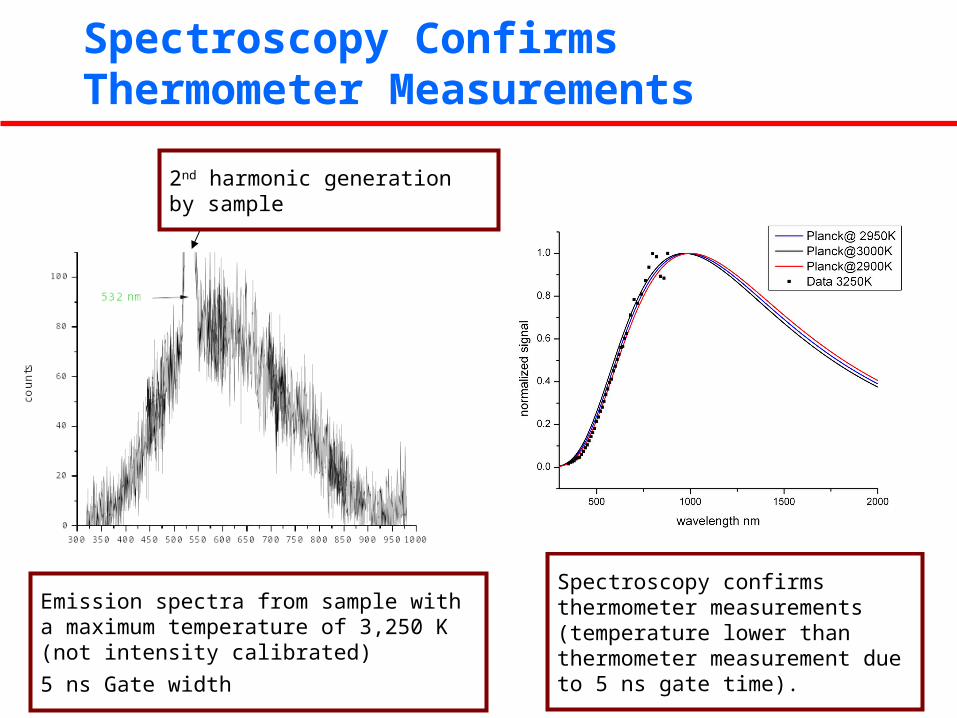
Spectroscopy Confirms Thermometer Measurements
Spectroscopy confirms thermometer measurements (temperature lower than thermometer measurement due to 5 ns gate time).
Emission spectra from sample with a maximum temperature of 3,250 K (not intensity calibrated)
5 ns Gate width
2nd harmonic generation by sample

Sample behavior changes at ~2,500K
1000
1500
2000
2500
3000
3500
0 50 100 150 200 250
Laser Energy (mJ)
Max
imu
m T
emp
erat
ure
(K
)
Room Temperature Sample
500oC Sample
5% Error size

Armor Irradiation Test Matrix
Laser Energy Initial Temp (K) Max. Temp (K) T (K)
11 200 773 2,980 2,200
12 100 773 2,200 1,400
13 85 300 ~1,200 ~900
14 150 300 2,500 2,200
15 150 773 2,700 1,900
16 50 773 ~1,200 ~400
Samples: Powder metallurgy tungsten samples from Lance Snead. All shot at 103, 104, and 105 shots
Laser Energy Initial Temp (K) Max. Temp (K) T (K)
11 200 773 2,980 2,200
12 100 773 2,200 1,400
13 85 300 ~1,200 ~900
14 150 300 2,500 2,200
15 150 773 2,700 1,900
16 50 773 ~1,200 ~400
Samples: Powder metallurgy tungsten samples from Lance Snead. All shot at 103, 104, and 105 shots
No Visible damage on Samples 13 and 16 (i.e., there is even no discoloration at the laser spot)
No Visible damage on Samples 13 and 16 (i.e., there is even no discoloration at the laser spot)
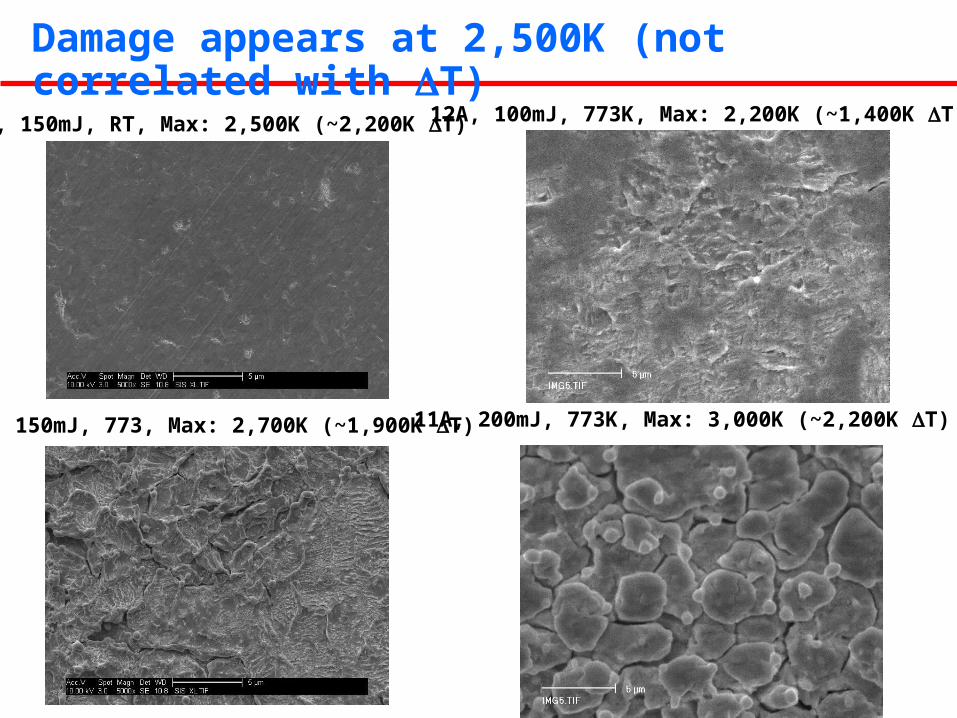
Damage appears at 2,500K (not correlated with T)
12A, 100mJ, 773K, Max: 2,200K (~1,400K T)14A, 150mJ, RT, Max: 2,500K (~2,200K T)
11A, 200mJ, 773K, Max: 3,000K (~2,200K T)15A, 150mJ, 773, Max: 2,700K (~1,900K T)
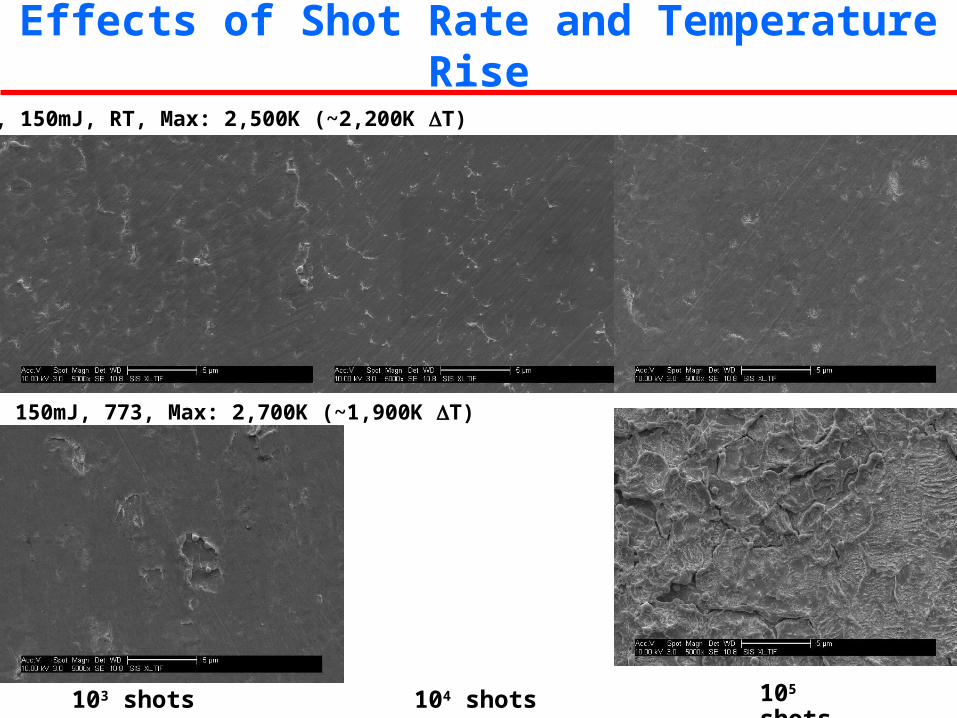
Effects of Shot Rate and Temperature Rise
103 shots 105 shots104 shots
15A, 150mJ, 773, Max: 2,700K (~1,900K T)
14A, 150mJ, RT, Max: 2,500K (~2,200K T)
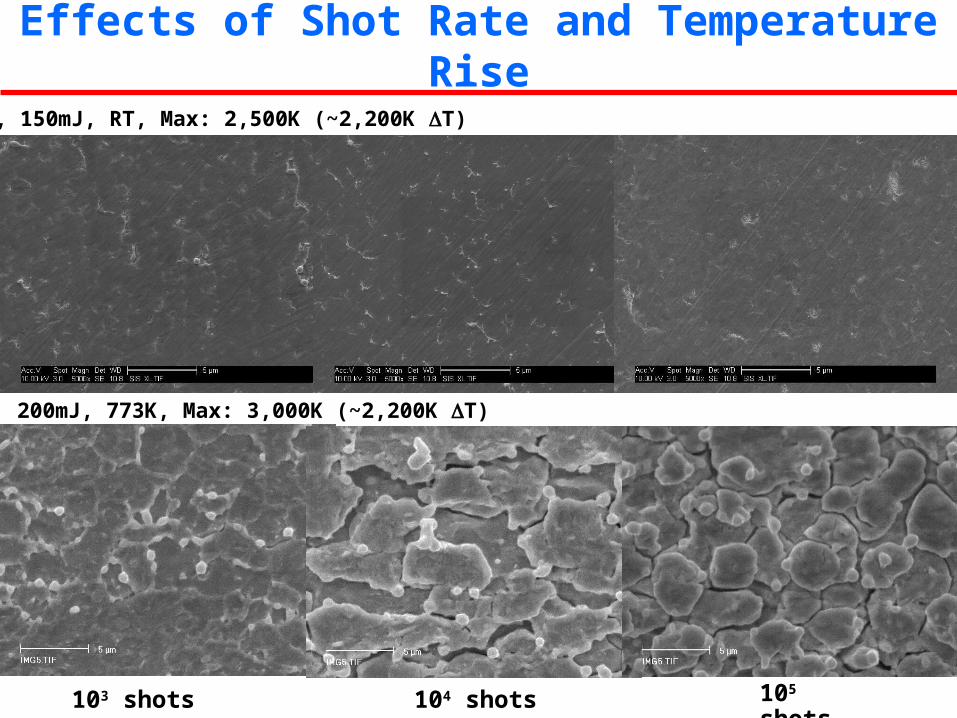
Effects of Shot Rate and Temperature Rise
103 shots 105 shots104 shots
14A, 150mJ, RT, Max: 2,500K (~2,200K T)
11A, 200mJ, 773K, Max: 3,000K (~2,200K T)
Summary and Plans
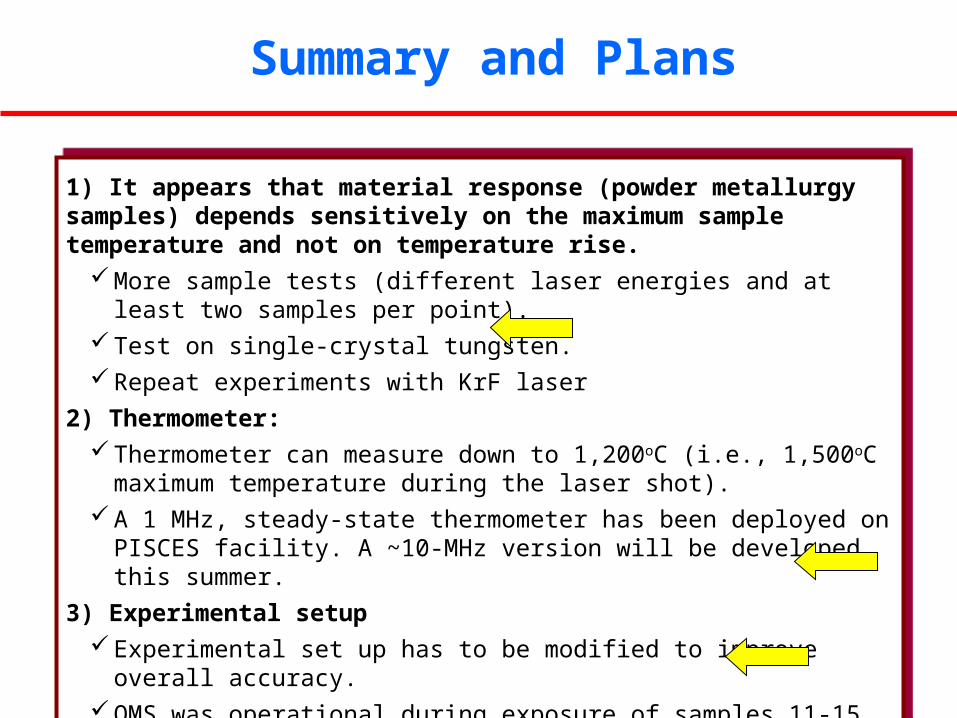
1) It appears that material response (powder metallurgy samples) depends sensitively on the maximum sample temperature and not on temperature rise.
More sample tests (different laser energies and at least two samples per point). Test on single-crystal tungsten. Repeat experiments with KrF laser
2) Thermometer: Thermometer can measure down to 1,200oC (i.e., 1,500oC maximum temperature
during the laser shot). A 1 MHz, steady-state thermometer has been deployed on PISCES facility. A
~10-MHz version will be developed this summer.
3) Experimental setup Experimental set up has to be modified to improve overall accuracy. QMS was operational during exposure of samples 11-15. Material accumulation
on QMS crystal was similar to tests without the sample. We need to establish the baseline for material loss experiments.

Experimental Setup
High-Temperature Sample holder
Thermometer head
QCM
RGA
Laser entrance
Summary and Plans
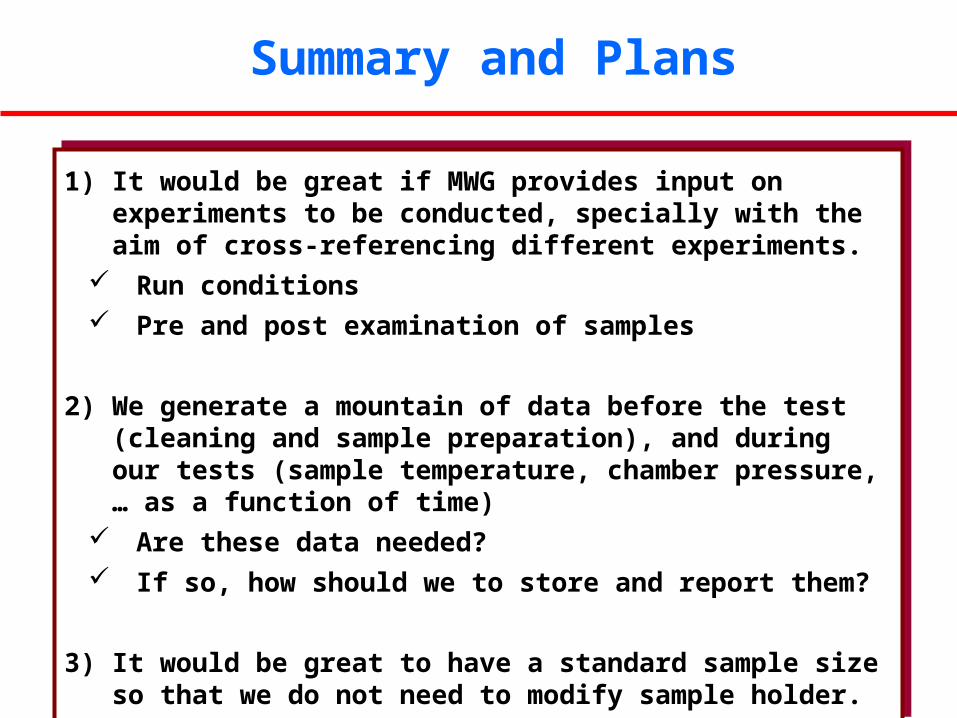
1) It would be great if MWG provides input on experiments to be conducted, specially with the aim of cross-referencing different experiments.
Run conditions Pre and post examination of samples
2) We generate a mountain of data before the test (cleaning and sample preparation), and during our tests (sample temperature, chamber pressure, … as a function of time)
Are these data needed? If so, how should we to store and report them?
3) It would be great to have a standard sample size so that we do not need to modify sample holder.