Embed Size (px)
Citation preview

Authors Annarosa Pesole and Daniel Nepelski
JRC DG CONNECT EURIPIDIS Joint Project nr 32944-2013-09
Universities and Collaborative Innovation in EC-funded Research Projects An Analysis based on Innovation Radar Data
2016
EUR 28355 EN
This publication is a Science for Policy report by the Joint Research Centre (JRC) the European Commissionrsquos
science and knowledge service It aims to provide evidence-based scientific support to the European
policymaking process The scientific output expressed does not imply a policy position of the European
Commission Neither the European Commission nor any person acting on behalf of the Commission is
responsible for the use that might be made of this publication
Contact information [optional element]
Address Edificio Expo C Inca Garcilaso 3 E-41092 Seville Spain
E-mail b06-secjrceceuropaeu
Tel +34 954488318
JRC Science Hub
httpseceuropaeujrc
JRC104870
EUR 28355 EN
PDF ISBN 978-92-79-64630-0 ISSN 1831-9424 doi102791244949
Luxembourg Publications Office of the European Union 2016
copy European Union 2016
The reuse of the document is authorised provided the source is acknowledged and the original meaning or
message of the texts are not distorted The European Commission shall not be held liable for any consequences
stemming from the reuse
How to cite this report Pesole A and D Nepelski (2016) Universities and Collaborative Innovation in EC-
funded Research Projects An Analysis based on Innovation Radar Data JRC Scientific and Policy Reports EUR
28355 EN doi102791244949 Seville
All images copy European Union 2016
Title Universities and Collaborative Innovation in EC-funded Research Projects An Analysis based
on Innovation Radar Data
Abstract
The European Commissions Framework Programme (FP) contributes an important share of RampD expenditure in
Europe For example the Horizon 2020 is the biggest EU Research and Innovation programme ever launched
which makes nearly euro80 billion available over 7 years (2014 to 2020) In addition to financing science and
technology development one of the main objectives of the FP is to foster international collaboration among
research organizations and private firms both large and small Collaboration is a key conduit for innovation-
related knowledge flows for both firms that use RampD and those that are not RampD-active The main idea behind
the Framework Programme is that innovation often results from the interaction and cooperative efforts of
different organisation devoted to the achievement of a common goal This study builds on the first IR report it
extends the number of reviewed projects and it looks at the relationship between the type of innovators and
the potential of their innovations A particular emphasis is put on collaboration between universities and
private organizations Furthermore the report analyses whether universities and private organizations have
different needs and face different bottlenecks to bring their innovations to the market
1
Acknowledgments
This analysis was produced in the context of the European Innovation Policies for the Digital Shift (EURIPIDIS) project jointly launched in 2013 by JRC and DG CONNECT of the European Commission
The authors wish to thank and acknowledge the following experts and colleagues for their valuable input and comments Eoghan ONeill (DG CONNECT) Paul Desruelle (JRC) Vincent Van Roy (JRC) Finally thorough checking and editing of the text by Patricia Farrer is gratefully acknowledged
How to cite this publication
Please cite this publication as
Pesole A and D Nepelski (2016) Universities and Collaborative Innovation in EC-funded Research Projects An Analysis based on Innovation Radar Data JRC Scientific and Policy Reports EUR 28355 EN doi102791244949 Seville
2
Preface
This report was prepared in the context of the three year research project on European Innovation Policies for the Digital Shift (EURIPIDIS) jointly launched in 2013 by JRC and DG CONNECT of the European Commission EURIPIDIS aims to improve understanding of innovation in the ICT sector and of ICT-enabled innovation in the rest of the economy
The projects objective is to provide evidence-based support to the policies instruments and measurement needs of DG CONNECT for enhancing ICT Innovation in Europe in the context of the Digital Single Market for Europe and of the ICT priority of Horizon 2020 It focuses on the improvement of the transfer of best research ideas to the market
EURIPIDIS aims
1 to better understand how ICT innovation works at the level of actors such as firms and also of the ICT innovation system in the EU
2 to assess the EUs current ICT innovation performance by attempting to measure ICT innovation in Europe and by measuring the impact of existing policies and instruments (such as FP7 and Horizon 2020) and
3 to explore and suggest how policy makers could make ICT innovation in the EU work better
This study reports the findings of the Innovation Radar since its launch in May 2014 The Innovation Radar is a DG Connect JRC support initiative which focuses on the identification of innovations with high potential and the key innovators behind them in FP7 CIP and Horizon2020 projects
3
Glossary
CIP Competitiveness and Innovation Framework Programme
Horizon2020 Horizon 2020 is the EU Research and Innovation programme which makes nearly euro80 billion available over 7 years (2014 to 2020)
High Capacity Innovator Innovators with ICI scores at least one standard deviation above the average ICI score
Innovations with high potential Innovations with an IPI score at least one standard deviation above the average IPI score
IAI (Innovators Ability Indicator) A composite indicator used in innovator capacity assessment which
focuses on the innovation performance of an individual organization seen as the key organization behind an innovation
ICI (Innovator Capacity Indicator) A composite indicator used in innovator capacity assessment
ICT FP7 The European Unions Research and Innovation funding programme for 2007-2013 dedicated to Information and Communication Technologies
IEI (Innovators Environment Indicator) A composite indicator used in innovator capacity assessment It focuses on the composition and activity of an inventors partner organizations the performance of the project in terms of innovation and the commitment of relevant partners to exploiting the innovation
IMI (Innovation Management Indicator) A composite indicator used in innovation potential assessment
which focuses on the capability of the management team to take the steps needed to transform a novel technology or research results into marketable products and finally to prepare their commercialisation
Innovation New product process service or other type of innovation identified during the ICT FP7Horizon2020 project review with the help of the Innovation Radar Questionnaire
Innovator Key organization in the ICT FP7Horizon2020 project that delivers an innovation identified during
an ICT FP7Horizon2020 project review with the help of the Innovation Radar Questionnaire
Innovation Radar a joint DG Connect JRC support initiative which focuses on the identification of innovations with high potential and the key innovators behind them in FP7 CIP and Horizon2020 projects and their needs as regards innovation commercialisation
Innovation Radar Questionnaire A questionnaire developed by DG Connect JRC which identifies and analyses innovations in FP7 CIP and Horizon2020 projects
IPI (Innovation Potential Indicator) A composite indicator which aggregates the three indicators ie MPI IRI and IMI used in the assessment of innovation potential
IRI (Innovation Readiness Indicator) A composite indicator used in the assessment of innovation potential
which focuses on the technical maturity of an evolving innovation
Low Capacity Innovator Innovators with an ICI score at least one standard deviation below the average ICI score
Innovations with low potential Innovations with an IPI score at least one standard deviation below the average IPI score
Market Potential Indicator (MPI) A composite indicator used in the assessment of innovation potential which focuses on the demand and supply sides of an innovation
Medium Capacity Innovator Innovators with an ICI score within one standard deviation of the average ICI score
Innovation with medium potential Innovations with an IPI score within one standard deviation of the
average IPI score
4
Table of Contents
Acknowledgments 1
Preface 2
Glossary 3
Table of Contents 4
List of Figures 6
List of Tables 6
Executive Summary 7
1 Introduction 10
2 Innovation Radar Methodology and Data 12
21 Innovation potential assessment framework and indicators 12
22 Innovator capacity assessment framework and indicators 13
23 Normalization of indicator values 14
24 Categories of innovations and innovators 14
25 Data 15
3 Innovations in EC-funded Research Projects 16
31 In a nutshell 16
32 Innovations in the reviewed ICT FP7Horizon2020 projects 16
33 Overview of innovation performance 17
34 Innovations with high potential 18
35 Development stage of innovations 19
36 Type of innovations 19
37 Exploitation and commercialisation of innovations 21
38 Innovation ownership 22
39 Innovations by review time 23
4 Innovators in EC-funded Research Projects 24
41 In a nutshell 24
42 Overview of innovator performance 24
43 Innovators and their innovations 25
44 Type of organizations and their innovations 26
45 High Capacity Innovators 27
46 High Capacity SME Innovators 28
47 Location of innovators 30
48 Innovator capacity and innovation potential 31
5 Universities as Co-innovators in EC-funded Research Projects 33
51 In a nutshell 33
5
52 Collaboration with universities and innovation performance 33
53 Innovation type and collaboration type 35
54 Innovation stage and exploitation plans 36
6 The role of end user engagement for innovation potential 38
61 In a nutshell 38
7 Steps and barriers to innovation commercialisation 41
71 In a nutshell 41
72 Steps to innovation commercialisation 41
73 Innovators need to realise the market potential of innovations 42
74 Type of organization and need to realise the market potential of innovations 43
75 Bottlenecks to innovation commercialization 45
8 Conclusions 46
References 47
6
List of Figures
Figure 1 Construction of the Innovation Potential Indicator 13 Figure 2 Construction of the Innovation Capacity Indicator 14 Figure 3 Innovation potential and innovator capacity scoring system 14 Figure 4 Average values of indicators by innovation potential category 17 Figure 5 Development stage of innovations 19 Figure 6 Innovations developed or being exploited by type and innovation potential category 20 Figure 7 Innovations under development by type and innovation potential category 21 Figure 8 External vs internal exploitation by innovation potential category 22 Figure 9 Innovation ownership by innovation potential category 22 Figure 10 Number of innovations by innovation potential category and review time 23 Figure 11 Average values of indicators by innovator capacity category 25 Figure 12 of innovators by innovator and innovation categories 26 Figure 13 of innovators by organization type 26 Figure 14 of innovators by organization type and innovation potential category 27 Figure 15 Locations of innovators by country 31 Figure 16 Relationship between the innovation potential indicator and innovator capacity indicator values 32 Figure 17 of innovators by collaboration type and innovation potential category 34 Figure 18 Linear estimates of innovation potential indicators and innovation partnerships 35 Figure 19 of innovators by collaboration and innovation type 36 Figure 20 of innovators by collaboration type and innovation development 37 Figure 21 End user engagement by innovation potential 39 Figure 22 End user engagement by partners commitment and innovation performance 40 Figure 23 Progress of projects in bringing innovations to the market 42 Figure 24 Innovators needs to fulfil the market potential of their innovations 43 Figure 25 Innovators need to fulfil the market potential by organisation type 44 Figure 26 Marginal effects of potential market needs by organisation type 44 Figure 27 External bottlenecks that compromise the ability of project partners to exploit innovations 45
List of Tables
Table 1 Innovations in ICT FP7Horizon2020 projects ndash key facts 17 Table 2 Description of the top 10 innovations and the key organizations behind them 18 Table 3 Top 10 High capacity innovators and their innovations 28 Table 4 Top 10 SMEs and their innovations 29
7
Executive Summary
The Innovation Radar (IR) is part of the 3 year EURIPIDIS project which is a joint
DG ConnectJRC support initiative launched in August 2013 The IR focuses on the identification of
innovations with high potential and the key innovators behind them in ICT FP7 CIP and Horizon
2020 projects1 Today the IR provides up-to-date intelligence on the innovative output of EU-
funded research projects and guidance on how to leverage this by suggesting a range of targeted actions that can help these innovations to fulfil their potential in the market place
This study builds on a first report that presented the IR methodology and first results (De Prato et al 2015) by extending the number of projects reviewed and also looking at the relationship between the type of innovators and the potential of their innovations Particular emphasis is put on projects where there is collaboration between universities and private organizations Furthermore the report analyses whether universities and private organizations face different needs and bottlenecks in bringing their innovations to the market
What is the innovative output of EC-funded research projects
ICT FP7CIP projects deliver a substantial number of innovations On average nearly 2 new or
substantially improved products or services are developed within each project Most of the
innovations are related to data processing or software development whereas only a few of them are related to hardware development
Most of the innovations that are still under development are classified as innovations with medium potential Thus this is the group of innovations that requires the most attention and support to increase their commercialisation chances This can be achieved by addressing the shortcomings of the innovations and or the innovatorsrsquo needs that are vital for the delivery of these innovations to the market In particular innovation management can be described as the innovatorsrsquo biggest weakness They may need to clarify issues of innovation ownership prepare business plans
and market studies or secure investment for further development and commercialisation of
their innovative outputs
Market potential and readiness of innovations
Commercial exploitation is planned for over 63 of these innovations and for almost all the innovations with high potential Currently 12 of the innovations are already being exploited either on the market or internally by a partner organization However 28 of the
innovations that are already mature are not being exploited yet This includes nearly 50 of the innovations with high potential
Bearing in mind that 74 of the innovations with high potential belong to projects that are in their final stages one can conclude that new ideas and technologies developed during EU-funded research projects mature and increase their potential as the projects advance
The amount of project funding does not seem to affect the potential of the innovation
Innovators in EC-funded research projects
Innovations with high potential are often delivered by SMEs In fact 44 of the organizations behind these innovations are SMEs This is nearly three times more than the share of SMEs that participate in ICT FP7 Hence it can be assumed that SMEs are important vehicles for co-creating
1 Innovation is defined as new product process service or other types of innovation as defined by Oslo
Manual that are identified during ICT FP7CIP project review with the help of the Innovation Radar Questionnaire Innovators are key organization in the ICT FP7CIP project delivering an innovation identified during ICT FP7CIP project review with the help of the Innovation Radar For a detailed methodological description see the first Innovation Radar report (De Prato Nepelski amp Piroli 2015)
8
and commercialising the innovative technologies developed within ICT FP7 projects Second it is the category that includes universities and research organizations Altogether about 28 of the key organizations behind innovations with high potential are universities or research centres 22 of the organizations that participate in the development of innovations with high potential are large
There is a strong geographic concentration of innovators Germany the UK Italy and Spain are the countries with the most organizations identified as key players in delivering innovations
There is a positive relationship between an innovators capacity score and innovation
potential However a high score in one indicator does not automatically translate into high performance in another Often high capacity innovators participate in delivering innovations with low or medium potential and low capacity innovators were identified as key organizations in developing innovations with medium potential Improving overall innovative performance requires a focus on both the innovations and the organizations behind them
The role of universities as co-innovators
70 of innovations with high potential are co-developed with universities Collaboration
between universities and SMEs seems to be particularly fruitful
New products are co-developed considerably more often in the course of collaboration that involves universities Although private-private partnerships are also an important source of new products these partnerships show equal interest in developing new processes services and organizational methods This may suggest that universities are a source of new products that are then channelled through private organizations to the market Thus considering that universities often report that what they most need in order to bring their innovation to the market is partnership with other companies one can conclude that universities are seeking
complementary capabilities to help them commercialise their technologies These capabilities can be brought in by private organizations often SMEs This is emphasized by the finding that innovations co-developed with universities have equal chances of commercial
exploitation as those that are introduced by private-private collaborations
Universities and private organizations have to meet different needs in order to fulfil the
market potential of their innovations Universities tend to report more needs related to the
finalisation of the innovation and the subsequent steps to bring it to the market Private organisations needs are more related to the commercialization of the innovation and the need to create or expand their market ie scaling-up
The ecosystem of collaborative innovation of EC-funded research projects
Innovations produced within EU-funded research projects are a result of collaborative work On average there are 19 innovators per innovation
Among the over 1000 participants identified as key innovators Nr 1 is Arduino SA a global
leader in Open Source Software and Hardware development Internet-enabled worldwide collaboration leads to a transformation of the modes of innovation OSS and Linux are prime examples of innovative products developed outside hierarchical top-down vertically-integrated firms such as IBM and Microsoft The decentralized mode of innovation has become the model for software development and is increasingly being used for hardware development By being on the front-line of this transformation Arduino a European-based technology platform is setting the standards and direction for the emergence of future technologies Behind its success lies collaboration among global community members who contribute to a common pool of resources
Consulting end-users in innovation processes is a source of ideas and feedback It increases the innovation potential
9
Collaboration between heterogeneous organizations leads to synergies by combining the complementary capabilities of each partner Partnership with other organizations is one of the main needs of innovators in EC-funded research projects
Steps and barriers to innovation commercialisation
When taking innovations to the market projects tend to focus on technology-related steps over business-related ones For example 65 of the projects that plan to commercialise their innovations either created or plan to create a prototype In contrast only 39 of projects have carried out or plan to carry out a market study Writing a business plan is on the agenda of only 36 of projects that plan innovation commercialisation Hence in order to increase the chances of successful commercialisation of an innovative output projects must take into account more than the technological aspects and introduce business-related elements into their organizations
activities
Projects that involve interactions with external actors are relatively uncommon For example only 45 to 9 of the projects have sought or are planning to seek private or public funding At the same time one of the most common needs of key organizations trying to deliver innovations is partnership with other companies This creates a demand for opening-up projects
to more interactions with external specialised actors eg business coaches or venture capitalists who could help to improve the chances of commercialising innovations
Financing is seen as the main external barrier to innovation exploitation 307 of project
partners see lack of finance as a barrier to exploiting their innovative products or services However there seems to be a contradiction between what they claim to be a barrier and
their actual behaviour ie only between 45 and 9 of the projects have sought or are
planning to seek private or public funding Moreover between 40 and 33 of the projects do not plan to seek capital or public investment On the other hand organizations claim that in order to fulfil their innovationsrsquo market potential their primary need is partnerships with other companies and business plan development
10
1 Introduction
The European Commissions Framework Programme (FP) constitutes an important share in RampD expenditures in Europe For example the Horizon 2020 is the biggest EU Research and Innovation
programme ever launched making nearly euro80 billion of funding available over 7 years (2014 to 2020) In addition to financing science and technology development one of the main objectives of the FP is to foster international collaboration among research organizations and private firms both large and small Collaboration is a key conduit for innovation-related knowledge flows for firms that use RampD (either internally developed or externally acquired) and also for those that are not RampD-active (OECD 2015) The main idea behind this is that innovation often results from the interaction and cooperative efforts of different organisations devoted to the achievement of a common goal The importance of collaboration for innovation is generally well accepted (Chesbrough 2003 von Hippel 2005)
Despite the fact that fostering collaboration is among the key objectives of EC-funded organizations the impact of bringing universities research organizations and private firms together to produce technological and innovative output is unclear The reason for this is diverging motivations and objectives of the different types of organizations that participate in EC-funded research projects For example universities are looking mainly for complementary resources that allow them to advance basic research (Caloghirou Tsakanikas amp Vonortas 2001 Polt Vonortas amp Fisher 2008) They are more motivated by the opportunity to build up new knowledge and technology capabilities and to investigate new research areas than they are by technology commercialisation In contrast SMEs have explicit goals related to innovation outputs such as developing a prototype a patentable technology or a complementary technology that will enhance competitiveness (Polt et al 2008) They focus on projects with an applied orientation and engage only in cooperative agreements that are likely to yield tangible benefits guaranteeing them immediate survival and growth Large firms also have different motives for participating in joint projects with universities and other firms In general they appear much less inclined to commercialise directly from the project than SMEs (Hernan Marin amp Siotis 2003) Larger companies participate in collaborative RampD projects in order to carry out technology watch acquire new knowledge and build partnerships
Considering that various types of organizations are driven by various motivations to participate to EC-funded research projects one can expect that these dissimilarities are likely to affect the efforts of various partners the outcomes of collaboration and how their results are appropriated by among them For example large firms are less willing to share their economic knowledge with smaller rivals and have a preference to collaborate with other large firms in order to maximize the internalization of spillovers (Roumlller Siebert amp Tombak 2007) Moreover as many research collaboration projects do not lead straight to economic benefits (Siebert 1996) diversity in firm size and efficiency level can impede effective RampD collaboration The same applies to collaborations between companies and universities It was found that the impact of collaboration with a university depends on the company size (Okamuro 2007) In general SMEs can benefit more from RampD collaboration with universities rather than larger firms
In order to improve our understanding of the collaborative innovation efforts in EC-funded research projects the current study builds on the first release of the Innovation Radar (IR) (De Prato et al 2015) Between October 2014 and January 2016 603 projects were reviewed using the IR Questionnaire In addition to the several background aspects the IR takes into account in order to assess the process of innovation development the maturity of the innovation the actions needed to fulfil the market potential of innovation this document looks also at innovation collaboration patterns In particular it analyses whether collaboration affects differently innovation according to the organisation type involved eg university SME or large firm and the engagement of end-users
This report is structured as follows Section 2 briefly reviews the methodological details of the IR assessment frameworks to identify innovations and innovators in EC-funded research projects and
11
describes the underlying data Sections 3 and 4 present the results of the innovation potential assessment and the innovator capacity assessment respectively Section 5 analyses whether different types of partnerships matter for the innovative outcome with a particular emphasis on universities as co-inventors Section 6 describes the impact of end-user engagement on projects innovation performance Section 7 shows the responses to the questions about steps that project consortia have taken to bring innovations to the market and what kind of obstacles to innovation commercialisation they have found Section 8 summarises the main lessons learned
12
2 Innovation Radar Methodology and Data
The Innovation Radar methodology uses two assessment frameworks one for ranking innovations and the other for ranking of innovators A detailed description of the construction of both the frameworks and the indicators used can be found in the first Innovation Radar Report (De Prato et al 2015) Below the key methodological elements are briefly presented
21 Innovation potential assessment framework and indicators
The innovation potential assessment framework includes a set of criteria and indicators which assess the strength of each innovation in terms of innovation readiness innovation management and market potential
Innovation readiness Innovation readiness relates to the technical maturity of an evolving innovation It takes into account the development phases of the innovation eg conceptualization experimentation or commercialisation It also looks at the steps that were taken in order to prepare an innovation for commercialisation (eg prototyping demonstration or testing activities or a feasibility study) and to secure the necessary technological resources (eg skills to bring the innovation to the market) In addition this criterion takes into account the development stage of an innovation and the time to its potential commercialisation It is measured by the Innovation Readiness Indicator (IRI)
Innovation management This criterion assesses the project consortium and its commitment to
bring an innovation to the market an element that is often seen as the most important success indicator of a technology venture It aims to research or confirm the capability of the projectrsquos development andor management team to execute the steps necessary for transforming a novel technology or research results into a marketable product and finally to prepare its commercialisation These steps may include for example clarifying the related ownership and IPR issues preparing a business plan or market study securing capital investment from public andor private sources or engaging an end-user in the project Innovation management is measured by the Innovation Management Indicator (IMI)
Market potential This criterion relates to the demand and supply side of an innovation Regarding the demand side it assesses the prospective size of the market for a product and the chances of it being successfully commercialised It looks at whether the product satisfies a market sector and if there is a potential customer base With respect to the supply side it assesses whether there are potential barriers eg regulatory frameworks or existing IPR issues which could weaken the commercial exploitation of an innovation In the current undertaking the focus is placed on the supply side This is mostly because information on markets for individual innovations is not available Market potential is measured by the Market Potential Indicator (MPI)
The three indicators described above ie IRI IMI and MPI are used to construct the final Innovation Potential Indicator (IPI) As all three elements are considered equally important for the successful commercialization of an innovation equal weighting is applied see Figure 1
13
Figure 1 Construction of the Innovation Potential Indicator
Source JRC
22 Innovator capacity assessment framework and indicators
The second assessment framework of the Innovation Radar ranks innovators It concentrates on two issues First how well do organizations seen as key innovators perform as regards innovation Second in what kind of environment are these organizations located It includes a set of criteria and indicators which assess the capacity of organizations identified as key deliverers of innovations
Innovators ability This relates to the innovation performance of an individual organization that is seen as the key organization behind an innovation The ability of an organization is measured mainly by its innovative output within the FP7 activities By output we mean the number of innovations each organization contributes to and the potential of these innovations where the innovation potential is a product of the innovation potential assessment as defined above In addition when assessing an innovators ability factors such as a reviewers opinion about the innovators potential or independence in realising the market potential of an innovation are taken into account Innovators ability is measured by Innovators Ability Indicator (IAI)
Innovators environment this criterion aims to capture the overall conditions that an innovator faces It is mainly related to the overall composition and activities of partner organizations the performance of the project in terms of innovation and the commitment of relevant partners to exploiting the innovation Moreover it also takes into account the presence of organizations that are directly interested in applying or exploiting the innovations eg end-users It is assumed that a positive environment overall will have a positive spill over effect on the innovator and vice-versa Innovators environment is measured by Innovators Environment Indicator (IEI)
Both indicators IAI and IEI are used to construct the Innovator Capacity Indicator (ICI) The value of the ICI is an arithmetic aggregate of the values of the IAI and IEI (see Figure 2)
14
Figure 2 Construction of the Innovation Capacity Indicator
Source JRC
23 Normalization of indicator values
In order to make the values of each indicator for different innovations and innovators as easily comparable as possible a normalisation procedure is applied Observed values for each indicator are brought to the scale between 0 and 100 in the following way
100
ScoreMax
ScoreObserved
ScoreNormalizedIndicator
IndicatorIndicator (1)
24 Categories of innovations and innovators
In order to facilitate the interpretation of the results the IR study introduces three categories of innovations ie low medium and high potential and also of innovators ie low medium and high capacity Figure 3 shows how innovations and innovators are assigned to each of the three categories based on their score on the IPI for innovations and ICI for innovators
Figure 3 Innovation potential and innovator capacity scoring system
Calculations JRC
Data European Commission DG Connect
Note The figure presents average scores across all four innovation potential assessment indicators ie IRI IMI MPI and IPI as defined in section 21 Total number of reviewed projects 603 Total number of innovations 1128 Review period 01102014 and 18012016
15
25 Data
The Innovation Radar initiative is an ongoing process that was launched in August 2013 The data collection process started in May 2014 and the data used in the current report was collected during periodic reviews of ICT FP7CIP of 603 projects The reviews which took place between October 2014 and January 2016 were based on the IR Questionnaire and were conducted by external experts commissioned by DG Connect In addition to the standard review procedure DG Connect deployed the Innovation Radar questionnaire during the same period to spot innovations originating from the FP7 projects and the key organizations behind them For a detailed description of data collection please see the first Innovation Radar report (De Prato et al 2015)
16
3 Innovations in EC-funded Research Projects
This section presents the innovation potential assessment results It covers the following points
The overall and average innovative output of ICT FP7Horizon2020 projects
Overview of the innovation performance of innovations
Presentation of innovations with high potential and their characteristics including the main organizations behind them
Categorisation of innovations by their type eg product process or service innovations
Presentation of plans to commercialise and exploit innovations
Presentation of the structure of innovation ownership
Overview of innovations by review type
31 In a nutshell
The main findings of the innovation potential assessment can be summarised as follows
A typical ICT FP7Horizon2020 project produces 187 innovations
There are 19 innovators per innovation on average
Market potential and innovation readiness are among the strongest dimensions of the ICT FP7Horizon2020 innovations while the most room for improvement is found in innovation management
Most of the innovations are in data processing or software development and only a few innovations are in hardware development
50 of key organizations behind the top 10 innovations are SMEs
12 of all innovations are already being exploited either on the market or within a partner organization However 28 of innovations that are already mature are not being exploited yet
58 of innovations that have already been developed or are being exploited are either new products or significantly improved products
Commercial exploitation is planned for over 63 of all innovations and almost all those Innovations that have high potential
Although 55 of the innovations have multiple owners 67 of those with high potential or 114 of all the innovations have a clearly defined owner
74 of innovations with high potential belong to projects that have been through their final review and are therefore in their final stages Thus it can be assumed that new ideas and technologies developed during EU-financed projects mature and increase their potential as projects advance
32 Innovations in the reviewed ICT FP7Horizon2020 projects
According to
Table 1 between October 2014 and January 2016 603 projects were reviewed using the IR
Questionnaire As a result 1128 innovations were identified This means that on average an ICT FP7Horizon2020 project produces nearly 2 innovations 1036 distinct organizations could be considered as key organisations in delivering these innovations The average number of innovators per innovation was 19
17
Table 1 Innovations in ICT FP7Horizon2020 projects ndash key facts
Review period 01102014 and 18012016
Number of reviewed projects 603
Number of innovations 1128
Number of distinct innovators 1036
Average number of innovations per project 187
Average number of innovators per innovation 19 Source JRC
Data European Commission DG Connect
33 Overview of innovation performance
Figure 4 presents the summary statistics of the three innovation potential assessment sub-indicators ie Innovation Readiness (IRI) Innovation Management (IMI) Market Potential (MPI) and the composite Innovation Potential (IPI) for all the innovations analysed by innovation potential category Figure 4 presents the average values of the indicators across innovation potential categories and shows the distribution of the IPI values
The average value of the IPI among all the innovations is 4497 out of the total 100 points This number varies between 2471 and 6782 for innovations in the low and high potential categories The innovation with the highest score obtained 8833 points while the lowest-ranked innovation only 125 points When looking at the individual sub-indicators one can observe that MPI has the highest and the IMI has the lowest average value The average MPI score is 6054 and the average IMP score is 3604 points The average score of the IRI is 3834 points
Figure 4 Average values of indicators by innovation potential category
Calculations JRC
Data European Commission DG Connect
Note The figure presents average scores across all four innovation potential assessment indicators ie IRI IMI MPI and IPI as defined in section 21 Total number of reviewed projects 603 Total number of innovations 1128 Review period 01102014 and 18012016
Based on the presented evidence it can be concluded that on average market potential and innovation readiness are among the strongest dimensions of innovations from the reviewed ICT FP7Horizon2020 projects In contrast innovation management represents the weakest dimension of these innovations Hence in order to increase the potential of these innovations steps such as
18
clarifying the ownership of the innovation preparing a business plan carrying out a market study or securing investment must be taken 34 Innovations with high potential
Table 2 shows detailed descriptions of 10 innovations with the highest IPI score together with the name and organization type of the key organizations behind them Most of the innovations are in data processing or software development Altogether there are 12 entities behind the top innovations Only in one case ndash that of RELEASE_B ndash is more than one organization identified as the key organizations behind an innovation For the remaining innovations only one innovator was identified Interestingly SMEs and higher education and schools and research centres (HESREC) account for 42 of all organizations Only 2 of the organizations are large companies
Table 2 Description of the top 10 innovations and the key organizations behind them
Rank by IPI
Innovation Innovation description Key
Organisations Organisation
type
1 GET HOME
SAFE_A
Affordable and professional driving simulation tool Main USP separation between driving tasks and core part of the system
DEUTSCHES FORSCHUNGSZE
NTRUM FUER KUENSTLICHE INTELLIGENZ
GMBH
REC
2 RELEASE_A
The Wombat OAM system is a broker layer able to deploy ERLANG applications on top of cloud or super-clusters of smaller heterogeneous clusters managing dynamically scaling on the base of capability profile matching
ERLANG SOLUTIONS
LIMITED SME
3 RELEASE_B
The scalable Erlang Virtual Machine is able to provide improved load balancing mechanism and to interrupt long running garbage collection thus making the language more responsive and scalable The Virtual machine also provides more concurrent access to shared data held in ETS tables
UPPSALA UNIVERSITET
HES
ERICSSON AB PRC
INSTITUTE OF COMMUNICATION AND COMPUTER
SYSTEMS
REC
4 SCI-BUS_A
CloudBroker Platform one point of connection - unified interface to different commercial clouds enables users to provide their self-developed applications workflows data products and other software to be exploited commercially
CLOUDBROKER GMBH
SME
5 CUBRIK_B
The Gamification Framework (GF) enables organizations to add game elements to business applications to boost customer engagement activity and loyalty
WEBRATIO SRL SME
6 LiMoSINe_A
The innovation is about self-learning search and recommendation systems able to learn to optimize themselves while people are interacting with them Self-learning search and recommendation systems add value to businesses because they improve user engagement which correlates with increase in revenue
UNIVERSITEIT VAN AMSTERDAM
HES
7 Trilogy 2_A The Federated Market is a market-place for the buying and selling of VM resources across distributed cloud provider Data Centres
ONAPP LIMITED SME
8 GREENHospi
tal_C
Web-EMCS is a software platform that simplifies the integration among subsystems at the field layer realized with heterogeneous standards
AEA srl PRC
9 MateCat_A
The MateCat tool is a Web-based open source computer-assisted translation (CAT) tool which puts together the best environment for post-editing and translation and a marketplace for outsourcing translation projects
TRANSLATED SRL
SME
10 COMPASS_A Novel test strategy for automated equivalence class partition testing of complex systems with guaranteed error detection capabilities
UNIVERSITAET BREMEN
HES
Calculations JRC Data European Commission DG Connect Note The table presents the list of 10 innovations with high potential with the highest IPI score as defined in Section 21 Organization classes HESREC (Higher Education and Schools and Research Centres) PUB (Public Bodies) SMEs (Small Medium Enterprise) PRC (Large companies) OTHER (Other organisations) Total number of reviewed projects 603 Total number of innovations 1128 Review period 01102014 and
19
18012016
35 Development stage of innovations
Figure 5 shows the distribution of innovations by stage of development and innovation potential category According to this information 61 of the innovations are under development and 12 of are already being exploited they are either on the market or are being used within a partner organization However more than 25 of innovations are already developed but not being exploited About 45 of innovations with high potential belong to this category The other 43 with the highest IPI scores are already being exploited and the remaining 12 are under development
Figure 5 Development stage of innovations
Calculations JRC
Data European Commission DG Connect
Note The computations were based on the responses to question 3 of the Innovation Radar Questionnaire Total number of reviewed projects 603 Total number of innovations 1128 Review period 01102014 and 18012016
36 Type of innovations
Figure 6 shows the types of innovations that are developed or being exploited and Figure 7 shows types of innovations that are still under development In both cases a breakdown by innovation potential category is given According to Figure 6 most of the innovations that are already developed or being exploited are either new products or significantly improved existing products Altogether these two types account for around 58 of all developed innovations The second largest group of innovation types represent new services or significantly improved services These two categories account for 22 of all developed innovations
Of the different types of innovation one can see that the new products or significantly improved products include a relatively large share of innovations with high potential Innovations in these two groups account for 223 of all developed innovations
According to Figure 7 most of the innovations that are still under development (531) are product innovations A very large share of innovations in this group ie 78 is made up of innovations with medium potential Thus this is the group of innovations that requires further nurturing in order to exploit its potential
20
Figure 6 Innovations developed or being exploited by type and innovation potential
category
Calculations JRC
Data European Commission DG Connect
Note The computations were based on the responses to question 4 of the Innovation Radar Questionnaire Total number of reviewed projects 603 Total number of innovations 1128 Review period 01102014 and 18012016
21
Figure 7 Innovations under development by type and innovation potential category
Calculations JRC
Data European Commission DG Connect
Note The computations were based on the responses to question 4 of the Innovation Radar Questionnaire Total number of reviewed projects 603 Total number of innovations 1128 Review period 01102014 and 18012016
37 Exploitation and commercialisation of innovations
Figure 8 shows the breakdown of innovations by exploitation and innovation potential category A distinction between commercial and internal exploitation is made According to this information commercial exploitation is planned for 63 of all innovations and for almost all innovations with high potential Only 05 of innovations with high potential are exploited internally whereas over 23 of all innovations are Internal exploitation is expected to take place through changes in organization new internal process implementation etc The remaining innovations ie 13 are not planned to be introduced to the market or exploited internally
22
Figure 8 External vs internal exploitation by innovation potential category
Calculations JRC
Data European Commission DG Connect
Note The computations were based on the responses to question 6 of the Innovation Radar Questionnaire Total number of reviewed projects 603 Total number of innovations 1128 Review period 01102014 and 18012016
38 Innovation ownership
Figure 9 presents the information on innovation ownership and innovation potential category A distinction between innovations with one clear owner and multiple owners is made 45 of all innovations have a clear owner while the ownership rights of the remaining innovations belong to multiple owners The majority innovations with high potential (ie 67) have clearly defined ownership whereas only 114 of the total number of innovations do
Figure 9 Innovation ownership by innovation potential category
Calculations JRC
Data European Commission DG Connect
Note The computations were based on the responses to question 8 of the Innovation Radar Questionnaire Total number of reviewed projects 603 Total number of innovations 1128 Review period 01102014 and 18012016
23
39 Innovations by review time
During their lifecycle ICT FP7Horizon2020 projects go through three review rounds The reviews are conducted by a panel of independent evaluators who are recognized specialists in the relevant fields In addition to the standard reviews the Innovation Radar Questionnaire was applied to ongoing projects Hence the IR covers and assesses innovations and innovators that belong to projects at different stages of their lifecycle Figure 10 presents a breakdown of innovations by review time and innovation potential category 22 of all innovations belong to projects that were reviewed for the first time 35 of innovations were produced within projects that were reviewed for the second time and the remaining 428 of innovations originate from projects in their final stages
Regarding innovation potential and review time 44 of all innovations are classified as innovations with low potential and belong to projects that were reviewed for the first time This percentage goes down to 37 for innovations with low potential in projects in their final stages By the same token only 06 of all innovations are classified as innovations with high potential and they originate from projects that were reviewed for the first time However the percentage of innovations with high potential rises to 126 of all innovations for projects in their final stages Thus one can observe a relatively clear pattern while the share of innovations with low potential decreases as projects mature the reverse is true innovations with high potential
Figure 10 Number of innovations by innovation potential category and review time
Calculations JRC
Data European Commission DG Connect
Note The figure includes the count of innovations based on the project review time and innovation performance according to the IPI as defined in Section 21 Review type concerns one of the three reviews each FP7 project is subject to during its lifecycle Total number of reviewed projects 603 Total number of innovations 1128 Review period 01102014 and 18012016
24
4 Innovators in EC-funded Research Projects
This section presents the innovator capacity assessment results The analysis addresses the following points
Summary of innovator capacity performance
Presentation of high capacity Innovators and SMEs that are high capacity innovators
Overview of organizations by their type and innovations
Location of innovators
Relationship between the scores for innovator capacity and innovation potential
41 In a nutshell
The main findings of the innovator capacity assessment can be summarised as follows
On average innovators profit from an innovation-favourable environment However the quality of an innovation environment is not equal for all innovators The reason for this is that some projects do not engage end-users in the consortium or relevant partners may lack the necessary commitment to exploiting the innovation
44 of all organizations behind innovations with high potential are SMEs and in general there is a positive link between an innovations potential and an SME being involved in its development Hence it can be assumed that SMEs are important vehicles for co-creating and commercialising innovative technologies developed within ICT FP7 projects
The countries with the most organizations identified as key players in delivering the innovations are Germany (1566) the UK (1351) Italy (1179) and Spain (1174)
There is a positive relationship between an organisations innovator capacity score and the innovation potential score of the innovation the development of which this organisation is contributing to However a high score in one indicator does not automatically translate into a high performance in the other Often high capacity innovators participate in delivering innovations with low or medium potential and low capacity innovators are identified as key organizations in developing innovations with medium potential Thus improving the overall performance of innovative output requires a focus on both innovations and the organizations behind them
Among over 1000 participants identified as key innovators Nr 1 is Arduino SA a global leader in Open Source Software and Hardware development Arduino is a European-based technology platform which sets the standards of global collaborative development of future technologies
42 Overview of innovator performance
Figure 11 summarises the statistics on the two sub-innovator capacity assessment indicators ie Innovators Ability (IAI) Innovators Environment (IEI) and a composite Innovator Capacity Indicator (ICI) for all key organizations in delivering the innovations and by innovator capacity category Figure 11 shows the distribution of the ICI average values across innovator capacity categories
The average value of the ICI among all 1128 innovators is 534 out of 100 points This number varies from 242 to 687 for low to high capacity innovators The innovator with the highest score obtained 9441 points while the lowest-ranking innovator obtained only 12 points Looking at the individual sub-indicators one can observe that IEI has the highest average value among high and medium capacity innovators The average IEI score is 639 and the average IAI score is 429 points However looking at the standard deviation values of both indicators (respectively 221 and 15) one can see that IEI scores are much more volatile than those of IAI In other words the quality of the innovation environment is not equal for all innovators This happens as some projects do not
25
engage end-users in the consortium or because the relevant partners are not sufficiently committed to exploiting the innovation
Figure 11 Average values of indicators by innovator capacity category
Calculations JRC
Data European Commission DG Connect
Note The figure shows the average scores of innovators across three assessment indicators IAI IEI and ICI defined in section 0 Innovators are defined as key organization behind the innovation according to the answers to the question 12 of the Innovation Radar Questionnaire Total number of reviewed projects 603 Total number of innovations 1128 Review period 01102014 and 18012016
43 Innovators and their innovations
Figure 12 shows the distribution of innovators by innovator capacity and innovation potential category It can be seen that 282 of high capacity innovators were identified as key organizations in delivering innovations with high potential 669 of innovators in this category participate in developing innovations with medium potential and only 49 innovations with low potential Regarding the medium capacity innovators category 8 of organizations were responsible for the development of innovations with high potential and 761 for those with medium potential The distribution patterns in the last category ie low capacity innovators are consistent Indeed the majority of innovators in this category participate in delivering innovations with low potential (598) The remaining 402 deliver innovations with medium potential while none of the Low Capacity innovators delivers innovations with high potential
26
Figure 12 of innovators by innovator and innovation categories
Calculations JRC
Data European Commission DG Connect
Note The figure shows breakdown of innovators by Innovator Capacity and Innovation Potential category Innovators are defined as key organization behind the innovation according to the answers to the question 12 of the Innovation Radar Questionnaire Total number of reviewed projects 603 Total number of innovations 1128 Review period 01102014 and 18012016
44 Type of organizations and their innovations
Figure 13 presents the distribution of key organizations in delivering innovations that were identified during the reviews by organization type 54 of innovators are Higher Education and Schools and Research Centres (HESREC) 23 are SMEs and 19 are large enterprises
Figure 13 of innovators by organization type
Calculations JRC
Data European Commission DG Connect
Note The figure presents the breakdown of innovators by organization type Innovators are defined as key organization behind the innovation according to the question 12 of the Innovation Radar Questionnaire Organization types HESREC (Higher Education and Schools and Research Centres) PUB (Public Bodies) SMEs (Small Medium Enterprise) LARGE (Large companies) OTH (Other organisations) Total number of reviewed projects 603 Total number of innovations 1128 Review period 01102014 and 18012016
27
Figure 14 presents the distribution of key organization type for each innovation potential category 44 of the key organisations behind innovations with high potential are SMEs This is more than three times the share of SMEs in total participation SMEs accounted in FP7 for 16 of total participations and 15 of total EC funding (EC-CONNECT 2013) Second in this comparison is the category including HESREC Altogether about 28 of all key organizations behind innovations with high potential are universities or research centres whereas 22 of them are large companies
In innovations with low and medium potential the situation is reversed HESREC is the largest group of organizations behind these innovations and SMEs are the second largest group In both categories large companies remain in third position For example HESRECs account for 37 and SMEs for 35 of all organizations participating in the development of innovations with medium potential
In general there is a positive link between an innovations potential and an SME being involved in its development Hence it can be assumed that SMEs are important vehicles for co-creating and commercialising innovative technologies developed within ICT FP7 projects
Figure 14 of innovators by organization type and innovation potential category
Calculations JRC
Data European Commission DG Connect
Note The figures presents the breakdown of innovators by organization type and innovation potential of their innovations Innovators are defined as key organization behind the innovation according to the answers to the question 12 of the Innovation Radar Questionnaire Organization types HESREC (Higher Education and Schools and Research Centres) PUB (Public Bodies) SMEs (Small Medium Enterprise) LARGE (Large companies) OTH (Other organisations) Total number of reviewed projects 603 Total number of innovations 1128 Review period 01102014 and 18012016
45 High Capacity Innovators
Table 3 presents the top 10 innovators from the IR sample with the highest ICI scores together with their names organization type place of origin and innovations in which they were identified as being key organizations The organization with the highest ICI score is Arduino SA directly followed by Native Instruments GMBH Both are private organizations the first is an SME while the second is a large enterprise Altogether the top 10 high capacity innovators participated in the development of 24 innovations Regarding the potential of the innovations of the top 10 innovators 13 (54) are innovations with high potential 10 (42) have medium potential and only 1 (4) has low potential In other words high capacity innovators are also associated with innovations with higher potential
28
The majority of the top 10 high capacity innovators (50) are SMEs The remaining 50 is equally distributed between large companies and higher education and schools and research centres
Table 3 Top 10 High capacity innovators and their innovations
Rank by ICI
Organistaion name Organisation
type Country Region Project innovation Nr
Innovation Potential
1 ARDUINO SA SME SWITZERLAND TICINO
SOCIALampSMART_A 1 High
SOCIALampSMART_B 2 High
PELARS_A 3 Medium
2 NATIVE INSTRUMENTS
GMBH PRC GERMANY BERLIN
GiantSteps_B 4 High
GiantSteps_A 5 Medium
3 PERVOICE SPA PRC ITALY
EU-BRIDGE_A 6 High
EU-BRIDGE_B 7 High
4 HELIATEK GMBH SME GERMANY DRESDEN KREISFREIE
STADT X10D_A 8
High
5 UNIVERSITAET BREMEN HES GERMANY BREMEN
KREISFREIE STADT
SAPHARI_A 9 High
COMPASS_A 10 High
6 SIEMENS
AKTIENGESELLSCHAFT PRC GERMANY
MUumlNCHEN KREISFREIE
STADT
MD PAEDIGREE_A 11 Medium
MD PAEDIGREE_C 12 Medium
MD PAEDIGREE_B 13 Medium
CONCERTO_B 14 Medium
MSP_A 15 Medium
STREETLIFE_C 16 Medium
7 ERLANG SOLUTIONS
LIMITED SME UNITED KINGDOM BERKSHIRE
RELEASE_A 17 High
PROWESS_A 18 High
8 THE CHANCELLOR MASTERS
AND SCHOLARS OF THE UNIVERSITY OF CAMBRIDGE
HES UNITED KINGDOM ESSEX CC
PARLANCE_B 19 High
ASC-Inclusion_A 20 High
APhome_A 21 Low
BrainScaleS_B 22 Medium
9 EPIGAN BVBA SME BELGIUM ARR LEUVEN HiPoSwitch_A 23 High
10 WORLDSENSING SLNE SME SPAIN BARCELONA RELYonIT_A 24 Medium
Calculations JRC
Data European Commission DG Connect
Note The table presents the list and characteristics of High Capacity Innovators as defined in section 24 and their innovations Innovators are defined as key organization behind the innovation according to the answers to the question 12 of the Innovation Radar Questionnaire Organization types HESREC (Higher Education and Schools and Research Centres) PUB (Public Bodies) SMEs (Small Medium Enterprise) PRC (Large companies) OTH (Other organisations) Total number of reviewed projects 603 Total number of innovations 1128 Review period 01102014 and 18012016
46 High Capacity SME Innovators
Table 4 presents the top 10 SME innovators with the highest ICI score together with their names place of origin and innovations in which they were identified as key organizations These organizations were identified as key organizations in the development of a total of 11 innovations
The SME with the highest ICI score is Arduino Arduino is an open-source electronics platform based on easy-to-use hardware and software2 Arduino was identified as a key organization in the SOCIALampSMART project whose goal was to build up a physical and computational networked infrastructure which allowed household appliances to better meet the needs of their owners Launched in 2005 Arduinos electronic prototyping platform became a major technological platforms which enabled users to create interactive electronic objects Between October 2014 and January 2016 the IR identified 3 innovations for which Arduino was identified as a key
2 httpswwwarduinocc
29
organization For example together with partners like Gorenje a leading European manufacturer of home appliances Arduino was involved in the development of a new WiFi controlling platform for home IoT As a result Gorenjersquos advanced fridge has been enhanced with a WiFi enabled solution which is expected to be put on the market within the next two years
30
Box 1 provides an overview of the development of Arduino and its global community which is becoming one of the major global technological platforms of software and hardware development
Regarding the potential of the innovations of the top 10 SME nnovators 4 were recognised as innovations with high potential The remaining six are innovations with medium potential
Table 4 Top 10 SMEs and their innovations
Rank by ICI Organisation name Country Region Project Innovation Innovation Potential
1 ARDUINO SA SWITZERLAND TICINO SOCIALampSMART_A High Innovation Potential
5 HELIATEK GMBH GERMANY DRESDEN KREISFREIE STADT X10D_A High Innovation Potential
8 ERLANG SOLUTIONS LIMITED
UNITED KINGDOM BERKSHIRE RELEASE_A
High Innovation Potential
10 EPIGAN BVBA BELGIUM ARR LEUVEN HiPoSwitch_A High Innovation Potential
11 DATALASE LTD UNITED KINGDOM UV-Marking_B
Medium Innovation Potential
12 WORLDSENSING SLNE SPAIN BARCELONA RELYonIT_A Medium Innovation Potential
14 2ND QUADRANT LIMITED
UNITED KINGDOM KENT CC AXLE_A
Medium Innovation Potential
17 ONTOTEXT AD BULGARIA SOFIA PHEME_B Medium Innovation Potential
21 STICHTING EUROPEANA THE NETHERLANDS
AGGLOMERATIE S-GRAVENHAGE
EAwareness_C Medium Innovation Potential EAwareness_B
24 SPARSITY SL SPAIN BARCELONA LDBC_C Medium Innovation Potential
Calculations JRC
Data European Commission DG Connect
Note The table presents the list and characteristics of SMEs High Capacity Innovators as defined in section 24 and their innovations Innovators are defined as key organization behind the innovation according to the answers the question 12 of the Innovation Radar Questionnaire Total number of reviewed projects 603 Total number of innovations 1128 Review period 01102014 and 18012016
31
Box 1 Arduino ndash Nr 1 innovator among 1000 organizations participating in the EC-
funded research projects
Arduino is an open-source electronics platform based on easy-to-use hardware and software Arduino boards are able to read inputs (eg light on a sensor a finger on a button or a Twitter message) and turn them into outputs (eg activating a motor turning on an LED publishing something online) Users can tell their boards what to do by sending a set of instructions to the microcontroller on the board To do so they use the Arduino programming language (based on Wiring) and the Arduino Software (IDE) based on Processing
Arduino was developed at the Ivrea Interaction Design Institute Italy as an easy tool for fast prototyping and was aimed at students without electronics and programming backgrounds Soon afterwards it was released under a Creative Commons licence As it gained populairity and acceptance among user-innovators the Arduino board started changing to adapt to new needs and challenges It differentiated its offer from simple 8-bit boards to products for IoT applications wearables 3D printing and embedded environments All Arduino boards are open-source which empower users to build them independently and eventually adapt them to their particular needs The software is also open-source and is growing through the contributions of users worldwide (Evans 2011)
The key element of the Arduino ecosystem is the community around it (Evans 2011) The community of makers has contributed to the Arduino ecosystem by developing code and libraries designing new hardware teaching workshops and classes and sharing what they have made Arduino is now being taught in high schools colleges and universities everywhere around the world It is assumed that the number of Arduino members increases by 100000 per month (SJTU 2015) A large share of the users and developers come from developing countries In China for example a large part of the community is made up of teachers They play a critical role in the development of the Arduino ecosystem They publish documents that can be used to teach Arduino technology in schools and educate new generations of Arduino community members
When we look at the Arduino case we see that the technological networks that work on these issues include growing numbers of organizations and individuals Moreover the concept of Arduino opens up possibilities that go clearly far beyond hobby activities and have real economic impacts Today there is already a range of open source hardware products including synthesizers MP3 players amplifiers high-end voice-over-IP phone routers mobile phones and laptops (Thompson 2008) The Arduino ecosystem allows the creation of infrastructure for large technological projects like smart homes or IoT
There are already a number of companies that have built their business models around the Arduino ecosystem For example most of the 13 largest open source hardware companies that in 2010 earned approximately $50 Mln in revenues operate within the Arduino community (Torrone amp Fried 2010) By 2010 all of them earned at least $1 Mln in revenues and most of them earned nearer $5 Mln and were involved in hundreds of projects
Like Linux for software Arduino is an example of how the process of innovation has evolved over the last few decades The development and production of advanced technological products is increasingly taking place within collaborative user communities rather than within a single integrated hierarchical organization
47 Location of innovators
Figure 15 provides a list of countries with the total number of innovators for each Germany has the most over 15 of all the key organizations involved in delivering the innovations are from Germany The UK has 1351 of the total number of innovators Italy has 1179 and Spain
32
(1174) Innovators located outside the EU are from Switzerland Norway Israel Turkey Australia South Africa Kenya Philippines Canada and the US
Figure 15 Locations of innovators by country
Calculations JRC
Data European Commission DG Connect
Note The figure includes locations of innovators by country of origin ie key organizations in delivering innovations identified in the answers to the question the question 12 of the Innovation Radar Questionnaire Average IPI score as defined in section 21 corresponds to the innovations to which innovators from relevant location contribute Total number of reviewed projects 603 Total number of innovations 1128 Review period 01102014 and 18012016
48 Innovator capacity and innovation potential
Figure 16 shows the relationship between the innovation potential indicator and innovator capacity indicator values The correlation coefficient of the two indicators is 045 Thus although overall it can be said that there is a positive relationship between the two indicators a high score in one indicator does not translate into high performance in the other In other words as demonstrated in Section 43 there are high capacity innovators that participate in delivering innovations with low or medium potential By the same token there are low capacity innovators that were identified as key organizations in developing innovations with high potential
The best illustration of the fact that there is no clear-cut relationship between innovator and innovation performance is that innovations with medium potential dominate in all categories of innovator capacity For example as shown in Figure 12 more than half of all the high capacity innovators (669) were identified as key organizations in delivering innovations with medium potential This number is even higher for medium capacity innovators (76 1)
The above observation leads to the conclusion that improving the overall performance of innovative output requires a focus on both the innovations and the organizations behind them In
33
the case of innovations the focus is on increasing their market potential or improving their management In turn expanding innovators capacity requires efforts by individual organizations to increase their performance However this also depends on their environment which can positively or negatively affect their innovative outputs
Figure 16 Relationship between the innovation potential indicator and innovator
capacity indicator values
20
40
60
80
10
0
Inno
vato
r C
apa
city Ind
ica
tor
20 40 60 80 100Innovation Potential Indicator
Calculations JRC
Data European Commission DG Connect
Note The figure presents the relationship between innovation IPI score as defined in section 21 and the ICI score of the key organization behind the innovation Total number of reviewed projects 603 Total number of innovations 1128 Review period 01102014 and 18012016
34
5 Universities as Co-innovators in EC-funded Research Projects
This section tackles questions related to the involvement of different types of organizations in innovation activities the results of these collaborations and the role of universities as co-inventors in EC-funded research projects by
Looking at the relationship between innovation potential and various types of organizations identified as key innovators (Section 52)
Reporting on the type of innovations developed by different combinations of organizations (Section 53)
Analysing whether the type of organizations has implications for the innovation development stage and their exploitation plans (section 54)
This is complemented by an analysis of whether different types of organizations exhibit different needs with respect to innovation commercialisation (Section 73)
51 In a nutshell
The main findings of the analysis of universities as co-innovators are that
Of the innovations with high potential universities and research centres deliver about 28 whereas SMEs deliver about 44 However universities are identified as key co-innovators in over 70 of all the innovations with high potential
Collaboration between universities and SMEs delivers the largest share of innovations with high potential (approx 31) followed by collaboration between private organisations
Collaboration between universities and SMEs seems to be more fruitful than between universities and large firms
New products are considerably more often co-developed in the course of collaboration involving universities Although private-private partnerships are also an important source of new products they show equal interest in developing new processes and organizational methods This may suggest that universities are the source of new products that are then channelled through private organizations to the market
Innovations co-developed with universities have equal chances of commercial exploitation as those introduced by private-private collaborations
52 Collaboration with universities and innovation performance
This section looks at the relationship between innovation potential and the type of organizations involved in its development In particular it looks at the question of whether there is a difference in the potential of innovations that were (co-) developed by universities and private organizations ie SMEs and large enterprises
Figure 13 and Figure 14 present the distribution of the different organisation types by innovation potential Higher education and schools and research centres (HESREC) make up the lions share of the organisations sample (54) However they only deliver about 28 of innovations with high potential - less than SMEs which deliver about 44
When focussing on cooperation SMEs are still the pull for the development of innovations with high potential Figure 17 shows the distribution of pairwise cooperation by innovation potential for all the innovations reviewed Collaboration between higher education and schools and research centres and SMEs (Uni_Sme) delivers the highest share of innovations with high potential (around 31) This is followed by collaboration between HESREC and large organisations (Uni_Large) with 248 The innovation resulting from these two types of collaboration and the collaboration
35
between private organisations (Firm_Firm3) are increasing in innovation potential On the other hand when higher education and schools and research centres collaborate among themselves (Uni_Uni) the innovation potential of the innovative outcome decreasesl as shown by the 154 innovations with high potential and the 445 innovations with low potential However it has to be taken into account that the Innovation Radar targets innovations that have the potential to be brought to the market in the near future As discussed above consistent with their status and mission the main reason universities participate in EU-funded research projects is to develop research and technology Therefore the critical issue is collaboration between private organizations aiming at commercialisation of the research results
Figure 17 of innovators by collaboration type and innovation potential category
Calculations JRC
Data European Commission DG Connect
Note Innovators are defined as key organization behind the innovation according to the answers to the question 12 of the Innovation Radar Questionnaire Collaboration types Uni_Uni (Higher Education and Schools and Research Centres) Uni_Sme (Higher Education and Schools and Research Centres and SMEs) Uni_Large (Higher Education and Schools and Research Centres and Large companies) Large_Sme (Large companies and SMEs) Firm_Firm (private organisations of the same entity ie Large_Large or Sme_Sme) Total number of reviewed projects 603 Total number of innovations 1128 Review period 01102014 and 18012016
Taking into account the above and in order to see what type of collaboration increases the innovation potential and commercialization of innovations developed in EU-funded research project an additional analysis was performed Figure 18 presents the coefficient estimated by a linear regression model which investigates the impact of different types of collaboration and project characteristics ie the time of the review (when the project was evaluated) and the EC contribution to the project on innovation potential The reference baseline of the regression model is collaboration between HESREC (Uni_Uni) and first project review Regarding the collaboration type the collaboration between private organizations (Sme_Smes Large_Large and Large_Sme) had the strongest effect on innovation potential On average the potential score of innovation co-developed by at least two private firms is about 10 points higher than it is when an innovation is co-developed by universities Collaboration between SMEs has the highest coefficient Again this does not come as a surprise as firms have stronger incentives and capacities to bring technology to the market Therefore what is considerably more interesting is the effect of collaboration between universities and different types of private firms There one can observe that innovations
3 The category Firm_Firm is built taking into account all the collaborations between private organisations
of the same entity That is either Large_Large or Sme_Sme
36
co-developed by universities and SMEs have on average higher innovation potential scores than those co-developed by universities and large firms Whereas innovations co-developed between universities and SMEs have a 48 point higher score as compared to the reference point those that are co-developed by universities and large firms have a score of only 43 This observation is consistent with previous findings that indicate that SMEs benefit more than large firms from collaboration with universities in publicly-funded research projects (Okamuro 2007)
As expected a review later in the life of the project finds that the average value of the innovations developed has increased This confirms previous observations which suggest that ideas and technologies developed during EU-funded research projects mature and increase their potential as projects advance On the other hand the amount of EC funding allocated to the project does not seem to affect the potential of the innovation
Figure 18 Linear estimates of innovation potential indicators and innovation
partnerships
Calculations JRC
Data European Commission DG Connect
Note OLS robust standard errors number of observation 1426 R-squared 014 Total number of reviewed projects 603 Total number of innovations 1128 Review period 01102014 and 18012016
To conclude the importance of SMEs in delivering innovations with high potential is observed also when looking at the different type of collaboration between projects Interestingly enough when private organisations pair together they increase their probability of delivering innovations with high potential while the same is not true for HESREC This may suggest the need for support for HESREC to increase the market potential of the innovations developed
53 Innovation type and collaboration type
The Innovation Radar characterises the types of innovation by distinguishing between new or significantly improved product process service marketing and organisational method Based on this information Figure 19 presents the relationship between the mix of organizations involved in innovation (co-) development and the type of innovation
37
Over 50 of the innovations are product innovations followed by service and process At the same time very few innovations belong to organisational and marketing method that accounts for only 3 of the total innovation output4 As shown by the figure the distribution of the innovation type is relatively stable across the different organisation composition However new products are considerably more often co-developed in the course of collaboration involving universities For example 63 of innovations developed by university and SMEs are new product In contrast only 51 of innovations delivered as a result of collaboration between SMEs and large firms are new products The remaining half represents innovations that can be described as new processes services or organizational methods This can suggest that universities are a source of novel technologies that are channelled through private organizations to the market
Figure 19 of innovators by collaboration and innovation type
Calculations JRC
Data European Commission DG Connect
Note Innovators are defined as key organization behind the innovation according to the answers to the question 12 of the Innovation Radar Questionnaire Collaboration types Uni_Uni (Higher Education and Schools and Research Centres) Uni_Sme (Higher Education and Schools and Research Centres and SMEs) Uni_Large (Higher Education and Schools and Research Centres and Large companies) Large_Sme (Large companies and SMEs) Firm_Firm (private organisations of the same entity ie Large_Large or Sme_Sme) Total number of reviewed projects 603 Total number of innovations 1128 Review period 01102014 and 18012016
54 Innovation stage and exploitation plans
This section deals with the question of whether there is a pattern in the innovation development stage and exploitation plans depending on the type of organizations involved in its (co-) development The idea is that organisations of different types may apply for EC projects at different stages of their innovation development Indeed one could expect that private organisations may apply for public funding after having already initiated the development of the innovation while universities are more likely to start innovation development after having been granted public funding
Figure 20 shows the percentage of innovators by cooperation type and innovation development Figure 20 shows there is no clear pattern Even when focussing on collaboration between organisations of same type the relative differences between innovation stages are negligible and do not bring additional information on the exploitation plans deployed by the distinct organisations
4 For simplicity of presentation possible innovation output was grouped into four categories combining
organisational and marketing method
38
In order to ensure the results were not influenced by when the review took place we also analysed jointly the different types of collaboration at the different stages of the review process The results didnt show any major differences across organisation type apart from a general trend for all organisations towards a higher percentage of innovations Already developed but not yet being exploited and innovations Being exploited in the final period of the project
Figure 20 of innovators by collaboration type and innovation development
Calculations JRC
Data European Commission DG Connect
Note Innovators are defined as key organization behind the innovation according to the answers to the question 12 of the Innovation Radar Questionnaire Collaboration types Uni_Uni (Higher Education and Schools and Research Centres) Uni_Sme (Higher Education and Schools and Research Centres and SMEs) Uni_Large (Higher Education and Schools and Research Centres and Large companies) Large_Sme (Large companies and SMEs) Firm_Firm (private organisations of the same entity ie Large_Large or Sme_Sme) Total number of reviewed projects 603 Total number of innovations 1128 Review period 01102014 and 18012016
39
6 The role of end user engagement for innovation potential
In the past decades the innovation model has shifted from a linear model where end-users intervene only at the very end of the process to a more collaborative model where end-users actively contribute to the innovation process The increasing importance of the role of end-users in innovation processes has been highlighted in the work of Chesbrough (2003) and von Hippel (2005) who both recognize end-users as important sources of valuable ideas for firms The Innovation Radar recognises the importance of end-users being close to the innovation process and reports on the engagement of end-users in the project consortium Below we show how the engagement of end-users affects the innovation potential of the projects
61 In a nutshell
The analysis of end user engagement in the project consortium produced the following main findings
There is a positive relation between the engagement of end-users and innovation potential High Innovation potential projects report the highest share of end-users engagement The share of end-users engagement inside the consortium is 64 and 33 for end-users outside the consortium
End-users engagementndash both internal and external to the consortium- positively affects the level of commitment of relevant partner in exploiting the innovation Projects with high shares of end-users engagement (32 when end-users are inside the consortium and 16 when outside the consortium) show a High level of partners commitment
40
Figure 21 shows the distribution of end-users across projects by innovation potential End-users could either belong to the consortium or be external to the project High innovation potential projects report the overall highest share of end-user engagement 64 (part of the consortium) and 33 (outside the consortium) Interestingly the low innovation potential projects account for the lowest rate of end-user engagement Indeed the percentage of low innovation potential projects that declare no end-user engagement is above 30 We do not have the necessary information for assessing whether a causal relation between end-user engagement and innovation potential exists However the data confirms a positive relation between the engagement of end-users and innovation potential
41
Figure 21 End user engagement by innovation potential
Calculations JRC
Data European Commission DG Connect
Note The computations were based on the responses to general question 1 of the Innovation Radar Questionnaire Total number of reviewed projects 603 Total number of innovations 1128 Review period 01102014 and 18012016
End-user engagement may also affect the overall innovation performance of the project and the level of commitment of relevant partners in exploiting the innovation Figure 22 presents data on the project partners commitment and innovation performance The data suggest that end-user engagement ndash both internal and external to the consortium - increases the level of commitment of relevant partners in exploiting the innovation On the other hand the results in terms of innovation performance do not show that end-user engagement directly improves the project
Figure 22 End user engagement by partners commitment and innovation performance
Calculations JRC
42
Data European Commission DG Connect
Note The computations were based on the responses to general question 1 6 and 8 of the Innovation Radar Questionnaire Total number of reviewed projects 603 Total number of innovations 1128 Review period 01102014 and 18012016
43
7 Steps and barriers to innovation commercialisation
This section deals with three issues concerning innovation commercialisation First it presents the responses to the questions on the steps that organizations undertook or plan to undertake in order to bring the innovations to (or closer to) the market Second it provides an overview of what innovators need to fulfil the market potential of their innovations and finally it shows what the most common bottlenecks to innovation commercialization are
71 In a nutshell
The main findings of the analysis of steps and barriers to innovation commercialisation include
When taking innovations to the market projects focus more on technology-related steps than business-related ones 664 of the projects that plan to commercialise their innovations undertake or plan to undertake demonstration or testing activities In contrast only 40 of projects have carried out or plan to carry out a market study A business plan is on the agenda of only 36 of projects that plan innovation commercialisation
Activities that involve participations or interactions with actors outside of the projects are relatively uncommon Only 45 to 9 of the projects have sought or are planning to seek private or public funding
Three of the most common needs are partnership with another company (195) business plan development (167) and expanding to more markets (149)
The least frequently named needs include incubation (64) participation in a start-up accelerator (59) and investor readiness training (56)
307 of project partners see financing as the major external bottleneck to innovation exploitation
Only 25 of the project partners consider trade issues between Member States and the rest of the world as a barrier to exploiting their innovative products or services
72 Steps to innovation commercialisation
Figure 23 indicates what steps have already been taken or are planned by projects to bring their innovations to (or closer to) the market This figure distinguishes between technology-related steps (eg feasibility study or prototyping) and business-related steps (eg business plan or capital investment)
Concerning technology-related steps prototyping and demonstration or testing activities are the most common measures that projects undertake in order to bring their innovations to the market Of the projects that are plannng to introduce their innovations to the market 664 is either undertaking or planning demonstration or testing activities or creating or planning to develop a prototype (654) Developing a pilot (552) is also quite common Among the most desirable steps that have not been taken or planned are feasibility studies engagement by industrial research team of one of their companys business units in project activities and technology transfer Around 12 of projects that are planning to introduce their innovations to the market perceive that these activities will facilitate innovation commercialisation
With respect to business-related steps Figure 23 shows that carrying out a market study and writing a business plan are among the most common steps that help to commercialise innovations Around 40 and 36 of projects have carried out or plan to carry out a market study and write a business plan At the same time around 16 of the projects see these steps as desirable and between 16 and 18 have not planned them in the course of innovation commercialisation A significantly smaller number of projects consider undertaking steps like launching a start-up or a spinoff or seeking funding For example between 5 and 9 of the projects have sought or are planning to seek private or public funding and between 25 and 28 of the projects consider this
44
step as desirable At the same time between 40 and 33 of the projects do not plan to seek capital or public investment
The evidence presented above leads to the following conclusions First the technology-related steps to bring innovations to the market are seen as more important than business-related ones Organizations very often focus on making sure that the innovation they develop is ready to be commercialised from the technological point of view To this end projects create a prototype or perform demonstrations or testing activities Relatively often organizations do not undertake or plan business-related steps Second in both cases ie technology- and business-related activities the emphasis is on what can be done within the project and among the participants Activities that involve interactions with actors outside of the projects or participation by them are less common particularly as regards seeking external funding Only a few projects see these activities as relevant to the commercialisation of innovations and many of them do not plan to undertake them This calls for two kinds of support First projects should be encouraged to look beyond the technological aspects and introduce business-related elements to their activities Second they should be encouraged to increase interaction with external specialised actors eg business coaches or venture capitalists as this could help them to improve the commercialisation chances of their innovations
Figure 23 Progress of projects in bringing innovations to the market
Calculations JRC
Data European Commission DG Connect
Note The computations were based on the responses to question 10 of the Innovation Radar Questionnaire Total number of reviewed projects 603 Total number of innovations 1128 Review period 01102014 and 18012016
73 Innovators need to realise the market potential of innovations
Figure 24 presents the responses to the question what do innovators need to realise the market potential of their innovations The most common needs are seen as partnerships with other companies business plan development and expanding to more markets The least frequently named needs include investor readiness training participation in a start-up accelerator and incubation
45
Figure 24 Innovators needs to fulfil the market potential of their innovations
Calculations JRC
Data European Commission DG Connect
Note The computations were based on the responses to question 13 of the Innovation Radar Questionnaire Total number of reviewed projects 603 Total number of innovations 1128 Review period 01102014 and 18012016
74 Type of organization and need to realise the market potential of innovations
Below we analyse whether the fact that an innovator is a university or private organizations has any implications for the further support needed to bring its innovation to the market
Figure 25 presents innovators needs to fulfil the market potential by organisation type As already shown in Figure 24 the most common need reported is partnership with another company (195) The breakdown by organisation type shows that the most common need reported by higher education and schools and research organisations (HSEREC) is partnership with another company (118 of the total needs or 605 of the specific needs) followed by business plan development (9 or 54) and legal advice (73 or 62) For private organisations the most common needs reported are expanding to more markets and developing a business plan (between 5 and 3 respectively) Moreover in general HESREC seem to report more needs than private organisations
In order to better analyse the differences between organisations in reporting potential market needs we ran a multinomial logistic regression and reported the resulting marginal effects in Figure 26 The figure shows that we can identify clearly different patterns for HESREC and private organisations The figure also shows the probability of reporting a specific need all other things remaining constant for specific organisations
For HESREC the probability of reporting needs such as start-up accelerator incubation partnership mentoring and legal advice are all positive and range from 10 to 20 On the other hand being an HESREC reduces the probability of reporting needs such as expanding to more markets or developing a business plan The situation is completely the reserve for private organisations where both large enterprises and SMEs are more likely to report the latter as their most common needs Private organisations diverge only with respect to investor introductions which are more relevant for SMEs and HESREC than they are for large enterprises
The results of the analysis suggest that HESREC tend to report more needs related to the finalisation of the innovation and the subsequent steps to bring it to the market while private organisations needs are more related to the commercialization of the innovation and the need to create or expand their markets
46
Figure 25 Innovators need to fulfil the market potential by organisation type
Calculations JRC
Data European Commission DG Connect
Note The computations were based on the responses to question 13 of the Innovation Radar Questionnaire Total number of reviewed projects 603 Total number of innovations 1128 Review period 01102014 and 18012016
Figure 26 Marginal effects of potential market needs by organisation type
Calculations JRC
Data European Commission DG Connect
Note Marginal effects multinomial logistic regression number of observation2095 Total number of reviewed projects 603 Total number of innovations 1128 Review period 01102014 and 18012016
47
75 Bottlenecks to innovation commercialization
Figure 27 presents responses to the question of what are the external bottlenecks that compromise the ability of project partners to exploit new products solutions or services internally or in the market place For the majority of project partners (307) lack of financing is seen as the major external bottleneck to innovation exploitation Regulation and standards account for 156 and 143 respectively together with the generic group others IPR and workforce skills are considered as relatively important Around 10 of the projects perceive at least one of the two issues as an external factor that could threaten the ability of project partners to commercially exploit innovations Among the bottlenecks seen as least harmful are trade issues between Member States and the rest of the world Only 25 of the project partners consider these as barriers to exploiting their innovative products or services
Comparing the steps that organizations undertook or plan to undertake in order to bring their innovations to (or closer to) the market (see Figure 23) and the information presented in Figure 27 leads us to observe an apparent contradiction between what project organisations claim to be a barrier and their actual behaviour While 307 of project partners see lack of financing as a barrier to exploiting their innovative products or services only 5 to 9 of the projects have sought or are planning to seek private or public funding Moreover between 33 and 40 of the projects do not plan to seek capital or public investment This point is further emphasised by the fact that organizations most commonly declare that they need partnerships with other companies and to expand to more markets in order to realise the market potential of their innovations
Figure 27 External bottlenecks that compromise the ability of project partners to
exploit innovations
Calculations JRC
Data European Commission DG Connect
Note The computations were based on the responses to general question 4 of the Innovation Radar Questionnaire Total number of reviewed projects 603 Total number of innovations 1128 Review period 01102014 and 18012016
48
8 Conclusions
This section summarises the key messages from the analysis of the IR data These focus specifically on the role of collaboration between universities and private organisations
Nurturing business culture among innovators
The current analysis shows that the key organizations behind ICT FP7Horizon2020-related innovations tend to have high levels of technological involvement but pay less attention to the business-related dimensions of their innovations It seems that there is a strong need for projects to look beyond the technological aspects and introduce business-related elements into their activities This can be achieved by providing incentives for increasing interactions between projects and external specialised actors eg business coaches or venture capitalists who could help to improve the commercialisation chances of innovations
Another interesting aspect emerging from the IR data is the high participation and active role of SMEs in delivering innovations with high potential SMEs are an important vehicle for co-creating and commercialising innovative technologies developed within ICT FP7Horizon2020 projects
Industry-university collaboration
Collaboration between universities and industry plays a crucial role in driving innovation processes Universities possess essential skills for innovation supplied to business They are the basis of the knowledge-based economy The close collaboration between university and industry poses a series of policy questions on how to foster this collaboration and what kind of policy support should be implemented
The IR data showed that universities are key co-innovators in over 70 of all innovations with high potential Collaboration between universities and SMEs delivers the largest share of innovations with high potential and seems to be more fruitful than the collaboration between universities and large firms This may suggest that universities are a source of innovative products that are channelled through private organizations to the market and that SMEs form a better bridge to universities in this process Finally innovations co-developed with universities are as likely to be commercially exploited as those introduced by private-private collaborations
49
References
Caloghirou Y Tsakanikas A amp Vonortas N (2001) University-Industry Cooperation in the Context of the European Framework Programmes [journal article] The Journal of Technology Transfer 26(1) 153-161 doi 101023a1013025615518
Chesbrough H (2003) Open Innovation The New Imperative for creating and Profiting from Technology Boston Harvard Business School Press
De Prato G Nepelski D amp Piroli G (2015) Innovation Radar Identifying Innovations and Innovators with High Potential in ICT FP7 CIP amp H2020 Projects JRC Scientific and Policy Reports Seville JRC-IPTS
EC-CONNECT (2013) Overview of Research Projects in the ICT Domain 2012 ICT statistical report for annual monitoring (StReAM) European Commission httpseceuropaeudigital-agendasitesdigital-agendafilesStream_2012pdf
Evans B (2011) Beginning Arduino Programming Springer
Hernan R Marin P amp Siotis G (2003) An Empirical Evaluation of the Determinants of Research Joint Venture Formation The Journal of Industrial Economics 51(1) 75-89
OECD (2015) OECD Science Technology and Industry Scoreboard 2015 Paris OECD
Okamuro H (2007) Determinants of successful RampampD cooperation in Japanese small businesses The impact of organizational and contractual characteristics Research Policy 36(10) 1529-1544 doi httpdxdoiorg101016jrespol200612008
Polt W Vonortas N amp Fisher R (2008) The impact of publicly funded research on innovation An analysis of European Framework Programmes for Research and Development European Commission Directorate-General for Internal Market Industry Entrepreneurship and SMEs
Roumlller L-H Siebert R amp Tombak M (2007) Why Firms Form (or do not Form) RJVS The Economic Journal 117(522) 1122-1144 doi 101111j1468-0297200702069x
Siebert R (1996) The Impact of Research Joint Ventures on Firm Performance An Empirical Assessment (Vol CIG Working Papers FS IV 96-03) Wissenschaftszentrum Berlin (WZB)
SJTU (2015) Federico Musto of Arduino Our real boss is the community SJTU PARISTECH REVIEW(2015-11-11)
Thompson C (2008 20102008) Build It Share It Profit Can Open Source Hardware Work Wired Retrieved from httpswwwwiredcom200810ff-openmanufacturing
Torrone P amp Fried L (2010) Million dollar baby ndash Businesses designing and selling open source hardware making millions Paper presented at the Foo Camp East 2010 httpmakezinecom20100506million-dollar-baby-businesses-de
von Hippel E (2005) Democratizing Innovation MIT Press
HOW TO OBTAIN EU PUBLICATIONS Free publications bull one copy
via EU Bookshop (httpbookshopeuropaeu)
bull more than one copy or postersmaps
from the European Unionrsquos representations (httpeceuropaeurepresent_enhtm)
from the delegations in non-EU countries (httpeeaseuropaeudelegationsindex_enhtm)
by contacting the Europe Direct service (httpeuropaeueuropedirectindex_enhtm) or
calling 00 800 6 7 8 9 10 11 (freephone number from anywhere in the EU) ()
() The information given is free as are most calls (though some operators phone boxes or hotels may charge
you)
Priced publications bull via EU Bookshop (httpbookshopeuropaeu)
doi102791244949 ISBN 978-92-79-64630-0
LF
-NA
-28
35
5-E
N-N
10
1 Introduction
The European Commissions Framework Programme (FP) constitutes an important share in RampD expenditures in Europe For example the Horizon 2020 is the biggest EU Research and Innovation
programme ever launched making nearly euro80 billion of funding available over 7 years (2014 to 2020) In addition to financing science and technology development one of the main objectives of the FP is to foster international collaboration among research organizations and private firms both large and small Collaboration is a key conduit for innovation-related knowledge flows for firms that use RampD (either internally developed or externally acquired) and also for those that are not RampD-active (OECD 2015) The main idea behind this is that innovation often results from the interaction and cooperative efforts of different organisations devoted to the achievement of a common goal The importance of collaboration for innovation is generally well accepted (Chesbrough 2003 von Hippel 2005)
Despite the fact that fostering collaboration is among the key objectives of EC-funded organizations the impact of bringing universities research organizations and private firms together to produce technological and innovative output is unclear The reason for this is diverging motivations and objectives of the different types of organizations that participate in EC-funded research projects For example universities are looking mainly for complementary resources that allow them to advance basic research (Caloghirou Tsakanikas amp Vonortas 2001 Polt Vonortas amp Fisher 2008) They are more motivated by the opportunity to build up new knowledge and technology capabilities and to investigate new research areas than they are by technology commercialisation In contrast SMEs have explicit goals related to innovation outputs such as developing a prototype a patentable technology or a complementary technology that will enhance competitiveness (Polt et al 2008) They focus on projects with an applied orientation and engage only in cooperative agreements that are likely to yield tangible benefits guaranteeing them immediate survival and growth Large firms also have different motives for participating in joint projects with universities and other firms In general they appear much less inclined to commercialise directly from the project than SMEs (Hernan Marin amp Siotis 2003) Larger companies participate in collaborative RampD projects in order to carry out technology watch acquire new knowledge and build partnerships
Considering that various types of organizations are driven by various motivations to participate to EC-funded research projects one can expect that these dissimilarities are likely to affect the efforts of various partners the outcomes of collaboration and how their results are appropriated by among them For example large firms are less willing to share their economic knowledge with smaller rivals and have a preference to collaborate with other large firms in order to maximize the internalization of spillovers (Roumlller Siebert amp Tombak 2007) Moreover as many research collaboration projects do not lead straight to economic benefits (Siebert 1996) diversity in firm size and efficiency level can impede effective RampD collaboration The same applies to collaborations between companies and universities It was found that the impact of collaboration with a university depends on the company size (Okamuro 2007) In general SMEs can benefit more from RampD collaboration with universities rather than larger firms
In order to improve our understanding of the collaborative innovation efforts in EC-funded research projects the current study builds on the first release of the Innovation Radar (IR) (De Prato et al 2015) Between October 2014 and January 2016 603 projects were reviewed using the IR Questionnaire In addition to the several background aspects the IR takes into account in order to assess the process of innovation development the maturity of the innovation the actions needed to fulfil the market potential of innovation this document looks also at innovation collaboration patterns In particular it analyses whether collaboration affects differently innovation according to the organisation type involved eg university SME or large firm and the engagement of end-users
This report is structured as follows Section 2 briefly reviews the methodological details of the IR assessment frameworks to identify innovations and innovators in EC-funded research projects and
11
describes the underlying data Sections 3 and 4 present the results of the innovation potential assessment and the innovator capacity assessment respectively Section 5 analyses whether different types of partnerships matter for the innovative outcome with a particular emphasis on universities as co-inventors Section 6 describes the impact of end-user engagement on projects innovation performance Section 7 shows the responses to the questions about steps that project consortia have taken to bring innovations to the market and what kind of obstacles to innovation commercialisation they have found Section 8 summarises the main lessons learned
12
2 Innovation Radar Methodology and Data
The Innovation Radar methodology uses two assessment frameworks one for ranking innovations and the other for ranking of innovators A detailed description of the construction of both the frameworks and the indicators used can be found in the first Innovation Radar Report (De Prato et al 2015) Below the key methodological elements are briefly presented
21 Innovation potential assessment framework and indicators
The innovation potential assessment framework includes a set of criteria and indicators which assess the strength of each innovation in terms of innovation readiness innovation management and market potential
Innovation readiness Innovation readiness relates to the technical maturity of an evolving innovation It takes into account the development phases of the innovation eg conceptualization experimentation or commercialisation It also looks at the steps that were taken in order to prepare an innovation for commercialisation (eg prototyping demonstration or testing activities or a feasibility study) and to secure the necessary technological resources (eg skills to bring the innovation to the market) In addition this criterion takes into account the development stage of an innovation and the time to its potential commercialisation It is measured by the Innovation Readiness Indicator (IRI)
Innovation management This criterion assesses the project consortium and its commitment to
bring an innovation to the market an element that is often seen as the most important success indicator of a technology venture It aims to research or confirm the capability of the projectrsquos development andor management team to execute the steps necessary for transforming a novel technology or research results into a marketable product and finally to prepare its commercialisation These steps may include for example clarifying the related ownership and IPR issues preparing a business plan or market study securing capital investment from public andor private sources or engaging an end-user in the project Innovation management is measured by the Innovation Management Indicator (IMI)
Market potential This criterion relates to the demand and supply side of an innovation Regarding the demand side it assesses the prospective size of the market for a product and the chances of it being successfully commercialised It looks at whether the product satisfies a market sector and if there is a potential customer base With respect to the supply side it assesses whether there are potential barriers eg regulatory frameworks or existing IPR issues which could weaken the commercial exploitation of an innovation In the current undertaking the focus is placed on the supply side This is mostly because information on markets for individual innovations is not available Market potential is measured by the Market Potential Indicator (MPI)
The three indicators described above ie IRI IMI and MPI are used to construct the final Innovation Potential Indicator (IPI) As all three elements are considered equally important for the successful commercialization of an innovation equal weighting is applied see Figure 1
13
Figure 1 Construction of the Innovation Potential Indicator
Source JRC
22 Innovator capacity assessment framework and indicators
The second assessment framework of the Innovation Radar ranks innovators It concentrates on two issues First how well do organizations seen as key innovators perform as regards innovation Second in what kind of environment are these organizations located It includes a set of criteria and indicators which assess the capacity of organizations identified as key deliverers of innovations
Innovators ability This relates to the innovation performance of an individual organization that is seen as the key organization behind an innovation The ability of an organization is measured mainly by its innovative output within the FP7 activities By output we mean the number of innovations each organization contributes to and the potential of these innovations where the innovation potential is a product of the innovation potential assessment as defined above In addition when assessing an innovators ability factors such as a reviewers opinion about the innovators potential or independence in realising the market potential of an innovation are taken into account Innovators ability is measured by Innovators Ability Indicator (IAI)
Innovators environment this criterion aims to capture the overall conditions that an innovator faces It is mainly related to the overall composition and activities of partner organizations the performance of the project in terms of innovation and the commitment of relevant partners to exploiting the innovation Moreover it also takes into account the presence of organizations that are directly interested in applying or exploiting the innovations eg end-users It is assumed that a positive environment overall will have a positive spill over effect on the innovator and vice-versa Innovators environment is measured by Innovators Environment Indicator (IEI)
Both indicators IAI and IEI are used to construct the Innovator Capacity Indicator (ICI) The value of the ICI is an arithmetic aggregate of the values of the IAI and IEI (see Figure 2)
14
Figure 2 Construction of the Innovation Capacity Indicator
Source JRC
23 Normalization of indicator values
In order to make the values of each indicator for different innovations and innovators as easily comparable as possible a normalisation procedure is applied Observed values for each indicator are brought to the scale between 0 and 100 in the following way
100
ScoreMax
ScoreObserved
ScoreNormalizedIndicator
IndicatorIndicator (1)
24 Categories of innovations and innovators
In order to facilitate the interpretation of the results the IR study introduces three categories of innovations ie low medium and high potential and also of innovators ie low medium and high capacity Figure 3 shows how innovations and innovators are assigned to each of the three categories based on their score on the IPI for innovations and ICI for innovators
Figure 3 Innovation potential and innovator capacity scoring system
Calculations JRC
Data European Commission DG Connect
Note The figure presents average scores across all four innovation potential assessment indicators ie IRI IMI MPI and IPI as defined in section 21 Total number of reviewed projects 603 Total number of innovations 1128 Review period 01102014 and 18012016
15
25 Data
The Innovation Radar initiative is an ongoing process that was launched in August 2013 The data collection process started in May 2014 and the data used in the current report was collected during periodic reviews of ICT FP7CIP of 603 projects The reviews which took place between October 2014 and January 2016 were based on the IR Questionnaire and were conducted by external experts commissioned by DG Connect In addition to the standard review procedure DG Connect deployed the Innovation Radar questionnaire during the same period to spot innovations originating from the FP7 projects and the key organizations behind them For a detailed description of data collection please see the first Innovation Radar report (De Prato et al 2015)
16
3 Innovations in EC-funded Research Projects
This section presents the innovation potential assessment results It covers the following points
The overall and average innovative output of ICT FP7Horizon2020 projects
Overview of the innovation performance of innovations
Presentation of innovations with high potential and their characteristics including the main organizations behind them
Categorisation of innovations by their type eg product process or service innovations
Presentation of plans to commercialise and exploit innovations
Presentation of the structure of innovation ownership
Overview of innovations by review type
31 In a nutshell
The main findings of the innovation potential assessment can be summarised as follows
A typical ICT FP7Horizon2020 project produces 187 innovations
There are 19 innovators per innovation on average
Market potential and innovation readiness are among the strongest dimensions of the ICT FP7Horizon2020 innovations while the most room for improvement is found in innovation management
Most of the innovations are in data processing or software development and only a few innovations are in hardware development
50 of key organizations behind the top 10 innovations are SMEs
12 of all innovations are already being exploited either on the market or within a partner organization However 28 of innovations that are already mature are not being exploited yet
58 of innovations that have already been developed or are being exploited are either new products or significantly improved products
Commercial exploitation is planned for over 63 of all innovations and almost all those Innovations that have high potential
Although 55 of the innovations have multiple owners 67 of those with high potential or 114 of all the innovations have a clearly defined owner
74 of innovations with high potential belong to projects that have been through their final review and are therefore in their final stages Thus it can be assumed that new ideas and technologies developed during EU-financed projects mature and increase their potential as projects advance
32 Innovations in the reviewed ICT FP7Horizon2020 projects
According to
Table 1 between October 2014 and January 2016 603 projects were reviewed using the IR
Questionnaire As a result 1128 innovations were identified This means that on average an ICT FP7Horizon2020 project produces nearly 2 innovations 1036 distinct organizations could be considered as key organisations in delivering these innovations The average number of innovators per innovation was 19
17
Table 1 Innovations in ICT FP7Horizon2020 projects ndash key facts
Review period 01102014 and 18012016
Number of reviewed projects 603
Number of innovations 1128
Number of distinct innovators 1036
Average number of innovations per project 187
Average number of innovators per innovation 19 Source JRC
Data European Commission DG Connect
33 Overview of innovation performance
Figure 4 presents the summary statistics of the three innovation potential assessment sub-indicators ie Innovation Readiness (IRI) Innovation Management (IMI) Market Potential (MPI) and the composite Innovation Potential (IPI) for all the innovations analysed by innovation potential category Figure 4 presents the average values of the indicators across innovation potential categories and shows the distribution of the IPI values
The average value of the IPI among all the innovations is 4497 out of the total 100 points This number varies between 2471 and 6782 for innovations in the low and high potential categories The innovation with the highest score obtained 8833 points while the lowest-ranked innovation only 125 points When looking at the individual sub-indicators one can observe that MPI has the highest and the IMI has the lowest average value The average MPI score is 6054 and the average IMP score is 3604 points The average score of the IRI is 3834 points
Figure 4 Average values of indicators by innovation potential category
Calculations JRC
Data European Commission DG Connect
Note The figure presents average scores across all four innovation potential assessment indicators ie IRI IMI MPI and IPI as defined in section 21 Total number of reviewed projects 603 Total number of innovations 1128 Review period 01102014 and 18012016
Based on the presented evidence it can be concluded that on average market potential and innovation readiness are among the strongest dimensions of innovations from the reviewed ICT FP7Horizon2020 projects In contrast innovation management represents the weakest dimension of these innovations Hence in order to increase the potential of these innovations steps such as
18
clarifying the ownership of the innovation preparing a business plan carrying out a market study or securing investment must be taken 34 Innovations with high potential
Table 2 shows detailed descriptions of 10 innovations with the highest IPI score together with the name and organization type of the key organizations behind them Most of the innovations are in data processing or software development Altogether there are 12 entities behind the top innovations Only in one case ndash that of RELEASE_B ndash is more than one organization identified as the key organizations behind an innovation For the remaining innovations only one innovator was identified Interestingly SMEs and higher education and schools and research centres (HESREC) account for 42 of all organizations Only 2 of the organizations are large companies
Table 2 Description of the top 10 innovations and the key organizations behind them
Rank by IPI
Innovation Innovation description Key
Organisations Organisation
type
1 GET HOME
SAFE_A
Affordable and professional driving simulation tool Main USP separation between driving tasks and core part of the system
DEUTSCHES FORSCHUNGSZE
NTRUM FUER KUENSTLICHE INTELLIGENZ
GMBH
REC
2 RELEASE_A
The Wombat OAM system is a broker layer able to deploy ERLANG applications on top of cloud or super-clusters of smaller heterogeneous clusters managing dynamically scaling on the base of capability profile matching
ERLANG SOLUTIONS
LIMITED SME
3 RELEASE_B
The scalable Erlang Virtual Machine is able to provide improved load balancing mechanism and to interrupt long running garbage collection thus making the language more responsive and scalable The Virtual machine also provides more concurrent access to shared data held in ETS tables
UPPSALA UNIVERSITET
HES
ERICSSON AB PRC
INSTITUTE OF COMMUNICATION AND COMPUTER
SYSTEMS
REC
4 SCI-BUS_A
CloudBroker Platform one point of connection - unified interface to different commercial clouds enables users to provide their self-developed applications workflows data products and other software to be exploited commercially
CLOUDBROKER GMBH
SME
5 CUBRIK_B
The Gamification Framework (GF) enables organizations to add game elements to business applications to boost customer engagement activity and loyalty
WEBRATIO SRL SME
6 LiMoSINe_A
The innovation is about self-learning search and recommendation systems able to learn to optimize themselves while people are interacting with them Self-learning search and recommendation systems add value to businesses because they improve user engagement which correlates with increase in revenue
UNIVERSITEIT VAN AMSTERDAM
HES
7 Trilogy 2_A The Federated Market is a market-place for the buying and selling of VM resources across distributed cloud provider Data Centres
ONAPP LIMITED SME
8 GREENHospi
tal_C
Web-EMCS is a software platform that simplifies the integration among subsystems at the field layer realized with heterogeneous standards
AEA srl PRC
9 MateCat_A
The MateCat tool is a Web-based open source computer-assisted translation (CAT) tool which puts together the best environment for post-editing and translation and a marketplace for outsourcing translation projects
TRANSLATED SRL
SME
10 COMPASS_A Novel test strategy for automated equivalence class partition testing of complex systems with guaranteed error detection capabilities
UNIVERSITAET BREMEN
HES
Calculations JRC Data European Commission DG Connect Note The table presents the list of 10 innovations with high potential with the highest IPI score as defined in Section 21 Organization classes HESREC (Higher Education and Schools and Research Centres) PUB (Public Bodies) SMEs (Small Medium Enterprise) PRC (Large companies) OTHER (Other organisations) Total number of reviewed projects 603 Total number of innovations 1128 Review period 01102014 and
19
18012016
35 Development stage of innovations
Figure 5 shows the distribution of innovations by stage of development and innovation potential category According to this information 61 of the innovations are under development and 12 of are already being exploited they are either on the market or are being used within a partner organization However more than 25 of innovations are already developed but not being exploited About 45 of innovations with high potential belong to this category The other 43 with the highest IPI scores are already being exploited and the remaining 12 are under development
Figure 5 Development stage of innovations
Calculations JRC
Data European Commission DG Connect
Note The computations were based on the responses to question 3 of the Innovation Radar Questionnaire Total number of reviewed projects 603 Total number of innovations 1128 Review period 01102014 and 18012016
36 Type of innovations
Figure 6 shows the types of innovations that are developed or being exploited and Figure 7 shows types of innovations that are still under development In both cases a breakdown by innovation potential category is given According to Figure 6 most of the innovations that are already developed or being exploited are either new products or significantly improved existing products Altogether these two types account for around 58 of all developed innovations The second largest group of innovation types represent new services or significantly improved services These two categories account for 22 of all developed innovations
Of the different types of innovation one can see that the new products or significantly improved products include a relatively large share of innovations with high potential Innovations in these two groups account for 223 of all developed innovations
According to Figure 7 most of the innovations that are still under development (531) are product innovations A very large share of innovations in this group ie 78 is made up of innovations with medium potential Thus this is the group of innovations that requires further nurturing in order to exploit its potential
20
Figure 6 Innovations developed or being exploited by type and innovation potential
category
Calculations JRC
Data European Commission DG Connect
Note The computations were based on the responses to question 4 of the Innovation Radar Questionnaire Total number of reviewed projects 603 Total number of innovations 1128 Review period 01102014 and 18012016
21
Figure 7 Innovations under development by type and innovation potential category
Calculations JRC
Data European Commission DG Connect
Note The computations were based on the responses to question 4 of the Innovation Radar Questionnaire Total number of reviewed projects 603 Total number of innovations 1128 Review period 01102014 and 18012016
37 Exploitation and commercialisation of innovations
Figure 8 shows the breakdown of innovations by exploitation and innovation potential category A distinction between commercial and internal exploitation is made According to this information commercial exploitation is planned for 63 of all innovations and for almost all innovations with high potential Only 05 of innovations with high potential are exploited internally whereas over 23 of all innovations are Internal exploitation is expected to take place through changes in organization new internal process implementation etc The remaining innovations ie 13 are not planned to be introduced to the market or exploited internally
22
Figure 8 External vs internal exploitation by innovation potential category
Calculations JRC
Data European Commission DG Connect
Note The computations were based on the responses to question 6 of the Innovation Radar Questionnaire Total number of reviewed projects 603 Total number of innovations 1128 Review period 01102014 and 18012016
38 Innovation ownership
Figure 9 presents the information on innovation ownership and innovation potential category A distinction between innovations with one clear owner and multiple owners is made 45 of all innovations have a clear owner while the ownership rights of the remaining innovations belong to multiple owners The majority innovations with high potential (ie 67) have clearly defined ownership whereas only 114 of the total number of innovations do
Figure 9 Innovation ownership by innovation potential category
Calculations JRC
Data European Commission DG Connect
Note The computations were based on the responses to question 8 of the Innovation Radar Questionnaire Total number of reviewed projects 603 Total number of innovations 1128 Review period 01102014 and 18012016
23
39 Innovations by review time
During their lifecycle ICT FP7Horizon2020 projects go through three review rounds The reviews are conducted by a panel of independent evaluators who are recognized specialists in the relevant fields In addition to the standard reviews the Innovation Radar Questionnaire was applied to ongoing projects Hence the IR covers and assesses innovations and innovators that belong to projects at different stages of their lifecycle Figure 10 presents a breakdown of innovations by review time and innovation potential category 22 of all innovations belong to projects that were reviewed for the first time 35 of innovations were produced within projects that were reviewed for the second time and the remaining 428 of innovations originate from projects in their final stages
Regarding innovation potential and review time 44 of all innovations are classified as innovations with low potential and belong to projects that were reviewed for the first time This percentage goes down to 37 for innovations with low potential in projects in their final stages By the same token only 06 of all innovations are classified as innovations with high potential and they originate from projects that were reviewed for the first time However the percentage of innovations with high potential rises to 126 of all innovations for projects in their final stages Thus one can observe a relatively clear pattern while the share of innovations with low potential decreases as projects mature the reverse is true innovations with high potential
Figure 10 Number of innovations by innovation potential category and review time
Calculations JRC
Data European Commission DG Connect
Note The figure includes the count of innovations based on the project review time and innovation performance according to the IPI as defined in Section 21 Review type concerns one of the three reviews each FP7 project is subject to during its lifecycle Total number of reviewed projects 603 Total number of innovations 1128 Review period 01102014 and 18012016
24
4 Innovators in EC-funded Research Projects
This section presents the innovator capacity assessment results The analysis addresses the following points
Summary of innovator capacity performance
Presentation of high capacity Innovators and SMEs that are high capacity innovators
Overview of organizations by their type and innovations
Location of innovators
Relationship between the scores for innovator capacity and innovation potential
41 In a nutshell
The main findings of the innovator capacity assessment can be summarised as follows
On average innovators profit from an innovation-favourable environment However the quality of an innovation environment is not equal for all innovators The reason for this is that some projects do not engage end-users in the consortium or relevant partners may lack the necessary commitment to exploiting the innovation
44 of all organizations behind innovations with high potential are SMEs and in general there is a positive link between an innovations potential and an SME being involved in its development Hence it can be assumed that SMEs are important vehicles for co-creating and commercialising innovative technologies developed within ICT FP7 projects
The countries with the most organizations identified as key players in delivering the innovations are Germany (1566) the UK (1351) Italy (1179) and Spain (1174)
There is a positive relationship between an organisations innovator capacity score and the innovation potential score of the innovation the development of which this organisation is contributing to However a high score in one indicator does not automatically translate into a high performance in the other Often high capacity innovators participate in delivering innovations with low or medium potential and low capacity innovators are identified as key organizations in developing innovations with medium potential Thus improving the overall performance of innovative output requires a focus on both innovations and the organizations behind them
Among over 1000 participants identified as key innovators Nr 1 is Arduino SA a global leader in Open Source Software and Hardware development Arduino is a European-based technology platform which sets the standards of global collaborative development of future technologies
42 Overview of innovator performance
Figure 11 summarises the statistics on the two sub-innovator capacity assessment indicators ie Innovators Ability (IAI) Innovators Environment (IEI) and a composite Innovator Capacity Indicator (ICI) for all key organizations in delivering the innovations and by innovator capacity category Figure 11 shows the distribution of the ICI average values across innovator capacity categories
The average value of the ICI among all 1128 innovators is 534 out of 100 points This number varies from 242 to 687 for low to high capacity innovators The innovator with the highest score obtained 9441 points while the lowest-ranking innovator obtained only 12 points Looking at the individual sub-indicators one can observe that IEI has the highest average value among high and medium capacity innovators The average IEI score is 639 and the average IAI score is 429 points However looking at the standard deviation values of both indicators (respectively 221 and 15) one can see that IEI scores are much more volatile than those of IAI In other words the quality of the innovation environment is not equal for all innovators This happens as some projects do not
25
engage end-users in the consortium or because the relevant partners are not sufficiently committed to exploiting the innovation
Figure 11 Average values of indicators by innovator capacity category
Calculations JRC
Data European Commission DG Connect
Note The figure shows the average scores of innovators across three assessment indicators IAI IEI and ICI defined in section 0 Innovators are defined as key organization behind the innovation according to the answers to the question 12 of the Innovation Radar Questionnaire Total number of reviewed projects 603 Total number of innovations 1128 Review period 01102014 and 18012016
43 Innovators and their innovations
Figure 12 shows the distribution of innovators by innovator capacity and innovation potential category It can be seen that 282 of high capacity innovators were identified as key organizations in delivering innovations with high potential 669 of innovators in this category participate in developing innovations with medium potential and only 49 innovations with low potential Regarding the medium capacity innovators category 8 of organizations were responsible for the development of innovations with high potential and 761 for those with medium potential The distribution patterns in the last category ie low capacity innovators are consistent Indeed the majority of innovators in this category participate in delivering innovations with low potential (598) The remaining 402 deliver innovations with medium potential while none of the Low Capacity innovators delivers innovations with high potential
26
Figure 12 of innovators by innovator and innovation categories
Calculations JRC
Data European Commission DG Connect
Note The figure shows breakdown of innovators by Innovator Capacity and Innovation Potential category Innovators are defined as key organization behind the innovation according to the answers to the question 12 of the Innovation Radar Questionnaire Total number of reviewed projects 603 Total number of innovations 1128 Review period 01102014 and 18012016
44 Type of organizations and their innovations
Figure 13 presents the distribution of key organizations in delivering innovations that were identified during the reviews by organization type 54 of innovators are Higher Education and Schools and Research Centres (HESREC) 23 are SMEs and 19 are large enterprises
Figure 13 of innovators by organization type
Calculations JRC
Data European Commission DG Connect
Note The figure presents the breakdown of innovators by organization type Innovators are defined as key organization behind the innovation according to the question 12 of the Innovation Radar Questionnaire Organization types HESREC (Higher Education and Schools and Research Centres) PUB (Public Bodies) SMEs (Small Medium Enterprise) LARGE (Large companies) OTH (Other organisations) Total number of reviewed projects 603 Total number of innovations 1128 Review period 01102014 and 18012016
27
Figure 14 presents the distribution of key organization type for each innovation potential category 44 of the key organisations behind innovations with high potential are SMEs This is more than three times the share of SMEs in total participation SMEs accounted in FP7 for 16 of total participations and 15 of total EC funding (EC-CONNECT 2013) Second in this comparison is the category including HESREC Altogether about 28 of all key organizations behind innovations with high potential are universities or research centres whereas 22 of them are large companies
In innovations with low and medium potential the situation is reversed HESREC is the largest group of organizations behind these innovations and SMEs are the second largest group In both categories large companies remain in third position For example HESRECs account for 37 and SMEs for 35 of all organizations participating in the development of innovations with medium potential
In general there is a positive link between an innovations potential and an SME being involved in its development Hence it can be assumed that SMEs are important vehicles for co-creating and commercialising innovative technologies developed within ICT FP7 projects
Figure 14 of innovators by organization type and innovation potential category
Calculations JRC
Data European Commission DG Connect
Note The figures presents the breakdown of innovators by organization type and innovation potential of their innovations Innovators are defined as key organization behind the innovation according to the answers to the question 12 of the Innovation Radar Questionnaire Organization types HESREC (Higher Education and Schools and Research Centres) PUB (Public Bodies) SMEs (Small Medium Enterprise) LARGE (Large companies) OTH (Other organisations) Total number of reviewed projects 603 Total number of innovations 1128 Review period 01102014 and 18012016
45 High Capacity Innovators
Table 3 presents the top 10 innovators from the IR sample with the highest ICI scores together with their names organization type place of origin and innovations in which they were identified as being key organizations The organization with the highest ICI score is Arduino SA directly followed by Native Instruments GMBH Both are private organizations the first is an SME while the second is a large enterprise Altogether the top 10 high capacity innovators participated in the development of 24 innovations Regarding the potential of the innovations of the top 10 innovators 13 (54) are innovations with high potential 10 (42) have medium potential and only 1 (4) has low potential In other words high capacity innovators are also associated with innovations with higher potential
28
The majority of the top 10 high capacity innovators (50) are SMEs The remaining 50 is equally distributed between large companies and higher education and schools and research centres
Table 3 Top 10 High capacity innovators and their innovations
Rank by ICI
Organistaion name Organisation
type Country Region Project innovation Nr
Innovation Potential
1 ARDUINO SA SME SWITZERLAND TICINO
SOCIALampSMART_A 1 High
SOCIALampSMART_B 2 High
PELARS_A 3 Medium
2 NATIVE INSTRUMENTS
GMBH PRC GERMANY BERLIN
GiantSteps_B 4 High
GiantSteps_A 5 Medium
3 PERVOICE SPA PRC ITALY
EU-BRIDGE_A 6 High
EU-BRIDGE_B 7 High
4 HELIATEK GMBH SME GERMANY DRESDEN KREISFREIE
STADT X10D_A 8
High
5 UNIVERSITAET BREMEN HES GERMANY BREMEN
KREISFREIE STADT
SAPHARI_A 9 High
COMPASS_A 10 High
6 SIEMENS
AKTIENGESELLSCHAFT PRC GERMANY
MUumlNCHEN KREISFREIE
STADT
MD PAEDIGREE_A 11 Medium
MD PAEDIGREE_C 12 Medium
MD PAEDIGREE_B 13 Medium
CONCERTO_B 14 Medium
MSP_A 15 Medium
STREETLIFE_C 16 Medium
7 ERLANG SOLUTIONS
LIMITED SME UNITED KINGDOM BERKSHIRE
RELEASE_A 17 High
PROWESS_A 18 High
8 THE CHANCELLOR MASTERS
AND SCHOLARS OF THE UNIVERSITY OF CAMBRIDGE
HES UNITED KINGDOM ESSEX CC
PARLANCE_B 19 High
ASC-Inclusion_A 20 High
APhome_A 21 Low
BrainScaleS_B 22 Medium
9 EPIGAN BVBA SME BELGIUM ARR LEUVEN HiPoSwitch_A 23 High
10 WORLDSENSING SLNE SME SPAIN BARCELONA RELYonIT_A 24 Medium
Calculations JRC
Data European Commission DG Connect
Note The table presents the list and characteristics of High Capacity Innovators as defined in section 24 and their innovations Innovators are defined as key organization behind the innovation according to the answers to the question 12 of the Innovation Radar Questionnaire Organization types HESREC (Higher Education and Schools and Research Centres) PUB (Public Bodies) SMEs (Small Medium Enterprise) PRC (Large companies) OTH (Other organisations) Total number of reviewed projects 603 Total number of innovations 1128 Review period 01102014 and 18012016
46 High Capacity SME Innovators
Table 4 presents the top 10 SME innovators with the highest ICI score together with their names place of origin and innovations in which they were identified as key organizations These organizations were identified as key organizations in the development of a total of 11 innovations
The SME with the highest ICI score is Arduino Arduino is an open-source electronics platform based on easy-to-use hardware and software2 Arduino was identified as a key organization in the SOCIALampSMART project whose goal was to build up a physical and computational networked infrastructure which allowed household appliances to better meet the needs of their owners Launched in 2005 Arduinos electronic prototyping platform became a major technological platforms which enabled users to create interactive electronic objects Between October 2014 and January 2016 the IR identified 3 innovations for which Arduino was identified as a key
2 httpswwwarduinocc
29
organization For example together with partners like Gorenje a leading European manufacturer of home appliances Arduino was involved in the development of a new WiFi controlling platform for home IoT As a result Gorenjersquos advanced fridge has been enhanced with a WiFi enabled solution which is expected to be put on the market within the next two years
30
Box 1 provides an overview of the development of Arduino and its global community which is becoming one of the major global technological platforms of software and hardware development
Regarding the potential of the innovations of the top 10 SME nnovators 4 were recognised as innovations with high potential The remaining six are innovations with medium potential
Table 4 Top 10 SMEs and their innovations
Rank by ICI Organisation name Country Region Project Innovation Innovation Potential
1 ARDUINO SA SWITZERLAND TICINO SOCIALampSMART_A High Innovation Potential
5 HELIATEK GMBH GERMANY DRESDEN KREISFREIE STADT X10D_A High Innovation Potential
8 ERLANG SOLUTIONS LIMITED
UNITED KINGDOM BERKSHIRE RELEASE_A
High Innovation Potential
10 EPIGAN BVBA BELGIUM ARR LEUVEN HiPoSwitch_A High Innovation Potential
11 DATALASE LTD UNITED KINGDOM UV-Marking_B
Medium Innovation Potential
12 WORLDSENSING SLNE SPAIN BARCELONA RELYonIT_A Medium Innovation Potential
14 2ND QUADRANT LIMITED
UNITED KINGDOM KENT CC AXLE_A
Medium Innovation Potential
17 ONTOTEXT AD BULGARIA SOFIA PHEME_B Medium Innovation Potential
21 STICHTING EUROPEANA THE NETHERLANDS
AGGLOMERATIE S-GRAVENHAGE
EAwareness_C Medium Innovation Potential EAwareness_B
24 SPARSITY SL SPAIN BARCELONA LDBC_C Medium Innovation Potential
Calculations JRC
Data European Commission DG Connect
Note The table presents the list and characteristics of SMEs High Capacity Innovators as defined in section 24 and their innovations Innovators are defined as key organization behind the innovation according to the answers the question 12 of the Innovation Radar Questionnaire Total number of reviewed projects 603 Total number of innovations 1128 Review period 01102014 and 18012016
31
Box 1 Arduino ndash Nr 1 innovator among 1000 organizations participating in the EC-
funded research projects
Arduino is an open-source electronics platform based on easy-to-use hardware and software Arduino boards are able to read inputs (eg light on a sensor a finger on a button or a Twitter message) and turn them into outputs (eg activating a motor turning on an LED publishing something online) Users can tell their boards what to do by sending a set of instructions to the microcontroller on the board To do so they use the Arduino programming language (based on Wiring) and the Arduino Software (IDE) based on Processing
Arduino was developed at the Ivrea Interaction Design Institute Italy as an easy tool for fast prototyping and was aimed at students without electronics and programming backgrounds Soon afterwards it was released under a Creative Commons licence As it gained populairity and acceptance among user-innovators the Arduino board started changing to adapt to new needs and challenges It differentiated its offer from simple 8-bit boards to products for IoT applications wearables 3D printing and embedded environments All Arduino boards are open-source which empower users to build them independently and eventually adapt them to their particular needs The software is also open-source and is growing through the contributions of users worldwide (Evans 2011)
The key element of the Arduino ecosystem is the community around it (Evans 2011) The community of makers has contributed to the Arduino ecosystem by developing code and libraries designing new hardware teaching workshops and classes and sharing what they have made Arduino is now being taught in high schools colleges and universities everywhere around the world It is assumed that the number of Arduino members increases by 100000 per month (SJTU 2015) A large share of the users and developers come from developing countries In China for example a large part of the community is made up of teachers They play a critical role in the development of the Arduino ecosystem They publish documents that can be used to teach Arduino technology in schools and educate new generations of Arduino community members
When we look at the Arduino case we see that the technological networks that work on these issues include growing numbers of organizations and individuals Moreover the concept of Arduino opens up possibilities that go clearly far beyond hobby activities and have real economic impacts Today there is already a range of open source hardware products including synthesizers MP3 players amplifiers high-end voice-over-IP phone routers mobile phones and laptops (Thompson 2008) The Arduino ecosystem allows the creation of infrastructure for large technological projects like smart homes or IoT
There are already a number of companies that have built their business models around the Arduino ecosystem For example most of the 13 largest open source hardware companies that in 2010 earned approximately $50 Mln in revenues operate within the Arduino community (Torrone amp Fried 2010) By 2010 all of them earned at least $1 Mln in revenues and most of them earned nearer $5 Mln and were involved in hundreds of projects
Like Linux for software Arduino is an example of how the process of innovation has evolved over the last few decades The development and production of advanced technological products is increasingly taking place within collaborative user communities rather than within a single integrated hierarchical organization
47 Location of innovators
Figure 15 provides a list of countries with the total number of innovators for each Germany has the most over 15 of all the key organizations involved in delivering the innovations are from Germany The UK has 1351 of the total number of innovators Italy has 1179 and Spain
32
(1174) Innovators located outside the EU are from Switzerland Norway Israel Turkey Australia South Africa Kenya Philippines Canada and the US
Figure 15 Locations of innovators by country
Calculations JRC
Data European Commission DG Connect
Note The figure includes locations of innovators by country of origin ie key organizations in delivering innovations identified in the answers to the question the question 12 of the Innovation Radar Questionnaire Average IPI score as defined in section 21 corresponds to the innovations to which innovators from relevant location contribute Total number of reviewed projects 603 Total number of innovations 1128 Review period 01102014 and 18012016
48 Innovator capacity and innovation potential
Figure 16 shows the relationship between the innovation potential indicator and innovator capacity indicator values The correlation coefficient of the two indicators is 045 Thus although overall it can be said that there is a positive relationship between the two indicators a high score in one indicator does not translate into high performance in the other In other words as demonstrated in Section 43 there are high capacity innovators that participate in delivering innovations with low or medium potential By the same token there are low capacity innovators that were identified as key organizations in developing innovations with high potential
The best illustration of the fact that there is no clear-cut relationship between innovator and innovation performance is that innovations with medium potential dominate in all categories of innovator capacity For example as shown in Figure 12 more than half of all the high capacity innovators (669) were identified as key organizations in delivering innovations with medium potential This number is even higher for medium capacity innovators (76 1)
The above observation leads to the conclusion that improving the overall performance of innovative output requires a focus on both the innovations and the organizations behind them In
33
the case of innovations the focus is on increasing their market potential or improving their management In turn expanding innovators capacity requires efforts by individual organizations to increase their performance However this also depends on their environment which can positively or negatively affect their innovative outputs
Figure 16 Relationship between the innovation potential indicator and innovator
capacity indicator values
20
40
60
80
10
0
Inno
vato
r C
apa
city Ind
ica
tor
20 40 60 80 100Innovation Potential Indicator
Calculations JRC
Data European Commission DG Connect
Note The figure presents the relationship between innovation IPI score as defined in section 21 and the ICI score of the key organization behind the innovation Total number of reviewed projects 603 Total number of innovations 1128 Review period 01102014 and 18012016
34
5 Universities as Co-innovators in EC-funded Research Projects
This section tackles questions related to the involvement of different types of organizations in innovation activities the results of these collaborations and the role of universities as co-inventors in EC-funded research projects by
Looking at the relationship between innovation potential and various types of organizations identified as key innovators (Section 52)
Reporting on the type of innovations developed by different combinations of organizations (Section 53)
Analysing whether the type of organizations has implications for the innovation development stage and their exploitation plans (section 54)
This is complemented by an analysis of whether different types of organizations exhibit different needs with respect to innovation commercialisation (Section 73)
51 In a nutshell
The main findings of the analysis of universities as co-innovators are that
Of the innovations with high potential universities and research centres deliver about 28 whereas SMEs deliver about 44 However universities are identified as key co-innovators in over 70 of all the innovations with high potential
Collaboration between universities and SMEs delivers the largest share of innovations with high potential (approx 31) followed by collaboration between private organisations
Collaboration between universities and SMEs seems to be more fruitful than between universities and large firms
New products are considerably more often co-developed in the course of collaboration involving universities Although private-private partnerships are also an important source of new products they show equal interest in developing new processes and organizational methods This may suggest that universities are the source of new products that are then channelled through private organizations to the market
Innovations co-developed with universities have equal chances of commercial exploitation as those introduced by private-private collaborations
52 Collaboration with universities and innovation performance
This section looks at the relationship between innovation potential and the type of organizations involved in its development In particular it looks at the question of whether there is a difference in the potential of innovations that were (co-) developed by universities and private organizations ie SMEs and large enterprises
Figure 13 and Figure 14 present the distribution of the different organisation types by innovation potential Higher education and schools and research centres (HESREC) make up the lions share of the organisations sample (54) However they only deliver about 28 of innovations with high potential - less than SMEs which deliver about 44
When focussing on cooperation SMEs are still the pull for the development of innovations with high potential Figure 17 shows the distribution of pairwise cooperation by innovation potential for all the innovations reviewed Collaboration between higher education and schools and research centres and SMEs (Uni_Sme) delivers the highest share of innovations with high potential (around 31) This is followed by collaboration between HESREC and large organisations (Uni_Large) with 248 The innovation resulting from these two types of collaboration and the collaboration
35
between private organisations (Firm_Firm3) are increasing in innovation potential On the other hand when higher education and schools and research centres collaborate among themselves (Uni_Uni) the innovation potential of the innovative outcome decreasesl as shown by the 154 innovations with high potential and the 445 innovations with low potential However it has to be taken into account that the Innovation Radar targets innovations that have the potential to be brought to the market in the near future As discussed above consistent with their status and mission the main reason universities participate in EU-funded research projects is to develop research and technology Therefore the critical issue is collaboration between private organizations aiming at commercialisation of the research results
Figure 17 of innovators by collaboration type and innovation potential category
Calculations JRC
Data European Commission DG Connect
Note Innovators are defined as key organization behind the innovation according to the answers to the question 12 of the Innovation Radar Questionnaire Collaboration types Uni_Uni (Higher Education and Schools and Research Centres) Uni_Sme (Higher Education and Schools and Research Centres and SMEs) Uni_Large (Higher Education and Schools and Research Centres and Large companies) Large_Sme (Large companies and SMEs) Firm_Firm (private organisations of the same entity ie Large_Large or Sme_Sme) Total number of reviewed projects 603 Total number of innovations 1128 Review period 01102014 and 18012016
Taking into account the above and in order to see what type of collaboration increases the innovation potential and commercialization of innovations developed in EU-funded research project an additional analysis was performed Figure 18 presents the coefficient estimated by a linear regression model which investigates the impact of different types of collaboration and project characteristics ie the time of the review (when the project was evaluated) and the EC contribution to the project on innovation potential The reference baseline of the regression model is collaboration between HESREC (Uni_Uni) and first project review Regarding the collaboration type the collaboration between private organizations (Sme_Smes Large_Large and Large_Sme) had the strongest effect on innovation potential On average the potential score of innovation co-developed by at least two private firms is about 10 points higher than it is when an innovation is co-developed by universities Collaboration between SMEs has the highest coefficient Again this does not come as a surprise as firms have stronger incentives and capacities to bring technology to the market Therefore what is considerably more interesting is the effect of collaboration between universities and different types of private firms There one can observe that innovations
3 The category Firm_Firm is built taking into account all the collaborations between private organisations
of the same entity That is either Large_Large or Sme_Sme
36
co-developed by universities and SMEs have on average higher innovation potential scores than those co-developed by universities and large firms Whereas innovations co-developed between universities and SMEs have a 48 point higher score as compared to the reference point those that are co-developed by universities and large firms have a score of only 43 This observation is consistent with previous findings that indicate that SMEs benefit more than large firms from collaboration with universities in publicly-funded research projects (Okamuro 2007)
As expected a review later in the life of the project finds that the average value of the innovations developed has increased This confirms previous observations which suggest that ideas and technologies developed during EU-funded research projects mature and increase their potential as projects advance On the other hand the amount of EC funding allocated to the project does not seem to affect the potential of the innovation
Figure 18 Linear estimates of innovation potential indicators and innovation
partnerships
Calculations JRC
Data European Commission DG Connect
Note OLS robust standard errors number of observation 1426 R-squared 014 Total number of reviewed projects 603 Total number of innovations 1128 Review period 01102014 and 18012016
To conclude the importance of SMEs in delivering innovations with high potential is observed also when looking at the different type of collaboration between projects Interestingly enough when private organisations pair together they increase their probability of delivering innovations with high potential while the same is not true for HESREC This may suggest the need for support for HESREC to increase the market potential of the innovations developed
53 Innovation type and collaboration type
The Innovation Radar characterises the types of innovation by distinguishing between new or significantly improved product process service marketing and organisational method Based on this information Figure 19 presents the relationship between the mix of organizations involved in innovation (co-) development and the type of innovation
37
Over 50 of the innovations are product innovations followed by service and process At the same time very few innovations belong to organisational and marketing method that accounts for only 3 of the total innovation output4 As shown by the figure the distribution of the innovation type is relatively stable across the different organisation composition However new products are considerably more often co-developed in the course of collaboration involving universities For example 63 of innovations developed by university and SMEs are new product In contrast only 51 of innovations delivered as a result of collaboration between SMEs and large firms are new products The remaining half represents innovations that can be described as new processes services or organizational methods This can suggest that universities are a source of novel technologies that are channelled through private organizations to the market
Figure 19 of innovators by collaboration and innovation type
Calculations JRC
Data European Commission DG Connect
Note Innovators are defined as key organization behind the innovation according to the answers to the question 12 of the Innovation Radar Questionnaire Collaboration types Uni_Uni (Higher Education and Schools and Research Centres) Uni_Sme (Higher Education and Schools and Research Centres and SMEs) Uni_Large (Higher Education and Schools and Research Centres and Large companies) Large_Sme (Large companies and SMEs) Firm_Firm (private organisations of the same entity ie Large_Large or Sme_Sme) Total number of reviewed projects 603 Total number of innovations 1128 Review period 01102014 and 18012016
54 Innovation stage and exploitation plans
This section deals with the question of whether there is a pattern in the innovation development stage and exploitation plans depending on the type of organizations involved in its (co-) development The idea is that organisations of different types may apply for EC projects at different stages of their innovation development Indeed one could expect that private organisations may apply for public funding after having already initiated the development of the innovation while universities are more likely to start innovation development after having been granted public funding
Figure 20 shows the percentage of innovators by cooperation type and innovation development Figure 20 shows there is no clear pattern Even when focussing on collaboration between organisations of same type the relative differences between innovation stages are negligible and do not bring additional information on the exploitation plans deployed by the distinct organisations
4 For simplicity of presentation possible innovation output was grouped into four categories combining
organisational and marketing method
38
In order to ensure the results were not influenced by when the review took place we also analysed jointly the different types of collaboration at the different stages of the review process The results didnt show any major differences across organisation type apart from a general trend for all organisations towards a higher percentage of innovations Already developed but not yet being exploited and innovations Being exploited in the final period of the project
Figure 20 of innovators by collaboration type and innovation development
Calculations JRC
Data European Commission DG Connect
Note Innovators are defined as key organization behind the innovation according to the answers to the question 12 of the Innovation Radar Questionnaire Collaboration types Uni_Uni (Higher Education and Schools and Research Centres) Uni_Sme (Higher Education and Schools and Research Centres and SMEs) Uni_Large (Higher Education and Schools and Research Centres and Large companies) Large_Sme (Large companies and SMEs) Firm_Firm (private organisations of the same entity ie Large_Large or Sme_Sme) Total number of reviewed projects 603 Total number of innovations 1128 Review period 01102014 and 18012016
39
6 The role of end user engagement for innovation potential
In the past decades the innovation model has shifted from a linear model where end-users intervene only at the very end of the process to a more collaborative model where end-users actively contribute to the innovation process The increasing importance of the role of end-users in innovation processes has been highlighted in the work of Chesbrough (2003) and von Hippel (2005) who both recognize end-users as important sources of valuable ideas for firms The Innovation Radar recognises the importance of end-users being close to the innovation process and reports on the engagement of end-users in the project consortium Below we show how the engagement of end-users affects the innovation potential of the projects
61 In a nutshell
The analysis of end user engagement in the project consortium produced the following main findings
There is a positive relation between the engagement of end-users and innovation potential High Innovation potential projects report the highest share of end-users engagement The share of end-users engagement inside the consortium is 64 and 33 for end-users outside the consortium
End-users engagementndash both internal and external to the consortium- positively affects the level of commitment of relevant partner in exploiting the innovation Projects with high shares of end-users engagement (32 when end-users are inside the consortium and 16 when outside the consortium) show a High level of partners commitment
40
Figure 21 shows the distribution of end-users across projects by innovation potential End-users could either belong to the consortium or be external to the project High innovation potential projects report the overall highest share of end-user engagement 64 (part of the consortium) and 33 (outside the consortium) Interestingly the low innovation potential projects account for the lowest rate of end-user engagement Indeed the percentage of low innovation potential projects that declare no end-user engagement is above 30 We do not have the necessary information for assessing whether a causal relation between end-user engagement and innovation potential exists However the data confirms a positive relation between the engagement of end-users and innovation potential
41
Figure 21 End user engagement by innovation potential
Calculations JRC
Data European Commission DG Connect
Note The computations were based on the responses to general question 1 of the Innovation Radar Questionnaire Total number of reviewed projects 603 Total number of innovations 1128 Review period 01102014 and 18012016
End-user engagement may also affect the overall innovation performance of the project and the level of commitment of relevant partners in exploiting the innovation Figure 22 presents data on the project partners commitment and innovation performance The data suggest that end-user engagement ndash both internal and external to the consortium - increases the level of commitment of relevant partners in exploiting the innovation On the other hand the results in terms of innovation performance do not show that end-user engagement directly improves the project
Figure 22 End user engagement by partners commitment and innovation performance
Calculations JRC
42
Data European Commission DG Connect
Note The computations were based on the responses to general question 1 6 and 8 of the Innovation Radar Questionnaire Total number of reviewed projects 603 Total number of innovations 1128 Review period 01102014 and 18012016
43
7 Steps and barriers to innovation commercialisation
This section deals with three issues concerning innovation commercialisation First it presents the responses to the questions on the steps that organizations undertook or plan to undertake in order to bring the innovations to (or closer to) the market Second it provides an overview of what innovators need to fulfil the market potential of their innovations and finally it shows what the most common bottlenecks to innovation commercialization are
71 In a nutshell
The main findings of the analysis of steps and barriers to innovation commercialisation include
When taking innovations to the market projects focus more on technology-related steps than business-related ones 664 of the projects that plan to commercialise their innovations undertake or plan to undertake demonstration or testing activities In contrast only 40 of projects have carried out or plan to carry out a market study A business plan is on the agenda of only 36 of projects that plan innovation commercialisation
Activities that involve participations or interactions with actors outside of the projects are relatively uncommon Only 45 to 9 of the projects have sought or are planning to seek private or public funding
Three of the most common needs are partnership with another company (195) business plan development (167) and expanding to more markets (149)
The least frequently named needs include incubation (64) participation in a start-up accelerator (59) and investor readiness training (56)
307 of project partners see financing as the major external bottleneck to innovation exploitation
Only 25 of the project partners consider trade issues between Member States and the rest of the world as a barrier to exploiting their innovative products or services
72 Steps to innovation commercialisation
Figure 23 indicates what steps have already been taken or are planned by projects to bring their innovations to (or closer to) the market This figure distinguishes between technology-related steps (eg feasibility study or prototyping) and business-related steps (eg business plan or capital investment)
Concerning technology-related steps prototyping and demonstration or testing activities are the most common measures that projects undertake in order to bring their innovations to the market Of the projects that are plannng to introduce their innovations to the market 664 is either undertaking or planning demonstration or testing activities or creating or planning to develop a prototype (654) Developing a pilot (552) is also quite common Among the most desirable steps that have not been taken or planned are feasibility studies engagement by industrial research team of one of their companys business units in project activities and technology transfer Around 12 of projects that are planning to introduce their innovations to the market perceive that these activities will facilitate innovation commercialisation
With respect to business-related steps Figure 23 shows that carrying out a market study and writing a business plan are among the most common steps that help to commercialise innovations Around 40 and 36 of projects have carried out or plan to carry out a market study and write a business plan At the same time around 16 of the projects see these steps as desirable and between 16 and 18 have not planned them in the course of innovation commercialisation A significantly smaller number of projects consider undertaking steps like launching a start-up or a spinoff or seeking funding For example between 5 and 9 of the projects have sought or are planning to seek private or public funding and between 25 and 28 of the projects consider this
44
step as desirable At the same time between 40 and 33 of the projects do not plan to seek capital or public investment
The evidence presented above leads to the following conclusions First the technology-related steps to bring innovations to the market are seen as more important than business-related ones Organizations very often focus on making sure that the innovation they develop is ready to be commercialised from the technological point of view To this end projects create a prototype or perform demonstrations or testing activities Relatively often organizations do not undertake or plan business-related steps Second in both cases ie technology- and business-related activities the emphasis is on what can be done within the project and among the participants Activities that involve interactions with actors outside of the projects or participation by them are less common particularly as regards seeking external funding Only a few projects see these activities as relevant to the commercialisation of innovations and many of them do not plan to undertake them This calls for two kinds of support First projects should be encouraged to look beyond the technological aspects and introduce business-related elements to their activities Second they should be encouraged to increase interaction with external specialised actors eg business coaches or venture capitalists as this could help them to improve the commercialisation chances of their innovations
Figure 23 Progress of projects in bringing innovations to the market
Calculations JRC
Data European Commission DG Connect
Note The computations were based on the responses to question 10 of the Innovation Radar Questionnaire Total number of reviewed projects 603 Total number of innovations 1128 Review period 01102014 and 18012016
73 Innovators need to realise the market potential of innovations
Figure 24 presents the responses to the question what do innovators need to realise the market potential of their innovations The most common needs are seen as partnerships with other companies business plan development and expanding to more markets The least frequently named needs include investor readiness training participation in a start-up accelerator and incubation
45
Figure 24 Innovators needs to fulfil the market potential of their innovations
Calculations JRC
Data European Commission DG Connect
Note The computations were based on the responses to question 13 of the Innovation Radar Questionnaire Total number of reviewed projects 603 Total number of innovations 1128 Review period 01102014 and 18012016
74 Type of organization and need to realise the market potential of innovations
Below we analyse whether the fact that an innovator is a university or private organizations has any implications for the further support needed to bring its innovation to the market
Figure 25 presents innovators needs to fulfil the market potential by organisation type As already shown in Figure 24 the most common need reported is partnership with another company (195) The breakdown by organisation type shows that the most common need reported by higher education and schools and research organisations (HSEREC) is partnership with another company (118 of the total needs or 605 of the specific needs) followed by business plan development (9 or 54) and legal advice (73 or 62) For private organisations the most common needs reported are expanding to more markets and developing a business plan (between 5 and 3 respectively) Moreover in general HESREC seem to report more needs than private organisations
In order to better analyse the differences between organisations in reporting potential market needs we ran a multinomial logistic regression and reported the resulting marginal effects in Figure 26 The figure shows that we can identify clearly different patterns for HESREC and private organisations The figure also shows the probability of reporting a specific need all other things remaining constant for specific organisations
For HESREC the probability of reporting needs such as start-up accelerator incubation partnership mentoring and legal advice are all positive and range from 10 to 20 On the other hand being an HESREC reduces the probability of reporting needs such as expanding to more markets or developing a business plan The situation is completely the reserve for private organisations where both large enterprises and SMEs are more likely to report the latter as their most common needs Private organisations diverge only with respect to investor introductions which are more relevant for SMEs and HESREC than they are for large enterprises
The results of the analysis suggest that HESREC tend to report more needs related to the finalisation of the innovation and the subsequent steps to bring it to the market while private organisations needs are more related to the commercialization of the innovation and the need to create or expand their markets
46
Figure 25 Innovators need to fulfil the market potential by organisation type
Calculations JRC
Data European Commission DG Connect
Note The computations were based on the responses to question 13 of the Innovation Radar Questionnaire Total number of reviewed projects 603 Total number of innovations 1128 Review period 01102014 and 18012016
Figure 26 Marginal effects of potential market needs by organisation type
Calculations JRC
Data European Commission DG Connect
Note Marginal effects multinomial logistic regression number of observation2095 Total number of reviewed projects 603 Total number of innovations 1128 Review period 01102014 and 18012016
47
75 Bottlenecks to innovation commercialization
Figure 27 presents responses to the question of what are the external bottlenecks that compromise the ability of project partners to exploit new products solutions or services internally or in the market place For the majority of project partners (307) lack of financing is seen as the major external bottleneck to innovation exploitation Regulation and standards account for 156 and 143 respectively together with the generic group others IPR and workforce skills are considered as relatively important Around 10 of the projects perceive at least one of the two issues as an external factor that could threaten the ability of project partners to commercially exploit innovations Among the bottlenecks seen as least harmful are trade issues between Member States and the rest of the world Only 25 of the project partners consider these as barriers to exploiting their innovative products or services
Comparing the steps that organizations undertook or plan to undertake in order to bring their innovations to (or closer to) the market (see Figure 23) and the information presented in Figure 27 leads us to observe an apparent contradiction between what project organisations claim to be a barrier and their actual behaviour While 307 of project partners see lack of financing as a barrier to exploiting their innovative products or services only 5 to 9 of the projects have sought or are planning to seek private or public funding Moreover between 33 and 40 of the projects do not plan to seek capital or public investment This point is further emphasised by the fact that organizations most commonly declare that they need partnerships with other companies and to expand to more markets in order to realise the market potential of their innovations
Figure 27 External bottlenecks that compromise the ability of project partners to
exploit innovations
Calculations JRC
Data European Commission DG Connect
Note The computations were based on the responses to general question 4 of the Innovation Radar Questionnaire Total number of reviewed projects 603 Total number of innovations 1128 Review period 01102014 and 18012016
48
8 Conclusions
This section summarises the key messages from the analysis of the IR data These focus specifically on the role of collaboration between universities and private organisations
Nurturing business culture among innovators
The current analysis shows that the key organizations behind ICT FP7Horizon2020-related innovations tend to have high levels of technological involvement but pay less attention to the business-related dimensions of their innovations It seems that there is a strong need for projects to look beyond the technological aspects and introduce business-related elements into their activities This can be achieved by providing incentives for increasing interactions between projects and external specialised actors eg business coaches or venture capitalists who could help to improve the commercialisation chances of innovations
Another interesting aspect emerging from the IR data is the high participation and active role of SMEs in delivering innovations with high potential SMEs are an important vehicle for co-creating and commercialising innovative technologies developed within ICT FP7Horizon2020 projects
Industry-university collaboration
Collaboration between universities and industry plays a crucial role in driving innovation processes Universities possess essential skills for innovation supplied to business They are the basis of the knowledge-based economy The close collaboration between university and industry poses a series of policy questions on how to foster this collaboration and what kind of policy support should be implemented
The IR data showed that universities are key co-innovators in over 70 of all innovations with high potential Collaboration between universities and SMEs delivers the largest share of innovations with high potential and seems to be more fruitful than the collaboration between universities and large firms This may suggest that universities are a source of innovative products that are channelled through private organizations to the market and that SMEs form a better bridge to universities in this process Finally innovations co-developed with universities are as likely to be commercially exploited as those introduced by private-private collaborations
49
References
Caloghirou Y Tsakanikas A amp Vonortas N (2001) University-Industry Cooperation in the Context of the European Framework Programmes [journal article] The Journal of Technology Transfer 26(1) 153-161 doi 101023a1013025615518
Chesbrough H (2003) Open Innovation The New Imperative for creating and Profiting from Technology Boston Harvard Business School Press
De Prato G Nepelski D amp Piroli G (2015) Innovation Radar Identifying Innovations and Innovators with High Potential in ICT FP7 CIP amp H2020 Projects JRC Scientific and Policy Reports Seville JRC-IPTS
EC-CONNECT (2013) Overview of Research Projects in the ICT Domain 2012 ICT statistical report for annual monitoring (StReAM) European Commission httpseceuropaeudigital-agendasitesdigital-agendafilesStream_2012pdf
Evans B (2011) Beginning Arduino Programming Springer
Hernan R Marin P amp Siotis G (2003) An Empirical Evaluation of the Determinants of Research Joint Venture Formation The Journal of Industrial Economics 51(1) 75-89
OECD (2015) OECD Science Technology and Industry Scoreboard 2015 Paris OECD
Okamuro H (2007) Determinants of successful RampampD cooperation in Japanese small businesses The impact of organizational and contractual characteristics Research Policy 36(10) 1529-1544 doi httpdxdoiorg101016jrespol200612008
Polt W Vonortas N amp Fisher R (2008) The impact of publicly funded research on innovation An analysis of European Framework Programmes for Research and Development European Commission Directorate-General for Internal Market Industry Entrepreneurship and SMEs
Roumlller L-H Siebert R amp Tombak M (2007) Why Firms Form (or do not Form) RJVS The Economic Journal 117(522) 1122-1144 doi 101111j1468-0297200702069x
Siebert R (1996) The Impact of Research Joint Ventures on Firm Performance An Empirical Assessment (Vol CIG Working Papers FS IV 96-03) Wissenschaftszentrum Berlin (WZB)
SJTU (2015) Federico Musto of Arduino Our real boss is the community SJTU PARISTECH REVIEW(2015-11-11)
Thompson C (2008 20102008) Build It Share It Profit Can Open Source Hardware Work Wired Retrieved from httpswwwwiredcom200810ff-openmanufacturing
Torrone P amp Fried L (2010) Million dollar baby ndash Businesses designing and selling open source hardware making millions Paper presented at the Foo Camp East 2010 httpmakezinecom20100506million-dollar-baby-businesses-de
von Hippel E (2005) Democratizing Innovation MIT Press
HOW TO OBTAIN EU PUBLICATIONS Free publications bull one copy
via EU Bookshop (httpbookshopeuropaeu)
bull more than one copy or postersmaps
from the European Unionrsquos representations (httpeceuropaeurepresent_enhtm)
from the delegations in non-EU countries (httpeeaseuropaeudelegationsindex_enhtm)
by contacting the Europe Direct service (httpeuropaeueuropedirectindex_enhtm) or
calling 00 800 6 7 8 9 10 11 (freephone number from anywhere in the EU) ()
() The information given is free as are most calls (though some operators phone boxes or hotels may charge
you)
Priced publications bull via EU Bookshop (httpbookshopeuropaeu)
doi102791244949 ISBN 978-92-79-64630-0
LF
-NA
-28
35
5-E
N-N
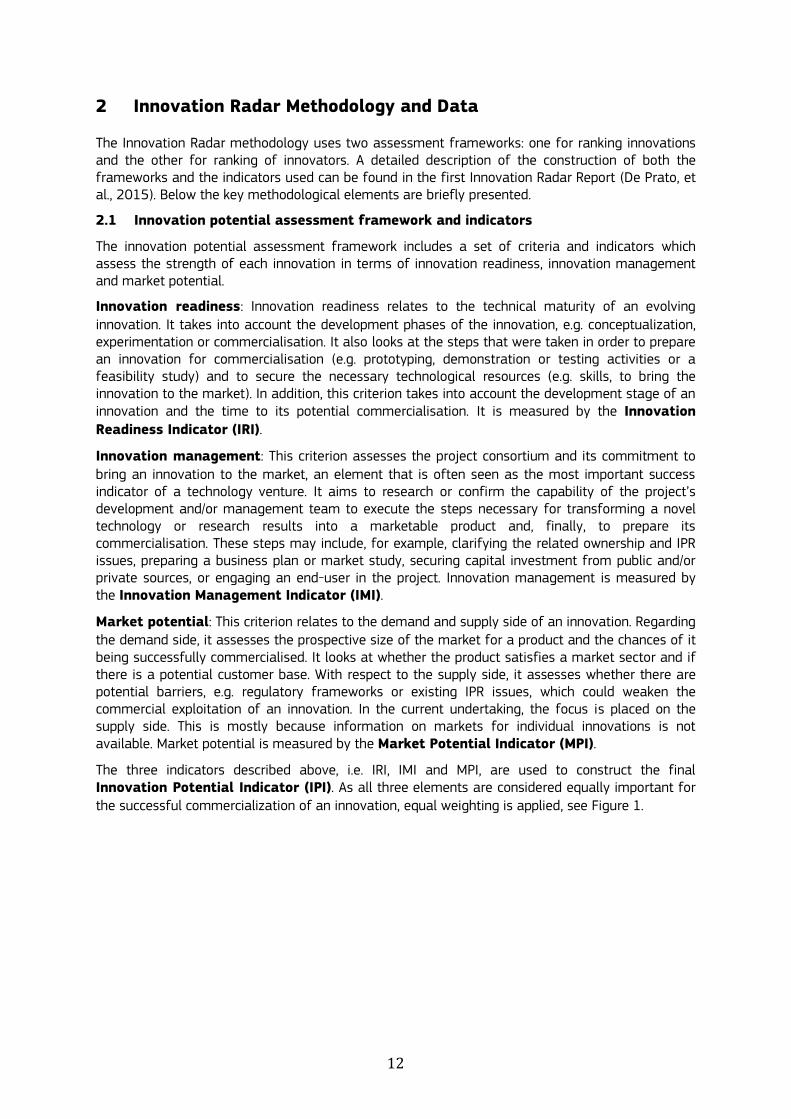
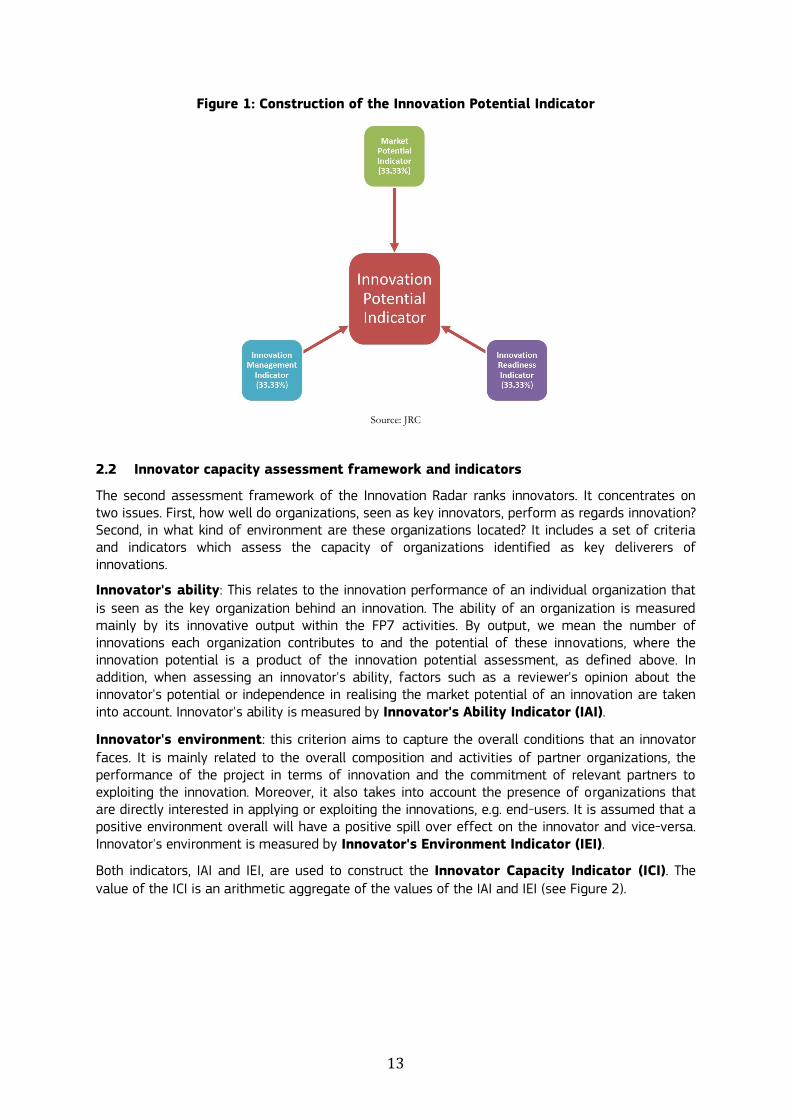
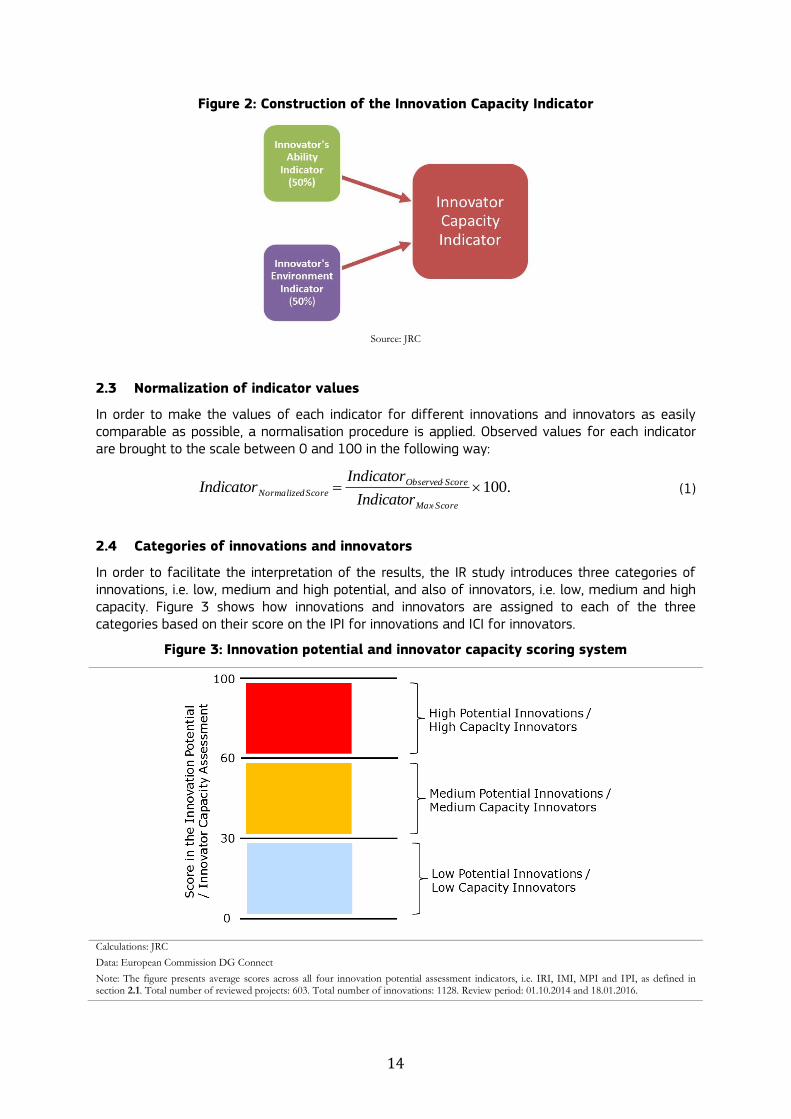
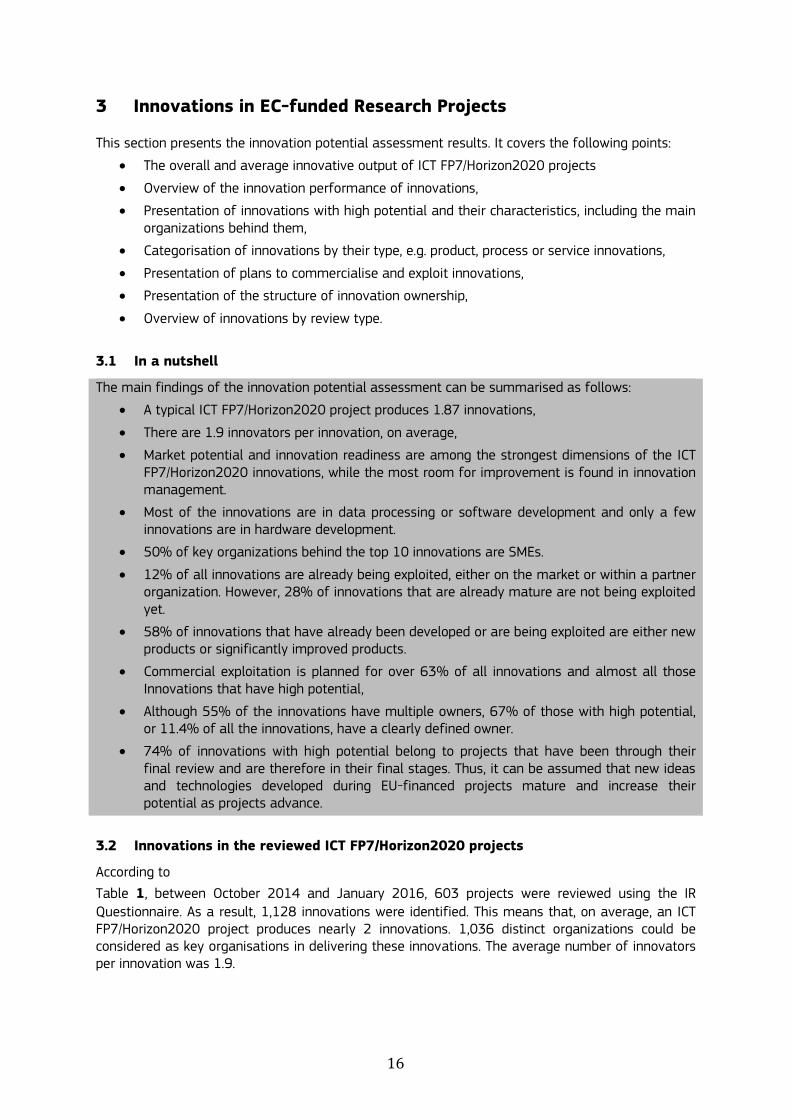
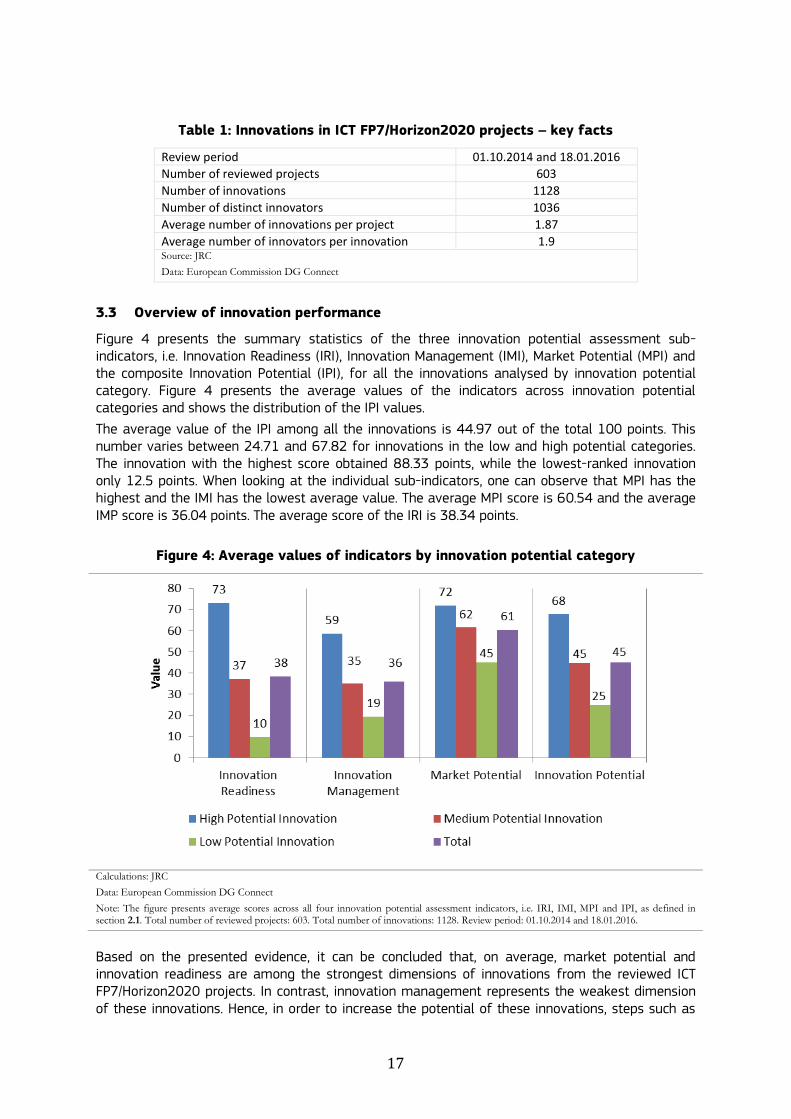
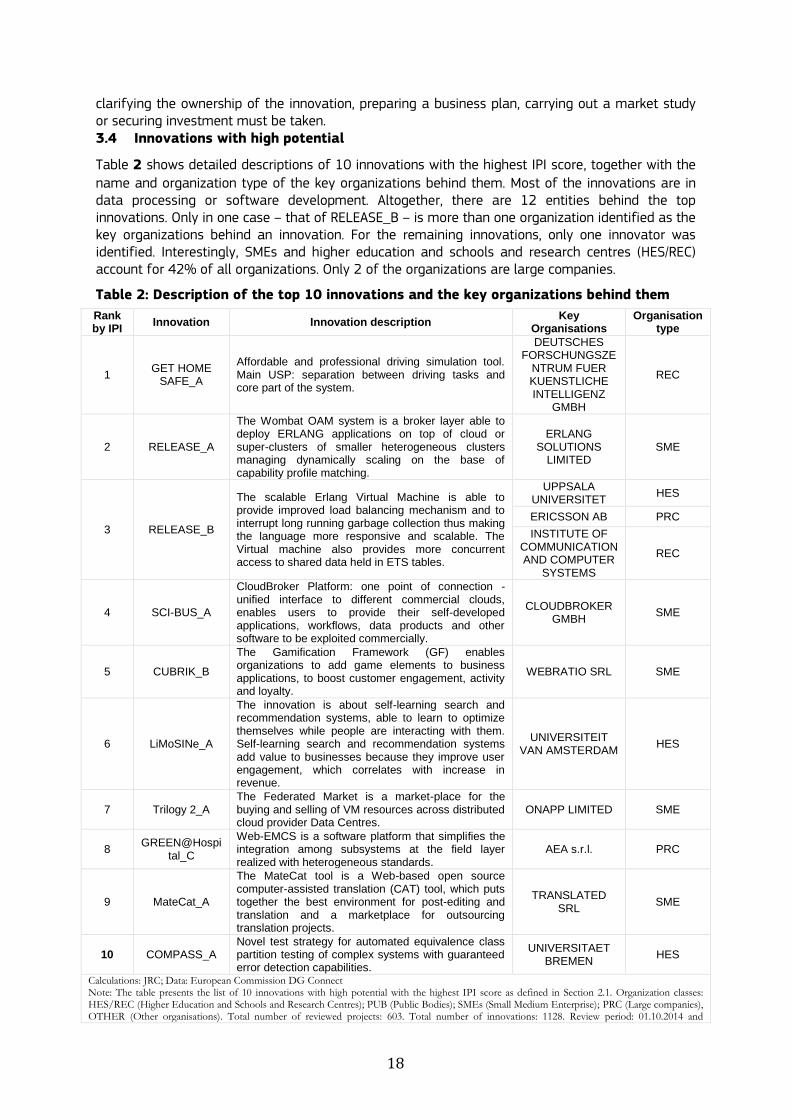
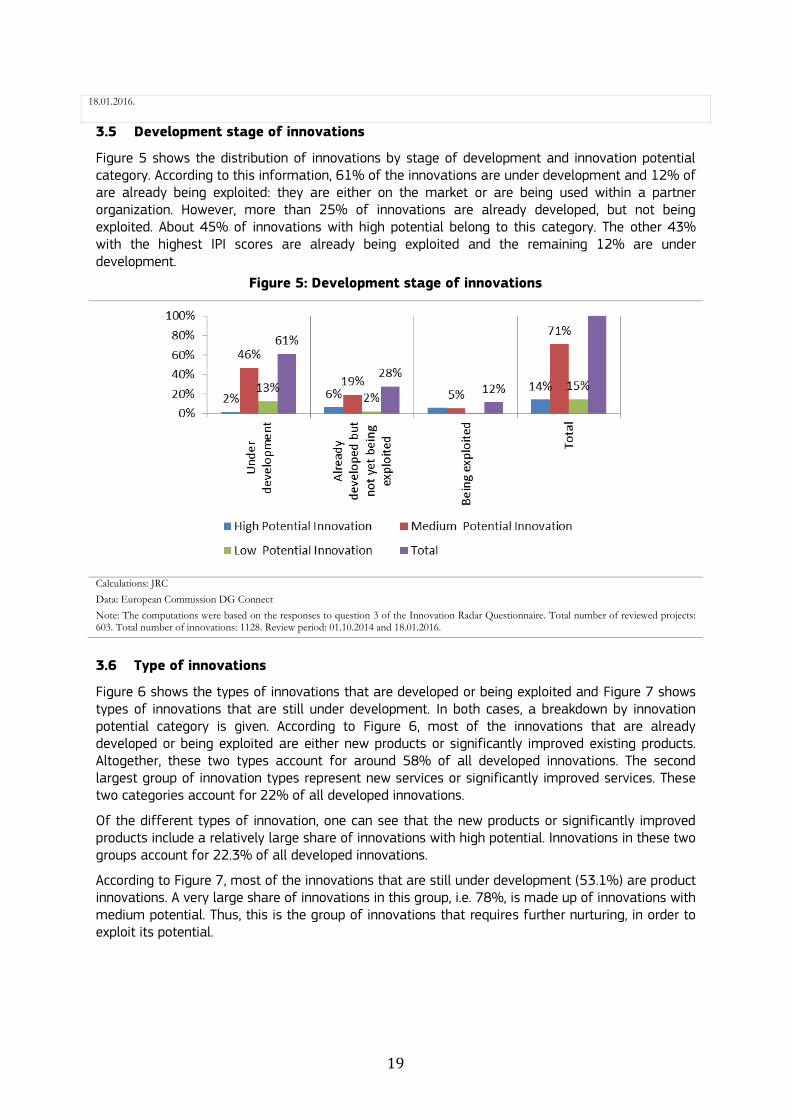
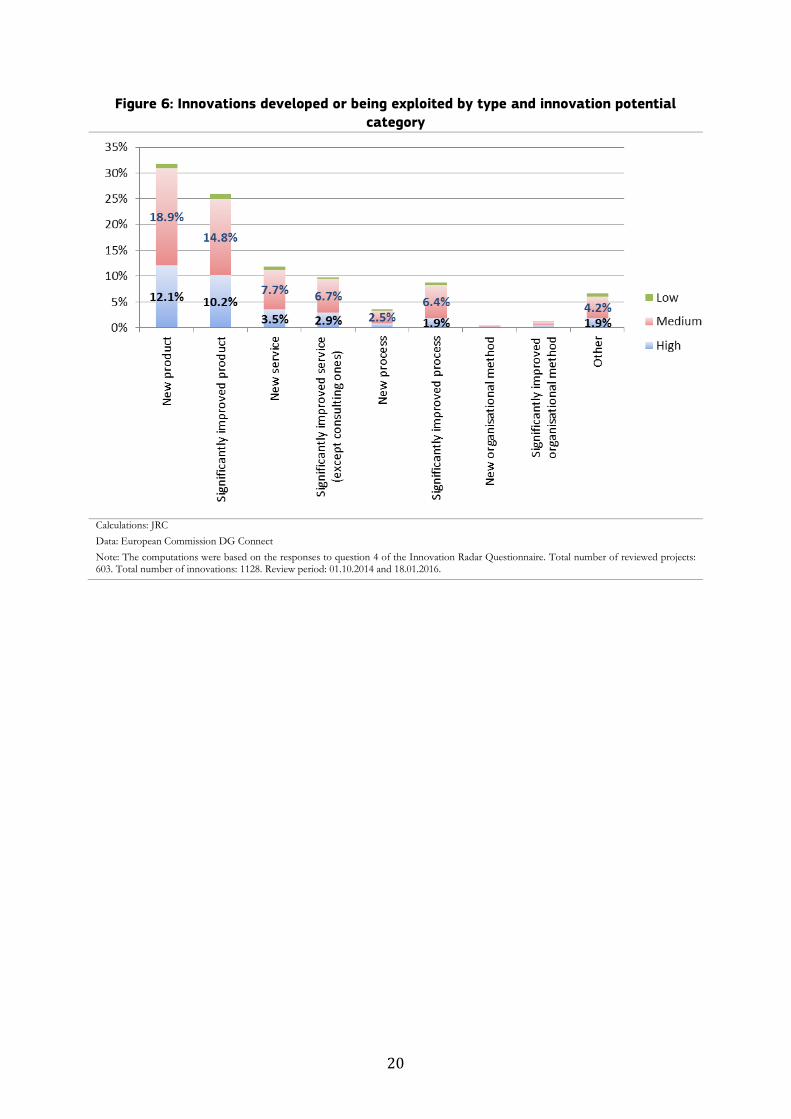
20
Figure 6 Innovations developed or being exploited by type and innovation potential
category
Calculations JRC
Data European Commission DG Connect
Note The computations were based on the responses to question 4 of the Innovation Radar Questionnaire Total number of reviewed projects 603 Total number of innovations 1128 Review period 01102014 and 18012016
21
Figure 7 Innovations under development by type and innovation potential category
Calculations JRC
Data European Commission DG Connect
Note The computations were based on the responses to question 4 of the Innovation Radar Questionnaire Total number of reviewed projects 603 Total number of innovations 1128 Review period 01102014 and 18012016
37 Exploitation and commercialisation of innovations
Figure 8 shows the breakdown of innovations by exploitation and innovation potential category A distinction between commercial and internal exploitation is made According to this information commercial exploitation is planned for 63 of all innovations and for almost all innovations with high potential Only 05 of innovations with high potential are exploited internally whereas over 23 of all innovations are Internal exploitation is expected to take place through changes in organization new internal process implementation etc The remaining innovations ie 13 are not planned to be introduced to the market or exploited internally
22
Figure 8 External vs internal exploitation by innovation potential category
Calculations JRC
Data European Commission DG Connect
Note The computations were based on the responses to question 6 of the Innovation Radar Questionnaire Total number of reviewed projects 603 Total number of innovations 1128 Review period 01102014 and 18012016
38 Innovation ownership
Figure 9 presents the information on innovation ownership and innovation potential category A distinction between innovations with one clear owner and multiple owners is made 45 of all innovations have a clear owner while the ownership rights of the remaining innovations belong to multiple owners The majority innovations with high potential (ie 67) have clearly defined ownership whereas only 114 of the total number of innovations do
Figure 9 Innovation ownership by innovation potential category
Calculations JRC
Data European Commission DG Connect
Note The computations were based on the responses to question 8 of the Innovation Radar Questionnaire Total number of reviewed projects 603 Total number of innovations 1128 Review period 01102014 and 18012016
23
39 Innovations by review time
During their lifecycle ICT FP7Horizon2020 projects go through three review rounds The reviews are conducted by a panel of independent evaluators who are recognized specialists in the relevant fields In addition to the standard reviews the Innovation Radar Questionnaire was applied to ongoing projects Hence the IR covers and assesses innovations and innovators that belong to projects at different stages of their lifecycle Figure 10 presents a breakdown of innovations by review time and innovation potential category 22 of all innovations belong to projects that were reviewed for the first time 35 of innovations were produced within projects that were reviewed for the second time and the remaining 428 of innovations originate from projects in their final stages
Regarding innovation potential and review time 44 of all innovations are classified as innovations with low potential and belong to projects that were reviewed for the first time This percentage goes down to 37 for innovations with low potential in projects in their final stages By the same token only 06 of all innovations are classified as innovations with high potential and they originate from projects that were reviewed for the first time However the percentage of innovations with high potential rises to 126 of all innovations for projects in their final stages Thus one can observe a relatively clear pattern while the share of innovations with low potential decreases as projects mature the reverse is true innovations with high potential
Figure 10 Number of innovations by innovation potential category and review time
Calculations JRC
Data European Commission DG Connect
Note The figure includes the count of innovations based on the project review time and innovation performance according to the IPI as defined in Section 21 Review type concerns one of the three reviews each FP7 project is subject to during its lifecycle Total number of reviewed projects 603 Total number of innovations 1128 Review period 01102014 and 18012016
24
4 Innovators in EC-funded Research Projects
This section presents the innovator capacity assessment results The analysis addresses the following points
Summary of innovator capacity performance
Presentation of high capacity Innovators and SMEs that are high capacity innovators
Overview of organizations by their type and innovations
Location of innovators
Relationship between the scores for innovator capacity and innovation potential
41 In a nutshell
The main findings of the innovator capacity assessment can be summarised as follows
On average innovators profit from an innovation-favourable environment However the quality of an innovation environment is not equal for all innovators The reason for this is that some projects do not engage end-users in the consortium or relevant partners may lack the necessary commitment to exploiting the innovation
44 of all organizations behind innovations with high potential are SMEs and in general there is a positive link between an innovations potential and an SME being involved in its development Hence it can be assumed that SMEs are important vehicles for co-creating and commercialising innovative technologies developed within ICT FP7 projects
The countries with the most organizations identified as key players in delivering the innovations are Germany (1566) the UK (1351) Italy (1179) and Spain (1174)
There is a positive relationship between an organisations innovator capacity score and the innovation potential score of the innovation the development of which this organisation is contributing to However a high score in one indicator does not automatically translate into a high performance in the other Often high capacity innovators participate in delivering innovations with low or medium potential and low capacity innovators are identified as key organizations in developing innovations with medium potential Thus improving the overall performance of innovative output requires a focus on both innovations and the organizations behind them
Among over 1000 participants identified as key innovators Nr 1 is Arduino SA a global leader in Open Source Software and Hardware development Arduino is a European-based technology platform which sets the standards of global collaborative development of future technologies
42 Overview of innovator performance
Figure 11 summarises the statistics on the two sub-innovator capacity assessment indicators ie Innovators Ability (IAI) Innovators Environment (IEI) and a composite Innovator Capacity Indicator (ICI) for all key organizations in delivering the innovations and by innovator capacity category Figure 11 shows the distribution of the ICI average values across innovator capacity categories
The average value of the ICI among all 1128 innovators is 534 out of 100 points This number varies from 242 to 687 for low to high capacity innovators The innovator with the highest score obtained 9441 points while the lowest-ranking innovator obtained only 12 points Looking at the individual sub-indicators one can observe that IEI has the highest average value among high and medium capacity innovators The average IEI score is 639 and the average IAI score is 429 points However looking at the standard deviation values of both indicators (respectively 221 and 15) one can see that IEI scores are much more volatile than those of IAI In other words the quality of the innovation environment is not equal for all innovators This happens as some projects do not
25
engage end-users in the consortium or because the relevant partners are not sufficiently committed to exploiting the innovation
Figure 11 Average values of indicators by innovator capacity category
Calculations JRC
Data European Commission DG Connect
Note The figure shows the average scores of innovators across three assessment indicators IAI IEI and ICI defined in section 0 Innovators are defined as key organization behind the innovation according to the answers to the question 12 of the Innovation Radar Questionnaire Total number of reviewed projects 603 Total number of innovations 1128 Review period 01102014 and 18012016
43 Innovators and their innovations
Figure 12 shows the distribution of innovators by innovator capacity and innovation potential category It can be seen that 282 of high capacity innovators were identified as key organizations in delivering innovations with high potential 669 of innovators in this category participate in developing innovations with medium potential and only 49 innovations with low potential Regarding the medium capacity innovators category 8 of organizations were responsible for the development of innovations with high potential and 761 for those with medium potential The distribution patterns in the last category ie low capacity innovators are consistent Indeed the majority of innovators in this category participate in delivering innovations with low potential (598) The remaining 402 deliver innovations with medium potential while none of the Low Capacity innovators delivers innovations with high potential
26
Figure 12 of innovators by innovator and innovation categories
Calculations JRC
Data European Commission DG Connect
Note The figure shows breakdown of innovators by Innovator Capacity and Innovation Potential category Innovators are defined as key organization behind the innovation according to the answers to the question 12 of the Innovation Radar Questionnaire Total number of reviewed projects 603 Total number of innovations 1128 Review period 01102014 and 18012016
44 Type of organizations and their innovations
Figure 13 presents the distribution of key organizations in delivering innovations that were identified during the reviews by organization type 54 of innovators are Higher Education and Schools and Research Centres (HESREC) 23 are SMEs and 19 are large enterprises
Figure 13 of innovators by organization type
Calculations JRC
Data European Commission DG Connect
Note The figure presents the breakdown of innovators by organization type Innovators are defined as key organization behind the innovation according to the question 12 of the Innovation Radar Questionnaire Organization types HESREC (Higher Education and Schools and Research Centres) PUB (Public Bodies) SMEs (Small Medium Enterprise) LARGE (Large companies) OTH (Other organisations) Total number of reviewed projects 603 Total number of innovations 1128 Review period 01102014 and 18012016
27
Figure 14 presents the distribution of key organization type for each innovation potential category 44 of the key organisations behind innovations with high potential are SMEs This is more than three times the share of SMEs in total participation SMEs accounted in FP7 for 16 of total participations and 15 of total EC funding (EC-CONNECT 2013) Second in this comparison is the category including HESREC Altogether about 28 of all key organizations behind innovations with high potential are universities or research centres whereas 22 of them are large companies
In innovations with low and medium potential the situation is reversed HESREC is the largest group of organizations behind these innovations and SMEs are the second largest group In both categories large companies remain in third position For example HESRECs account for 37 and SMEs for 35 of all organizations participating in the development of innovations with medium potential
In general there is a positive link between an innovations potential and an SME being involved in its development Hence it can be assumed that SMEs are important vehicles for co-creating and commercialising innovative technologies developed within ICT FP7 projects
Figure 14 of innovators by organization type and innovation potential category
Calculations JRC
Data European Commission DG Connect
Note The figures presents the breakdown of innovators by organization type and innovation potential of their innovations Innovators are defined as key organization behind the innovation according to the answers to the question 12 of the Innovation Radar Questionnaire Organization types HESREC (Higher Education and Schools and Research Centres) PUB (Public Bodies) SMEs (Small Medium Enterprise) LARGE (Large companies) OTH (Other organisations) Total number of reviewed projects 603 Total number of innovations 1128 Review period 01102014 and 18012016
45 High Capacity Innovators
Table 3 presents the top 10 innovators from the IR sample with the highest ICI scores together with their names organization type place of origin and innovations in which they were identified as being key organizations The organization with the highest ICI score is Arduino SA directly followed by Native Instruments GMBH Both are private organizations the first is an SME while the second is a large enterprise Altogether the top 10 high capacity innovators participated in the development of 24 innovations Regarding the potential of the innovations of the top 10 innovators 13 (54) are innovations with high potential 10 (42) have medium potential and only 1 (4) has low potential In other words high capacity innovators are also associated with innovations with higher potential
28
The majority of the top 10 high capacity innovators (50) are SMEs The remaining 50 is equally distributed between large companies and higher education and schools and research centres
Table 3 Top 10 High capacity innovators and their innovations
Rank by ICI
Organistaion name Organisation
type Country Region Project innovation Nr
Innovation Potential
1 ARDUINO SA SME SWITZERLAND TICINO
SOCIALampSMART_A 1 High
SOCIALampSMART_B 2 High
PELARS_A 3 Medium
2 NATIVE INSTRUMENTS
GMBH PRC GERMANY BERLIN
GiantSteps_B 4 High
GiantSteps_A 5 Medium
3 PERVOICE SPA PRC ITALY
EU-BRIDGE_A 6 High
EU-BRIDGE_B 7 High
4 HELIATEK GMBH SME GERMANY DRESDEN KREISFREIE
STADT X10D_A 8
High
5 UNIVERSITAET BREMEN HES GERMANY BREMEN
KREISFREIE STADT
SAPHARI_A 9 High
COMPASS_A 10 High
6 SIEMENS
AKTIENGESELLSCHAFT PRC GERMANY
MUumlNCHEN KREISFREIE
STADT
MD PAEDIGREE_A 11 Medium
MD PAEDIGREE_C 12 Medium
MD PAEDIGREE_B 13 Medium
CONCERTO_B 14 Medium
MSP_A 15 Medium
STREETLIFE_C 16 Medium
7 ERLANG SOLUTIONS
LIMITED SME UNITED KINGDOM BERKSHIRE
RELEASE_A 17 High
PROWESS_A 18 High
8 THE CHANCELLOR MASTERS
AND SCHOLARS OF THE UNIVERSITY OF CAMBRIDGE
HES UNITED KINGDOM ESSEX CC
PARLANCE_B 19 High
ASC-Inclusion_A 20 High
APhome_A 21 Low
BrainScaleS_B 22 Medium
9 EPIGAN BVBA SME BELGIUM ARR LEUVEN HiPoSwitch_A 23 High
10 WORLDSENSING SLNE SME SPAIN BARCELONA RELYonIT_A 24 Medium
Calculations JRC
Data European Commission DG Connect
Note The table presents the list and characteristics of High Capacity Innovators as defined in section 24 and their innovations Innovators are defined as key organization behind the innovation according to the answers to the question 12 of the Innovation Radar Questionnaire Organization types HESREC (Higher Education and Schools and Research Centres) PUB (Public Bodies) SMEs (Small Medium Enterprise) PRC (Large companies) OTH (Other organisations) Total number of reviewed projects 603 Total number of innovations 1128 Review period 01102014 and 18012016
46 High Capacity SME Innovators
Table 4 presents the top 10 SME innovators with the highest ICI score together with their names place of origin and innovations in which they were identified as key organizations These organizations were identified as key organizations in the development of a total of 11 innovations
The SME with the highest ICI score is Arduino Arduino is an open-source electronics platform based on easy-to-use hardware and software2 Arduino was identified as a key organization in the SOCIALampSMART project whose goal was to build up a physical and computational networked infrastructure which allowed household appliances to better meet the needs of their owners Launched in 2005 Arduinos electronic prototyping platform became a major technological platforms which enabled users to create interactive electronic objects Between October 2014 and January 2016 the IR identified 3 innovations for which Arduino was identified as a key
2 httpswwwarduinocc
29
organization For example together with partners like Gorenje a leading European manufacturer of home appliances Arduino was involved in the development of a new WiFi controlling platform for home IoT As a result Gorenjersquos advanced fridge has been enhanced with a WiFi enabled solution which is expected to be put on the market within the next two years
30
Box 1 provides an overview of the development of Arduino and its global community which is becoming one of the major global technological platforms of software and hardware development
Regarding the potential of the innovations of the top 10 SME nnovators 4 were recognised as innovations with high potential The remaining six are innovations with medium potential
Table 4 Top 10 SMEs and their innovations
Rank by ICI Organisation name Country Region Project Innovation Innovation Potential
1 ARDUINO SA SWITZERLAND TICINO SOCIALampSMART_A High Innovation Potential
5 HELIATEK GMBH GERMANY DRESDEN KREISFREIE STADT X10D_A High Innovation Potential
8 ERLANG SOLUTIONS LIMITED
UNITED KINGDOM BERKSHIRE RELEASE_A
High Innovation Potential
10 EPIGAN BVBA BELGIUM ARR LEUVEN HiPoSwitch_A High Innovation Potential
11 DATALASE LTD UNITED KINGDOM UV-Marking_B
Medium Innovation Potential
12 WORLDSENSING SLNE SPAIN BARCELONA RELYonIT_A Medium Innovation Potential
14 2ND QUADRANT LIMITED
UNITED KINGDOM KENT CC AXLE_A
Medium Innovation Potential
17 ONTOTEXT AD BULGARIA SOFIA PHEME_B Medium Innovation Potential
21 STICHTING EUROPEANA THE NETHERLANDS
AGGLOMERATIE S-GRAVENHAGE
EAwareness_C Medium Innovation Potential EAwareness_B
24 SPARSITY SL SPAIN BARCELONA LDBC_C Medium Innovation Potential
Calculations JRC
Data European Commission DG Connect
Note The table presents the list and characteristics of SMEs High Capacity Innovators as defined in section 24 and their innovations Innovators are defined as key organization behind the innovation according to the answers the question 12 of the Innovation Radar Questionnaire Total number of reviewed projects 603 Total number of innovations 1128 Review period 01102014 and 18012016
31
Box 1 Arduino ndash Nr 1 innovator among 1000 organizations participating in the EC-
funded research projects
Arduino is an open-source electronics platform based on easy-to-use hardware and software Arduino boards are able to read inputs (eg light on a sensor a finger on a button or a Twitter message) and turn them into outputs (eg activating a motor turning on an LED publishing something online) Users can tell their boards what to do by sending a set of instructions to the microcontroller on the board To do so they use the Arduino programming language (based on Wiring) and the Arduino Software (IDE) based on Processing
Arduino was developed at the Ivrea Interaction Design Institute Italy as an easy tool for fast prototyping and was aimed at students without electronics and programming backgrounds Soon afterwards it was released under a Creative Commons licence As it gained populairity and acceptance among user-innovators the Arduino board started changing to adapt to new needs and challenges It differentiated its offer from simple 8-bit boards to products for IoT applications wearables 3D printing and embedded environments All Arduino boards are open-source which empower users to build them independently and eventually adapt them to their particular needs The software is also open-source and is growing through the contributions of users worldwide (Evans 2011)
The key element of the Arduino ecosystem is the community around it (Evans 2011) The community of makers has contributed to the Arduino ecosystem by developing code and libraries designing new hardware teaching workshops and classes and sharing what they have made Arduino is now being taught in high schools colleges and universities everywhere around the world It is assumed that the number of Arduino members increases by 100000 per month (SJTU 2015) A large share of the users and developers come from developing countries In China for example a large part of the community is made up of teachers They play a critical role in the development of the Arduino ecosystem They publish documents that can be used to teach Arduino technology in schools and educate new generations of Arduino community members
When we look at the Arduino case we see that the technological networks that work on these issues include growing numbers of organizations and individuals Moreover the concept of Arduino opens up possibilities that go clearly far beyond hobby activities and have real economic impacts Today there is already a range of open source hardware products including synthesizers MP3 players amplifiers high-end voice-over-IP phone routers mobile phones and laptops (Thompson 2008) The Arduino ecosystem allows the creation of infrastructure for large technological projects like smart homes or IoT
There are already a number of companies that have built their business models around the Arduino ecosystem For example most of the 13 largest open source hardware companies that in 2010 earned approximately $50 Mln in revenues operate within the Arduino community (Torrone amp Fried 2010) By 2010 all of them earned at least $1 Mln in revenues and most of them earned nearer $5 Mln and were involved in hundreds of projects
Like Linux for software Arduino is an example of how the process of innovation has evolved over the last few decades The development and production of advanced technological products is increasingly taking place within collaborative user communities rather than within a single integrated hierarchical organization
47 Location of innovators
Figure 15 provides a list of countries with the total number of innovators for each Germany has the most over 15 of all the key organizations involved in delivering the innovations are from Germany The UK has 1351 of the total number of innovators Italy has 1179 and Spain
32
(1174) Innovators located outside the EU are from Switzerland Norway Israel Turkey Australia South Africa Kenya Philippines Canada and the US
Figure 15 Locations of innovators by country
Calculations JRC
Data European Commission DG Connect
Note The figure includes locations of innovators by country of origin ie key organizations in delivering innovations identified in the answers to the question the question 12 of the Innovation Radar Questionnaire Average IPI score as defined in section 21 corresponds to the innovations to which innovators from relevant location contribute Total number of reviewed projects 603 Total number of innovations 1128 Review period 01102014 and 18012016
48 Innovator capacity and innovation potential
Figure 16 shows the relationship between the innovation potential indicator and innovator capacity indicator values The correlation coefficient of the two indicators is 045 Thus although overall it can be said that there is a positive relationship between the two indicators a high score in one indicator does not translate into high performance in the other In other words as demonstrated in Section 43 there are high capacity innovators that participate in delivering innovations with low or medium potential By the same token there are low capacity innovators that were identified as key organizations in developing innovations with high potential
The best illustration of the fact that there is no clear-cut relationship between innovator and innovation performance is that innovations with medium potential dominate in all categories of innovator capacity For example as shown in Figure 12 more than half of all the high capacity innovators (669) were identified as key organizations in delivering innovations with medium potential This number is even higher for medium capacity innovators (76 1)
The above observation leads to the conclusion that improving the overall performance of innovative output requires a focus on both the innovations and the organizations behind them In
33
the case of innovations the focus is on increasing their market potential or improving their management In turn expanding innovators capacity requires efforts by individual organizations to increase their performance However this also depends on their environment which can positively or negatively affect their innovative outputs
Figure 16 Relationship between the innovation potential indicator and innovator
capacity indicator values
20
40
60
80
10
0
Inno
vato
r C
apa
city Ind
ica
tor
20 40 60 80 100Innovation Potential Indicator
Calculations JRC
Data European Commission DG Connect
Note The figure presents the relationship between innovation IPI score as defined in section 21 and the ICI score of the key organization behind the innovation Total number of reviewed projects 603 Total number of innovations 1128 Review period 01102014 and 18012016
34
5 Universities as Co-innovators in EC-funded Research Projects
This section tackles questions related to the involvement of different types of organizations in innovation activities the results of these collaborations and the role of universities as co-inventors in EC-funded research projects by
Looking at the relationship between innovation potential and various types of organizations identified as key innovators (Section 52)
Reporting on the type of innovations developed by different combinations of organizations (Section 53)
Analysing whether the type of organizations has implications for the innovation development stage and their exploitation plans (section 54)
This is complemented by an analysis of whether different types of organizations exhibit different needs with respect to innovation commercialisation (Section 73)
51 In a nutshell
The main findings of the analysis of universities as co-innovators are that
Of the innovations with high potential universities and research centres deliver about 28 whereas SMEs deliver about 44 However universities are identified as key co-innovators in over 70 of all the innovations with high potential
Collaboration between universities and SMEs delivers the largest share of innovations with high potential (approx 31) followed by collaboration between private organisations
Collaboration between universities and SMEs seems to be more fruitful than between universities and large firms
New products are considerably more often co-developed in the course of collaboration involving universities Although private-private partnerships are also an important source of new products they show equal interest in developing new processes and organizational methods This may suggest that universities are the source of new products that are then channelled through private organizations to the market
Innovations co-developed with universities have equal chances of commercial exploitation as those introduced by private-private collaborations
52 Collaboration with universities and innovation performance
This section looks at the relationship between innovation potential and the type of organizations involved in its development In particular it looks at the question of whether there is a difference in the potential of innovations that were (co-) developed by universities and private organizations ie SMEs and large enterprises
Figure 13 and Figure 14 present the distribution of the different organisation types by innovation potential Higher education and schools and research centres (HESREC) make up the lions share of the organisations sample (54) However they only deliver about 28 of innovations with high potential - less than SMEs which deliver about 44
When focussing on cooperation SMEs are still the pull for the development of innovations with high potential Figure 17 shows the distribution of pairwise cooperation by innovation potential for all the innovations reviewed Collaboration between higher education and schools and research centres and SMEs (Uni_Sme) delivers the highest share of innovations with high potential (around 31) This is followed by collaboration between HESREC and large organisations (Uni_Large) with 248 The innovation resulting from these two types of collaboration and the collaboration
35
between private organisations (Firm_Firm3) are increasing in innovation potential On the other hand when higher education and schools and research centres collaborate among themselves (Uni_Uni) the innovation potential of the innovative outcome decreasesl as shown by the 154 innovations with high potential and the 445 innovations with low potential However it has to be taken into account that the Innovation Radar targets innovations that have the potential to be brought to the market in the near future As discussed above consistent with their status and mission the main reason universities participate in EU-funded research projects is to develop research and technology Therefore the critical issue is collaboration between private organizations aiming at commercialisation of the research results
Figure 17 of innovators by collaboration type and innovation potential category
Calculations JRC
Data European Commission DG Connect
Note Innovators are defined as key organization behind the innovation according to the answers to the question 12 of the Innovation Radar Questionnaire Collaboration types Uni_Uni (Higher Education and Schools and Research Centres) Uni_Sme (Higher Education and Schools and Research Centres and SMEs) Uni_Large (Higher Education and Schools and Research Centres and Large companies) Large_Sme (Large companies and SMEs) Firm_Firm (private organisations of the same entity ie Large_Large or Sme_Sme) Total number of reviewed projects 603 Total number of innovations 1128 Review period 01102014 and 18012016
Taking into account the above and in order to see what type of collaboration increases the innovation potential and commercialization of innovations developed in EU-funded research project an additional analysis was performed Figure 18 presents the coefficient estimated by a linear regression model which investigates the impact of different types of collaboration and project characteristics ie the time of the review (when the project was evaluated) and the EC contribution to the project on innovation potential The reference baseline of the regression model is collaboration between HESREC (Uni_Uni) and first project review Regarding the collaboration type the collaboration between private organizations (Sme_Smes Large_Large and Large_Sme) had the strongest effect on innovation potential On average the potential score of innovation co-developed by at least two private firms is about 10 points higher than it is when an innovation is co-developed by universities Collaboration between SMEs has the highest coefficient Again this does not come as a surprise as firms have stronger incentives and capacities to bring technology to the market Therefore what is considerably more interesting is the effect of collaboration between universities and different types of private firms There one can observe that innovations
3 The category Firm_Firm is built taking into account all the collaborations between private organisations
of the same entity That is either Large_Large or Sme_Sme
36
co-developed by universities and SMEs have on average higher innovation potential scores than those co-developed by universities and large firms Whereas innovations co-developed between universities and SMEs have a 48 point higher score as compared to the reference point those that are co-developed by universities and large firms have a score of only 43 This observation is consistent with previous findings that indicate that SMEs benefit more than large firms from collaboration with universities in publicly-funded research projects (Okamuro 2007)
As expected a review later in the life of the project finds that the average value of the innovations developed has increased This confirms previous observations which suggest that ideas and technologies developed during EU-funded research projects mature and increase their potential as projects advance On the other hand the amount of EC funding allocated to the project does not seem to affect the potential of the innovation
Figure 18 Linear estimates of innovation potential indicators and innovation
partnerships
Calculations JRC
Data European Commission DG Connect
Note OLS robust standard errors number of observation 1426 R-squared 014 Total number of reviewed projects 603 Total number of innovations 1128 Review period 01102014 and 18012016
To conclude the importance of SMEs in delivering innovations with high potential is observed also when looking at the different type of collaboration between projects Interestingly enough when private organisations pair together they increase their probability of delivering innovations with high potential while the same is not true for HESREC This may suggest the need for support for HESREC to increase the market potential of the innovations developed
53 Innovation type and collaboration type
The Innovation Radar characterises the types of innovation by distinguishing between new or significantly improved product process service marketing and organisational method Based on this information Figure 19 presents the relationship between the mix of organizations involved in innovation (co-) development and the type of innovation
37
Over 50 of the innovations are product innovations followed by service and process At the same time very few innovations belong to organisational and marketing method that accounts for only 3 of the total innovation output4 As shown by the figure the distribution of the innovation type is relatively stable across the different organisation composition However new products are considerably more often co-developed in the course of collaboration involving universities For example 63 of innovations developed by university and SMEs are new product In contrast only 51 of innovations delivered as a result of collaboration between SMEs and large firms are new products The remaining half represents innovations that can be described as new processes services or organizational methods This can suggest that universities are a source of novel technologies that are channelled through private organizations to the market
Figure 19 of innovators by collaboration and innovation type
Calculations JRC
Data European Commission DG Connect
Note Innovators are defined as key organization behind the innovation according to the answers to the question 12 of the Innovation Radar Questionnaire Collaboration types Uni_Uni (Higher Education and Schools and Research Centres) Uni_Sme (Higher Education and Schools and Research Centres and SMEs) Uni_Large (Higher Education and Schools and Research Centres and Large companies) Large_Sme (Large companies and SMEs) Firm_Firm (private organisations of the same entity ie Large_Large or Sme_Sme) Total number of reviewed projects 603 Total number of innovations 1128 Review period 01102014 and 18012016
54 Innovation stage and exploitation plans
This section deals with the question of whether there is a pattern in the innovation development stage and exploitation plans depending on the type of organizations involved in its (co-) development The idea is that organisations of different types may apply for EC projects at different stages of their innovation development Indeed one could expect that private organisations may apply for public funding after having already initiated the development of the innovation while universities are more likely to start innovation development after having been granted public funding
Figure 20 shows the percentage of innovators by cooperation type and innovation development Figure 20 shows there is no clear pattern Even when focussing on collaboration between organisations of same type the relative differences between innovation stages are negligible and do not bring additional information on the exploitation plans deployed by the distinct organisations
4 For simplicity of presentation possible innovation output was grouped into four categories combining
organisational and marketing method
38
In order to ensure the results were not influenced by when the review took place we also analysed jointly the different types of collaboration at the different stages of the review process The results didnt show any major differences across organisation type apart from a general trend for all organisations towards a higher percentage of innovations Already developed but not yet being exploited and innovations Being exploited in the final period of the project
Figure 20 of innovators by collaboration type and innovation development
Calculations JRC
Data European Commission DG Connect
Note Innovators are defined as key organization behind the innovation according to the answers to the question 12 of the Innovation Radar Questionnaire Collaboration types Uni_Uni (Higher Education and Schools and Research Centres) Uni_Sme (Higher Education and Schools and Research Centres and SMEs) Uni_Large (Higher Education and Schools and Research Centres and Large companies) Large_Sme (Large companies and SMEs) Firm_Firm (private organisations of the same entity ie Large_Large or Sme_Sme) Total number of reviewed projects 603 Total number of innovations 1128 Review period 01102014 and 18012016
39
6 The role of end user engagement for innovation potential
In the past decades the innovation model has shifted from a linear model where end-users intervene only at the very end of the process to a more collaborative model where end-users actively contribute to the innovation process The increasing importance of the role of end-users in innovation processes has been highlighted in the work of Chesbrough (2003) and von Hippel (2005) who both recognize end-users as important sources of valuable ideas for firms The Innovation Radar recognises the importance of end-users being close to the innovation process and reports on the engagement of end-users in the project consortium Below we show how the engagement of end-users affects the innovation potential of the projects
61 In a nutshell
The analysis of end user engagement in the project consortium produced the following main findings
There is a positive relation between the engagement of end-users and innovation potential High Innovation potential projects report the highest share of end-users engagement The share of end-users engagement inside the consortium is 64 and 33 for end-users outside the consortium
End-users engagementndash both internal and external to the consortium- positively affects the level of commitment of relevant partner in exploiting the innovation Projects with high shares of end-users engagement (32 when end-users are inside the consortium and 16 when outside the consortium) show a High level of partners commitment
40
Figure 21 shows the distribution of end-users across projects by innovation potential End-users could either belong to the consortium or be external to the project High innovation potential projects report the overall highest share of end-user engagement 64 (part of the consortium) and 33 (outside the consortium) Interestingly the low innovation potential projects account for the lowest rate of end-user engagement Indeed the percentage of low innovation potential projects that declare no end-user engagement is above 30 We do not have the necessary information for assessing whether a causal relation between end-user engagement and innovation potential exists However the data confirms a positive relation between the engagement of end-users and innovation potential
41
Figure 21 End user engagement by innovation potential
Calculations JRC
Data European Commission DG Connect
Note The computations were based on the responses to general question 1 of the Innovation Radar Questionnaire Total number of reviewed projects 603 Total number of innovations 1128 Review period 01102014 and 18012016
End-user engagement may also affect the overall innovation performance of the project and the level of commitment of relevant partners in exploiting the innovation Figure 22 presents data on the project partners commitment and innovation performance The data suggest that end-user engagement ndash both internal and external to the consortium - increases the level of commitment of relevant partners in exploiting the innovation On the other hand the results in terms of innovation performance do not show that end-user engagement directly improves the project
Figure 22 End user engagement by partners commitment and innovation performance
Calculations JRC
42
Data European Commission DG Connect
Note The computations were based on the responses to general question 1 6 and 8 of the Innovation Radar Questionnaire Total number of reviewed projects 603 Total number of innovations 1128 Review period 01102014 and 18012016
43
7 Steps and barriers to innovation commercialisation
This section deals with three issues concerning innovation commercialisation First it presents the responses to the questions on the steps that organizations undertook or plan to undertake in order to bring the innovations to (or closer to) the market Second it provides an overview of what innovators need to fulfil the market potential of their innovations and finally it shows what the most common bottlenecks to innovation commercialization are
71 In a nutshell
The main findings of the analysis of steps and barriers to innovation commercialisation include
When taking innovations to the market projects focus more on technology-related steps than business-related ones 664 of the projects that plan to commercialise their innovations undertake or plan to undertake demonstration or testing activities In contrast only 40 of projects have carried out or plan to carry out a market study A business plan is on the agenda of only 36 of projects that plan innovation commercialisation
Activities that involve participations or interactions with actors outside of the projects are relatively uncommon Only 45 to 9 of the projects have sought or are planning to seek private or public funding
Three of the most common needs are partnership with another company (195) business plan development (167) and expanding to more markets (149)
The least frequently named needs include incubation (64) participation in a start-up accelerator (59) and investor readiness training (56)
307 of project partners see financing as the major external bottleneck to innovation exploitation
Only 25 of the project partners consider trade issues between Member States and the rest of the world as a barrier to exploiting their innovative products or services
72 Steps to innovation commercialisation
Figure 23 indicates what steps have already been taken or are planned by projects to bring their innovations to (or closer to) the market This figure distinguishes between technology-related steps (eg feasibility study or prototyping) and business-related steps (eg business plan or capital investment)
Concerning technology-related steps prototyping and demonstration or testing activities are the most common measures that projects undertake in order to bring their innovations to the market Of the projects that are plannng to introduce their innovations to the market 664 is either undertaking or planning demonstration or testing activities or creating or planning to develop a prototype (654) Developing a pilot (552) is also quite common Among the most desirable steps that have not been taken or planned are feasibility studies engagement by industrial research team of one of their companys business units in project activities and technology transfer Around 12 of projects that are planning to introduce their innovations to the market perceive that these activities will facilitate innovation commercialisation
With respect to business-related steps Figure 23 shows that carrying out a market study and writing a business plan are among the most common steps that help to commercialise innovations Around 40 and 36 of projects have carried out or plan to carry out a market study and write a business plan At the same time around 16 of the projects see these steps as desirable and between 16 and 18 have not planned them in the course of innovation commercialisation A significantly smaller number of projects consider undertaking steps like launching a start-up or a spinoff or seeking funding For example between 5 and 9 of the projects have sought or are planning to seek private or public funding and between 25 and 28 of the projects consider this
44
step as desirable At the same time between 40 and 33 of the projects do not plan to seek capital or public investment
The evidence presented above leads to the following conclusions First the technology-related steps to bring innovations to the market are seen as more important than business-related ones Organizations very often focus on making sure that the innovation they develop is ready to be commercialised from the technological point of view To this end projects create a prototype or perform demonstrations or testing activities Relatively often organizations do not undertake or plan business-related steps Second in both cases ie technology- and business-related activities the emphasis is on what can be done within the project and among the participants Activities that involve interactions with actors outside of the projects or participation by them are less common particularly as regards seeking external funding Only a few projects see these activities as relevant to the commercialisation of innovations and many of them do not plan to undertake them This calls for two kinds of support First projects should be encouraged to look beyond the technological aspects and introduce business-related elements to their activities Second they should be encouraged to increase interaction with external specialised actors eg business coaches or venture capitalists as this could help them to improve the commercialisation chances of their innovations
Figure 23 Progress of projects in bringing innovations to the market
Calculations JRC
Data European Commission DG Connect
Note The computations were based on the responses to question 10 of the Innovation Radar Questionnaire Total number of reviewed projects 603 Total number of innovations 1128 Review period 01102014 and 18012016
73 Innovators need to realise the market potential of innovations
Figure 24 presents the responses to the question what do innovators need to realise the market potential of their innovations The most common needs are seen as partnerships with other companies business plan development and expanding to more markets The least frequently named needs include investor readiness training participation in a start-up accelerator and incubation
45
Figure 24 Innovators needs to fulfil the market potential of their innovations
Calculations JRC
Data European Commission DG Connect
Note The computations were based on the responses to question 13 of the Innovation Radar Questionnaire Total number of reviewed projects 603 Total number of innovations 1128 Review period 01102014 and 18012016
74 Type of organization and need to realise the market potential of innovations
Below we analyse whether the fact that an innovator is a university or private organizations has any implications for the further support needed to bring its innovation to the market
Figure 25 presents innovators needs to fulfil the market potential by organisation type As already shown in Figure 24 the most common need reported is partnership with another company (195) The breakdown by organisation type shows that the most common need reported by higher education and schools and research organisations (HSEREC) is partnership with another company (118 of the total needs or 605 of the specific needs) followed by business plan development (9 or 54) and legal advice (73 or 62) For private organisations the most common needs reported are expanding to more markets and developing a business plan (between 5 and 3 respectively) Moreover in general HESREC seem to report more needs than private organisations
In order to better analyse the differences between organisations in reporting potential market needs we ran a multinomial logistic regression and reported the resulting marginal effects in Figure 26 The figure shows that we can identify clearly different patterns for HESREC and private organisations The figure also shows the probability of reporting a specific need all other things remaining constant for specific organisations
For HESREC the probability of reporting needs such as start-up accelerator incubation partnership mentoring and legal advice are all positive and range from 10 to 20 On the other hand being an HESREC reduces the probability of reporting needs such as expanding to more markets or developing a business plan The situation is completely the reserve for private organisations where both large enterprises and SMEs are more likely to report the latter as their most common needs Private organisations diverge only with respect to investor introductions which are more relevant for SMEs and HESREC than they are for large enterprises
The results of the analysis suggest that HESREC tend to report more needs related to the finalisation of the innovation and the subsequent steps to bring it to the market while private organisations needs are more related to the commercialization of the innovation and the need to create or expand their markets
46
Figure 25 Innovators need to fulfil the market potential by organisation type
Calculations JRC
Data European Commission DG Connect
Note The computations were based on the responses to question 13 of the Innovation Radar Questionnaire Total number of reviewed projects 603 Total number of innovations 1128 Review period 01102014 and 18012016
Figure 26 Marginal effects of potential market needs by organisation type
Calculations JRC
Data European Commission DG Connect
Note Marginal effects multinomial logistic regression number of observation2095 Total number of reviewed projects 603 Total number of innovations 1128 Review period 01102014 and 18012016
47
75 Bottlenecks to innovation commercialization
Figure 27 presents responses to the question of what are the external bottlenecks that compromise the ability of project partners to exploit new products solutions or services internally or in the market place For the majority of project partners (307) lack of financing is seen as the major external bottleneck to innovation exploitation Regulation and standards account for 156 and 143 respectively together with the generic group others IPR and workforce skills are considered as relatively important Around 10 of the projects perceive at least one of the two issues as an external factor that could threaten the ability of project partners to commercially exploit innovations Among the bottlenecks seen as least harmful are trade issues between Member States and the rest of the world Only 25 of the project partners consider these as barriers to exploiting their innovative products or services
Comparing the steps that organizations undertook or plan to undertake in order to bring their innovations to (or closer to) the market (see Figure 23) and the information presented in Figure 27 leads us to observe an apparent contradiction between what project organisations claim to be a barrier and their actual behaviour While 307 of project partners see lack of financing as a barrier to exploiting their innovative products or services only 5 to 9 of the projects have sought or are planning to seek private or public funding Moreover between 33 and 40 of the projects do not plan to seek capital or public investment This point is further emphasised by the fact that organizations most commonly declare that they need partnerships with other companies and to expand to more markets in order to realise the market potential of their innovations
Figure 27 External bottlenecks that compromise the ability of project partners to
exploit innovations
Calculations JRC
Data European Commission DG Connect
Note The computations were based on the responses to general question 4 of the Innovation Radar Questionnaire Total number of reviewed projects 603 Total number of innovations 1128 Review period 01102014 and 18012016
48
8 Conclusions
This section summarises the key messages from the analysis of the IR data These focus specifically on the role of collaboration between universities and private organisations
Nurturing business culture among innovators
The current analysis shows that the key organizations behind ICT FP7Horizon2020-related innovations tend to have high levels of technological involvement but pay less attention to the business-related dimensions of their innovations It seems that there is a strong need for projects to look beyond the technological aspects and introduce business-related elements into their activities This can be achieved by providing incentives for increasing interactions between projects and external specialised actors eg business coaches or venture capitalists who could help to improve the commercialisation chances of innovations
Another interesting aspect emerging from the IR data is the high participation and active role of SMEs in delivering innovations with high potential SMEs are an important vehicle for co-creating and commercialising innovative technologies developed within ICT FP7Horizon2020 projects
Industry-university collaboration
Collaboration between universities and industry plays a crucial role in driving innovation processes Universities possess essential skills for innovation supplied to business They are the basis of the knowledge-based economy The close collaboration between university and industry poses a series of policy questions on how to foster this collaboration and what kind of policy support should be implemented
The IR data showed that universities are key co-innovators in over 70 of all innovations with high potential Collaboration between universities and SMEs delivers the largest share of innovations with high potential and seems to be more fruitful than the collaboration between universities and large firms This may suggest that universities are a source of innovative products that are channelled through private organizations to the market and that SMEs form a better bridge to universities in this process Finally innovations co-developed with universities are as likely to be commercially exploited as those introduced by private-private collaborations
49
References
Caloghirou Y Tsakanikas A amp Vonortas N (2001) University-Industry Cooperation in the Context of the European Framework Programmes [journal article] The Journal of Technology Transfer 26(1) 153-161 doi 101023a1013025615518
Chesbrough H (2003) Open Innovation The New Imperative for creating and Profiting from Technology Boston Harvard Business School Press
De Prato G Nepelski D amp Piroli G (2015) Innovation Radar Identifying Innovations and Innovators with High Potential in ICT FP7 CIP amp H2020 Projects JRC Scientific and Policy Reports Seville JRC-IPTS
EC-CONNECT (2013) Overview of Research Projects in the ICT Domain 2012 ICT statistical report for annual monitoring (StReAM) European Commission httpseceuropaeudigital-agendasitesdigital-agendafilesStream_2012pdf
Evans B (2011) Beginning Arduino Programming Springer
Hernan R Marin P amp Siotis G (2003) An Empirical Evaluation of the Determinants of Research Joint Venture Formation The Journal of Industrial Economics 51(1) 75-89
OECD (2015) OECD Science Technology and Industry Scoreboard 2015 Paris OECD
Okamuro H (2007) Determinants of successful RampampD cooperation in Japanese small businesses The impact of organizational and contractual characteristics Research Policy 36(10) 1529-1544 doi httpdxdoiorg101016jrespol200612008
Polt W Vonortas N amp Fisher R (2008) The impact of publicly funded research on innovation An analysis of European Framework Programmes for Research and Development European Commission Directorate-General for Internal Market Industry Entrepreneurship and SMEs
Roumlller L-H Siebert R amp Tombak M (2007) Why Firms Form (or do not Form) RJVS The Economic Journal 117(522) 1122-1144 doi 101111j1468-0297200702069x
Siebert R (1996) The Impact of Research Joint Ventures on Firm Performance An Empirical Assessment (Vol CIG Working Papers FS IV 96-03) Wissenschaftszentrum Berlin (WZB)
SJTU (2015) Federico Musto of Arduino Our real boss is the community SJTU PARISTECH REVIEW(2015-11-11)
Thompson C (2008 20102008) Build It Share It Profit Can Open Source Hardware Work Wired Retrieved from httpswwwwiredcom200810ff-openmanufacturing
Torrone P amp Fried L (2010) Million dollar baby ndash Businesses designing and selling open source hardware making millions Paper presented at the Foo Camp East 2010 httpmakezinecom20100506million-dollar-baby-businesses-de
von Hippel E (2005) Democratizing Innovation MIT Press
HOW TO OBTAIN EU PUBLICATIONS Free publications bull one copy
via EU Bookshop (httpbookshopeuropaeu)
bull more than one copy or postersmaps
from the European Unionrsquos representations (httpeceuropaeurepresent_enhtm)
from the delegations in non-EU countries (httpeeaseuropaeudelegationsindex_enhtm)
by contacting the Europe Direct service (httpeuropaeueuropedirectindex_enhtm) or
calling 00 800 6 7 8 9 10 11 (freephone number from anywhere in the EU) ()
() The information given is free as are most calls (though some operators phone boxes or hotels may charge
you)
Priced publications bull via EU Bookshop (httpbookshopeuropaeu)
doi102791244949 ISBN 978-92-79-64630-0
LF
-NA
-28
35
5-E
N-N
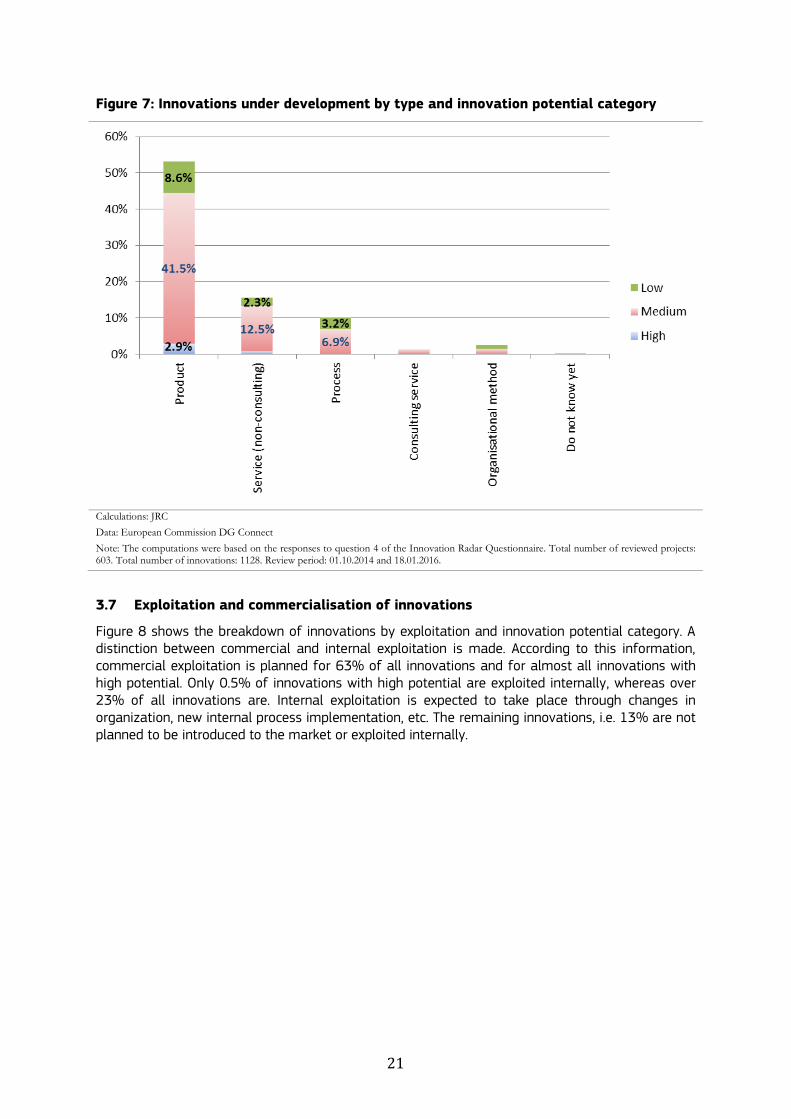
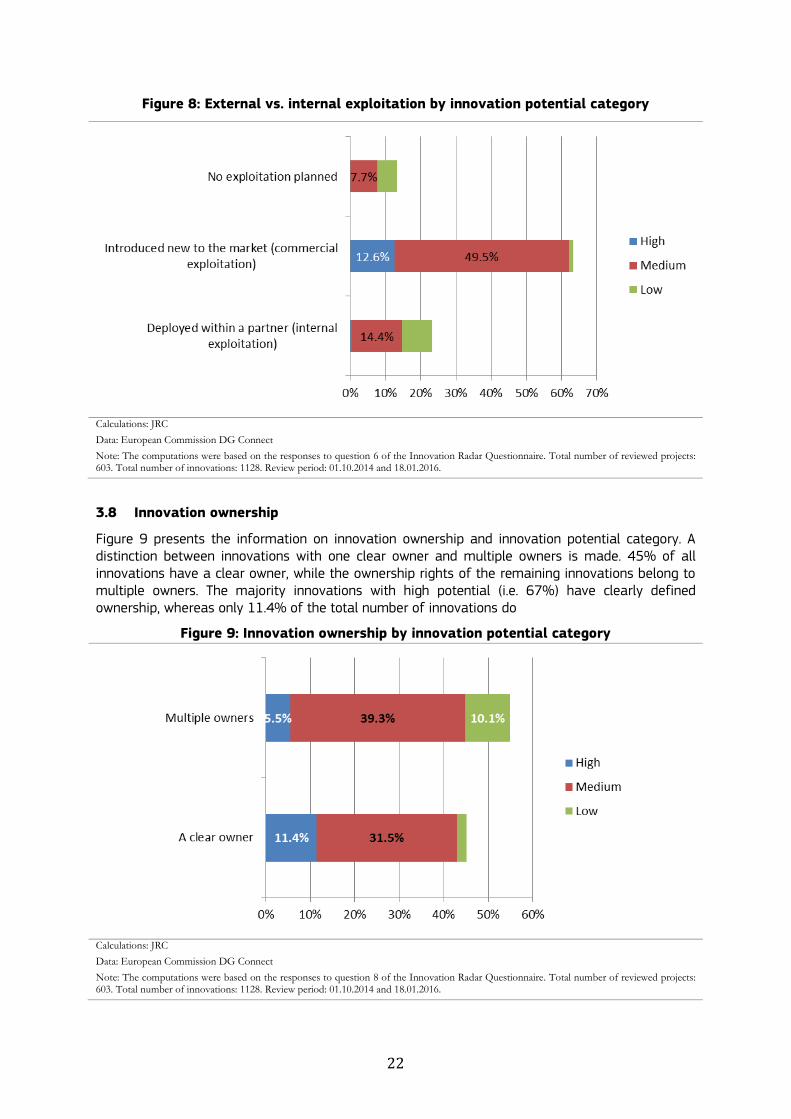
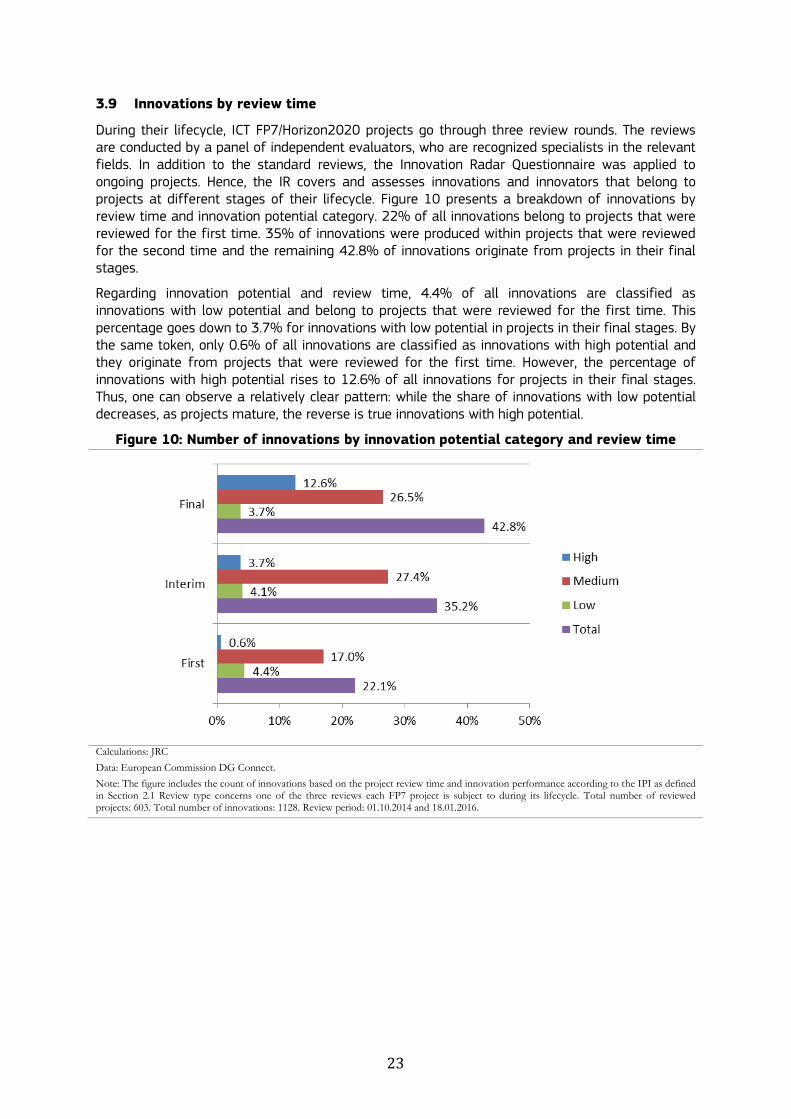
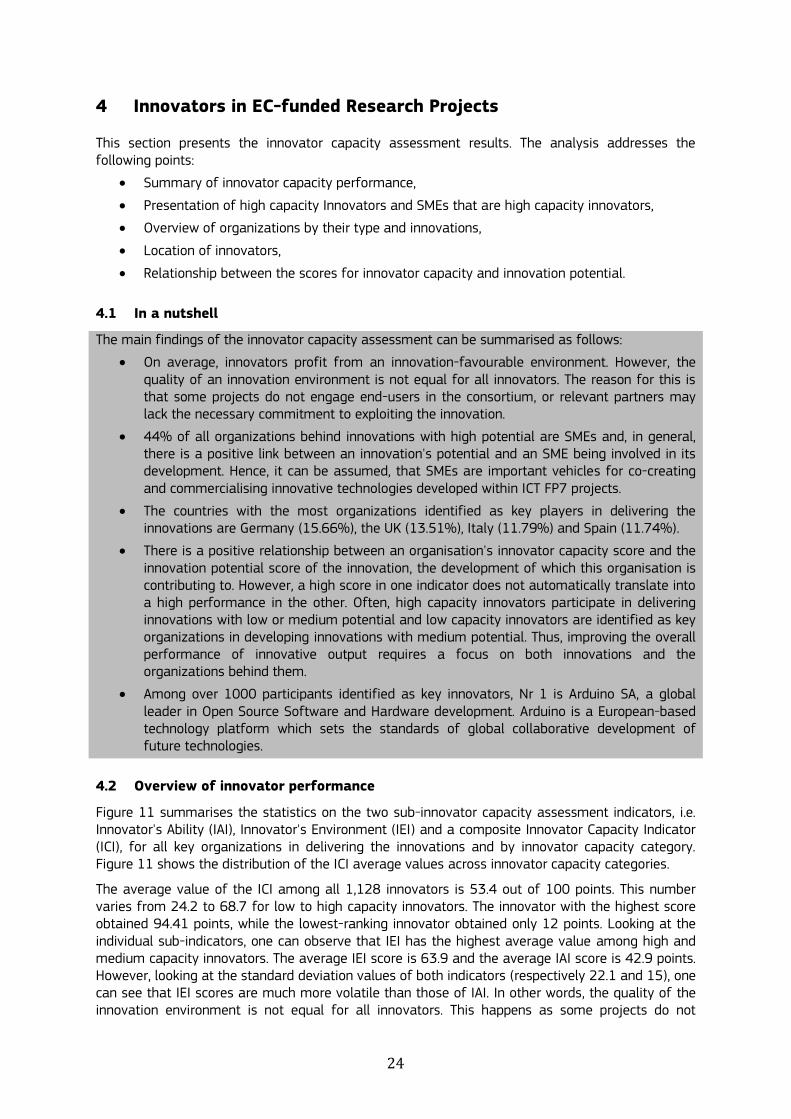
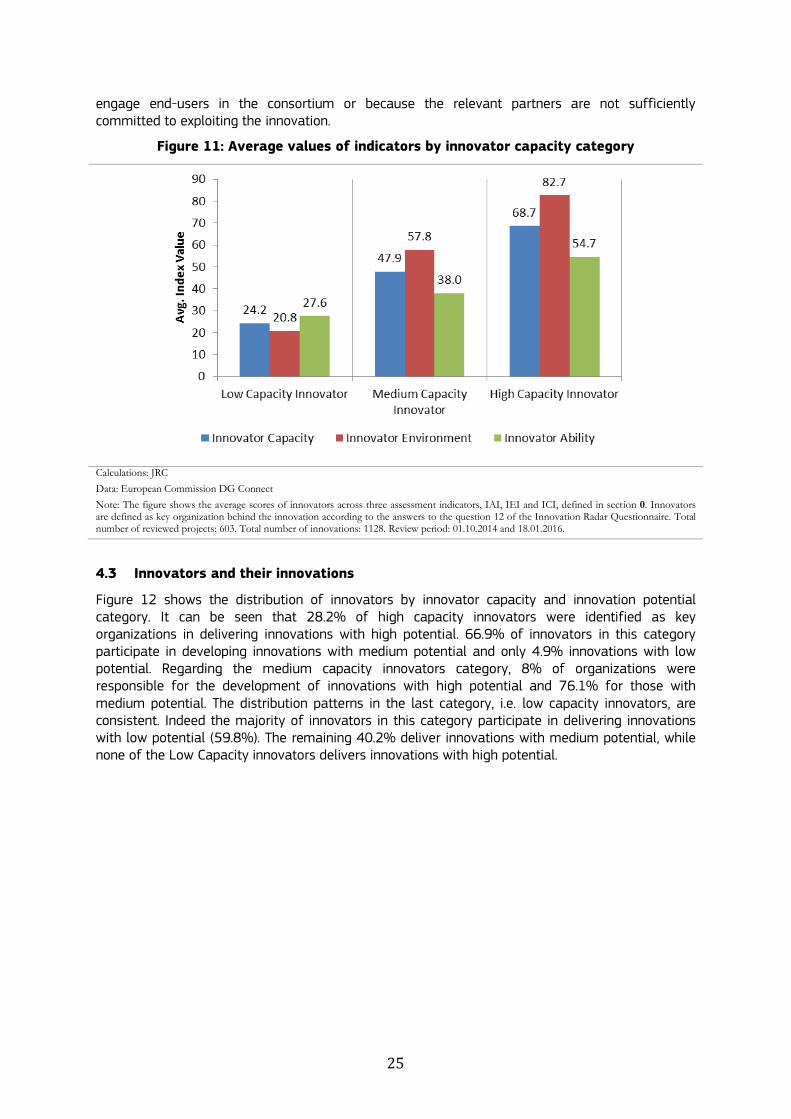
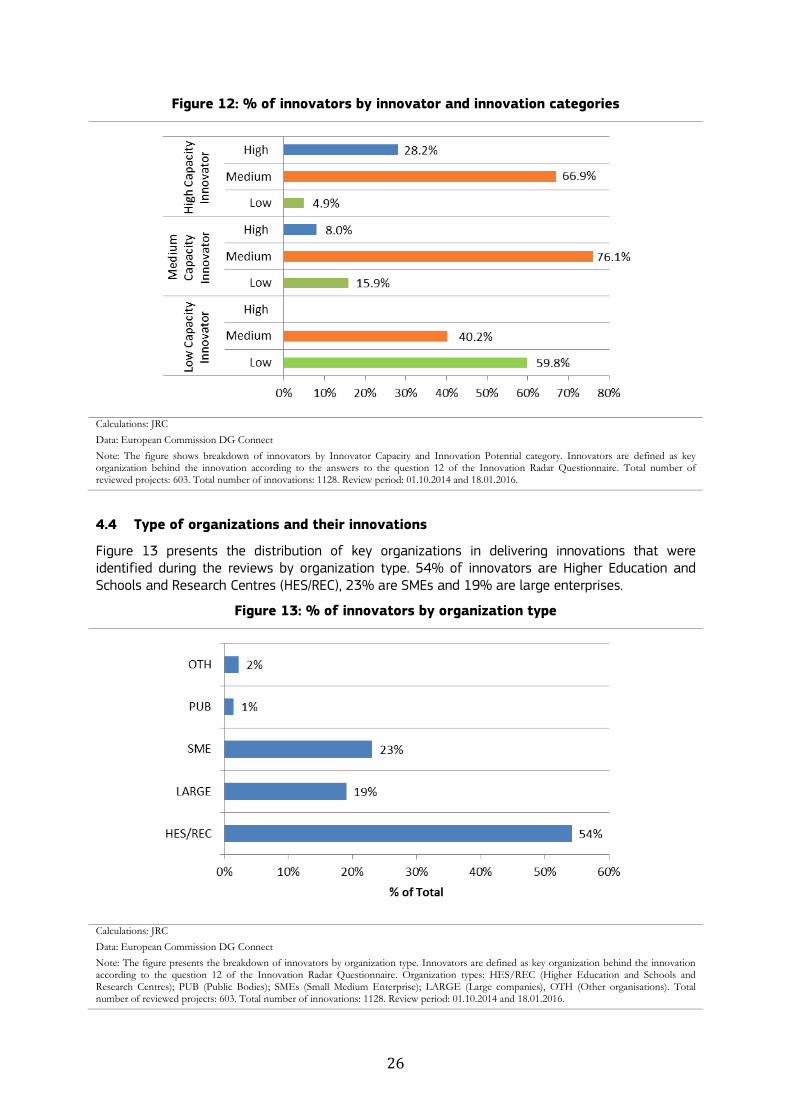
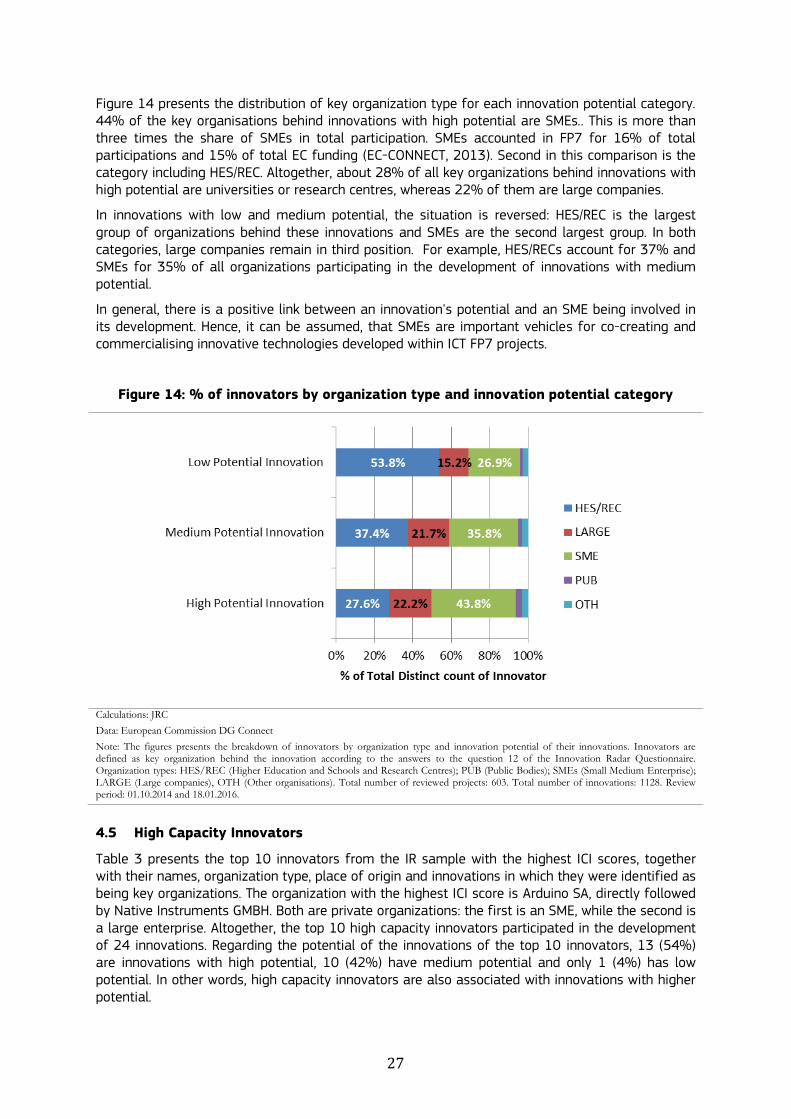
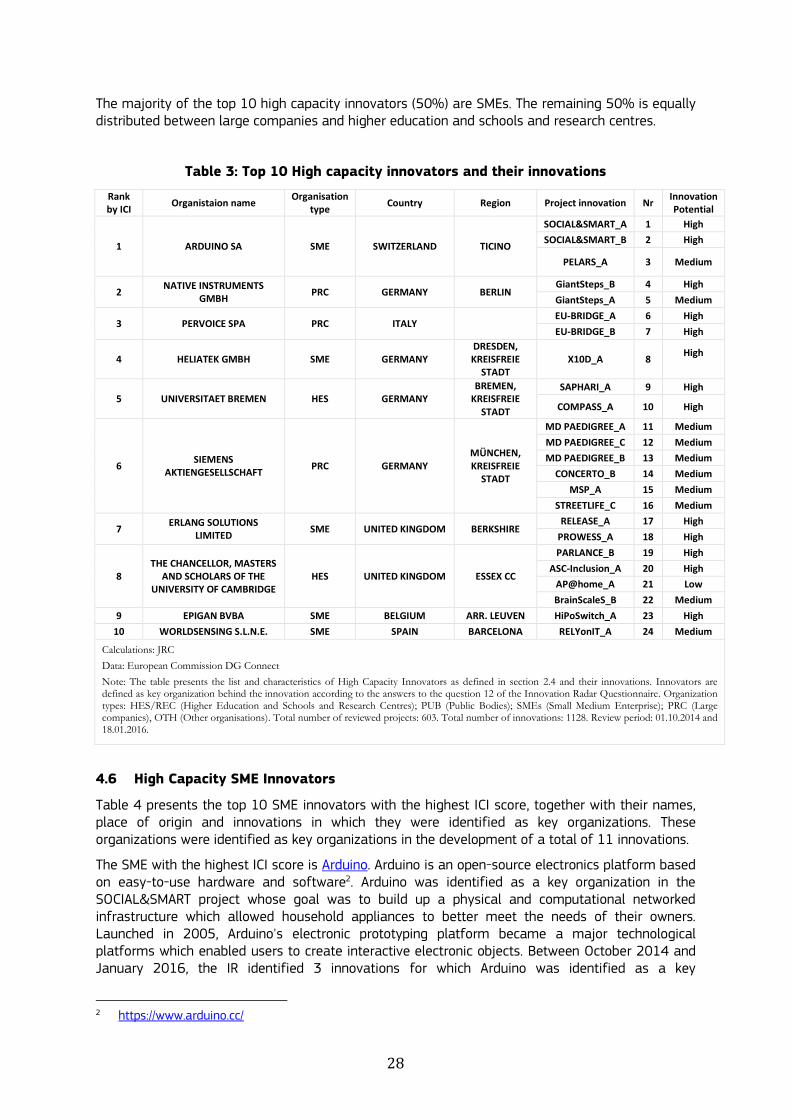
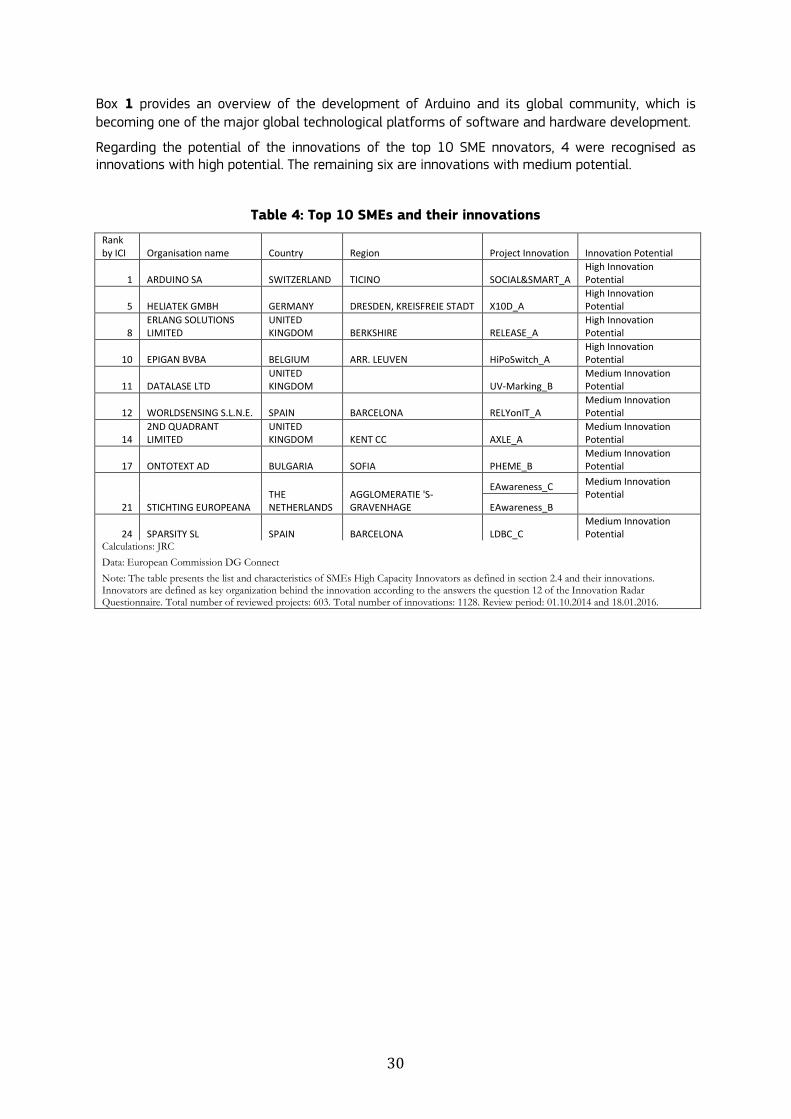
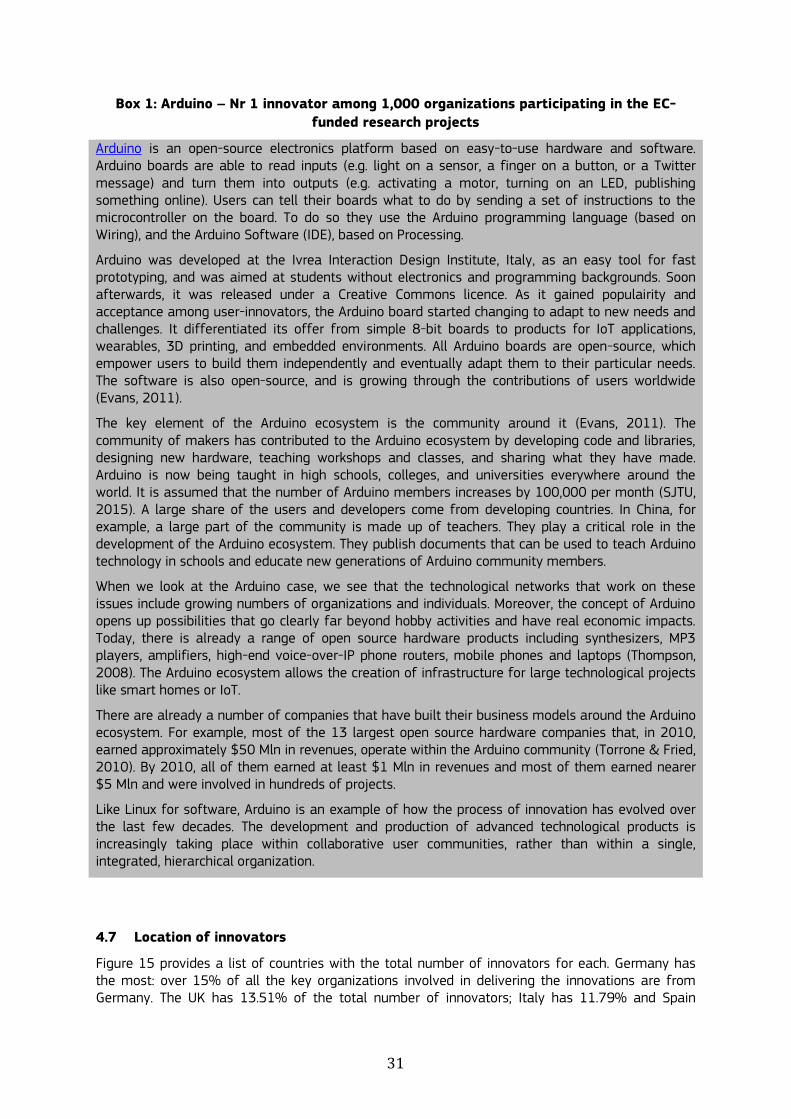
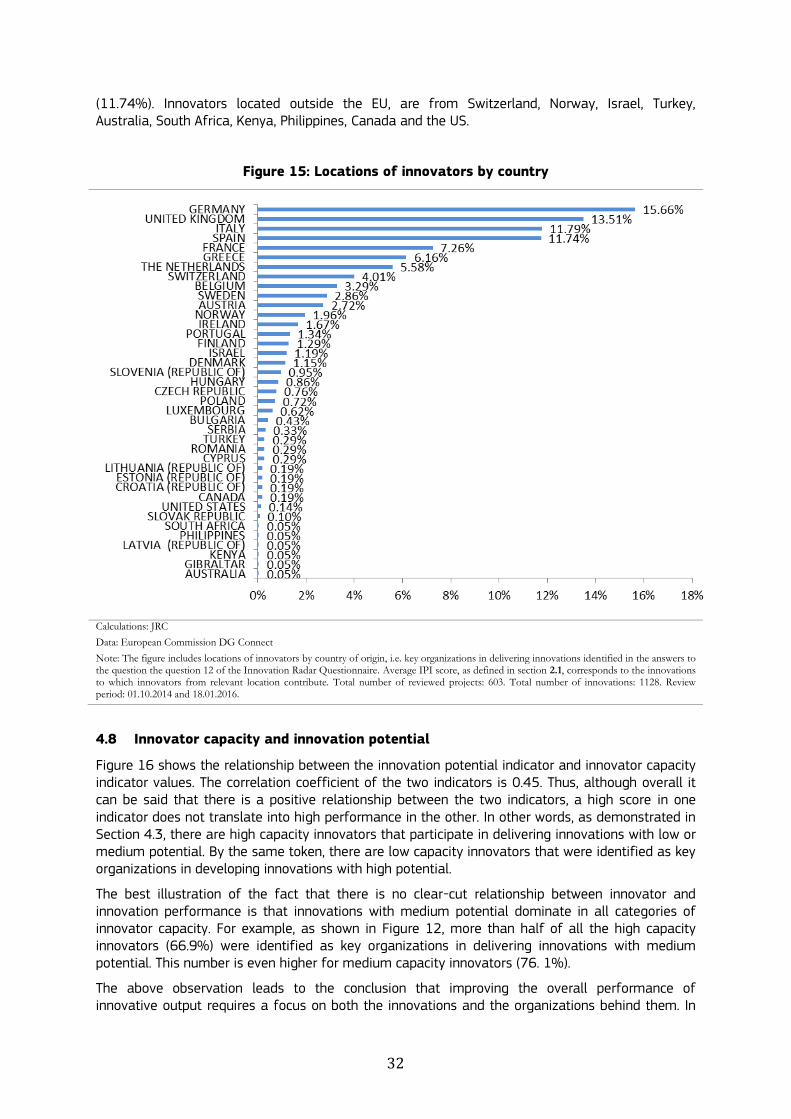
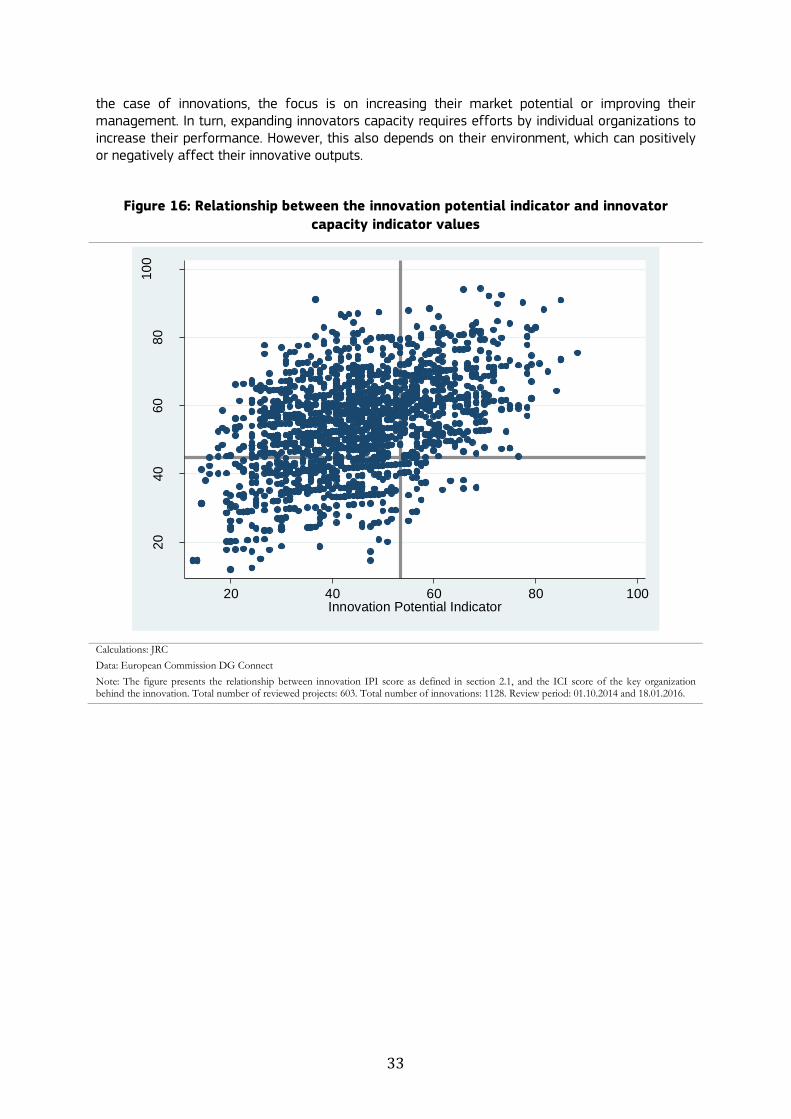
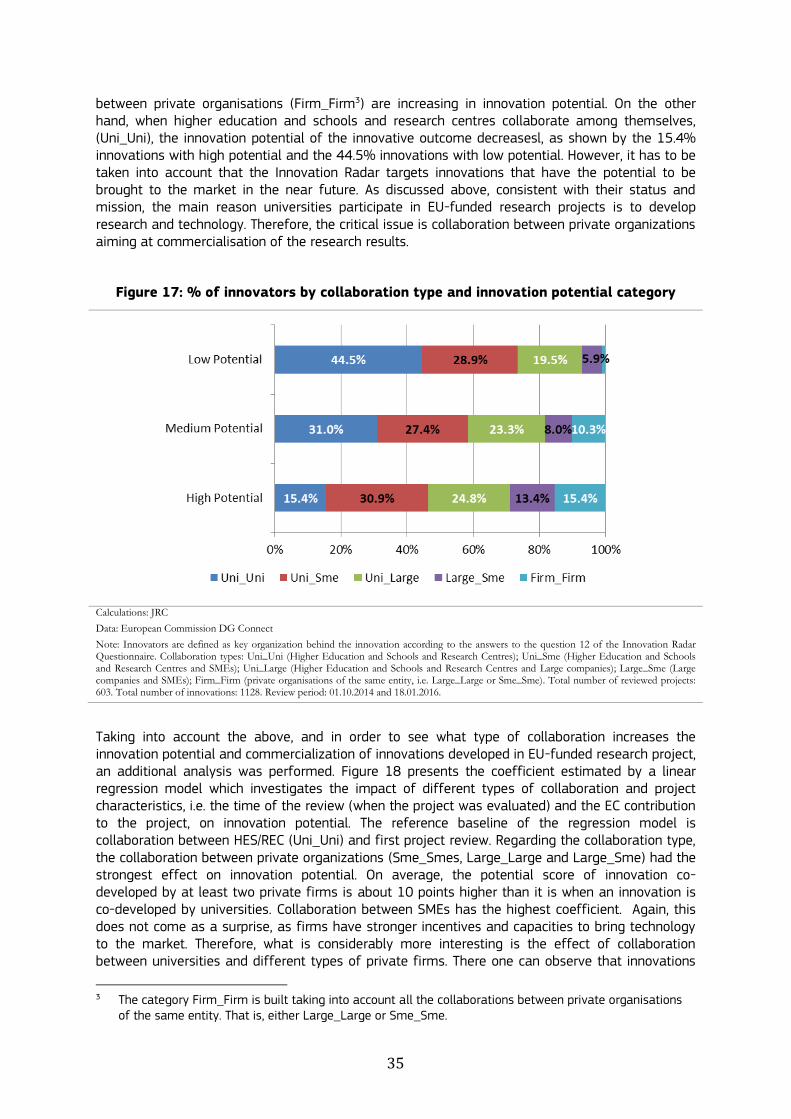
35
between private organisations (Firm_Firm3) are increasing in innovation potential On the other hand when higher education and schools and research centres collaborate among themselves (Uni_Uni) the innovation potential of the innovative outcome decreasesl as shown by the 154 innovations with high potential and the 445 innovations with low potential However it has to be taken into account that the Innovation Radar targets innovations that have the potential to be brought to the market in the near future As discussed above consistent with their status and mission the main reason universities participate in EU-funded research projects is to develop research and technology Therefore the critical issue is collaboration between private organizations aiming at commercialisation of the research results
Figure 17 of innovators by collaboration type and innovation potential category
Calculations JRC
Data European Commission DG Connect
Note Innovators are defined as key organization behind the innovation according to the answers to the question 12 of the Innovation Radar Questionnaire Collaboration types Uni_Uni (Higher Education and Schools and Research Centres) Uni_Sme (Higher Education and Schools and Research Centres and SMEs) Uni_Large (Higher Education and Schools and Research Centres and Large companies) Large_Sme (Large companies and SMEs) Firm_Firm (private organisations of the same entity ie Large_Large or Sme_Sme) Total number of reviewed projects 603 Total number of innovations 1128 Review period 01102014 and 18012016
Taking into account the above and in order to see what type of collaboration increases the innovation potential and commercialization of innovations developed in EU-funded research project an additional analysis was performed Figure 18 presents the coefficient estimated by a linear regression model which investigates the impact of different types of collaboration and project characteristics ie the time of the review (when the project was evaluated) and the EC contribution to the project on innovation potential The reference baseline of the regression model is collaboration between HESREC (Uni_Uni) and first project review Regarding the collaboration type the collaboration between private organizations (Sme_Smes Large_Large and Large_Sme) had the strongest effect on innovation potential On average the potential score of innovation co-developed by at least two private firms is about 10 points higher than it is when an innovation is co-developed by universities Collaboration between SMEs has the highest coefficient Again this does not come as a surprise as firms have stronger incentives and capacities to bring technology to the market Therefore what is considerably more interesting is the effect of collaboration between universities and different types of private firms There one can observe that innovations
3 The category Firm_Firm is built taking into account all the collaborations between private organisations
of the same entity That is either Large_Large or Sme_Sme
36
co-developed by universities and SMEs have on average higher innovation potential scores than those co-developed by universities and large firms Whereas innovations co-developed between universities and SMEs have a 48 point higher score as compared to the reference point those that are co-developed by universities and large firms have a score of only 43 This observation is consistent with previous findings that indicate that SMEs benefit more than large firms from collaboration with universities in publicly-funded research projects (Okamuro 2007)
As expected a review later in the life of the project finds that the average value of the innovations developed has increased This confirms previous observations which suggest that ideas and technologies developed during EU-funded research projects mature and increase their potential as projects advance On the other hand the amount of EC funding allocated to the project does not seem to affect the potential of the innovation
Figure 18 Linear estimates of innovation potential indicators and innovation
partnerships
Calculations JRC
Data European Commission DG Connect
Note OLS robust standard errors number of observation 1426 R-squared 014 Total number of reviewed projects 603 Total number of innovations 1128 Review period 01102014 and 18012016
To conclude the importance of SMEs in delivering innovations with high potential is observed also when looking at the different type of collaboration between projects Interestingly enough when private organisations pair together they increase their probability of delivering innovations with high potential while the same is not true for HESREC This may suggest the need for support for HESREC to increase the market potential of the innovations developed
53 Innovation type and collaboration type
The Innovation Radar characterises the types of innovation by distinguishing between new or significantly improved product process service marketing and organisational method Based on this information Figure 19 presents the relationship between the mix of organizations involved in innovation (co-) development and the type of innovation
37
Over 50 of the innovations are product innovations followed by service and process At the same time very few innovations belong to organisational and marketing method that accounts for only 3 of the total innovation output4 As shown by the figure the distribution of the innovation type is relatively stable across the different organisation composition However new products are considerably more often co-developed in the course of collaboration involving universities For example 63 of innovations developed by university and SMEs are new product In contrast only 51 of innovations delivered as a result of collaboration between SMEs and large firms are new products The remaining half represents innovations that can be described as new processes services or organizational methods This can suggest that universities are a source of novel technologies that are channelled through private organizations to the market
Figure 19 of innovators by collaboration and innovation type
Calculations JRC
Data European Commission DG Connect
Note Innovators are defined as key organization behind the innovation according to the answers to the question 12 of the Innovation Radar Questionnaire Collaboration types Uni_Uni (Higher Education and Schools and Research Centres) Uni_Sme (Higher Education and Schools and Research Centres and SMEs) Uni_Large (Higher Education and Schools and Research Centres and Large companies) Large_Sme (Large companies and SMEs) Firm_Firm (private organisations of the same entity ie Large_Large or Sme_Sme) Total number of reviewed projects 603 Total number of innovations 1128 Review period 01102014 and 18012016
54 Innovation stage and exploitation plans
This section deals with the question of whether there is a pattern in the innovation development stage and exploitation plans depending on the type of organizations involved in its (co-) development The idea is that organisations of different types may apply for EC projects at different stages of their innovation development Indeed one could expect that private organisations may apply for public funding after having already initiated the development of the innovation while universities are more likely to start innovation development after having been granted public funding
Figure 20 shows the percentage of innovators by cooperation type and innovation development Figure 20 shows there is no clear pattern Even when focussing on collaboration between organisations of same type the relative differences between innovation stages are negligible and do not bring additional information on the exploitation plans deployed by the distinct organisations
4 For simplicity of presentation possible innovation output was grouped into four categories combining
organisational and marketing method
38
In order to ensure the results were not influenced by when the review took place we also analysed jointly the different types of collaboration at the different stages of the review process The results didnt show any major differences across organisation type apart from a general trend for all organisations towards a higher percentage of innovations Already developed but not yet being exploited and innovations Being exploited in the final period of the project
Figure 20 of innovators by collaboration type and innovation development
Calculations JRC
Data European Commission DG Connect
Note Innovators are defined as key organization behind the innovation according to the answers to the question 12 of the Innovation Radar Questionnaire Collaboration types Uni_Uni (Higher Education and Schools and Research Centres) Uni_Sme (Higher Education and Schools and Research Centres and SMEs) Uni_Large (Higher Education and Schools and Research Centres and Large companies) Large_Sme (Large companies and SMEs) Firm_Firm (private organisations of the same entity ie Large_Large or Sme_Sme) Total number of reviewed projects 603 Total number of innovations 1128 Review period 01102014 and 18012016
39
6 The role of end user engagement for innovation potential
In the past decades the innovation model has shifted from a linear model where end-users intervene only at the very end of the process to a more collaborative model where end-users actively contribute to the innovation process The increasing importance of the role of end-users in innovation processes has been highlighted in the work of Chesbrough (2003) and von Hippel (2005) who both recognize end-users as important sources of valuable ideas for firms The Innovation Radar recognises the importance of end-users being close to the innovation process and reports on the engagement of end-users in the project consortium Below we show how the engagement of end-users affects the innovation potential of the projects
61 In a nutshell
The analysis of end user engagement in the project consortium produced the following main findings
There is a positive relation between the engagement of end-users and innovation potential High Innovation potential projects report the highest share of end-users engagement The share of end-users engagement inside the consortium is 64 and 33 for end-users outside the consortium
End-users engagementndash both internal and external to the consortium- positively affects the level of commitment of relevant partner in exploiting the innovation Projects with high shares of end-users engagement (32 when end-users are inside the consortium and 16 when outside the consortium) show a High level of partners commitment
40
Figure 21 shows the distribution of end-users across projects by innovation potential End-users could either belong to the consortium or be external to the project High innovation potential projects report the overall highest share of end-user engagement 64 (part of the consortium) and 33 (outside the consortium) Interestingly the low innovation potential projects account for the lowest rate of end-user engagement Indeed the percentage of low innovation potential projects that declare no end-user engagement is above 30 We do not have the necessary information for assessing whether a causal relation between end-user engagement and innovation potential exists However the data confirms a positive relation between the engagement of end-users and innovation potential
41
Figure 21 End user engagement by innovation potential
Calculations JRC
Data European Commission DG Connect
Note The computations were based on the responses to general question 1 of the Innovation Radar Questionnaire Total number of reviewed projects 603 Total number of innovations 1128 Review period 01102014 and 18012016
End-user engagement may also affect the overall innovation performance of the project and the level of commitment of relevant partners in exploiting the innovation Figure 22 presents data on the project partners commitment and innovation performance The data suggest that end-user engagement ndash both internal and external to the consortium - increases the level of commitment of relevant partners in exploiting the innovation On the other hand the results in terms of innovation performance do not show that end-user engagement directly improves the project
Figure 22 End user engagement by partners commitment and innovation performance
Calculations JRC
42
Data European Commission DG Connect
Note The computations were based on the responses to general question 1 6 and 8 of the Innovation Radar Questionnaire Total number of reviewed projects 603 Total number of innovations 1128 Review period 01102014 and 18012016
43
7 Steps and barriers to innovation commercialisation
This section deals with three issues concerning innovation commercialisation First it presents the responses to the questions on the steps that organizations undertook or plan to undertake in order to bring the innovations to (or closer to) the market Second it provides an overview of what innovators need to fulfil the market potential of their innovations and finally it shows what the most common bottlenecks to innovation commercialization are
71 In a nutshell
The main findings of the analysis of steps and barriers to innovation commercialisation include
When taking innovations to the market projects focus more on technology-related steps than business-related ones 664 of the projects that plan to commercialise their innovations undertake or plan to undertake demonstration or testing activities In contrast only 40 of projects have carried out or plan to carry out a market study A business plan is on the agenda of only 36 of projects that plan innovation commercialisation
Activities that involve participations or interactions with actors outside of the projects are relatively uncommon Only 45 to 9 of the projects have sought or are planning to seek private or public funding
Three of the most common needs are partnership with another company (195) business plan development (167) and expanding to more markets (149)
The least frequently named needs include incubation (64) participation in a start-up accelerator (59) and investor readiness training (56)
307 of project partners see financing as the major external bottleneck to innovation exploitation
Only 25 of the project partners consider trade issues between Member States and the rest of the world as a barrier to exploiting their innovative products or services
72 Steps to innovation commercialisation
Figure 23 indicates what steps have already been taken or are planned by projects to bring their innovations to (or closer to) the market This figure distinguishes between technology-related steps (eg feasibility study or prototyping) and business-related steps (eg business plan or capital investment)
Concerning technology-related steps prototyping and demonstration or testing activities are the most common measures that projects undertake in order to bring their innovations to the market Of the projects that are plannng to introduce their innovations to the market 664 is either undertaking or planning demonstration or testing activities or creating or planning to develop a prototype (654) Developing a pilot (552) is also quite common Among the most desirable steps that have not been taken or planned are feasibility studies engagement by industrial research team of one of their companys business units in project activities and technology transfer Around 12 of projects that are planning to introduce their innovations to the market perceive that these activities will facilitate innovation commercialisation
With respect to business-related steps Figure 23 shows that carrying out a market study and writing a business plan are among the most common steps that help to commercialise innovations Around 40 and 36 of projects have carried out or plan to carry out a market study and write a business plan At the same time around 16 of the projects see these steps as desirable and between 16 and 18 have not planned them in the course of innovation commercialisation A significantly smaller number of projects consider undertaking steps like launching a start-up or a spinoff or seeking funding For example between 5 and 9 of the projects have sought or are planning to seek private or public funding and between 25 and 28 of the projects consider this
44
step as desirable At the same time between 40 and 33 of the projects do not plan to seek capital or public investment
The evidence presented above leads to the following conclusions First the technology-related steps to bring innovations to the market are seen as more important than business-related ones Organizations very often focus on making sure that the innovation they develop is ready to be commercialised from the technological point of view To this end projects create a prototype or perform demonstrations or testing activities Relatively often organizations do not undertake or plan business-related steps Second in both cases ie technology- and business-related activities the emphasis is on what can be done within the project and among the participants Activities that involve interactions with actors outside of the projects or participation by them are less common particularly as regards seeking external funding Only a few projects see these activities as relevant to the commercialisation of innovations and many of them do not plan to undertake them This calls for two kinds of support First projects should be encouraged to look beyond the technological aspects and introduce business-related elements to their activities Second they should be encouraged to increase interaction with external specialised actors eg business coaches or venture capitalists as this could help them to improve the commercialisation chances of their innovations
Figure 23 Progress of projects in bringing innovations to the market
Calculations JRC
Data European Commission DG Connect
Note The computations were based on the responses to question 10 of the Innovation Radar Questionnaire Total number of reviewed projects 603 Total number of innovations 1128 Review period 01102014 and 18012016
73 Innovators need to realise the market potential of innovations
Figure 24 presents the responses to the question what do innovators need to realise the market potential of their innovations The most common needs are seen as partnerships with other companies business plan development and expanding to more markets The least frequently named needs include investor readiness training participation in a start-up accelerator and incubation
45
Figure 24 Innovators needs to fulfil the market potential of their innovations
Calculations JRC
Data European Commission DG Connect
Note The computations were based on the responses to question 13 of the Innovation Radar Questionnaire Total number of reviewed projects 603 Total number of innovations 1128 Review period 01102014 and 18012016
74 Type of organization and need to realise the market potential of innovations
Below we analyse whether the fact that an innovator is a university or private organizations has any implications for the further support needed to bring its innovation to the market
Figure 25 presents innovators needs to fulfil the market potential by organisation type As already shown in Figure 24 the most common need reported is partnership with another company (195) The breakdown by organisation type shows that the most common need reported by higher education and schools and research organisations (HSEREC) is partnership with another company (118 of the total needs or 605 of the specific needs) followed by business plan development (9 or 54) and legal advice (73 or 62) For private organisations the most common needs reported are expanding to more markets and developing a business plan (between 5 and 3 respectively) Moreover in general HESREC seem to report more needs than private organisations
In order to better analyse the differences between organisations in reporting potential market needs we ran a multinomial logistic regression and reported the resulting marginal effects in Figure 26 The figure shows that we can identify clearly different patterns for HESREC and private organisations The figure also shows the probability of reporting a specific need all other things remaining constant for specific organisations
For HESREC the probability of reporting needs such as start-up accelerator incubation partnership mentoring and legal advice are all positive and range from 10 to 20 On the other hand being an HESREC reduces the probability of reporting needs such as expanding to more markets or developing a business plan The situation is completely the reserve for private organisations where both large enterprises and SMEs are more likely to report the latter as their most common needs Private organisations diverge only with respect to investor introductions which are more relevant for SMEs and HESREC than they are for large enterprises
The results of the analysis suggest that HESREC tend to report more needs related to the finalisation of the innovation and the subsequent steps to bring it to the market while private organisations needs are more related to the commercialization of the innovation and the need to create or expand their markets
46
Figure 25 Innovators need to fulfil the market potential by organisation type
Calculations JRC
Data European Commission DG Connect
Note The computations were based on the responses to question 13 of the Innovation Radar Questionnaire Total number of reviewed projects 603 Total number of innovations 1128 Review period 01102014 and 18012016
Figure 26 Marginal effects of potential market needs by organisation type
Calculations JRC
Data European Commission DG Connect
Note Marginal effects multinomial logistic regression number of observation2095 Total number of reviewed projects 603 Total number of innovations 1128 Review period 01102014 and 18012016
47
75 Bottlenecks to innovation commercialization
Figure 27 presents responses to the question of what are the external bottlenecks that compromise the ability of project partners to exploit new products solutions or services internally or in the market place For the majority of project partners (307) lack of financing is seen as the major external bottleneck to innovation exploitation Regulation and standards account for 156 and 143 respectively together with the generic group others IPR and workforce skills are considered as relatively important Around 10 of the projects perceive at least one of the two issues as an external factor that could threaten the ability of project partners to commercially exploit innovations Among the bottlenecks seen as least harmful are trade issues between Member States and the rest of the world Only 25 of the project partners consider these as barriers to exploiting their innovative products or services
Comparing the steps that organizations undertook or plan to undertake in order to bring their innovations to (or closer to) the market (see Figure 23) and the information presented in Figure 27 leads us to observe an apparent contradiction between what project organisations claim to be a barrier and their actual behaviour While 307 of project partners see lack of financing as a barrier to exploiting their innovative products or services only 5 to 9 of the projects have sought or are planning to seek private or public funding Moreover between 33 and 40 of the projects do not plan to seek capital or public investment This point is further emphasised by the fact that organizations most commonly declare that they need partnerships with other companies and to expand to more markets in order to realise the market potential of their innovations
Figure 27 External bottlenecks that compromise the ability of project partners to
exploit innovations
Calculations JRC
Data European Commission DG Connect
Note The computations were based on the responses to general question 4 of the Innovation Radar Questionnaire Total number of reviewed projects 603 Total number of innovations 1128 Review period 01102014 and 18012016
48
8 Conclusions
This section summarises the key messages from the analysis of the IR data These focus specifically on the role of collaboration between universities and private organisations
Nurturing business culture among innovators
The current analysis shows that the key organizations behind ICT FP7Horizon2020-related innovations tend to have high levels of technological involvement but pay less attention to the business-related dimensions of their innovations It seems that there is a strong need for projects to look beyond the technological aspects and introduce business-related elements into their activities This can be achieved by providing incentives for increasing interactions between projects and external specialised actors eg business coaches or venture capitalists who could help to improve the commercialisation chances of innovations
Another interesting aspect emerging from the IR data is the high participation and active role of SMEs in delivering innovations with high potential SMEs are an important vehicle for co-creating and commercialising innovative technologies developed within ICT FP7Horizon2020 projects
Industry-university collaboration
Collaboration between universities and industry plays a crucial role in driving innovation processes Universities possess essential skills for innovation supplied to business They are the basis of the knowledge-based economy The close collaboration between university and industry poses a series of policy questions on how to foster this collaboration and what kind of policy support should be implemented
The IR data showed that universities are key co-innovators in over 70 of all innovations with high potential Collaboration between universities and SMEs delivers the largest share of innovations with high potential and seems to be more fruitful than the collaboration between universities and large firms This may suggest that universities are a source of innovative products that are channelled through private organizations to the market and that SMEs form a better bridge to universities in this process Finally innovations co-developed with universities are as likely to be commercially exploited as those introduced by private-private collaborations
49
References
Caloghirou Y Tsakanikas A amp Vonortas N (2001) University-Industry Cooperation in the Context of the European Framework Programmes [journal article] The Journal of Technology Transfer 26(1) 153-161 doi 101023a1013025615518
Chesbrough H (2003) Open Innovation The New Imperative for creating and Profiting from Technology Boston Harvard Business School Press
De Prato G Nepelski D amp Piroli G (2015) Innovation Radar Identifying Innovations and Innovators with High Potential in ICT FP7 CIP amp H2020 Projects JRC Scientific and Policy Reports Seville JRC-IPTS
EC-CONNECT (2013) Overview of Research Projects in the ICT Domain 2012 ICT statistical report for annual monitoring (StReAM) European Commission httpseceuropaeudigital-agendasitesdigital-agendafilesStream_2012pdf
Evans B (2011) Beginning Arduino Programming Springer
Hernan R Marin P amp Siotis G (2003) An Empirical Evaluation of the Determinants of Research Joint Venture Formation The Journal of Industrial Economics 51(1) 75-89
OECD (2015) OECD Science Technology and Industry Scoreboard 2015 Paris OECD
Okamuro H (2007) Determinants of successful RampampD cooperation in Japanese small businesses The impact of organizational and contractual characteristics Research Policy 36(10) 1529-1544 doi httpdxdoiorg101016jrespol200612008
Polt W Vonortas N amp Fisher R (2008) The impact of publicly funded research on innovation An analysis of European Framework Programmes for Research and Development European Commission Directorate-General for Internal Market Industry Entrepreneurship and SMEs
Roumlller L-H Siebert R amp Tombak M (2007) Why Firms Form (or do not Form) RJVS The Economic Journal 117(522) 1122-1144 doi 101111j1468-0297200702069x
Siebert R (1996) The Impact of Research Joint Ventures on Firm Performance An Empirical Assessment (Vol CIG Working Papers FS IV 96-03) Wissenschaftszentrum Berlin (WZB)
SJTU (2015) Federico Musto of Arduino Our real boss is the community SJTU PARISTECH REVIEW(2015-11-11)
Thompson C (2008 20102008) Build It Share It Profit Can Open Source Hardware Work Wired Retrieved from httpswwwwiredcom200810ff-openmanufacturing
Torrone P amp Fried L (2010) Million dollar baby ndash Businesses designing and selling open source hardware making millions Paper presented at the Foo Camp East 2010 httpmakezinecom20100506million-dollar-baby-businesses-de
von Hippel E (2005) Democratizing Innovation MIT Press
HOW TO OBTAIN EU PUBLICATIONS Free publications bull one copy
via EU Bookshop (httpbookshopeuropaeu)
bull more than one copy or postersmaps
from the European Unionrsquos representations (httpeceuropaeurepresent_enhtm)
from the delegations in non-EU countries (httpeeaseuropaeudelegationsindex_enhtm)
by contacting the Europe Direct service (httpeuropaeueuropedirectindex_enhtm) or
calling 00 800 6 7 8 9 10 11 (freephone number from anywhere in the EU) ()
() The information given is free as are most calls (though some operators phone boxes or hotels may charge
you)
Priced publications bull via EU Bookshop (httpbookshopeuropaeu)
doi102791244949 ISBN 978-92-79-64630-0
LF
-NA
-28
35
5-E
N-N
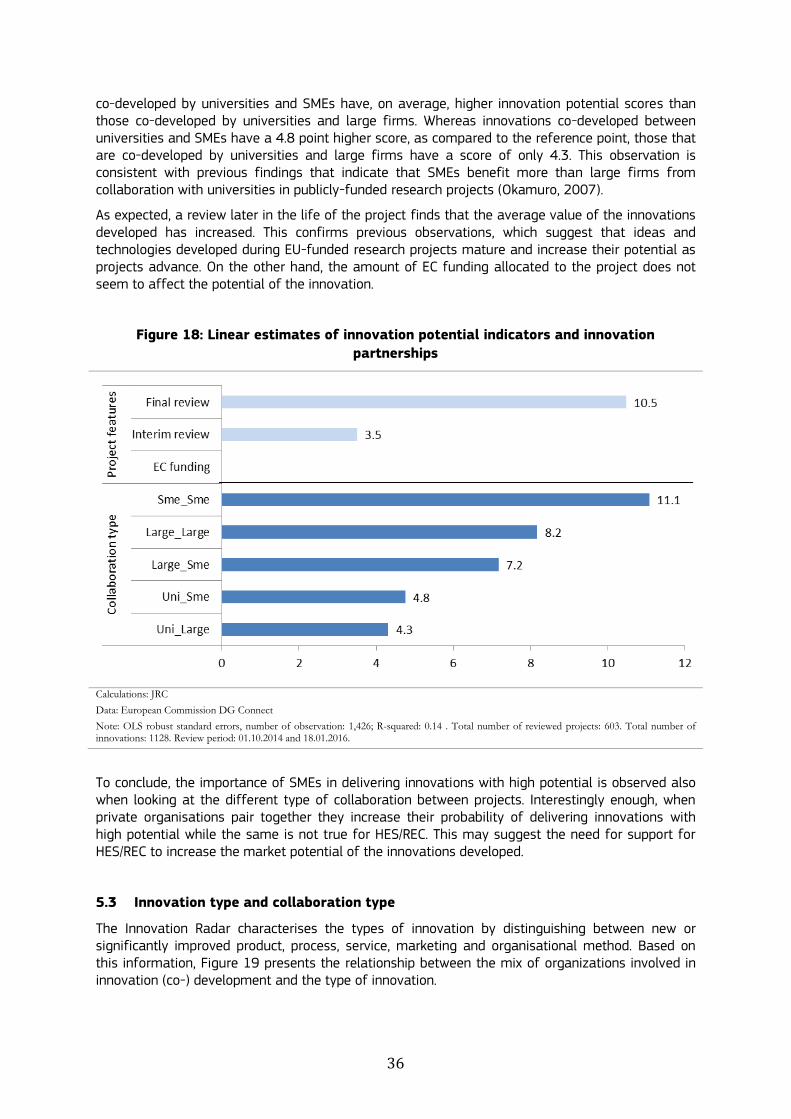
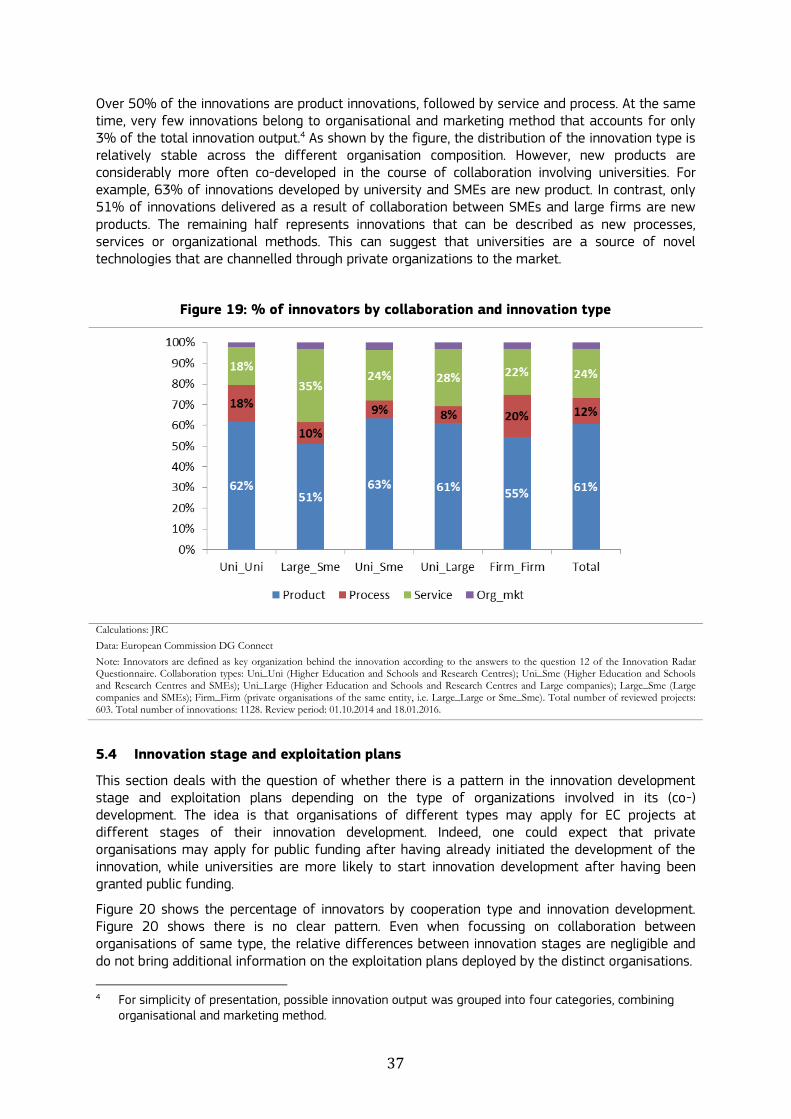
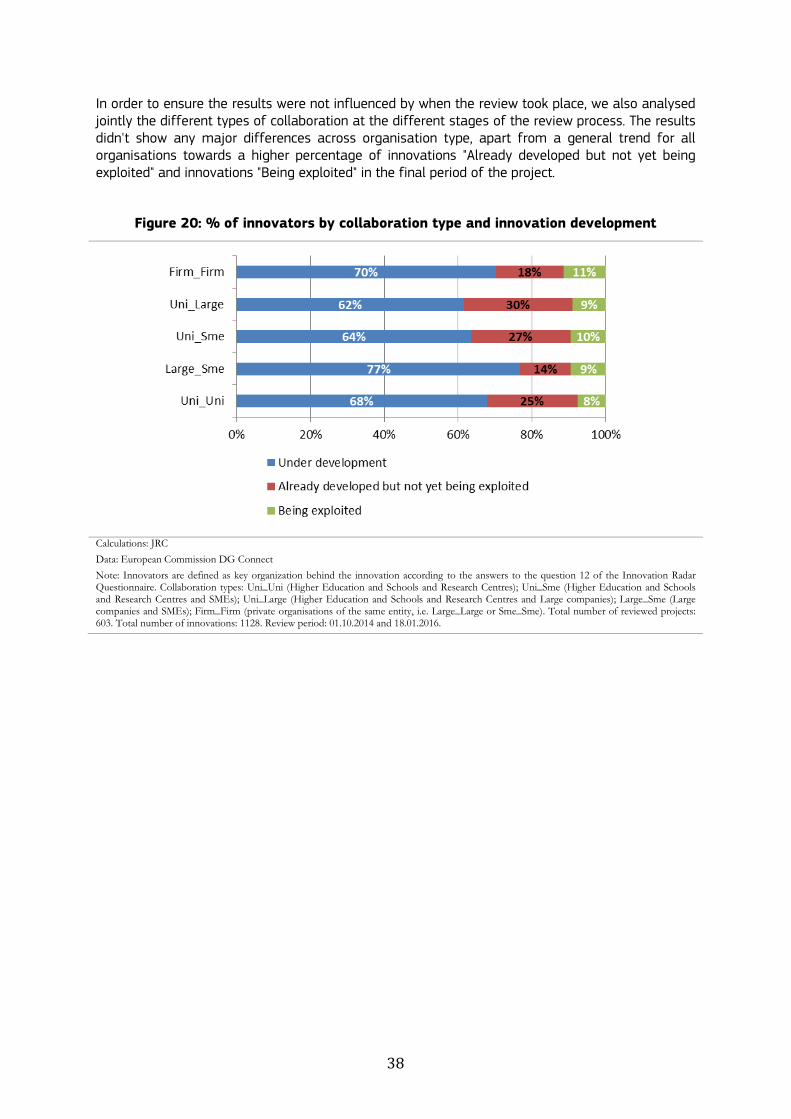
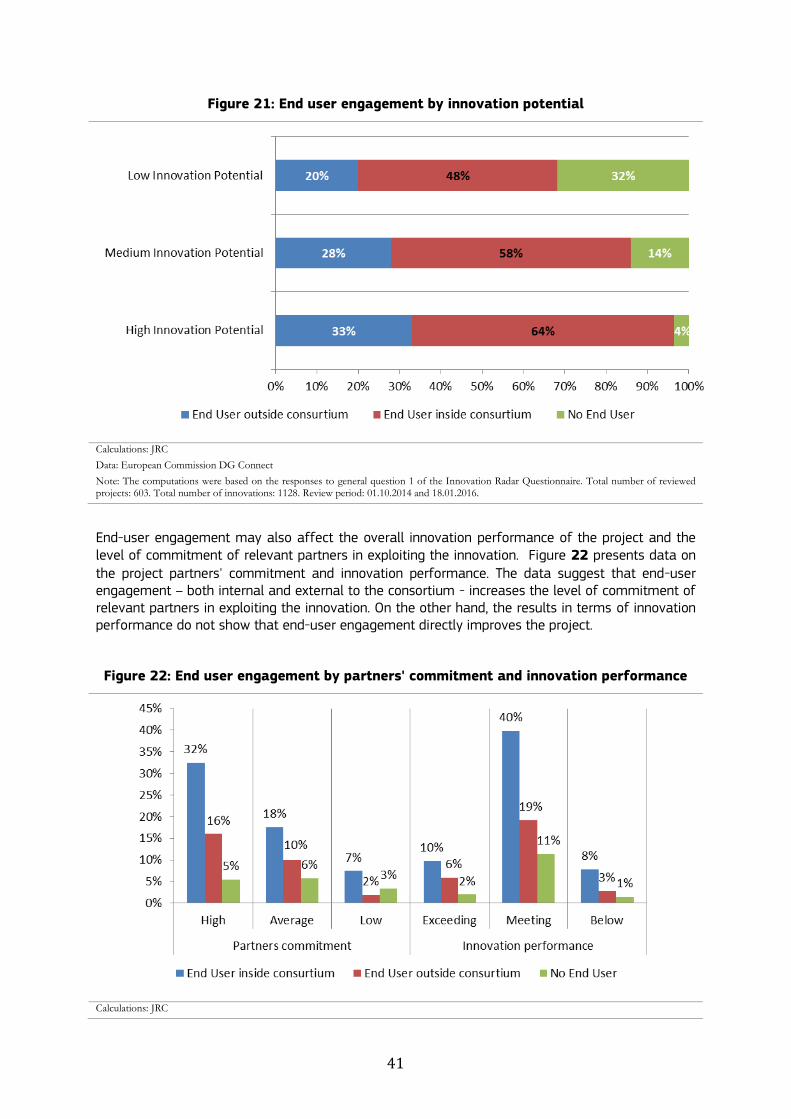
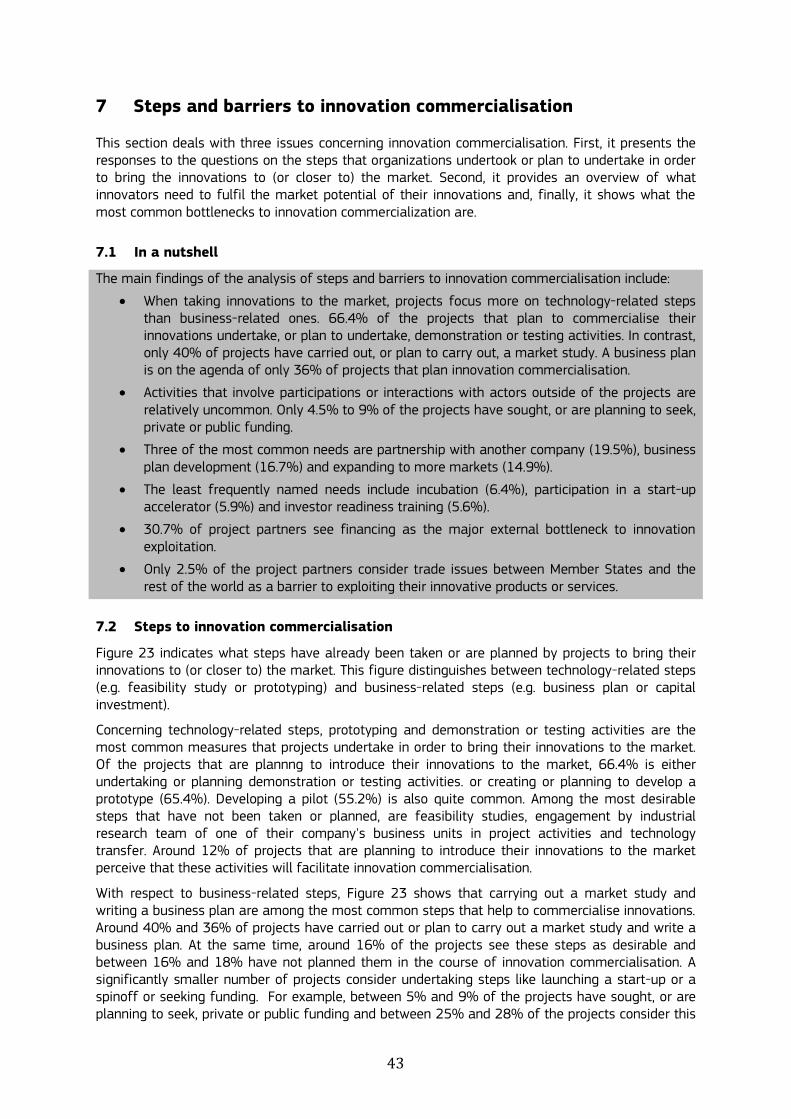
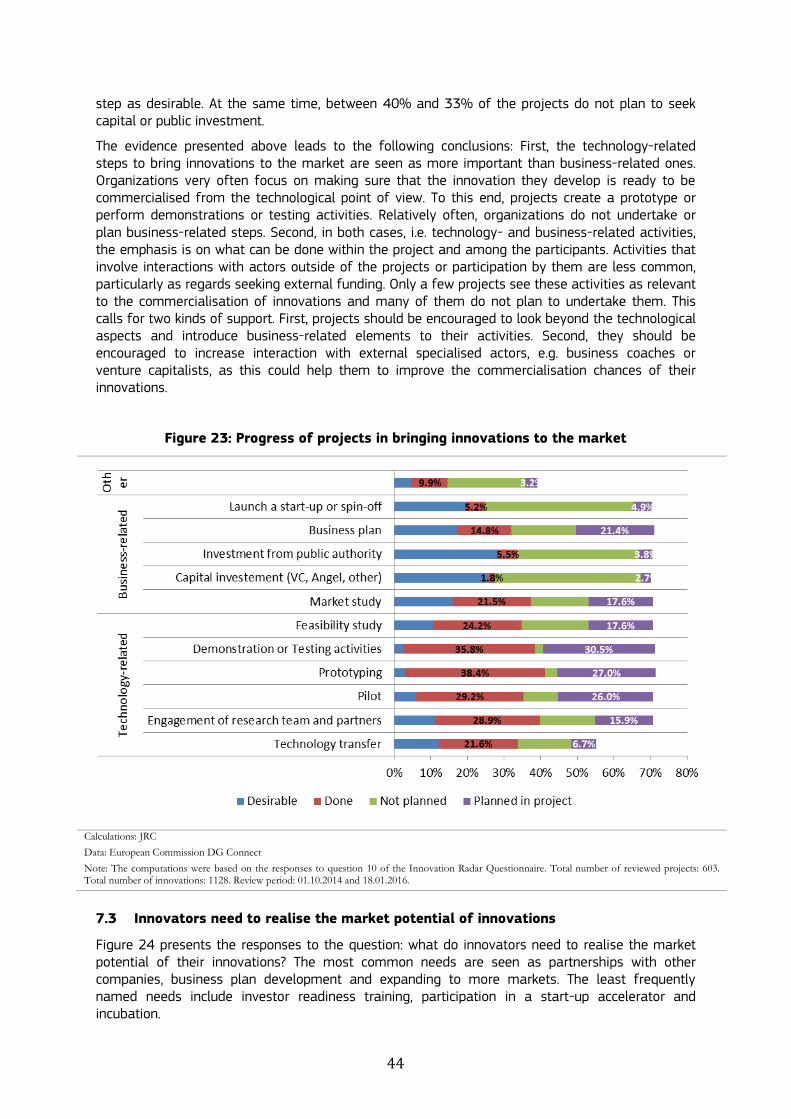
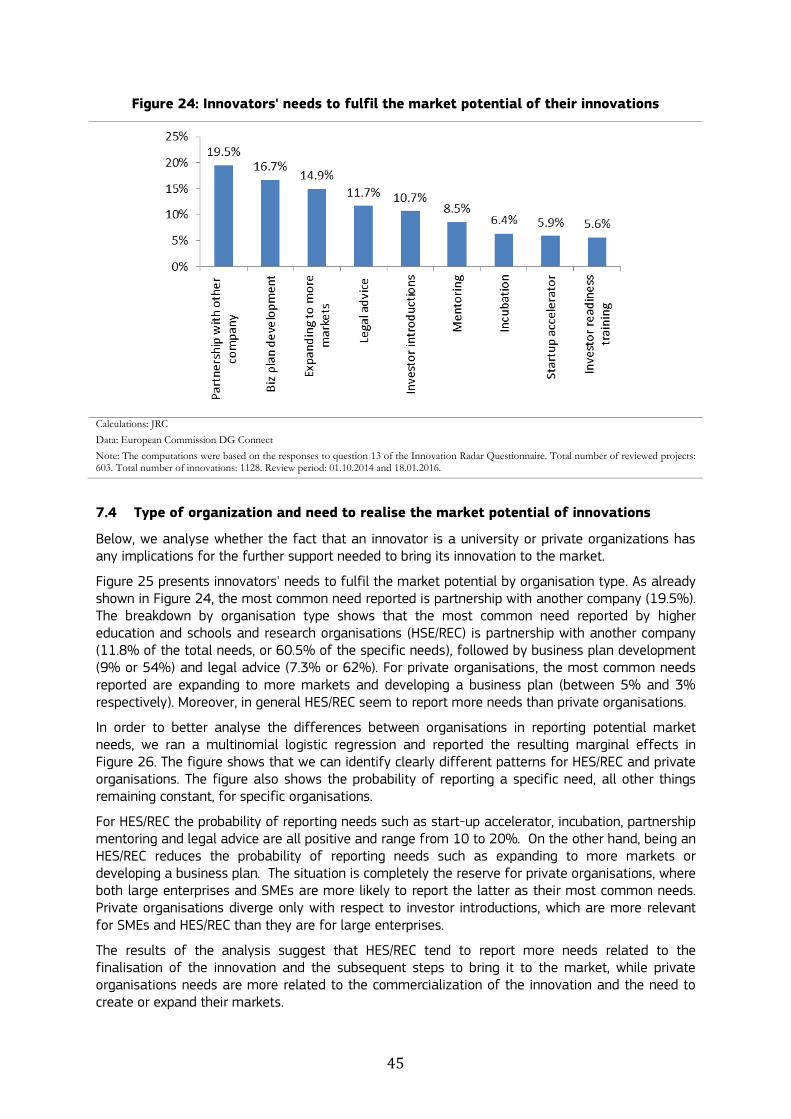
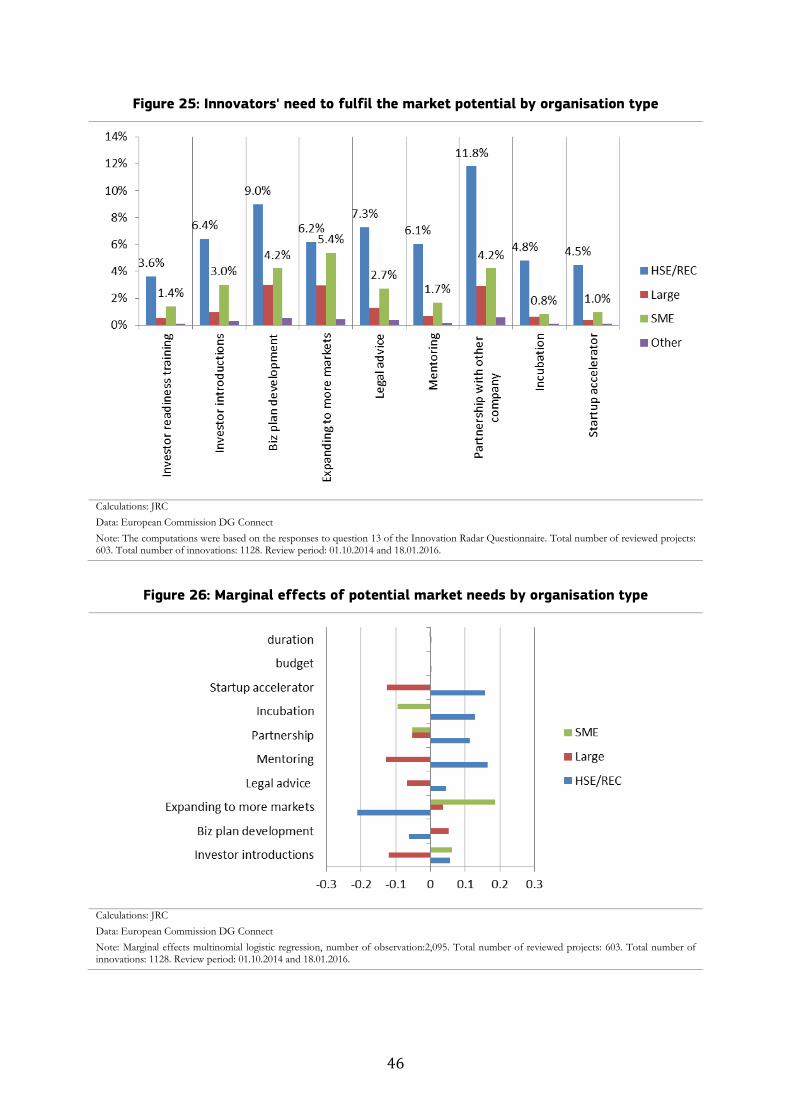
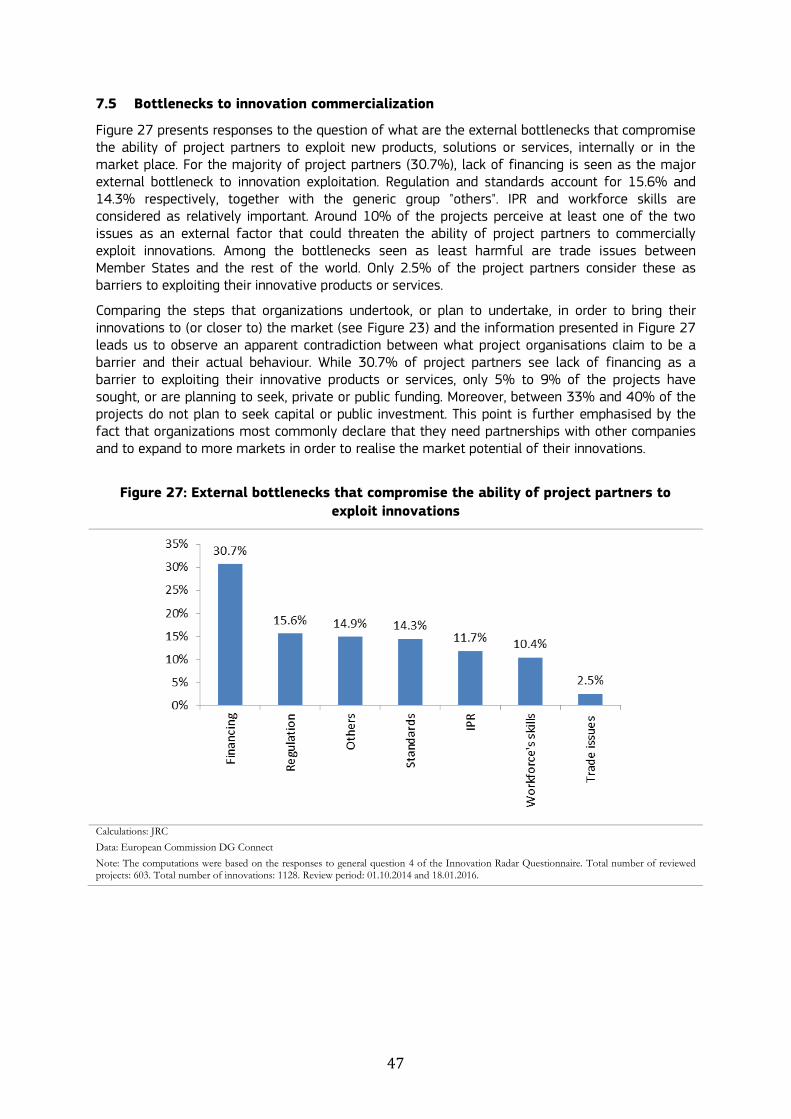
doi102791244949 ISBN 978-92-79-64630-0
LF
-NA
-28
35
5-E
N-N