Embed Size (px)
Citation preview

0
Product Development in the Automotive Industry: Strategies to Circumvent the Complexity Challenge
Product Development in the Automotive Industry: Strategies to Circumvent the Complexity ChallengeJanuary 31, 2002
Ulrich Näher, Wolfgang Neubert, Arno Antlitz
1
4
5
6
7
8
9
10
11
12
5.0 7.5 10.0 12.5 15.0
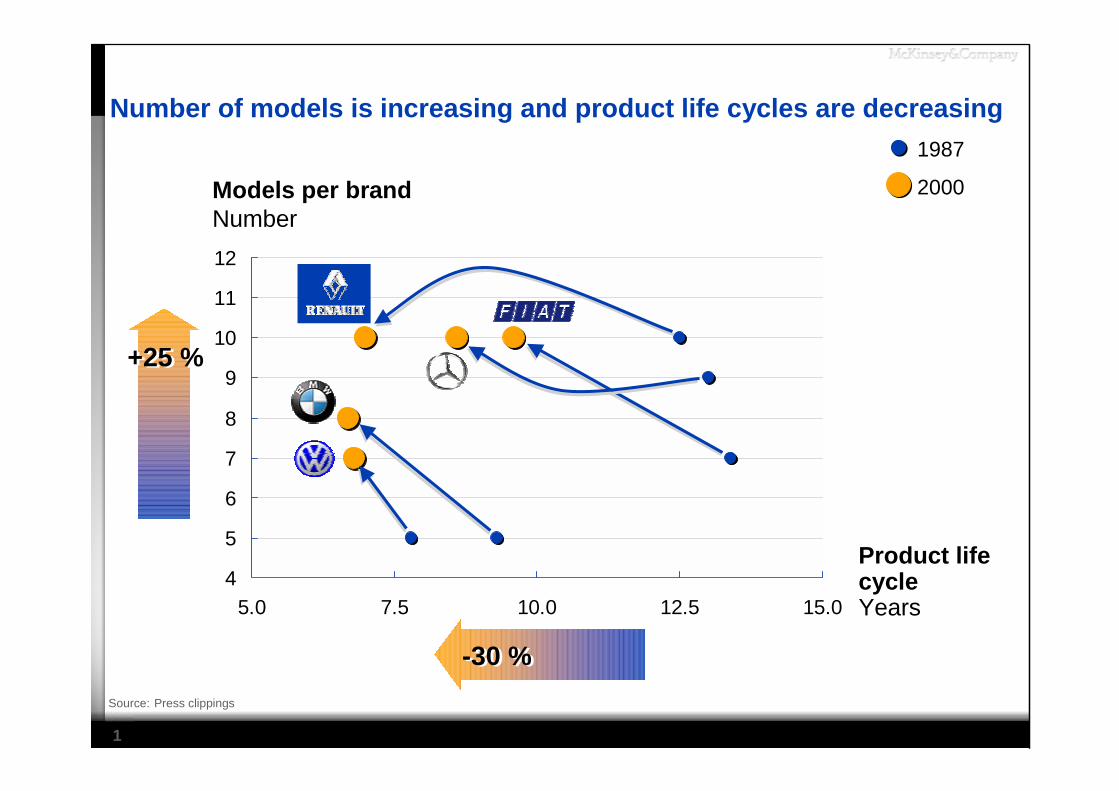
Number of models is increasing and product life cycles are decreasing
Source: Press clippings
Models per brandNumber
Product lifecycleYears
1987
2000
-30 %-30 %
+25 %+25 %

2
60
24
60%
Mondeo1993/2000
Reduction driven by implemen-tation of simulation
technologies
Time-to-market is reduced dramatically
* Start of productionSource: Automobile production, AN, MID
MONTH FROM DESIGN FREEZE TO SOP*
40
29
C-class1995/2000
28%3832
Golf III / IV1991/96
16%
Reduction driven by implementa-
tion of stringent quality gates
OUTSIDE-IN ANALYSIS
3
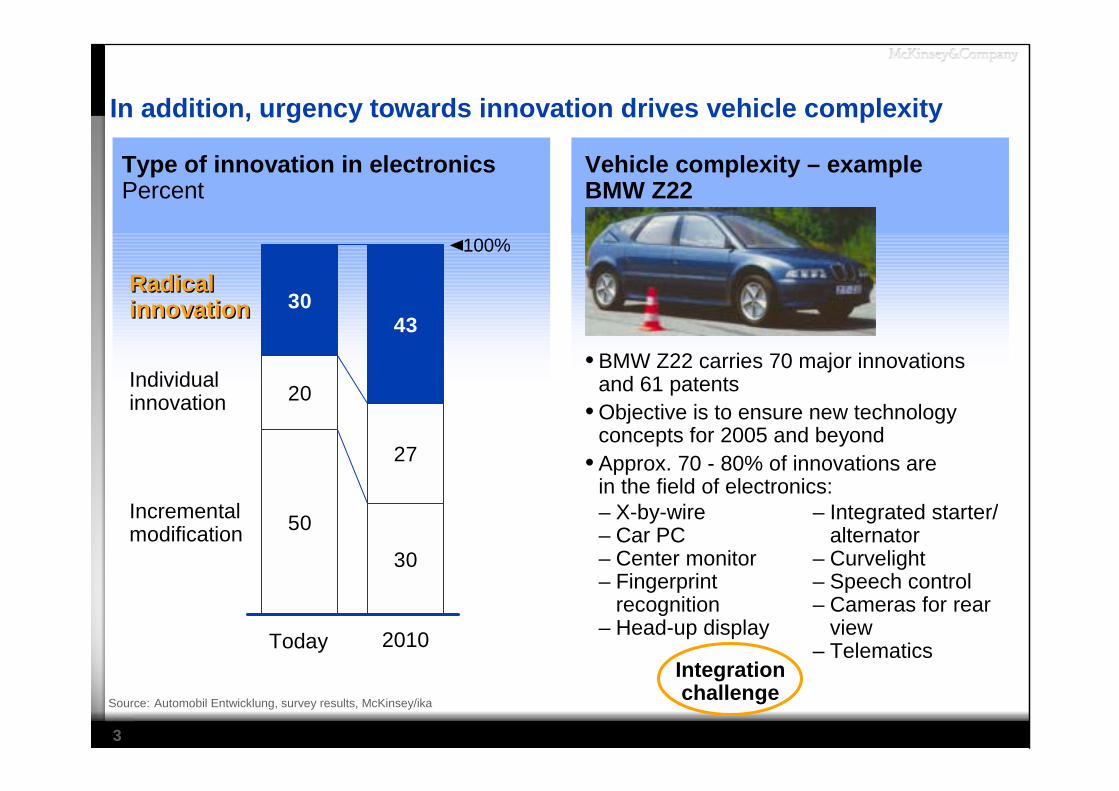
In addition, urgency towards innovation drives vehicle complexity
Source: Automobil Entwicklung, survey results, McKinsey/ika
Type of innovation in electronicsPercent
Radical innovationRadical innovation
Individual innovation
Incremental modification
100%
Today 2010
50
30
20
27
3043
• BMW Z22 carries 70 major innovations and 61 patents
• Objective is to ensure new technology concepts for 2005 and beyond
• Approx. 70 - 80% of innovations are in the field of electronics:– X-by-wire– Car PC– Center monitor– Fingerprint
recognition– Head-up display
Vehicle complexity – exampleBMW Z22
– Integrated starter/alternator
– Curvelight– Speech control– Cameras for rear
view– Telematics
Integration challenge
4
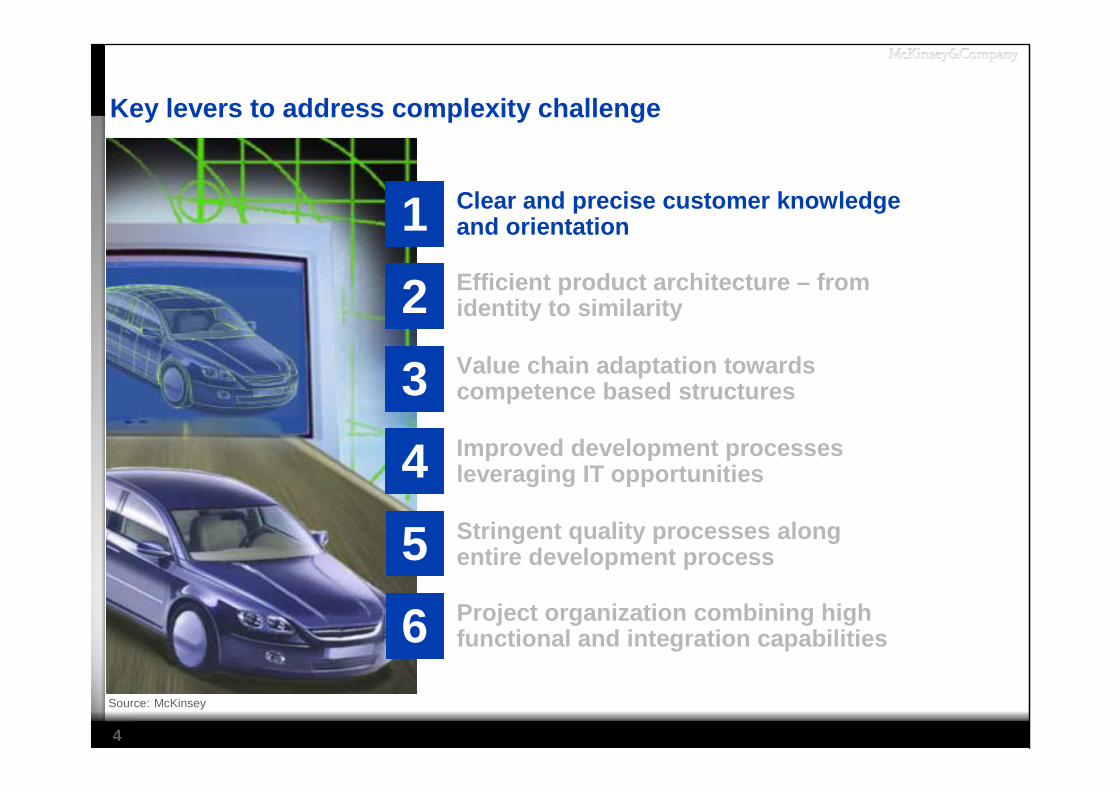
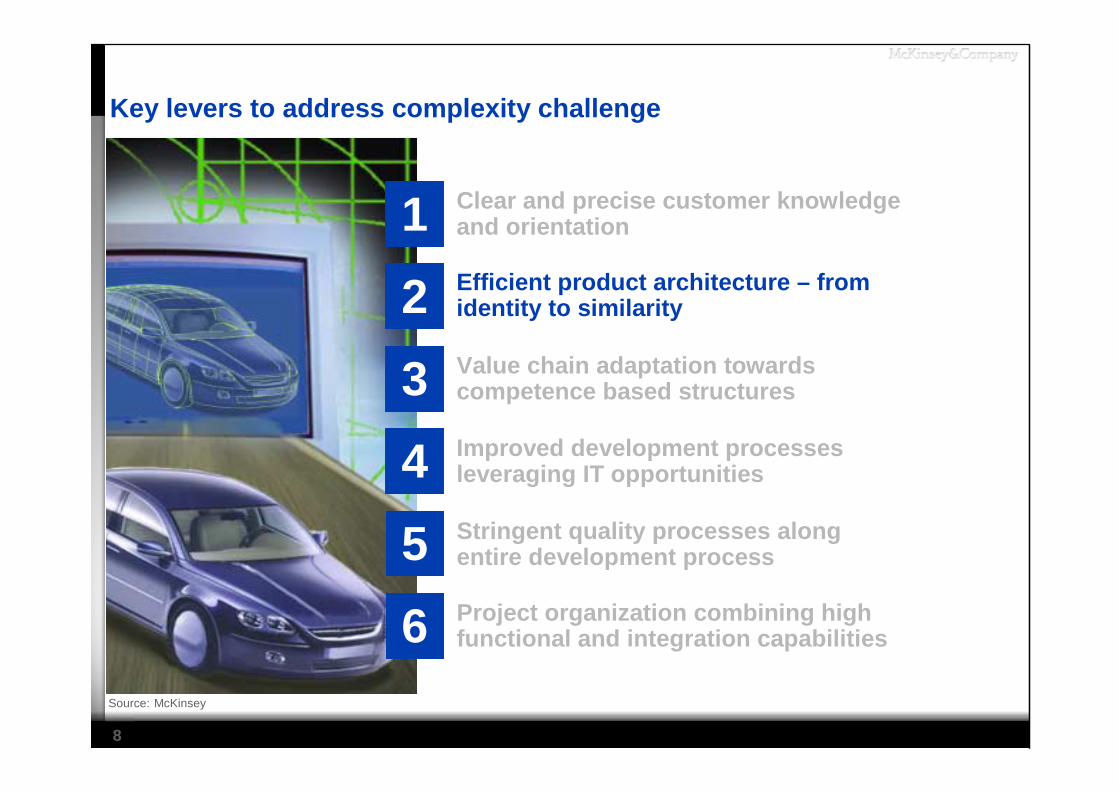
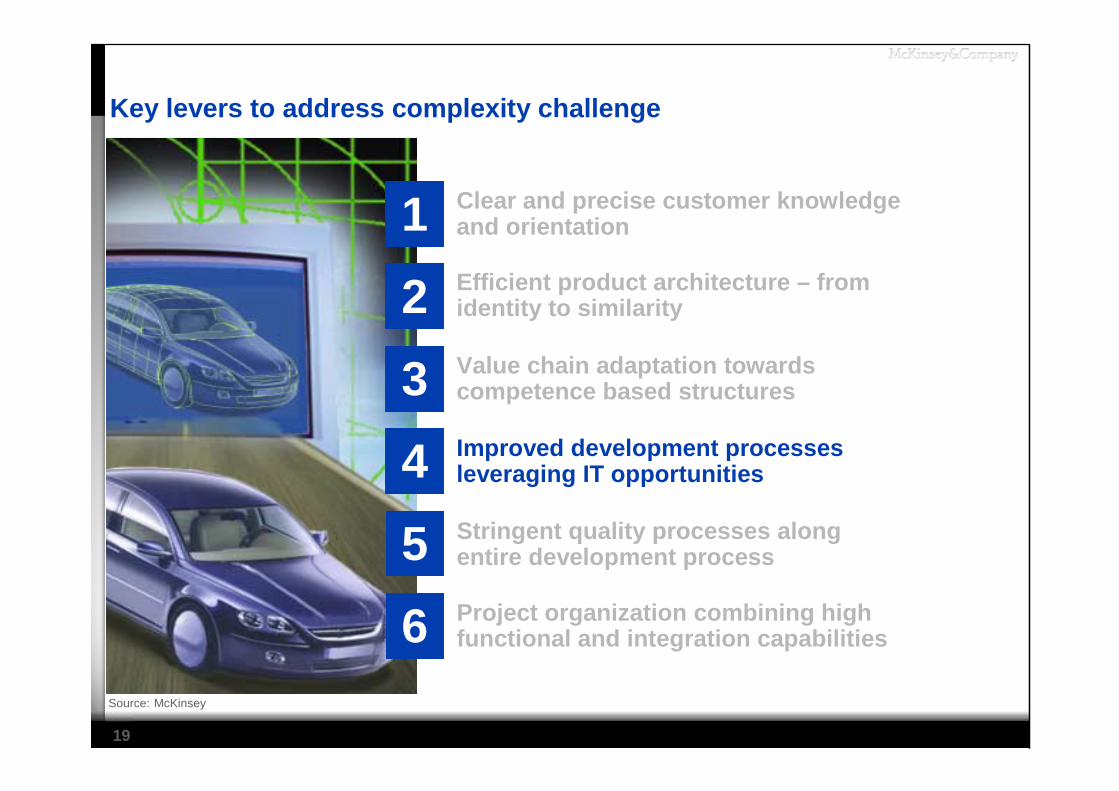
Key levers to address complexity challenge
Clear and precise customer knowledge and orientation1Efficient product architecture – from identity to similarity2Value chain adaptation towards competence based structures3Improved development processes leveraging IT opportunities4Stringent quality processes along entire development process5Project organization combining high functional and integration capabilities6
Source: McKinsey
5
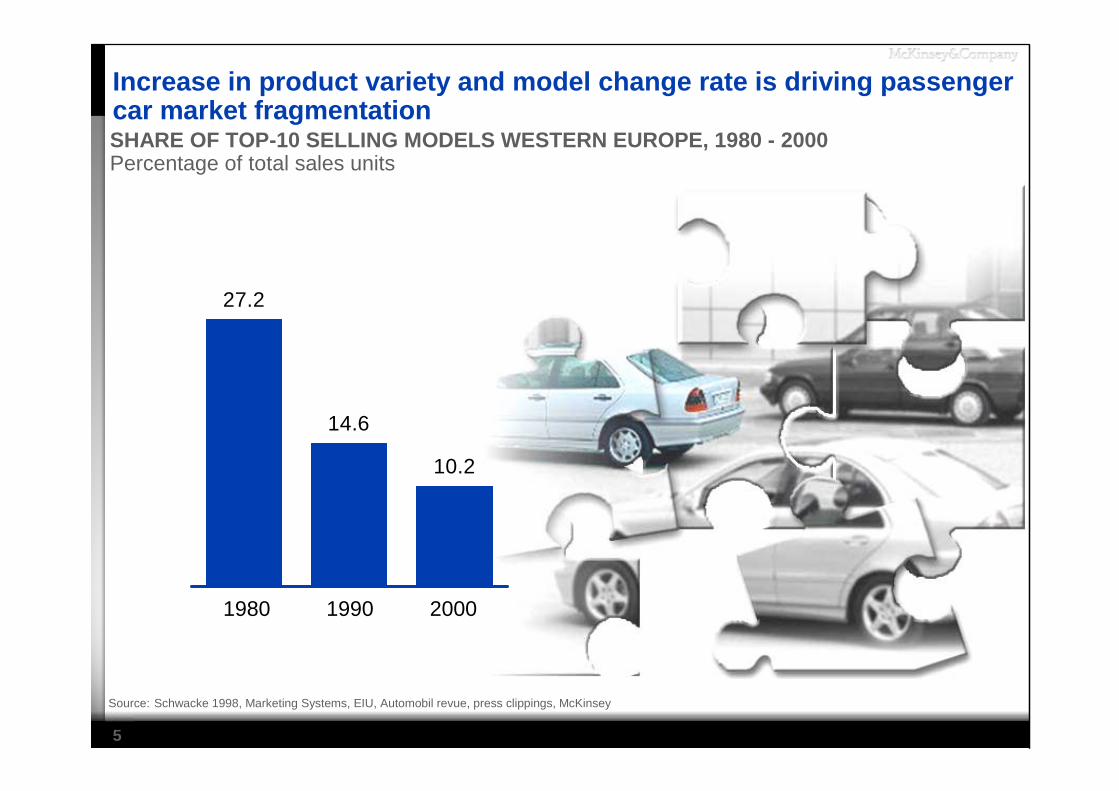
27.2
14.6
10.2
1980 1990 2000
Increase in product variety and model change rate is driving passenger car market fragmentation
Source: Schwacke 1998, Marketing Systems, EIU, Automobil revue, press clippings, McKinsey
SHARE OF TOP-10 SELLING MODELS WESTERN EUROPE, 1980 - 2000Percentage of total sales units
6
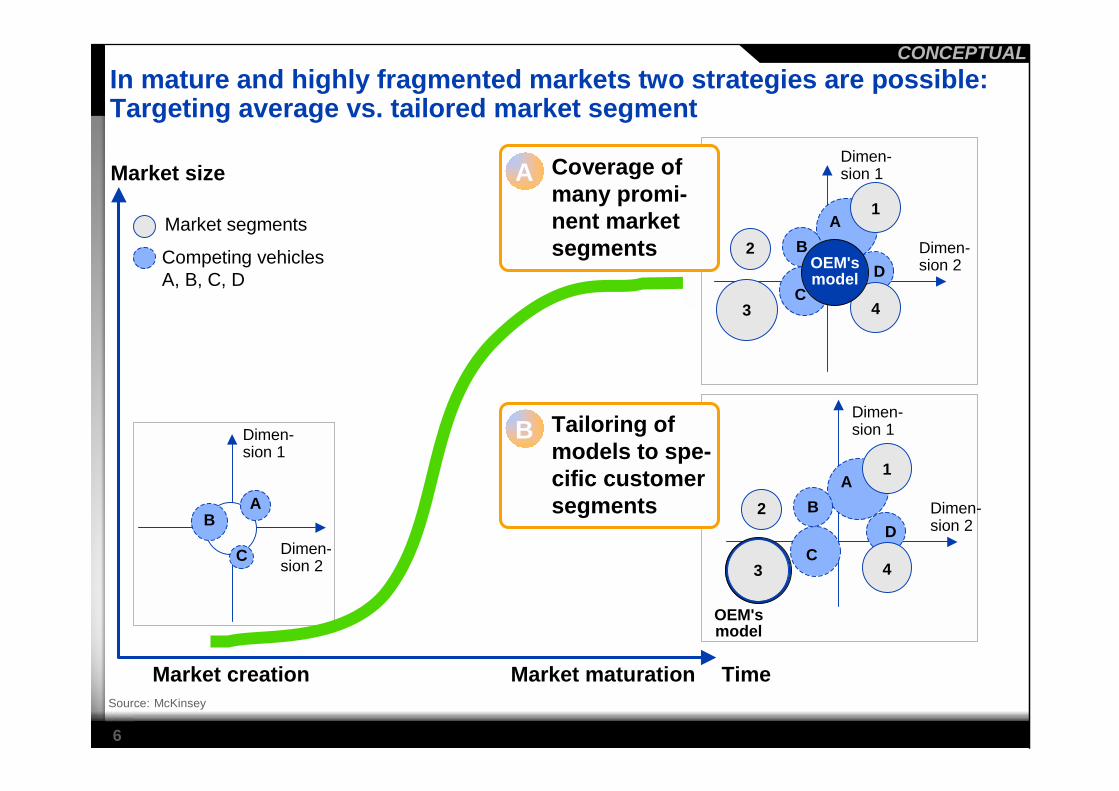
Market size
Time
Dimen-sion 1
Dimen-sion 2
BA
C
Competing vehiclesA, B, C, D
Market segments
Market maturationMarket creation
In mature and highly fragmented markets two strategies are possible: Targeting average vs. tailored market segment
CONCEPTUAL
Source: McKinsey
Dimen-sion 1
Dimen-sion 2D
A
C
B
1
43
2OEM'smodel
Dimen-sion 1
Dimen-sion 2D
A
C
B
1
43
2
OEM'smodel
Tailoring ofmodels to spe-cific customersegments
B
Coverage of many promi-nent market segments
A

7
To understand what customers really want is key
Source: Automotive branding survey, May 2001
Stated ImportanceOut of 10
Der
ived
Impo
rtan
ce
Sporty
Negotiationsstraightforward
Agile
Valuecustomer
Elegant
Modern
Attractiveexternally
Support is good value
ComfortableSuperior speeds
Innovative
Showroom experience positive
For people in the know
ExclusiveStands out
A leaderI feel attractive
Proud to show this offMost highly regarded
Exciting
I look successful
Won't let you down
Efficient fuel usageSufficient space
Running costs reasonable
Acceptableresale
Information easy
Around in 20 years
Environmentally friendly
An escape
YouthfulManly
Understated
Won't break downCost is good value
Delivers what it promises
Safe to drive
For people like me
0.00
0.10
0.20
0.30
0.40
0.50
0.60
5 5.5 6 6.5 7 7.5 8 8.5 9 9.5 10
Attractive internally
Fun to drive
Customer want and state it Customer want but don't state it Customer state though really don't want it
Derived importance dominated by emotional attributes
Stated importance dominated by rational attributes
8
Key levers to address complexity challenge
Clear and precise customer knowledge and orientation1Efficient product architecture – from identity to similarity2Value chain adaptation towards competence based structures3Improved development processes leveraging IT opportunities4Stringent quality processes along entire development process5Project organization combining high functional and integration capabilities6
Source: McKinsey
9
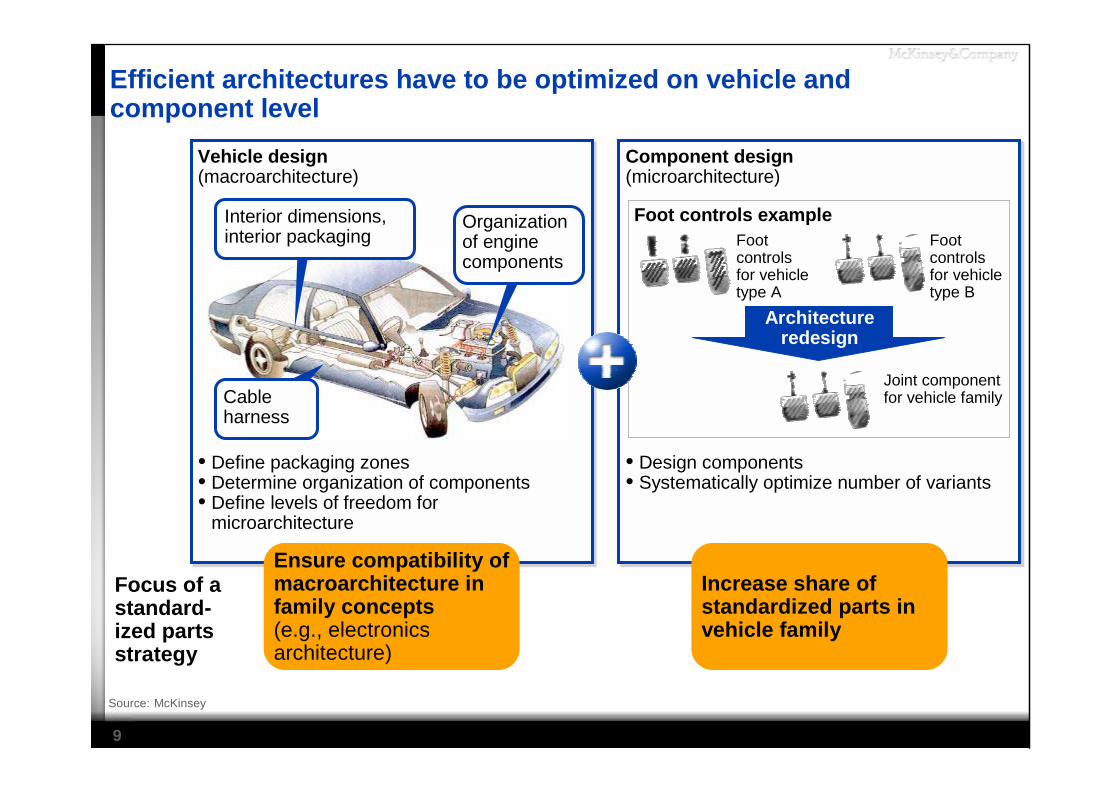
Efficient architectures have to be optimized on vehicle and component level
Focus of a standard-ized parts strategy
Vehicle design(macroarchitecture)
• Define packaging zones• Determine organization of components• Define levels of freedom for
microarchitecture
Ensure compatibility of macroarchitecture in family concepts (e.g., electronics architecture)
Component design (microarchitecture)
• Design components• Systematically optimize number of variants
Increase share of standardized parts in vehicle family
Organization of engine components
Cable harness
Interior dimensions, interior packaging
Foot controls exampleFoot controls for vehicle type A
Architecture redesign
Foot controls for vehicle type B
Joint component for vehicle family
Source: McKinsey

10
Product architecture Parts/module architecture
Identical parts/modules
• 100% identical parts
• Same variants across vehicle types
• Building block modules
Identity100%
0%
Adapted parts/modules
Principle or concept parts/modules
Solitary parts/modules
• Existing parts/ modules with adjustments
• Related functions or geometries ("pantograph")
• Parts/modules specific to vehicle types
Source: McKinsey
Foot controls example
Foot controls for vehicle type A
Foot controls for vehicle type B
Existing product architectures are redesigned with highest share of identical parts possible while maintaining sufficient differentiation
Function separation
Function integration
Function elimination
Variant combination
Restructuring
Combination reduction
11
Technology leaps
P
400,000 800,000
Fixed-cost dilution
P
400,000 800,000
Complexitycost reduction
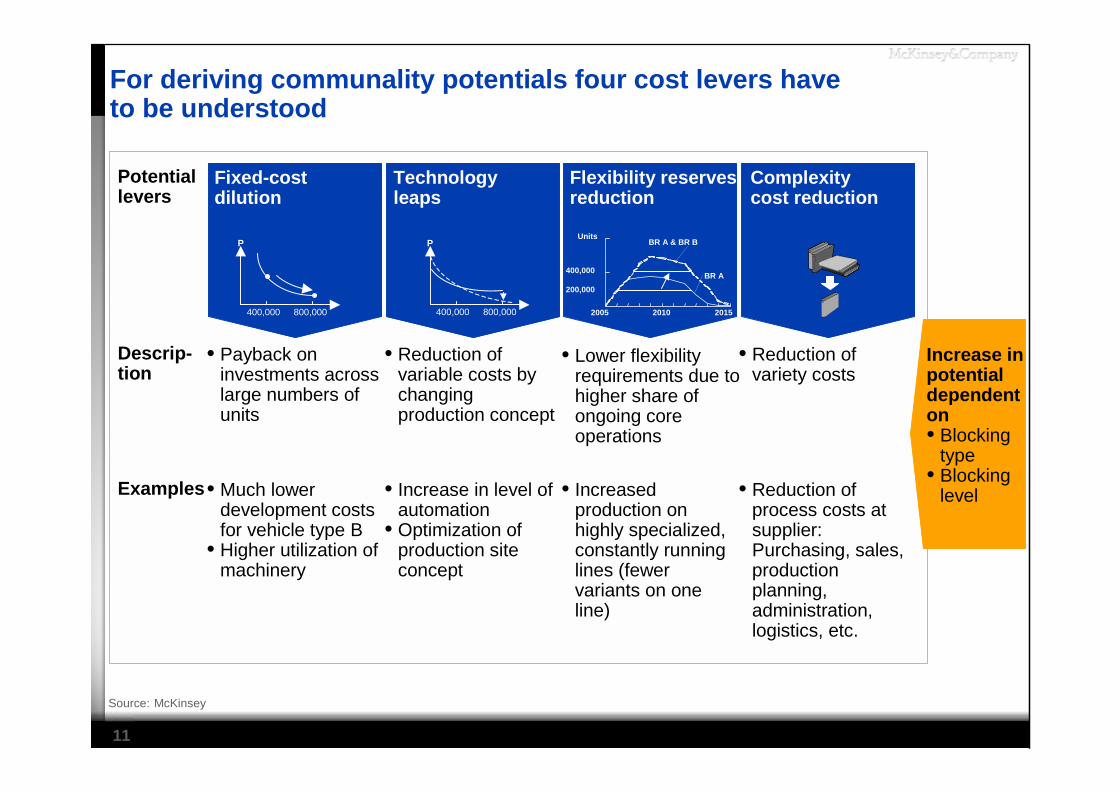
Potential levers
Descrip-tion
Examples
• Payback on investments across large numbers of units
• Reduction of variable costs by changing production concept
• Lower flexibility requirements due to higher share of ongoing core operations
• Reduction of variety costs
• Much lower development costs for vehicle type B
• Higher utilization of machinery
• Increase in level of automation
• Optimization of production site concept
• Increased production on highly specialized, constantly running lines (fewer variants on one line)
• Reduction of process costs at supplier: Purchasing, sales, production planning, administration, logistics, etc.
Flexibility reserves reduction
Units
200,000
400,000
2005 2010 2015
BR A & BR B
BR A
Increase in potential dependent on • Blocking
type• Blocking
level
Source: McKinsey
For deriving communality potentials four cost levers have to be understood
12
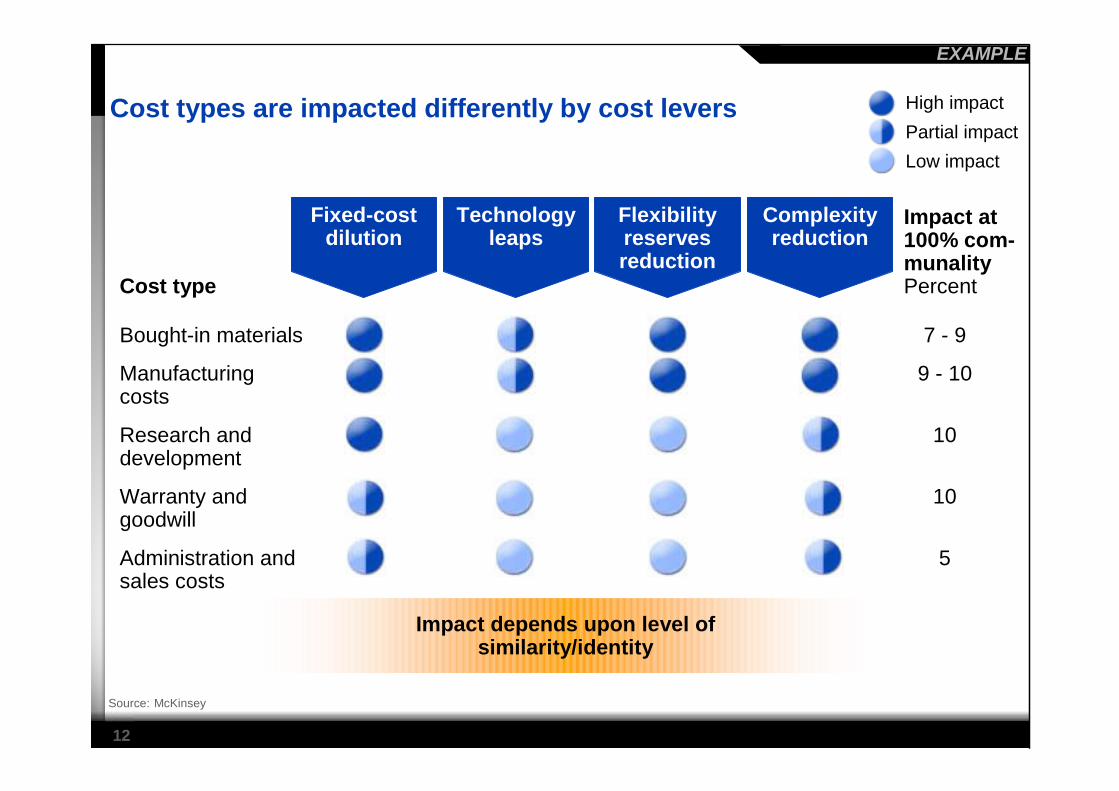
Fixed-costdilution
Technologyleaps
Flexibilityreserves reduction
Complexityreduction
Bought-in materials
Manufacturing costs
Research and development
Warranty and goodwill
Administration and sales costs
High impactPartial impactLow impact
Impact at 100% com-munalityPercent
7 - 9
9 - 10
10
10
5
Cost type
EXAMPLE
Source: McKinsey
Cost types are impacted differently by cost levers
Impact depends upon level of similarity/identity

13
Key levers to address complexity challenge
Source: McKinsey
Clear and precise customer knowledge and orientation1Efficient product architecture – from identity to similarity2Value chain adaptation towards competence based structures3Improved development processes leveraging IT opportunities4Stringent quality processes along entire development process5Project organization combining high functional and integration capabilities6
Source: McKinsey
14
0
5,000
10,000
15,000
1993 1994 1995 1996 1997 1998 1999 2000 2001
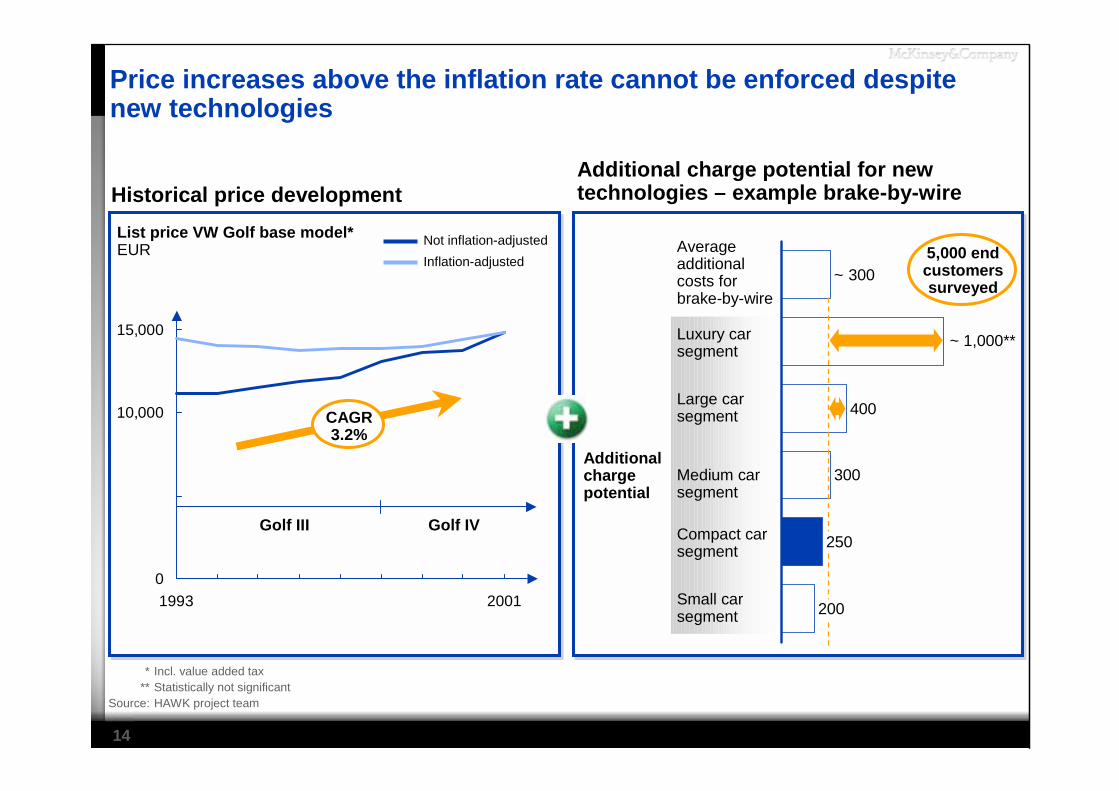
Price increases above the inflation rate cannot be enforced despite new technologies
Historical price development
* Incl. value added tax ** Statistically not significant
Source: HAWK project team
List price VW Golf base model*EUR Not inflation-adjusted
Inflation-adjusted
Golf III Golf IV
Additional charge potential for new technologies – example brake-by-wire
Average additional costs for brake-by-wire
Small car segment
Compact car segment
Medium car segment
Luxury car segment
Large carsegment
Additional charge potential
400
300
200
250
~ 3005,000 end customers surveyed
CAGR 3.2%
~ 1,000**
15
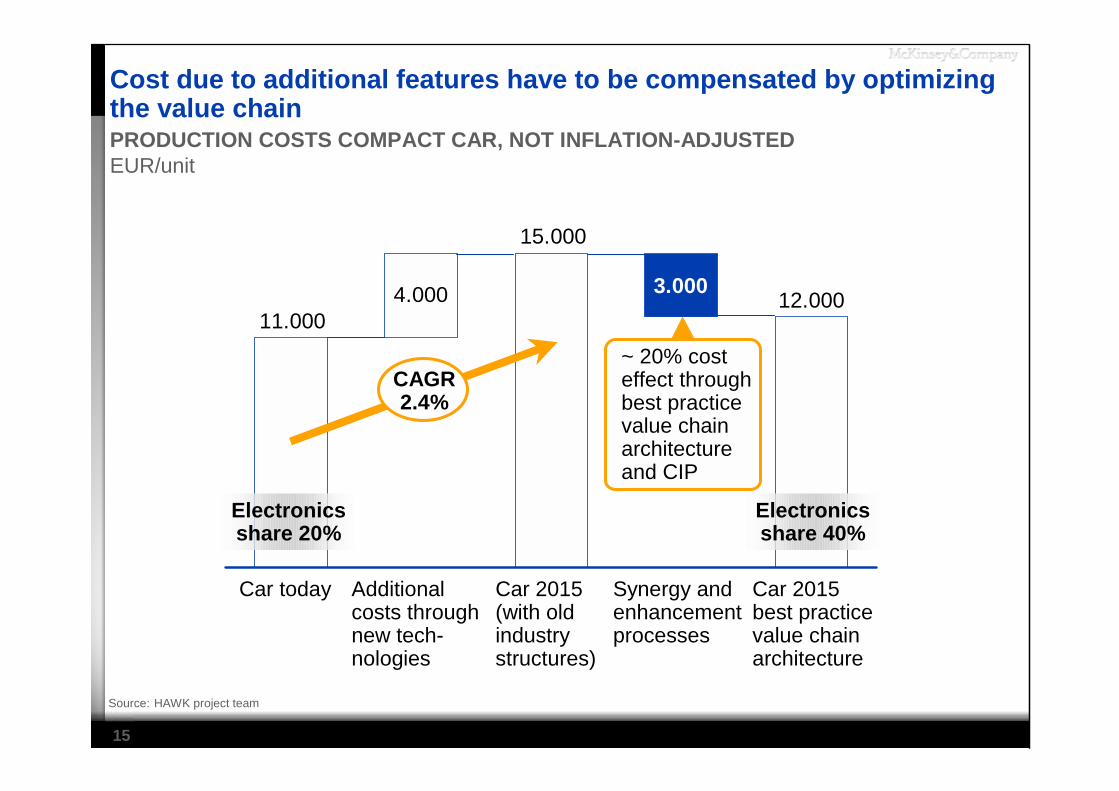
4.000 3.00011.000
15.000
12.000
Cost due to additional features have to be compensated by optimizing the value chain
Source: HAWK project team
Additional costs through new tech-nologies
Car 2015 (with old industry structures)
Synergy and enhancement processes
Car 2015 best practice value chain architecture
PRODUCTION COSTS COMPACT CAR, NOT INFLATION-ADJUSTEDEUR/unit
Car today
Electronics share 20%
Electronics share 40%
~ 20% cost effect through best practice value chain architecture and CIP
CAGR2.4%
16
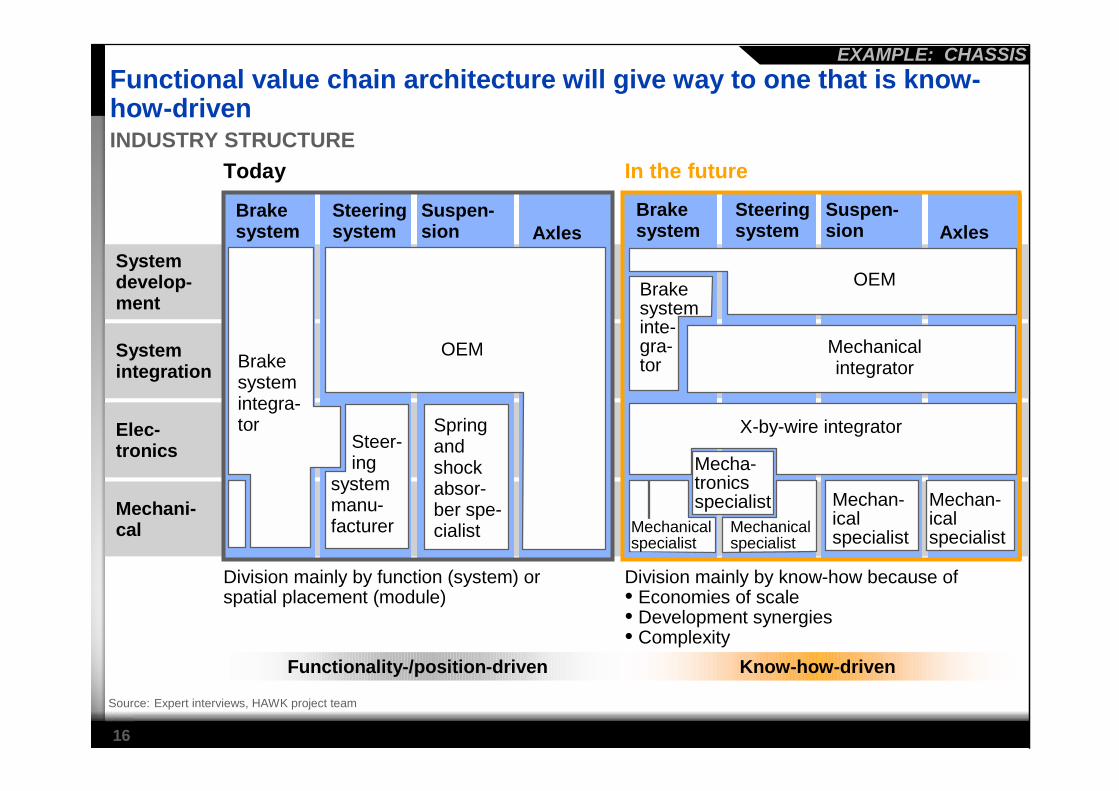
INDUSTRY STRUCTURE
Functional value chain architecture will give way to one that is know-how-driven
Source: Expert interviews, HAWK project team
In the futureToday
System integration
Elec-tronics
Mechani-cal
Division mainly by know-how because of• Economies of scale• Development synergies• Complexity
Brake system
Steering system
Suspen-sion Axles
Division mainly by function (system) or spatial placement (module)
Brake system
Steering system
Suspen-sion Axles
EXAMPLE: CHASSIS
Functionality-/position-driven Know-how-driven
Mechan-ical specialist
Mechan-ical specialist
Lenk-system-integra-tor
Spring and shock absor-ber spe-cialist
OEM
Steer-ing
system manu-facturer
Brake system integra-tor
System develop-ment
OEM
X-by-wire integrator
Mechanical specialist
Mechanical specialist
Mecha-tronics specialist
Mechanical integrator
Brake system inte-gra-tor
17
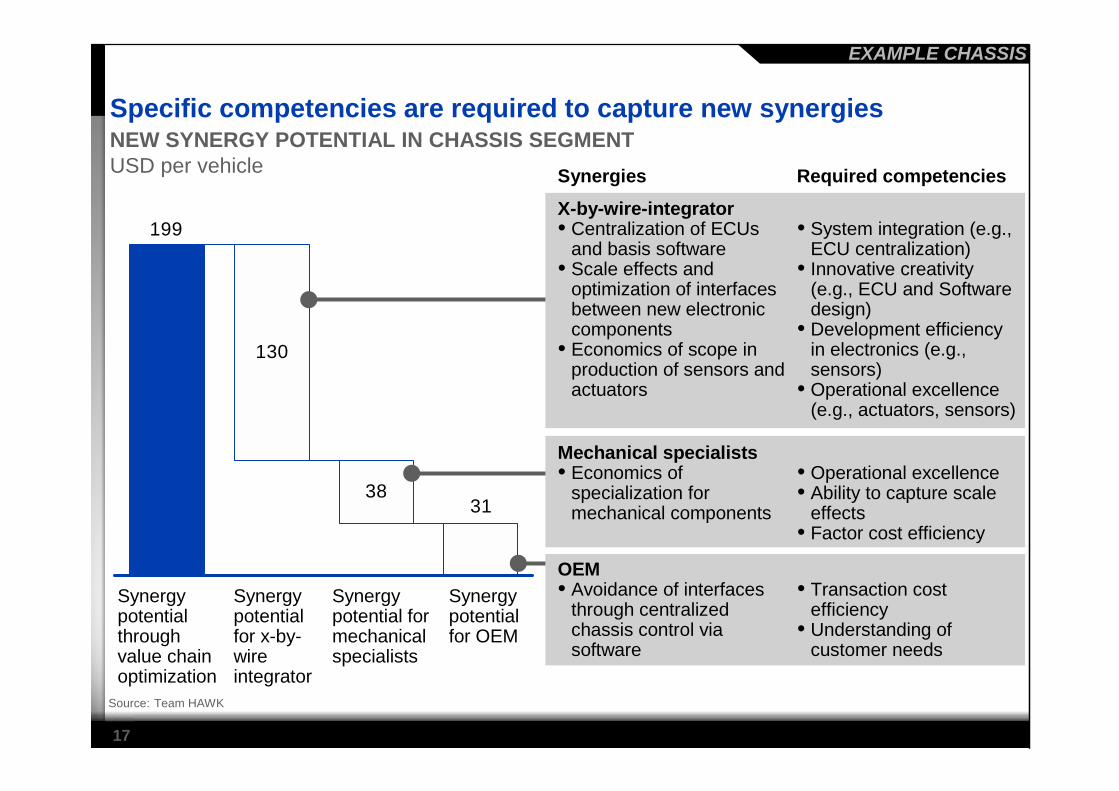
Specific competencies are required to capture new synergies
Source: Team HAWK
NEW SYNERGY POTENTIAL IN CHASSIS SEGMENTUSD per vehicle
130
3831
199
Synergy potential through value chain optimization
Synergy potential for x-by-wire integrator
Synergy potential for mechanical specialists
Synergy potential for OEM
Synergies Required competencies
EXAMPLE CHASSIS
X-by-wire-integrator• Centralization of ECUs
and basis software• Scale effects and
optimization of interfaces between new electronic components
• Economics of scope in production of sensors and actuators
• System integration (e.g., ECU centralization)
• Innovative creativity (e.g., ECU and Software design)
• Development efficiency in electronics (e.g., sensors)
• Operational excellence (e.g., actuators, sensors)
Mechanical specialists• Economics of
specialization for mechanical components
• Operational excellence• Ability to capture scale
effects• Factor cost efficiency
OEM• Avoidance of interfaces
through centralized chassis control via software
• Transaction cost efficiency
• Understanding of customer needs
18
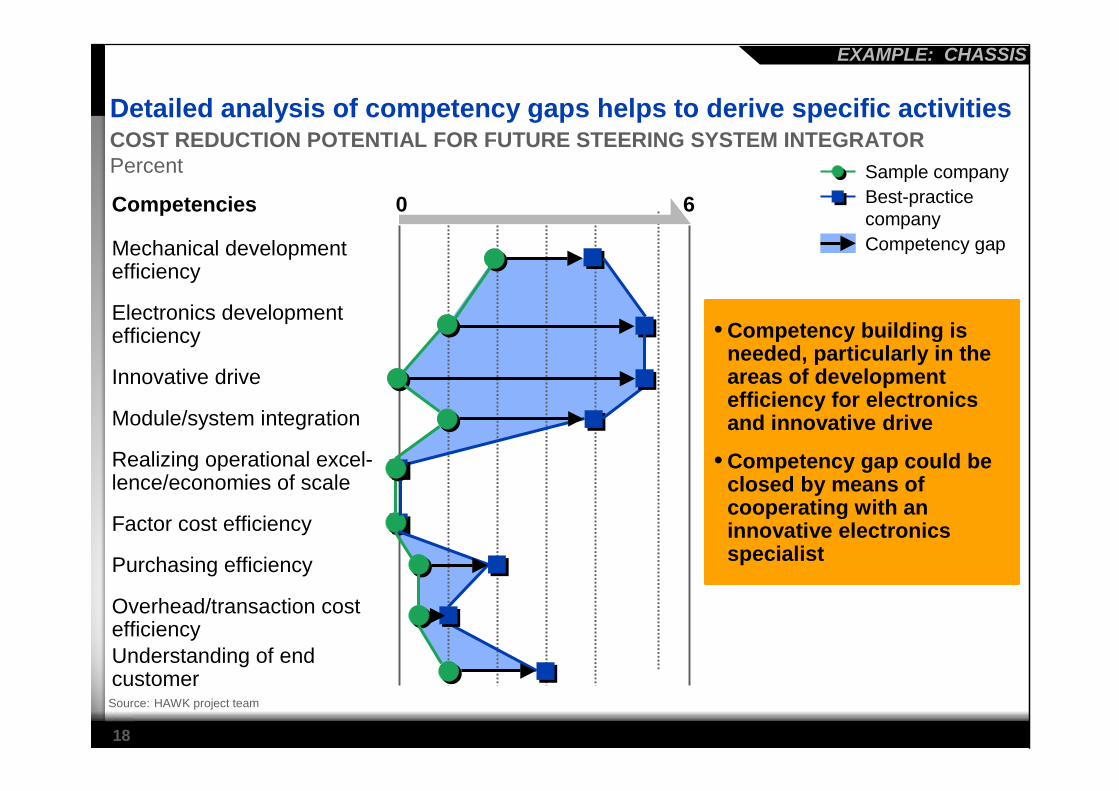
Detailed analysis of competency gaps helps to derive specific activities
• Competency building is needed, particularly in the areas of development efficiency for electronics and innovative drive
• Competency gap could be closed by means of cooperating with an innovative electronics specialist
Source: HAWK project team
Competencies
Mechanical development efficiency
Best-practicecompany
Sample company
Competency gap
0 6
COST REDUCTION POTENTIAL FOR FUTURE STEERING SYSTEM INTEGRATORPercent
Realizing operational excel-lence/economies of scale
Electronics development efficiency
Innovative drive
Module/system integration
Factor cost efficiency
Overhead/transaction cost efficiency
Purchasing efficiency
Understanding of endcustomer
EXAMPLE: CHASSIS
19
Key levers to address complexity challenge
Clear and precise customer knowledge and orientation1Efficient product architecture – from identity to similarity2Value chain adaptation towards competence based structures3Improved development processes leveraging IT opportunities4Stringent quality processes along entire development process5Project organization combining high functional and integration capabilities6
Source: McKinsey

20
-50%
0
20
40
60
80
1985 1990 1995 2000 2005
The 2005 target requires a reduction of development times by 50%
* Concept-freeze to SOPSource: Publications on vehicle development times (70 vehicles worldwide) between 1988 and 2000, McKinsey-Research
60 months(1988)
35 months*(1999)
42 months (1991)
40 months (1994)
Target 30 months or
less
AVERAGE DEVELOPMENT TIMES, PROJECT DECISION TO SOP Month
21
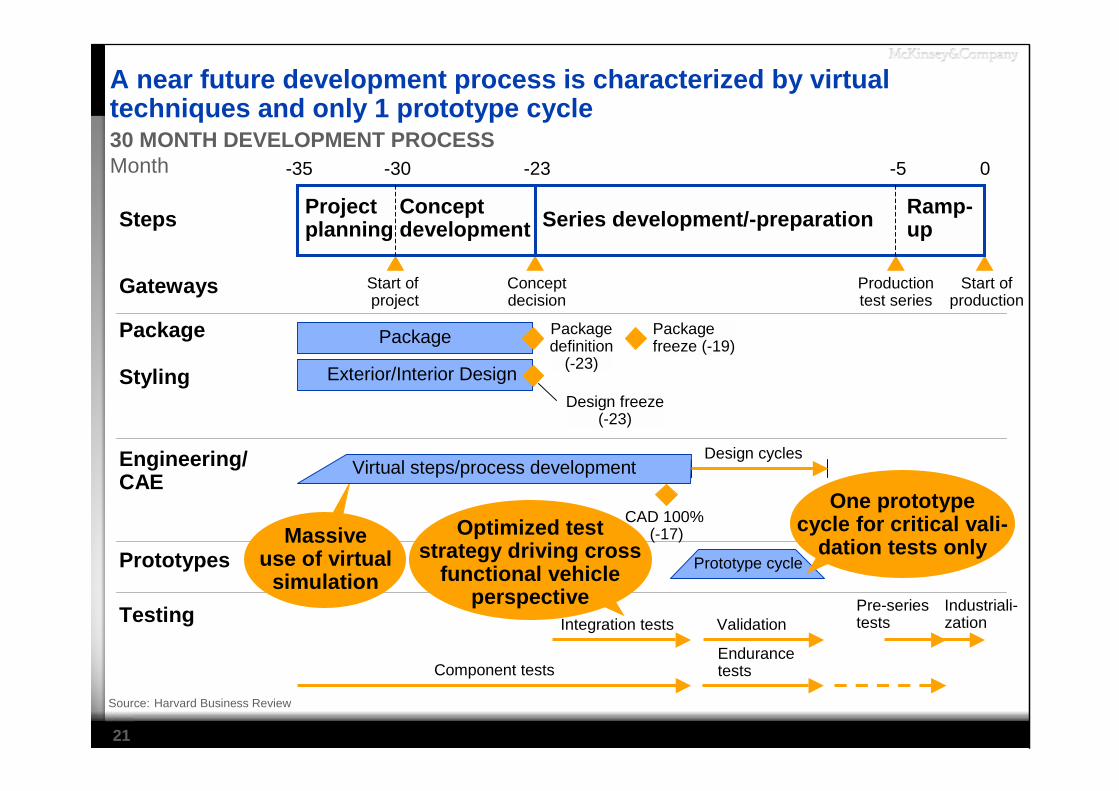
A near future development process is characterized by virtual techniques and only 1 prototype cycle30 MONTH DEVELOPMENT PROCESSMonth
Steps
Gateways
Package
Styling
-35 -30 -23 0
Start of project
Conceptdecision
Start ofproduction
Package
Engineering/CAE
Prototypes
Testing
Productiontest series
Exterior/Interior Design
Design cycles
CAD 100% (-17)
Prototype cycle
Component tests
Integration tests
Endurancetests
ValidationIndustriali-zation
Conceptdevelopment Series development/-preparationProject
planning
Design freeze(-23)
Massiveuse of virtual
simulation
Packagedefinition
(-23)
-5
Packagefreeze (-19)
Virtual steps/process development
Ramp-up
Pre-seriestests
Source: Harvard Business Review
Optimized test strategy driving cross
functional vehicle perspective
One prototype cycle for critical vali-
dation tests only
22
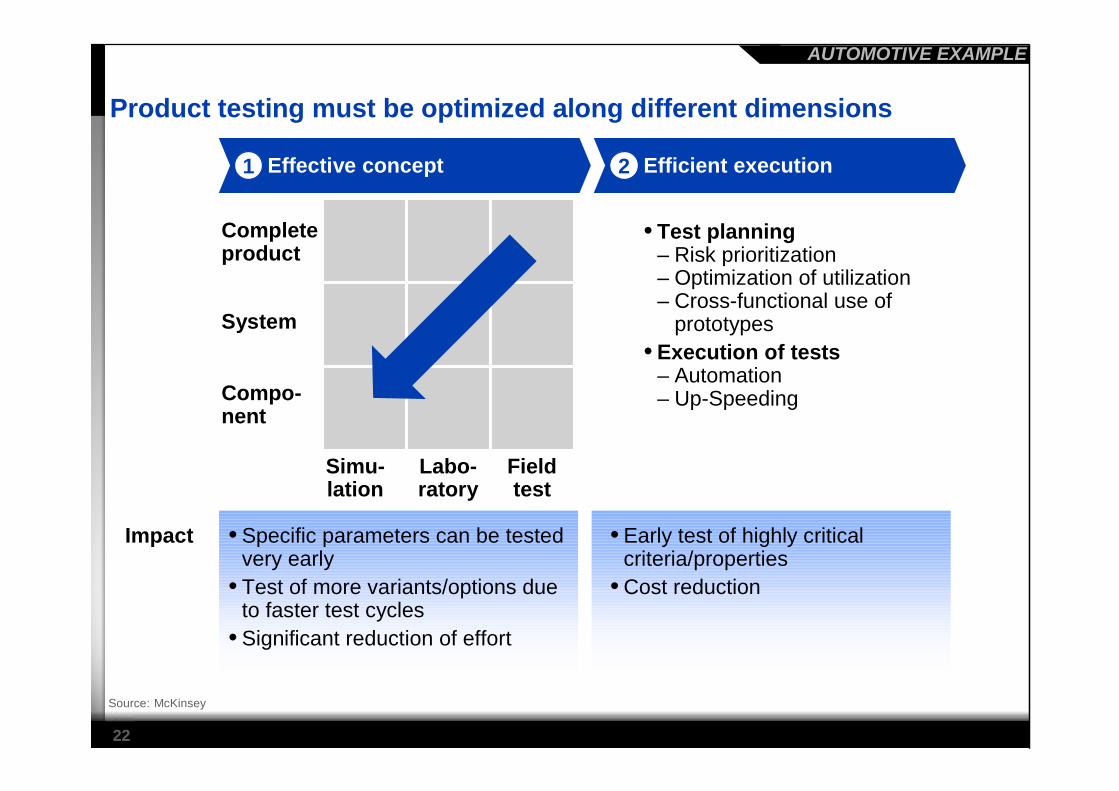
Product testing must be optimized along different dimensions
Effective concept Efficient execution
Impact • Specific parameters can be tested very early
• Test of more variants/options due to faster test cycles
• Significant reduction of effort
• Early test of highly critical criteria/properties
• Cost reduction
• Test planning– Risk prioritization– Optimization of utilization– Cross-functional use of
prototypes• Execution of tests
– Automation– Up-Speeding
Complete product
System
Compo-nent
Simu-lation
Labo-ratory
Field test
1 2
Source: McKinsey
AUTOMOTIVE EXAMPLE

23
Key levers to address complexity challenge
Clear and precise customer knowledge and orientation1Efficient product architecture – from identity to similarity2Value chain adaptation towards competence based structures3Improved development processes leveraging IT opportunities4Stringent quality processes along entire development process5Project organization combining high functional and integration capabilities6
Source: McKinsey
24
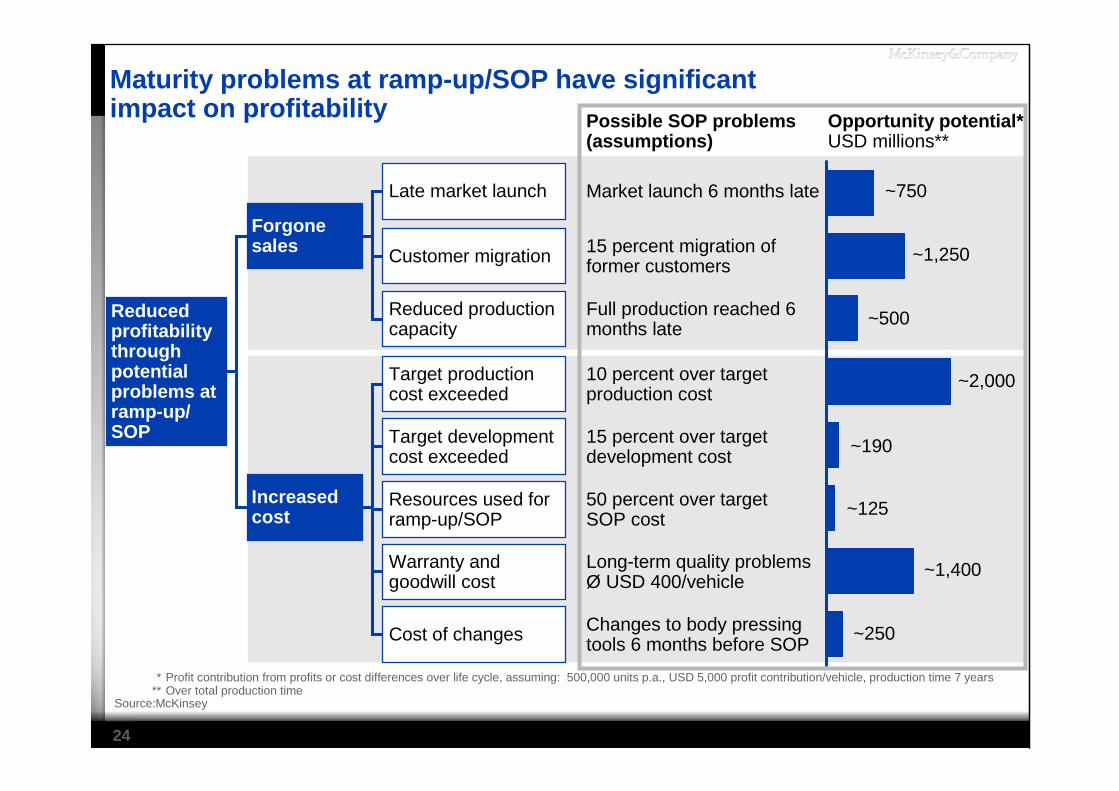
Reduced profitability through potential problems at ramp-up/ SOP
Forgone sales
Increased cost
Possible SOP problems (assumptions)
Opportunity potential*USD millions**
Late market launch
Reduced production capacity
Target production cost exceeded
Resources used for ramp-up/SOP
Warranty and goodwill cost
Cost of changes
Target development cost exceeded
Market launch 6 months late
Customer migration 15 percent migration of former customers
Full production reached 6 months late
10 percent over target production cost
15 percent over target development cost
50 percent over target SOP cost
Long-term quality problems Ø USD 400/vehicle
Changes to body pressing tools 6 months before SOP
Maturity problems at ramp-up/SOP have significant impact on profitability
* Profit contribution from profits or cost differences over life cycle, assuming: 500,000 units p.a., USD 5,000 profit contribution/vehicle, production time 7 years ** Over total production time
Source:McKinsey
~750
~1,250
~500
~2,000
~190
~125
~1,400
~250

25
Share of electronics and software problems
10.611.312.713.2
15.317.718.419.219.9
41.942.4
66.452.8
SaabAlfaDaewooFiat
MazdaSubaruHondaToyota
BMWNissanVWPorscheAudi
53%48%49%55%
44%53%
48%46%46%
45%48%
55%44%
Failures per 1000 vehicles thereof caused by electronics and SW
SW problemsare reasons for recallof more than 700.000
vehicles in 2002
Software maturity is becoming a critical factor in automotive product development Software-related
Source: McKinsey, Business Week, ADAC-AutoMarxX (3-5 year old car failures 1998-2001), cars in Germany only
Source of quality problems
Malfunction in Percent
Infotainment and body electronicsInjection/ignition system
Engine (w/o injection)
Radiator/cooling
Wheels/tires
Fuel systems
Other
Gears/transmission
54
667
812
20
32
Chassis
26
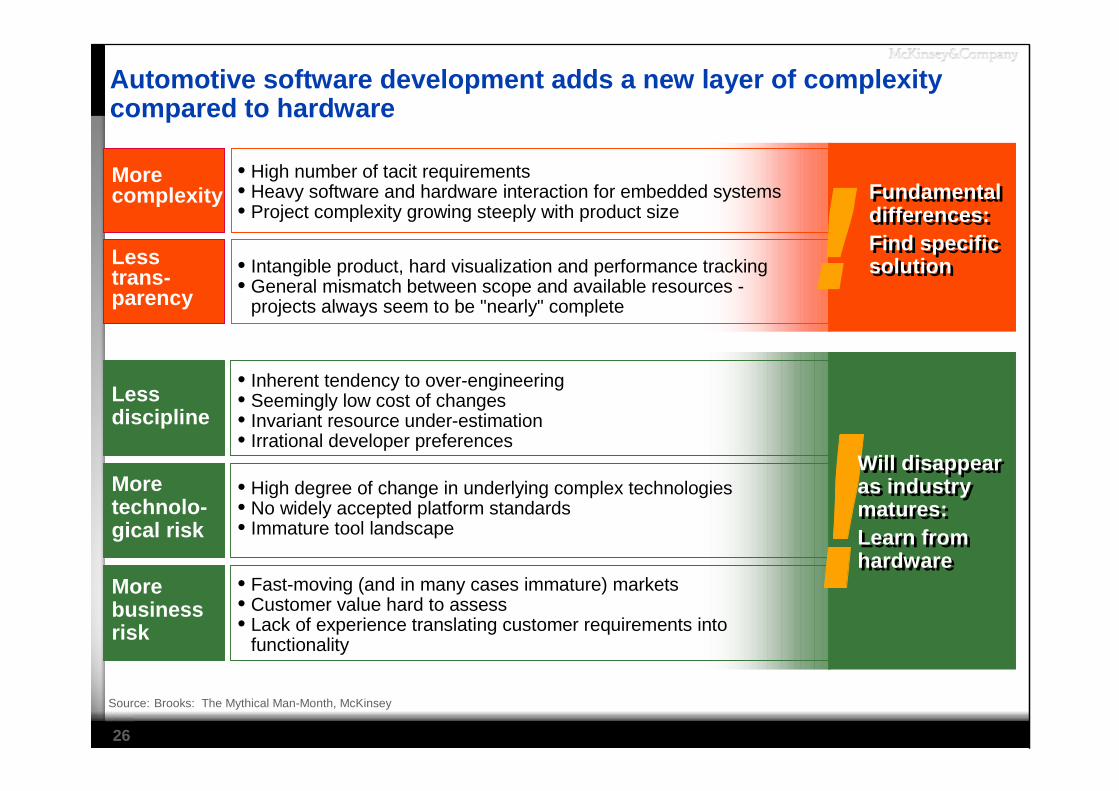
Automotive software development adds a new layer of complexity compared to hardware
Source: Brooks: The Mythical Man-Month, McKinsey
• High number of tacit requirements• Heavy software and hardware interaction for embedded systems• Project complexity growing steeply with product size
• Intangible product, hard visualization and performance tracking• General mismatch between scope and available resources -
projects always seem to be "nearly" complete
Morecomplexity
Less trans-parency
Fundamental differences:Find specific solution
Fundamental differences:Find specific solution
• High degree of change in underlying complex technologies• No widely accepted platform standards• Immature tool landscape
• Fast-moving (and in many cases immature) markets• Customer value hard to assess• Lack of experience translating customer requirements into
functionality
• Inherent tendency to over-engineering• Seemingly low cost of changes• Invariant resource under-estimation • Irrational developer preferences
Less discipline
More technolo-gical risk
More business risk
Will disappear as industry matures:Learn from hardware
Will disappear as industry matures:Learn from hardware

27
Source: McKinsey
Developmentorganization
Productarchitecture
Process efficiency
Operational improvement can be achieved in a three step approach
• Restructuring of development organization for specific needs of SW projects is necessary
• Building of specific skills in SW development and SW project management is needed
• Modular, feature specific product design is key to reduce complexity and enable concurrent engineering
• Platforming and maximal degree of reuse is neces-sary to overcome complexity challenge and ensure software quality
• Complex software projects are only feasible with standardized, repeatable processes
• Development effort depends heavily on process maturity - efficiency potentials of up to 90% are possible
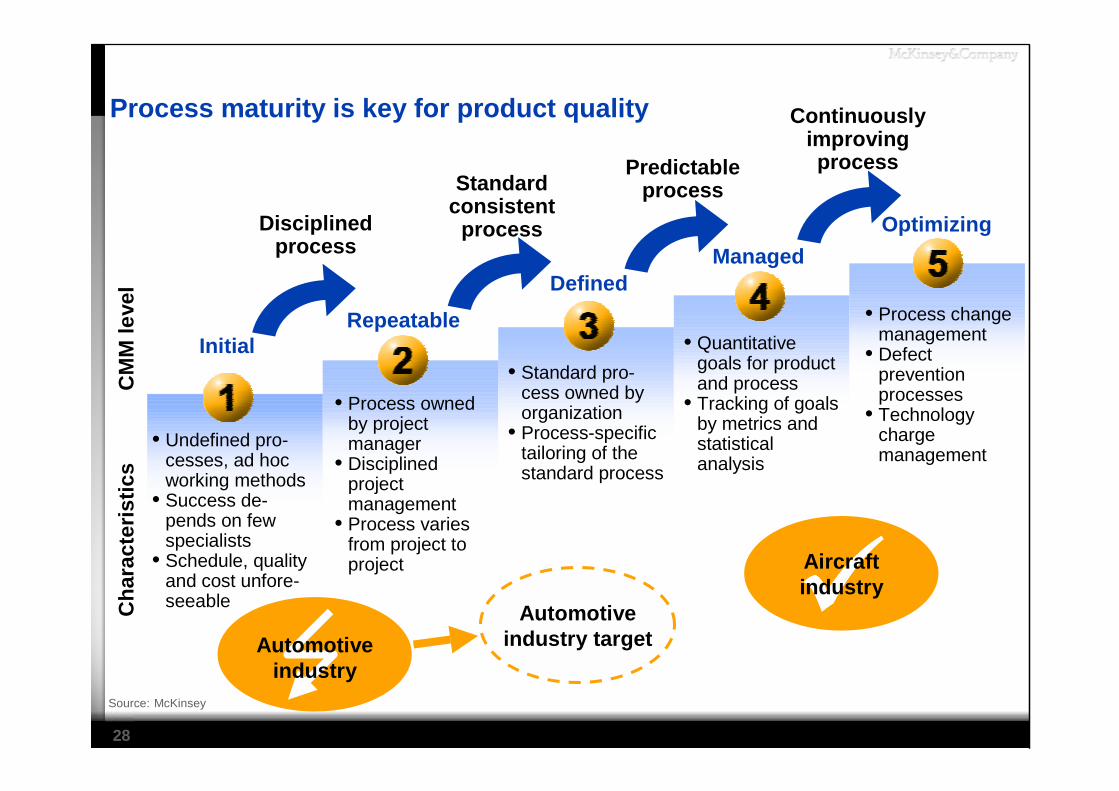
28
Automotive industry
Cha
ract
eris
tics
CM
M le
vel
Source: McKinsey
Disciplined process
Initial
• Undefined pro-cesses, ad hoc working methods
• Success de-pends on few specialists
• Schedule, quality and cost unfore-seeable
Repeatable
• Process owned by project manager
• Disciplined project management
• Process varies from project to project
Defined
• Standard pro-cess owned by organization
• Process-specific tailoring of the standard process
Managed
• Quantitative goals for product and process
• Tracking of goals by metrics and statistical analysis
Optimizing
• Process change management
• Defect prevention processes
• Technology charge management
Standard consistent
process
Predictable process
Continuously improving process
Automotive industry target
!!!!Aircraftindustry
Process maturity is key for product quality

29
Key levers to address complexity challenge
Clear and precise customer knowledge and orientation1Efficient product architecture – from identity to similarity2Value chain adaptation towards competence based structures3Improved development processes leveraging IT opportunities4Stringent quality processes along entire development process5Project organization combining high functional and integration capabilities6
Source: McKinsey
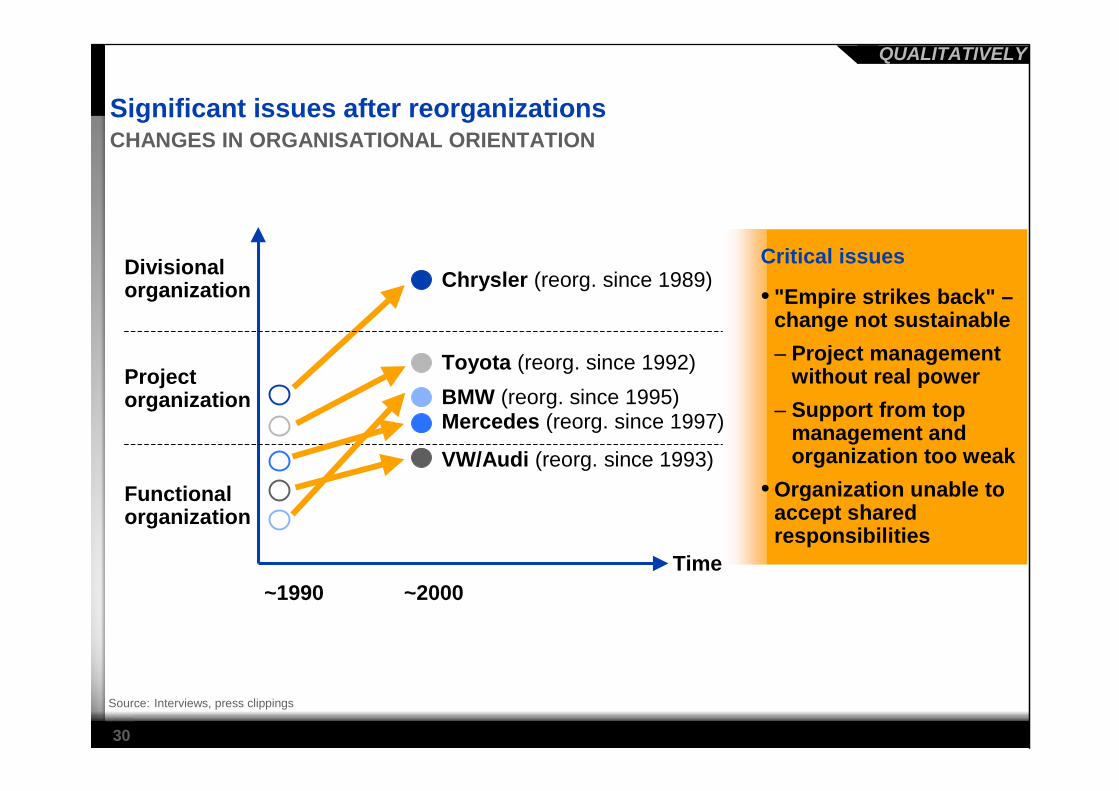
30
Significant issues after reorganizations
Source: Interviews, press clippings
Critical issues
• "Empire strikes back" –change not sustainable– Project management
without real power– Support from top
management and organization too weak
• Organization unable to accept shared responsibilities
Mercedes (reorg. since 1997)
Chrysler (reorg. since 1989)
BMW (reorg. since 1995)Projectorganization
Functional organization
~1990 ~2000
Toyota (reorg. since 1992)
Divisionalorganization
Time
VW/Audi (reorg. since 1993)
QUALITATIVELY
CHANGES IN ORGANISATIONAL ORIENTATION

31
Project organizations must combine high integration and functional development capabilities
Source: McKinsey
Integration capabilities• Development time• Target costs• Known customer
requirements• Platform concepts
Functional capabilities• Commercialized innovations• Quality of vehicle features• Efficiency of function
LowLow High
High Highcompetence
Limited competence
Divisional organization
CONCEPTUAL
Project organization"
Project organization
Functional organization
EVALUATION OF DEVELOPMENT CAPABILITIES
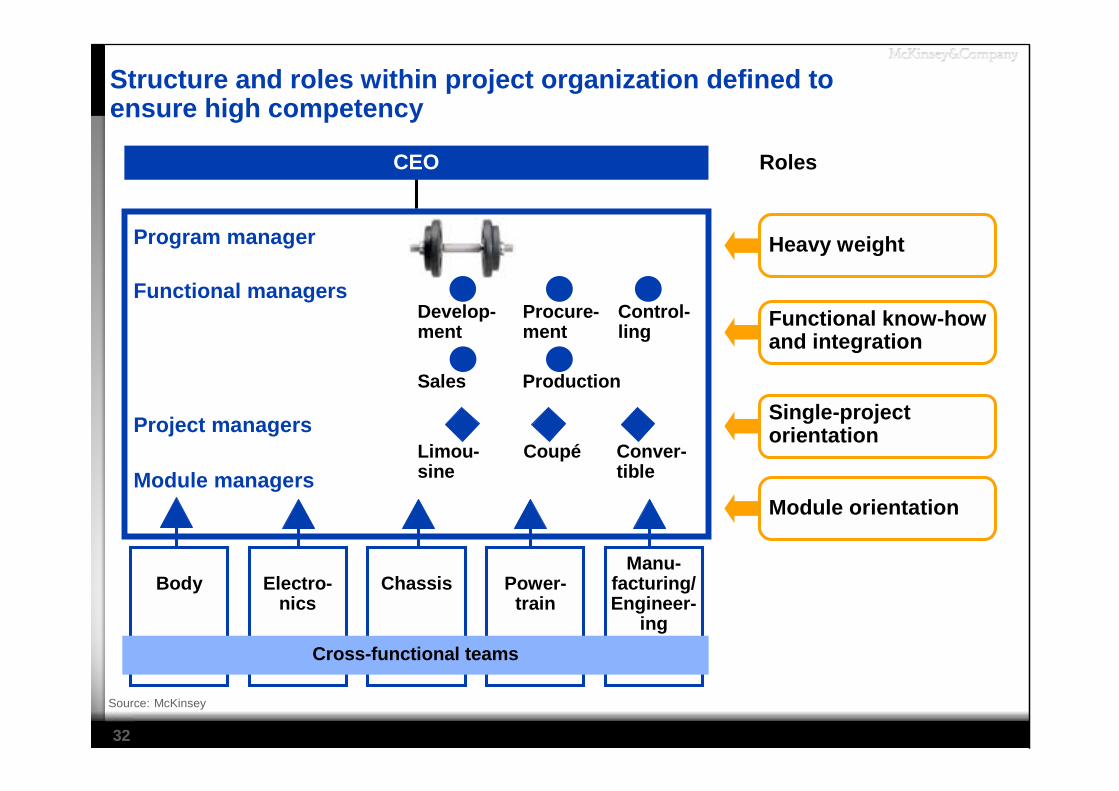
32
CEO Roles
Power-train
Manu-facturing/Engineer-
ing
Body Electro-nics
Chassis
Cross-functional teams
Heavy weightProgram manager
Sales Production
Develop-ment
Procure-ment
Control-ling
Functional managers Functional know-how and integration
Module orientationModule managers
Conver-tible
Limou-sine
Coupé
Single-project orientation Project managers
Source: McKinsey
Structure and roles within project organization defined to ensure high competency

33
Organizational setup of line functions based on individual functionTypes of line organizations
Power-train
Manu-facturing/ enginee-
ring
Body Electro-nics
Chassis
Program management
Cross-functional teams
A B C
Line function segmentation
A B C
Partial segmentation
FunctionalA B C
A, B, C programs
R&D departments*
Other line functions
• Vehicle integration
• Body• Chassis
• Electronics• Powertrain
• Design
• Concept development
• Marketing
• Manufacturing Engineering
• Quality assurance
• Purchasing*
• Controlling
CEO
* Best organized along modulesSource: McKinsey
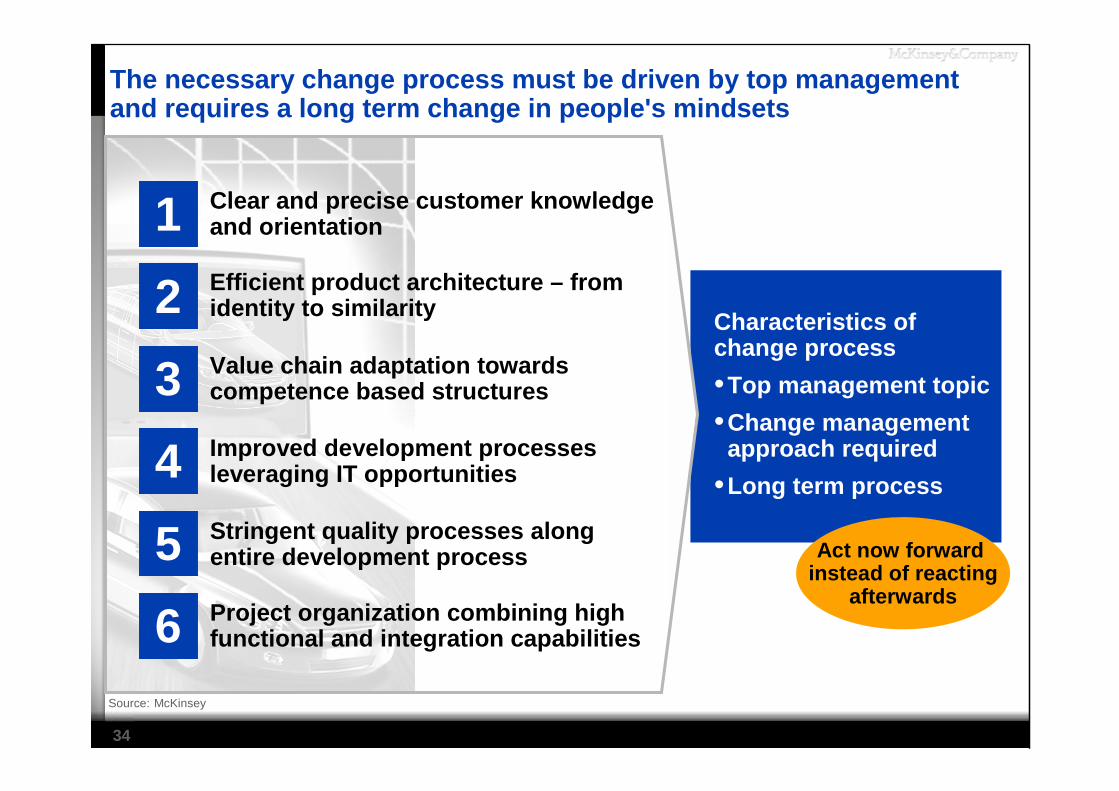
34
Characteristics of change process•Top management topic•Change management
approach required•Long term process
Act now forward instead of reacting
afterwards
Clear and precise customer knowledge and orientation1Efficient product architecture – from identity to similarity2Value chain adaptation towards competence based structures3Improved development processes leveraging IT opportunities4Stringent quality processes along entire development process5Project organization combining high functional and integration capabilities6
The necessary change process must be driven by top management and requires a long term change in people's mindsets
Source: McKinsey


![Holz-Massivbauweise in Brettsperr- holz Allgemeines zur ... · 1/2/1995 · holz kann dem BSPhandbuch [11] entnommen werden. Im Folgenden wird nun näher auf das darin angeführte](https://img.pdfslide.us/doc/110x75/60c3796134ffe22c0422e2df/holz-massivbauweise-in-brettsperr-holz-allgemeines-zur-121995-holz-kann.jpg)