Embed Size (px)
Citation preview
Quarterly Journal of the Royal Meteorological Society Q. J. R. Meteorol. Soc. 138: 596–611, April 2012 A
Tropical transition of a Mediterranean storm by jet crossing
Jean-Pierre Chaboureau,a* Florian Pantillon,a Dominique Lambert,a Evelyne Richarda
and Chantal Claudb
aLaboratoire d’Aerologie, Universite de Toulouse and CNRS, Toulouse, FrancebLaboratoire de Meteorologie Dynamique, Ecole Polytechnique, Palaiseau, France
*Correspondence to: J.-P. Chaboureau, Laboratoire d’Aerologie, Observatoire Midi-Pyrenees, 14 av. Belin, F-31400Toulouse, France. E-mail: [email protected]
The tropical transition of a Mediterranean storm that occurred on 26 September 2006over southeastern Italy is investigated. The explosive development classified thiscyclone as a bomb and its full-tropospheric warm core as a tropical-like storm ormedicane. Forecasts at different scales were analysed to identify the key mechanismsin the explosive development of the medicane. At 108 h lead time, the EuropeanCentre for Medium-Range Weather Forecasts (ECMWF) failed to predict themedicane and the associated upper-level trough downstream of the ex-tropicalcyclone Helene during its extratropical transition. At shorter range, forecasts byboth ECMWF and Action de Recherche Petite Echelle Grande Echelle (ARPEGE)increasingly improved with decreasing lead times. The depth of the medicane wasmissed, however, probably because of the too low resolution with respect to the60 km diameter cyclone. Forecasts at kilometre scale were run using the mesoscalemodel Meso-NH and verified against in situ and satellite observations. The Meso-NH forecasts were found to be very sensitive to the initial conditions. Reduced staticstability at the southern tip of the upper-level trough determined the convectiveactivity around the pre-existing mesocyclone. The medicane was then formed onlyif enough vertically developed convection was further enhanced by the jet-inducedupward forcing. Otherwise, no tropical transition of the mesocyclone was predicted.This study shows the role of an upper-level jet in explosively deepening a mesocycloneinto a tropical storm. Copyright c© 2011 Royal Meteorological Society
Key Words: tropical transition; Mediterranean storm; jet crossing; mesoscale modelling
Received 16 June 2011; Revised 29 September 2011; Accepted 30 September 2011; Published online in WileyOnline Library 10 November 2011
Citation: Chaboureau J-P, Pantillon F, Lambert D, Richard E, Claud C. 2012. Tropical transition of aMediterranean storm by jet crossing. Q. J. R. Meteorol. Soc. 138: 596–611. DOI:10.1002/qj.960
1. Introduction
The Mediterranean basin is a region known for its frequentcyclonic activity. Its geographical location between theSubtropics and the midlatitudes, the complex orographysurrounding the Mediterranean Sea, and the large reservoirof sometimes warm water contribute to the formationof a broad continuum of cyclones, from shallow, warm-core to deep, cold-core storms (Campins et al., 2006).Satellite observations show a majority of cloud systemsat the mesoscale, only a fraction being associated with
an upper-level anomaly and preferentially during thecold season (Chaboureau and Claud, 2006), while deepconvection has been sensed over the sea mostly duringautumn (Funatsu et al., 2009). Among the Mediterraneancyclones accompanied by upper-level anomalies and deepconvection, about 15 mesocyclones have been observed overthe last 20 years, preferentially in autumn (Fita et al., 2007).They share some similarities with tropical cyclones and anumber of case studies have been made on these hurricane-like cyclones or medicanes (Mediterranean ‘hurricanes’;Lagouvardos et al., 1999; Pytharoulis et al., 2000; Reale and
Copyright c© 2011 Royal Meteorological Society
Tropical Transition of a Mediterranean Storm by Jet Crossing 597
Atlas, 2001; Homar et al., 2003; Fita et al., 2007; Moscatelloet al., 2008a, 2008b; Davolio et al., 2009; Claud et al., 2010;McTaggart-Cowan et al., 2010; among others). A medicaneexhibits a clearly defined eye, quasi-circular cloud patterns,strong surface winds sometimes reaching the intensity of atropical storm, deep convection and the presence of a warmcore. The lifetime of a medicane mostly varies between 6and 8 h for the mature stage with the presence of an eye, andlasts up to 5 days if all the cyclonic activity is considered.Medicanes usually dissipate when they make landfall.
During the initiation phase, the medicane is born froma pre-existing vortex either caused by the lee effect of thesurrounding mountains (e.g. Homar et al., 2003; Moscatelloet al., 2008b) or formed at the edge of a wider cyclone(e.g. Lagouvardos et al., 1999; Pytharoulis et al., 2000). Thevortex is accompanied by deep convection and a deep, cut-off, cold core is usually observed at mid–upper troposphericlevels (e.g. Reale and Atlas, 2001; Fita et al., 2007), whichtriggers the convective instability (e.g. Reale and Atlas,2001; Homar et al., 2003; Pytharoulis et al., 2000). Duringthe mature phase, the coupled interaction between deepconvection and sea surface fluxes is seen as the centralmechanism in the maintenance of the medicane. Theimportance of air–sea interaction has been evidenced ina number of sensitivity experiments in which the surfacefluxes and convection were switched off (Pytharoulis et al.,2000; Homar et al., 2003; Moscatello et al., 2008a; Davolioet al., 2009). However, experiments with an axisymmetricmodel run for the observed environment of seven medicaneswithout any baroclinicity showed longer life cycles than wereactually observed for the medicanes (Fita et al., 2007). Thisresult suggests that deep convection cannot, alone, explainthe growth of real medicanes and points out the importanceof the baroclinic environment in which medicanes oftenform.
A key element in the intensification of the medicane isthe transformation of the extratropical disturbance intoa tropical-like storm. This transformation is named atropical transition (Davis and Bosart, 2004) (by contrast withextratropical transition; Jones et al., 2003), and results in anextratropical disturbance giving a tropical cyclone. Mostlystudied over the Atlantic basin, extratropical disturbancesthat transform into tropical cyclones are characterized byan environment that is initially sheared. Convection is seenas the main agent of the tropical transition. It reduces theshear with the upper-tropospheric outflow and leads todiabatic redistribution of potential vorticity (PV). The wayconvection becomes organized in such systems is a part ofthe large continuum of tropical transitions that remains tobe explored. This study will describe jet crossing as a newmechanism for the transformation of a shallow, warm coreinto a medicane.
Jet crossing refers to the passage of a low-level anomalyfrom one side of an upper-level jet to another. Becausethe upper-level forcing generally changes with the sideof the jet, it can impact cyclogenesis enough to produceexplosive development if there is interaction betweendynamical and diabatic processes (Uccellini, 1986). In theclassic four-quadrant conceptual model for a straight jetstreak, ageostrophic circulations are created in response togeostrophic balance of the upper-level jet. In particular, theyare accompanied by ascending motions in the right-entranceand left-exit regions of the jet streak. The conceptual modelapplied to the straight jet is, however, modified because
of flow curvature, thermal advection and the position ofthe jet streak within the synoptic-scale flow pattern (Pyleet al., 2004). These localized effects, in causing upper-leveljet kinematic signatures to depart from the classic four-quadrant conceptual model, can be diagnosed using theomega equation. Such a diagnostic was employed here toshow the role of the upper-level forcing in the explosivedevelopment of the medicane during its transition from theanticyclonic to the cyclonic shear side of the jet.
The medicane that we considered affected southeas-tern Italy on 26 September 2006. A mean-sea-level-pressure(MSLP) minimum of 986 hPa and wind gusts exceeding40 m s−1 (78 kt) were recorded (Moscatello et al., 2008b), themost intense values ever registered for a medicane. It was alsothe medicane that experienced the most rapid development.Although the low formed as early as 24 September, we fo-cus on the intensification phase over the Ionian Sea, whenthe cyclone took on the characteristics of a tropical-like cyclone on the morning of 26 September. Based onnumerical experiments, Moscatello et al.(2008a) and Davo-lio et al.(2009) attributed the rapid deepening of the cycloneto its interaction with convection enhanced by the orogra-phy of Calabria (a small lee cyclogenesis was noted to occureast of Calabria in this phase; Moscatello et al.,2008a; Davo-lio et al., 2009). Although they noted that an upper-levelPV anomaly moved close to the vicinity of the mesocycloneduring this phase, they did not explore its role further. Inthe following, we will examine the relationship between themedicane and the upper-level PV anomaly.
In this study, a number of forecasts of global andlimited-area models are compared to better understandthe interaction between the growing surface cyclone andthe upper-level trough. The forecasts from the EuropeanCentre for Medium-Range Weather Forecasts (ECMWF)global model are first examined over a domain covering theNorth Atlantic and the western Mediterranean basin. Thissynoptic perspective highlights the intrinsic relationshipbetween the medicane, the upper-level trough and, furtherupstream, the ex-tropical cyclone Helene, which experiencedan extratropical transition. Short-range forecasts fromthe Action de Recherche Petite Echelle Grande Echelle(ARPEGE) and ECMWF models are then examined. Toidentify any eventual tropical transition, they are projectedinto the cyclone phase space (Hart, 2003), a continuumdescribing the broad evolution of all cyclone types (tropical,extratropical, subtropical, and hybrid) and the transitionsfrom one to another. Because of the mesoscale size ofthe medicane, numerical experiments were performed atkilometre scale. As in Argence et al. (2008), a simple me-thod consisting of building different atmospheric states byshifting the initialization time was employed to generatetwo sets of perturbed initial conditions from ARPEGE andECMWF. The impact of initial-condition uncertainties onthe evolution of the medicane allows the key mechanismsin play during the tropical transition to be stressed, inparticular the explosive development of the medicane by jetcrossing.
The paper is organized as follows. Section 2 gives anoverview of the case study. Section 3 presents a brief analysisof the ECMWF and ARPEGE forecasts of the medicane atshort and medium ranges. Section 4 describes the mesocaleforecasts performed with the Meso-NH model. Section 5concludes the paper.
Copyright c© 2011 Royal Meteorological Society Q. J. R. Meteorol. Soc. 138: 596–611 (2012)
598 J.-P. Chaboureau et al.
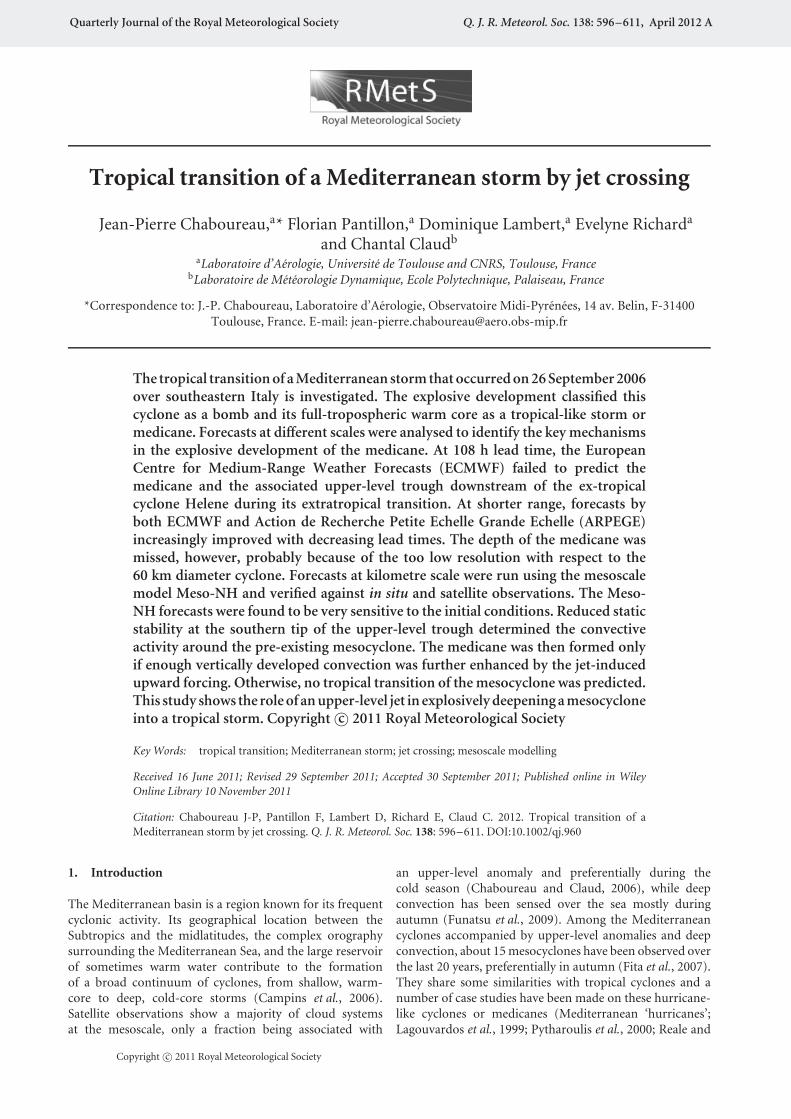
Figure 1. Topography (m) of 8 km domain used for the Meso-NHexperiments. The line shows the track of the mesocyclone as derivedfrom ECMWF operational analyses every 6 h from 25 September 2006 at0000 UTC to 26 September 2006 at 1800 UTC. Dates and times for thetrack are given as date/hour (UTC). The thick part of the line correspondsto the track of the medicane. This figure is available in colour online atwileyonlinelibrary.com/journal/qj
2. Overview of the case study
The case under investigation in this study (see trajectory onFigure 1) was somewhat unusual, in the sense that the inlandmovement of the medicane made rather good observation ofits characteristics possible (the area affected by the medicanewas covered by two radars and a high-resolution surfacestation network; Moscatello et al., 2008b). This uniquedataset combined with the strong intensity of the medicanemotivated a number of studies using numerical experiments(Moscatello et al., 2008a; Davolio et al., 2009; Miglietta et al.,2011; Laviola et al., 2011) and satellite observations (Claudet al., 2010; Conte et al., 2011). The overview of the casegiven below is based on these previous studies.
The mesoscale system originated on 24 September 2006at noon as an orographic cyclone on the lee side of the AtlasMountains. Favourable conditions were further createdby a baroclinic system deepening over the TyrrhenianSea. At 0600 UTC on 25 September, the relatively largeorographically generated cyclone reached the Strait of Sicily,where it deepened due to convection produced along a coldfront moving eastward. At that time, it became a muchsmaller-scale cyclone. The cyclone subsequently movednortheastwards. At 0000 UTC on 26 September, the lowentered the Ionian Sea, where it further deepened by 8 hPain 6 h according to the ECMWF analysis. At 0900 UTC,the now medicane crossed the Salentine peninsula. Windgusts exceeding 40 m s−1 were measured at Galatina airport(40.2◦N, 18.1◦E), and several surface stations recorded asharp decrease in the MSLP, down to 986 hPa. Basedon satellite measurements and ground observations, thediameter of the eye of the cyclone was estimated at 60 km.
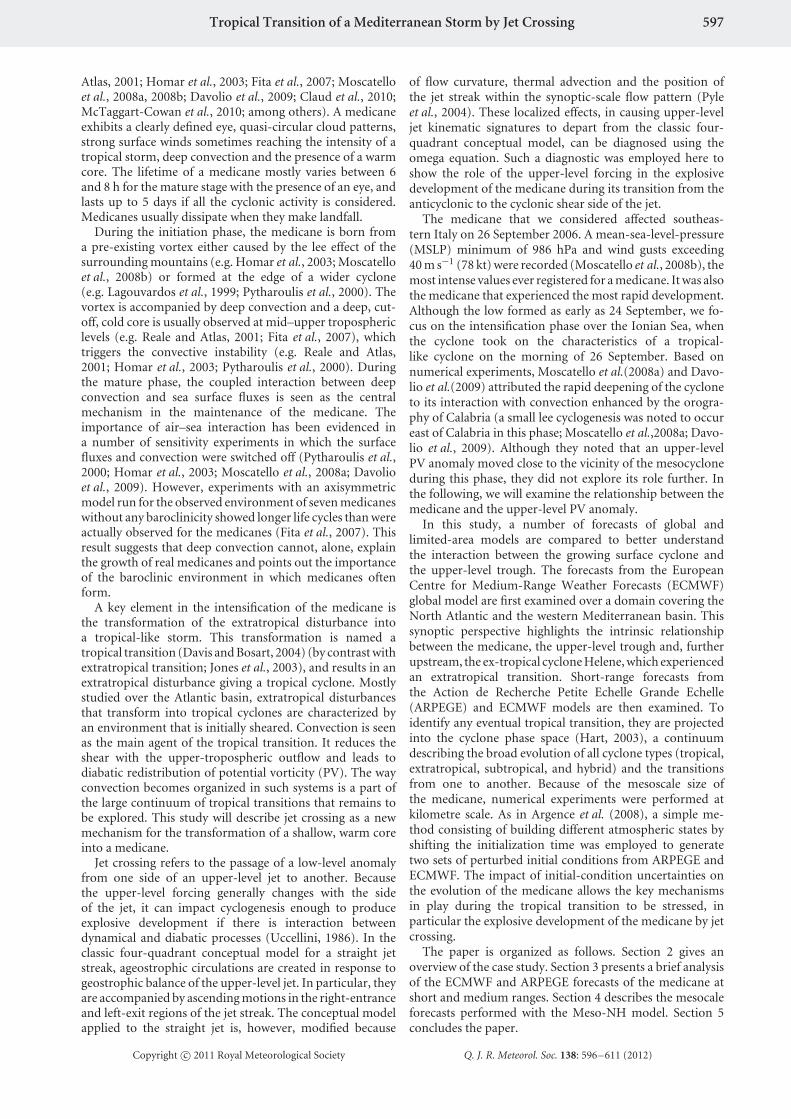
Figure 2. 10.8 µm BT (K, shading) and surface wind (vectors) obtainedfrom MSG and QuikSCAT observations on 25 September 2006 at 1700 and1654 UTC, respectively. The white star gives the position of the medicaneas estimated by Moscatello et al. (2008a). This figure is available in colouronline at wileyonlinelibrary.com/journal/qj
At 0945 UTC, the medicane moved over the Adriatic Sea,where both surface fluxes and latent heat release sustainedits intensity (as shown by sensitivity experiments doneby previous studies cited above), following an arc-shapedtrajectory, and still associated with low values of MSLP.At 1700 UTC, the cyclone made landfall on the Garganopromontory (41.7◦N, 15.7◦E), with cloud cover cyclonicallyrolling to the east of the medicane and surface wind of morethan 18 m s−1 to the north (Figure 2). At 1715 UTC theMSLP in Vico del Gargano reached the minimum valueof 988 hPa. Then, the cyclone weakened rapidly to finallymerge with the main low-pressure system, still located overthe Tyrrhenian Sea.
Although no sustained wind values were reported inthe aforementioned studies, the record gust of 40 m s−1
suggests that sustained wind speed may not have reachedthe hurricane-level intensity of 33 m s−1, but could classifythe medicane as a tropical storm. This suggestion isfurther supported by the absence of precipitation near theMSLP minimum (the eye of the cyclone) and a circle ofprecipitation around it observed by radar from 40◦N, 18◦Eat 0900 UTC on 26 September. Maximum reflectivity valuesof about 45 dBZ (corresponding to 24 mm h−1) wererecorded by the radar during the passage of the medicaneand a maximum of 120 mm of rainfall was observed at theCrispiano station (40.6◦N, 17.4◦E) during the transit of themedicane over the area.
3. Large-scale forecasts
The medicane forecast was investigated at short rangeby Davolio et al. (2009) on the basis of two regionalforecasting chains for which initial and boundary conditionswere provided by the Global Forecast System–NationalCenters for Environmental Prediction analyses and forecastsstarting at 0000 UTC 25 September. Sensitivity experimentswere performed using ECMWF analysis and forecasts.Their results show a strong sensitivity to the initial andboundary conditions, simulations starting at 1200 UTC on25 September presenting better forecasts than those startingat 0000 UTC on 25 September. It was also found that the
Copyright c© 2011 Royal Meteorological Society Q. J. R. Meteorol. Soc. 138: 596–611 (2012)
Tropical Transition of a Mediterranean Storm by Jet Crossing 599
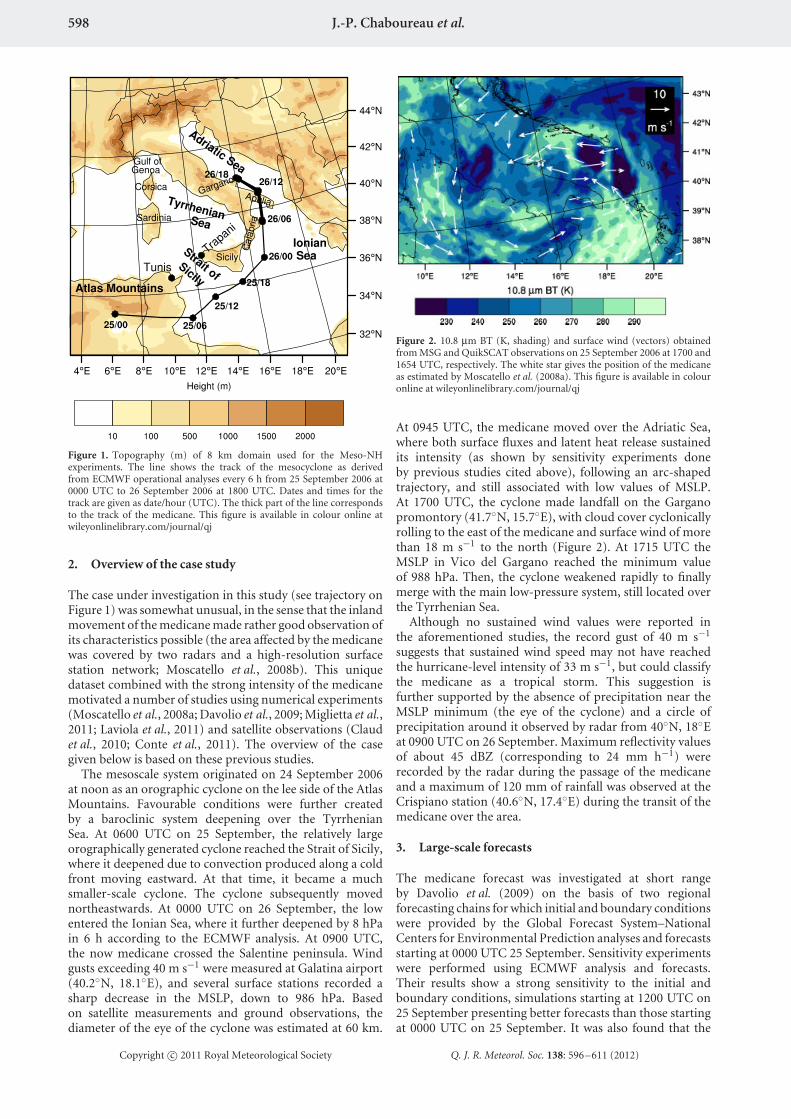
Figure 3. ECMWF forecasts at 1200 UTC on 26 September 2006: PV at 300 hPa (shaded, PVU = 10 −6K m−2 s−1 kg−1), wind at 300 hPa (vectors,for winds larger than 30 m s−1), and mean sea-level pressure (solid lines, every 4 hPa between 976 and 1008 hPa). Forecasts are at (a) t + 12, (b)t + 24, (c) t + 36, (d) t + 60, (e) t + 84, and (f) t + 108. The figures (when applicable) indicate the local MSLP minima over the North Atlantic Oceanand the Mediterranean Sea associated with the ex-tropical cyclone Helene and the medicane, respectively. This figure is available in colour online atwileyonlinelibrary.com/journal/qj
limited-area models provided a much more accuratesimulation of the cyclone in terms of both intensity andtrajectory than the global models.
The predictability of the medicane is re-examined froma broader perspective here, using short to medium ranges.Results valid at 1200 UTC on 26 September 2006 are shownfor ECMWF forecasts with lead times from 12 to 36 h every12 h and from 60 to 108 h every 24 h (Figure 3). Thepoorest forecast was the 108 h one starting at 0000 UTC on22 September. The centre of the ex-tropical cyclone Helenewas outside the domain, with no low-level cyclone or upper-level trough over the Mediterranean. Every forecast exceptthe 108 h one showed an upper-level trough over theMediterranean and two local minima in the MSLP: oneover the North Atlantic Ocean and a low centred oversoutheastern Italy. These forecasts differed substantially inthe location of Helene (but they agreed with an MSLP ofless than 990 hPa), the depth of the Mediterranean low(the MSLP minimum ranged between 993 and 1004 hPa),
and the connection of the upper-level trough over theMediterranean with the upstream flow over the Atlantic.
The 12 h, 24 h, and 36 h forecasts showed a troughextending from the North Sea to the Mediterranean, with thesouthern tip rolling cyclonically over Sicily. A Mediterraneancyclone was forecasted with an MSLP minimum of less than995 hPa over southeastern Italy and the ex-hurricane Helenewas located well. These short-term forecasts clearly differfrom the medium-range forecasts, which did not predict theupper-level trough over the Mediterranean correctly. The60 h forecast featured an upper-level cut-off low over theTyrrhenian Sea and the 84 h forecast had a straight upper-level trough ending further to the east over the Adriatic Sea.In addition, the ex-hurricane Helene was predicted too far tothe southwest. The wrong location of Helene together withthe more zonal direction taken by the Atlantic upper-level jetat 10◦W suggest an incorrect prediction of the extratropicaltransition of Helene. This resulted in a weaker building ofthe downstream ridge centred over the British Isles, thusa weaker stretching applied to the trough over western
Copyright c© 2011 Royal Meteorological Society Q. J. R. Meteorol. Soc. 138: 596–611 (2012)

600 J.-P. Chaboureau et al.
Europe and the Mediterranean, and the underestimation ofthe deepening of the low-level cyclone over Italy, with anMSLP minimum remaining larger than 1001 hPa.
The reduced predictability of the medicane is illustrative ofthe impact of the extratropical transition on the midlatitudeflow and the associated sensitivity of cyclogenesis in thedownstream region. Such a reduction has been shownrecently in the framework of operational ensemble systems(Harr et al., 2008; Anwender et al., 2008). Based on idealizedscenarios, Riemer et al. (2008) and Riemer and Jones (2010)have demonstrated the sensitivity of the downstream flow tothe evolution of the extratropical transition, in particular inthe formation and amplification of the ridge–trough coupletat upper level. Here, the extratropical transition of Heleneoccurred between 22 and 25 September, a period from whichthe upper-level trough was poorly predicted.
The predictability of the medicane was further describedat short range with ARPEGE (ECMWF) forecasts startingat 0000 and 1200 UTC on 25 September, hereafter calledARP00 and ARP12 (ECM00 and ECM12), respectively. TheECMWF forecasts were run at T799 spectral truncation(which corresponds to a horizontal resolution of 25 km)and with 91 levels (top at 0.01 hPa), while ARPEGE has astretched grid with a horizontal resolution from 23 km overFrance to 133 km on antipode and 41 vertical levels (top at1 hPa). The tracks of the forecast cyclone from 1200 UTCon 25 September to 1800 UTC on 26 September are shownin Figure 4. The tracks are within 1◦ of longitude andlatitude–too far southwest compared to the best-estimateanalysis performed by Moscatello et al. (2008b). The MSLPminimum decreased significantly with time from 0000 UTCon 26 September when the low was over the Ionian Sea.
Figure 4. Track of the Mediterranean cyclone for the best-estimate analysis(dots, adapted from Moscatello et al., 2008a), the ARPEGE (asterisks) andECMWF (triangles) forecasts. The track is every 3 h from 0900 to 1800 UTCon 26 September for the analysis and from 1200 UTC on 25 Septemberto 1800 UTC on 26 September for the forecasts. The inset shows the timeevolution of MSLP minimum; the black dots are values recorded at stationsover land (Moscatello et al. 2008b). This figure is available in colour onlineat wileyonlinelibrary.com/journal/qj
The lowest values were reached by the forecasts startingon 1200 UTC (990 and 992 hPa by ARP12 and ECM12respectively) compared to their counterparts starting at0000 UTC (MSLP was above 995 hPa). The 986 hPa mea-sured over the Salentine peninsula was, however, missed bythe ARPEGE and ECMWF forecasts. The overestimation ofthe MSLP minimum was probably related to the difficulty ofsimulating a 60 km diameter cyclone using a model with gridspacing of about 25 km. Most of the lowest values in MSLPminimum were reached at 0900 UTC on 26 September. Afteraround 0900 UTC, the MSLP minimum generally increasedas the low was wrongly forecasted over land.
The life cycles of the medicane from the different forecastswere analysed within the cyclone phase space following themethodology developed by Hart (2003). The cyclone phasespace allows cyclones to be contrasted according to theirthickness asymmetry and either cold- or warm-core struc-ture. The cyclone phase space is based on three parameters:900–600 hPa thermal wind (−VL
T), 600–300 hPa thermalwind (−VU
T ), and 900–600 hPa storm-motion-relative-thickness asymmetry (B), defined as the thickness differencebetween right and left of current storm motion across thecyclone. With respect to the mesoscale of the low, the cal-culation was made here within a 200 km radius–a lengthshorter than the 500 km distance used originally by Hart(2003). A 500 km radius smooths out the warm-core struc-ture, while it reveals the environmental asymmetry in whichthe mesocyclone evolved over the Strait of Sicily. As a resultof the 200 km radius employed, near-zero values of B wereobtained, indicating symmetry of the medicane. Similar val-ues (but obtained with a larger radius of 500 km) were foundfor the case of Olga, a stereotypical example of the conversionof a non-tropical cyclone into a tropical cyclone (Hart 2003).
Figure 5 shows the −VLT versus −VU
T diagram todistinguish between a cold-core and a warm-core structurein the lower and upper troposphere respectively. From
Figure 5. Cyclone phase space diagram for the ARPEGE and ECMWFforecasts starting at 0000 and 1200 UTC on 25 September 2006: −VL
T
(scaled 900–600 hPa thermal wind) versus −VUT (scaled 600–300 hPa
thermal wind). The evolution is shown every 3 h from 1200 UTC on25 September to 1800 UTC on 26 September. Points at 0000 and 0600 UTCon 26 September are indicated with open circles and squares respectively.This figure is available in colour online at wileyonlinelibrary.com/journal/qj
Copyright c© 2011 Royal Meteorological Society Q. J. R. Meteorol. Soc. 138: 596–611 (2012)
Tropical Transition of a Mediterranean Storm by Jet Crossing 601
1200 UTC on 25 September to about 0000 UTC on26 September, most of the forecasts show a decrease in −VU
Tvalues, the upper-level, cold core becoming stronger as thelow located over the Strait of Sicily moves closer to the upper-level trough. From 0000 to 0600 UTC on 26 September, −VL
Tincreases from negative to positive values, indicating thedevelopment of a shallow, low-level warm core within thecyclone. The concomitant decrease in the MSLP minimumsuggests that convection predicted over the Ionian Sea led toan enhancement of the low-level cyclonic circulation. From0600 UTC on 26 September onwards, −VU
T increases, partlybecause the mesocyclone moves away from the upper-leveljet. After 1200 and 1500 UTC, the low-level warm core decaysin ARP00 and ECM00 respectively. In contrast, for ARP12and ECM12 forecasts, which led to a deeper mesocyclone, theshallow, warm core built up over the Adriatic Sea. The full-troposphere warm-core cyclone (−VL
T > 0 and −VUT > 0)
was diagnosed at 0900 and 1200 UTC for ARP12 and 1500and 1800 UTC for ECM12. Such a development of thelow into a tropical-like cyclone was, however, reached in atransient way as −VU
T decreased to near-zero or negativevalues while the cyclone filled up and decayed. Note that themagnitudes of −VL
T and −VUT achieved by the medicane are
about half those analysed at the end of the tropical transitionof Olga (Hart, 2003). The strongest warm core found forOlga is consistent with its largest cyclone intensity (an MSLPminimum of 973 hPa) as the cyclone generally increases asthe warm-core strength increases.
As in Davolio et al. (2009), the ARPEGE and ECMWFforecasts starting on 25 September show strong sensitivityto the specification of the initial conditions, the forecastsstarting at 1200 UTC giving a much better prediction of themesocyclone than the forecasts starting at 0000 UTC. Theyall lack the strong deepening of the medicane over the IonianSea and its transit and maintenance as a tropical storm overthe Adriatic Sea. These results support the need to simulatethe mesocyclone at a higher resolution.
4. Mesoscale forecasts
4.1. Numerical set-up and experimental design
The numerical simulations at mesoscale were performedwith the non-hydrostatic model Meso-NH (Lafore et al.,1998) version 4.7 with triply nested grids using a two-waynesting method (Stein et al., 2000). The model domainsshown in Figure 6 have horizontal grid spacings of 32, 8,and 2 km. The vertical grid had 50 levels up to 20 km, witha spacing ranging from 60 m close to the surface to 600 mat high altitude. For the two coarser-resolution grids (32and 8 km), the subgrid-scale convection was parametrizedby a mass-flux convection scheme (Bechtold et al., 2001).For the inner grid (2 km), explicit deep convection waspermitted and the convection scheme was switched off. Themicrophysical scheme included all water phases with fivespecies of precipitating and non-precipitating liquid andsolid water (Pinty and Jabouille, 1998) and a modifiedice to snow autoconversion parametrization followingChaboureau and Pinty (2006). Subgrid cloud cover andcondensate content were parametrized as a function of thenormalized saturation deficit by taking both turbulent andconvective contributions into account (Chaboureau andBechtold, 2002, 2005). The turbulence parametrization wasbased on a 1.5-order closure (Cuxart et al., 2000). The
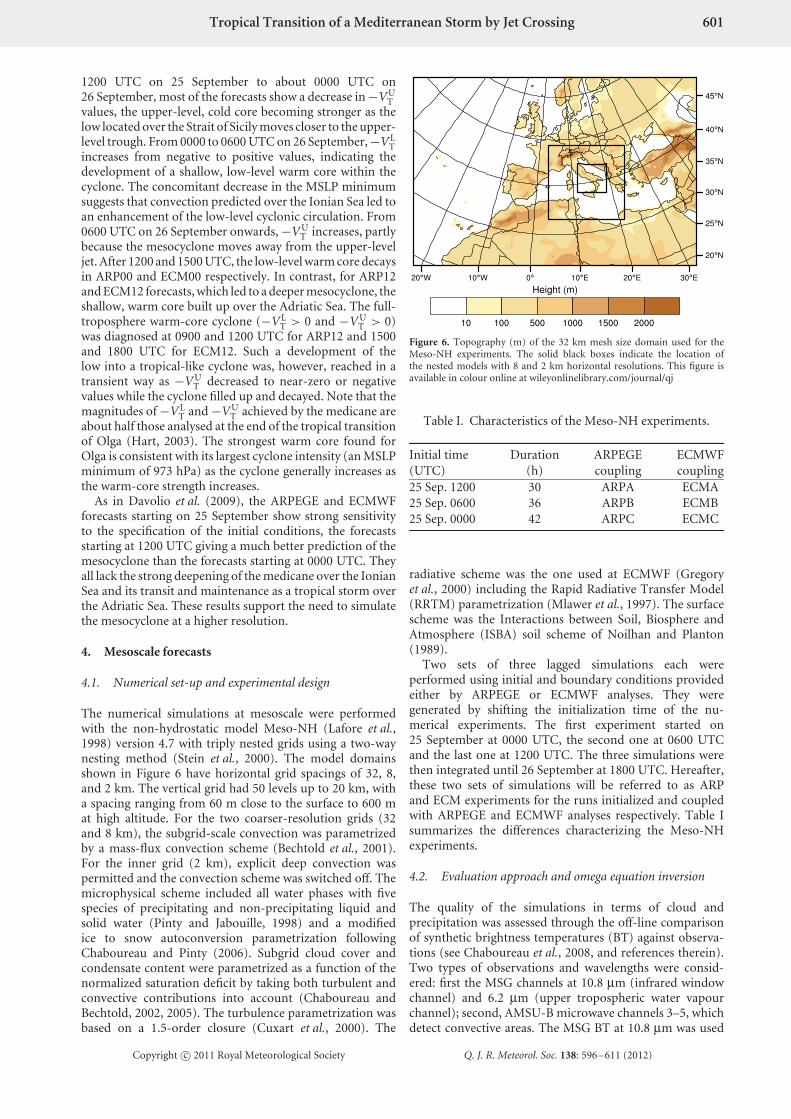
Figure 6. Topography (m) of the 32 km mesh size domain used for theMeso-NH experiments. The solid black boxes indicate the location ofthe nested models with 8 and 2 km horizontal resolutions. This figure isavailable in colour online at wileyonlinelibrary.com/journal/qj
Table I. Characteristics of the Meso-NH experiments.
Initial time Duration ARPEGE ECMWF(UTC) (h) coupling coupling25 Sep. 1200 30 ARPA ECMA25 Sep. 0600 36 ARPB ECMB25 Sep. 0000 42 ARPC ECMC
radiative scheme was the one used at ECMWF (Gregoryet al., 2000) including the Rapid Radiative Transfer Model(RRTM) parametrization (Mlawer et al., 1997). The surfacescheme was the Interactions between Soil, Biosphere andAtmosphere (ISBA) soil scheme of Noilhan and Planton(1989).
Two sets of three lagged simulations each wereperformed using initial and boundary conditions providedeither by ARPEGE or ECMWF analyses. They weregenerated by shifting the initialization time of the nu-merical experiments. The first experiment started on25 September at 0000 UTC, the second one at 0600 UTCand the last one at 1200 UTC. The three simulations werethen integrated until 26 September at 1800 UTC. Hereafter,these two sets of simulations will be referred to as ARPand ECM experiments for the runs initialized and coupledwith ARPEGE and ECMWF analyses respectively. Table Isummarizes the differences characterizing the Meso-NHexperiments.
4.2. Evaluation approach and omega equation inversion
The quality of the simulations in terms of cloud andprecipitation was assessed through the off-line comparisonof synthetic brightness temperatures (BT) against observa-tions (see Chaboureau et al., 2008, and references therein).Two types of observations and wavelengths were consid-ered: first the MSG channels at 10.8 µm (infrared windowchannel) and 6.2 µm (upper tropospheric water vapourchannel); second, AMSU-B microwave channels 3–5, whichdetect convective areas. The MSG BT at 10.8 µm was used
Copyright c© 2011 Royal Meteorological Society Q. J. R. Meteorol. Soc. 138: 596–611 (2012)
602 J.-P. Chaboureau et al.
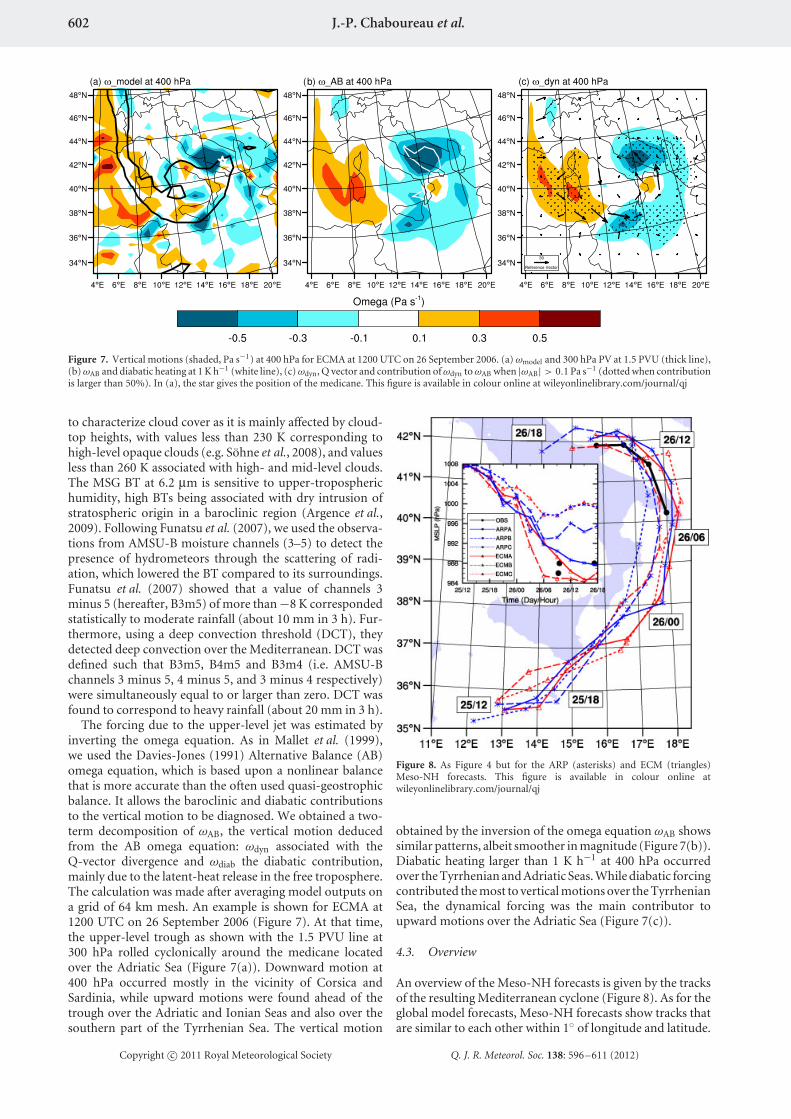
Figure 7. Vertical motions (shaded, Pa s−1) at 400 hPa for ECMA at 1200 UTC on 26 September 2006. (a) ωmodel and 300 hPa PV at 1.5 PVU (thick line),(b) ωAB and diabatic heating at 1 K h−1 (white line), (c) ωdyn, Q vector and contribution of ωdyn to ωAB when |ωAB| > 0.1 Pa s−1 (dotted when contributionis larger than 50%). In (a), the star gives the position of the medicane. This figure is available in colour online at wileyonlinelibrary.com/journal/qj
to characterize cloud cover as it is mainly affected by cloud-top heights, with values less than 230 K corresponding tohigh-level opaque clouds (e.g. Sohne et al., 2008), and valuesless than 260 K associated with high- and mid-level clouds.The MSG BT at 6.2 µm is sensitive to upper-tropospherichumidity, high BTs being associated with dry intrusion ofstratospheric origin in a baroclinic region (Argence et al.,2009). Following Funatsu et al. (2007), we used the observa-tions from AMSU-B moisture channels (3–5) to detect thepresence of hydrometeors through the scattering of radi-ation, which lowered the BT compared to its surroundings.Funatsu et al. (2007) showed that a value of channels 3minus 5 (hereafter, B3m5) of more than −8 K correspondedstatistically to moderate rainfall (about 10 mm in 3 h). Fur-thermore, using a deep convection threshold (DCT), theydetected deep convection over the Mediterranean. DCT wasdefined such that B3m5, B4m5 and B3m4 (i.e. AMSU-Bchannels 3 minus 5, 4 minus 5, and 3 minus 4 respectively)were simultaneously equal to or larger than zero. DCT wasfound to correspond to heavy rainfall (about 20 mm in 3 h).
The forcing due to the upper-level jet was estimated byinverting the omega equation. As in Mallet et al. (1999),we used the Davies-Jones (1991) Alternative Balance (AB)omega equation, which is based upon a nonlinear balancethat is more accurate than the often used quasi-geostrophicbalance. It allows the baroclinic and diabatic contributionsto the vertical motion to be diagnosed. We obtained a two-term decomposition of ωAB, the vertical motion deducedfrom the AB omega equation: ωdyn associated with theQ-vector divergence and ωdiab the diabatic contribution,mainly due to the latent-heat release in the free troposphere.The calculation was made after averaging model outputs ona grid of 64 km mesh. An example is shown for ECMA at1200 UTC on 26 September 2006 (Figure 7). At that time,the upper-level trough as shown with the 1.5 PVU line at300 hPa rolled cyclonically around the medicane locatedover the Adriatic Sea (Figure 7(a)). Downward motion at400 hPa occurred mostly in the vicinity of Corsica andSardinia, while upward motions were found ahead of thetrough over the Adriatic and Ionian Seas and also over thesouthern part of the Tyrrhenian Sea. The vertical motion
Figure 8. As Figure 4 but for the ARP (asterisks) and ECM (triangles)Meso-NH forecasts. This figure is available in colour online atwileyonlinelibrary.com/journal/qj
obtained by the inversion of the omega equation ωAB showssimilar patterns, albeit smoother in magnitude (Figure 7(b)).Diabatic heating larger than 1 K h−1 at 400 hPa occurredover the Tyrrhenian and Adriatic Seas. While diabatic forcingcontributed the most to vertical motions over the TyrrhenianSea, the dynamical forcing was the main contributor toupward motions over the Adriatic Sea (Figure 7(c)).
4.3. Overview
An overview of the Meso-NH forecasts is given by the tracksof the resulting Mediterranean cyclone (Figure 8). As for theglobal model forecasts, Meso-NH forecasts show tracks thatare similar to each other within 1◦ of longitude and latitude.
Copyright c© 2011 Royal Meteorological Society Q. J. R. Meteorol. Soc. 138: 596–611 (2012)
Tropical Transition of a Mediterranean Storm by Jet Crossing 603
But they contrast with their global model counterparts asthe Meso-NH tracks, and particularly ARPA, ECMA andECMB, almost overlay the analysed track of the medicaneover the Adriatic Sea with averaged errors of 34, 18, and74 km, respectively.
In general, the Meso-NH forecasts showed a sharpdecrease in MSLP from about 1800 UTC on 25 Septemberto 0600 UTC on 26 September. They deviated from theglobal model forecasts, for which the deepening was delayedby further 6 h. Afterwards, the Meso-NH forecasts differedsignificantly from one another in terms of MSLP minimum.ARPB, ARPC and ECMC had moderate MSLP values, downto 993, 994 and 998 hPa respectively, then increasing MSLPvalues from 0900 UTC on 26 September onwards. ARPA,ECMA and ECMB produced a deeper low, reaching 988 hPaor lower and, later in the day, at 1500 or 1800 UTC on26 September. Only ECMA and ECMB gave the MSLPminimum of 986 hPa recorded at 0900 UTC on 26 Septemberat Nardo, on the southwestern side of Salento (Moscatelloet al., 2008b). For these three successful forecasts, the MSLPfell by more than 18 hPa in 24 h. This value equals 1 Bergeron= 24 (hPa per day) sin(φ)/sin(60◦) with φ the latitude ofthe storm centre, taken here at 40◦. The sin(φ)/sin(60◦)factor was introduced by Sanders and Gyakum (1980) togeostrophically adjust Bergeron’s original characterizationof 24 (hPa per day) for latitudes other than that of Bergen(60◦N). According to this criterion, the storm can beclassified as an explosively intensifying cyclone or ‘bomb’.Note also that, in ARPA, ECMA and ECMB, sustained10 m wind speeds reached 25 m s−1 on the morning of26 September, i.e. in the intensity range of 17–32 m s−1,which classifies the medicane as a tropical storm.
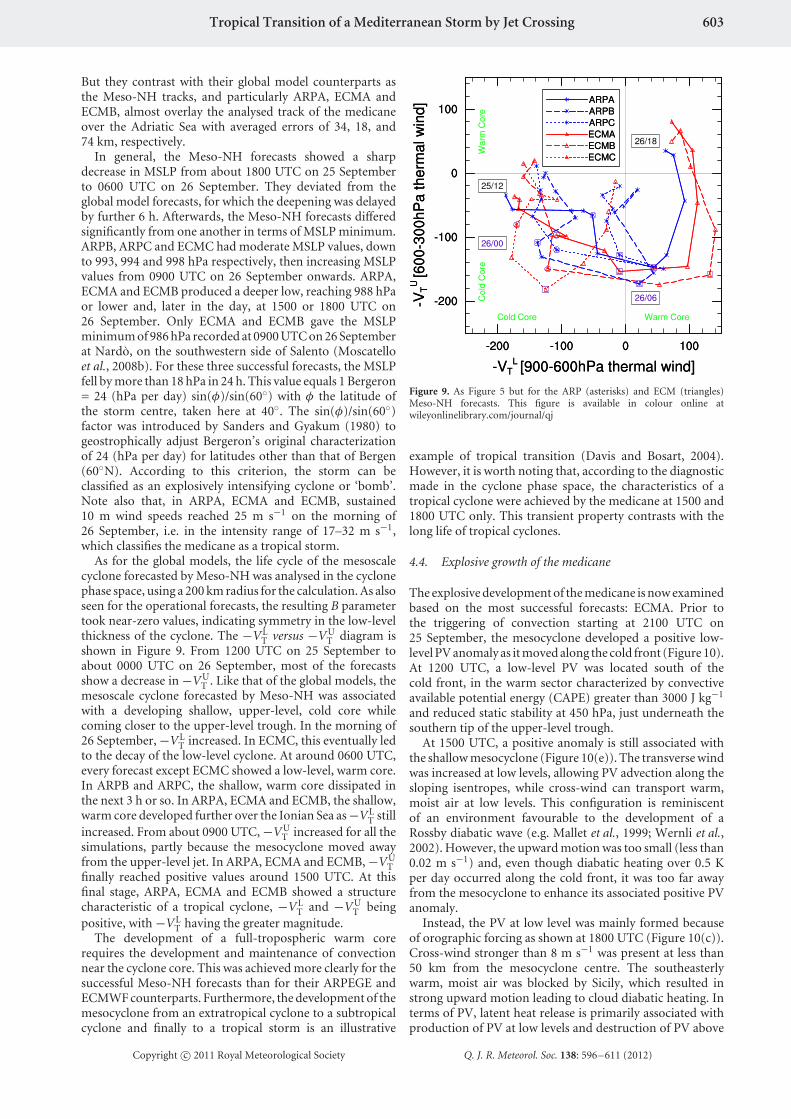
As for the global models, the life cycle of the mesoscalecyclone forecasted by Meso-NH was analysed in the cyclonephase space, using a 200 km radius for the calculation. As alsoseen for the operational forecasts, the resulting B parametertook near-zero values, indicating symmetry in the low-levelthickness of the cyclone. The −VL
T versus −VUT diagram is
shown in Figure 9. From 1200 UTC on 25 September toabout 0000 UTC on 26 September, most of the forecastsshow a decrease in −VU
T . Like that of the global models, themesoscale cyclone forecasted by Meso-NH was associatedwith a developing shallow, upper-level, cold core whilecoming closer to the upper-level trough. In the morning of26 September, −VL
T increased. In ECMC, this eventually ledto the decay of the low-level cyclone. At around 0600 UTC,every forecast except ECMC showed a low-level, warm core.In ARPB and ARPC, the shallow, warm core dissipated inthe next 3 h or so. In ARPA, ECMA and ECMB, the shallow,warm core developed further over the Ionian Sea as −VL
T stillincreased. From about 0900 UTC, −VU
T increased for all thesimulations, partly because the mesocyclone moved awayfrom the upper-level jet. In ARPA, ECMA and ECMB, −VU
Tfinally reached positive values around 1500 UTC. At thisfinal stage, ARPA, ECMA and ECMB showed a structurecharacteristic of a tropical cyclone, −VL
T and −VUT being
positive, with −VLT having the greater magnitude.
The development of a full-tropospheric warm corerequires the development and maintenance of convectionnear the cyclone core. This was achieved more clearly for thesuccessful Meso-NH forecasts than for their ARPEGE andECMWF counterparts. Furthermore, the development of themesocyclone from an extratropical cyclone to a subtropicalcyclone and finally to a tropical storm is an illustrative
Figure 9. As Figure 5 but for the ARP (asterisks) and ECM (triangles)Meso-NH forecasts. This figure is available in colour online atwileyonlinelibrary.com/journal/qj
example of tropical transition (Davis and Bosart, 2004).However, it is worth noting that, according to the diagnosticmade in the cyclone phase space, the characteristics of atropical cyclone were achieved by the medicane at 1500 and1800 UTC only. This transient property contrasts with thelong life of tropical cyclones.
4.4. Explosive growth of the medicane
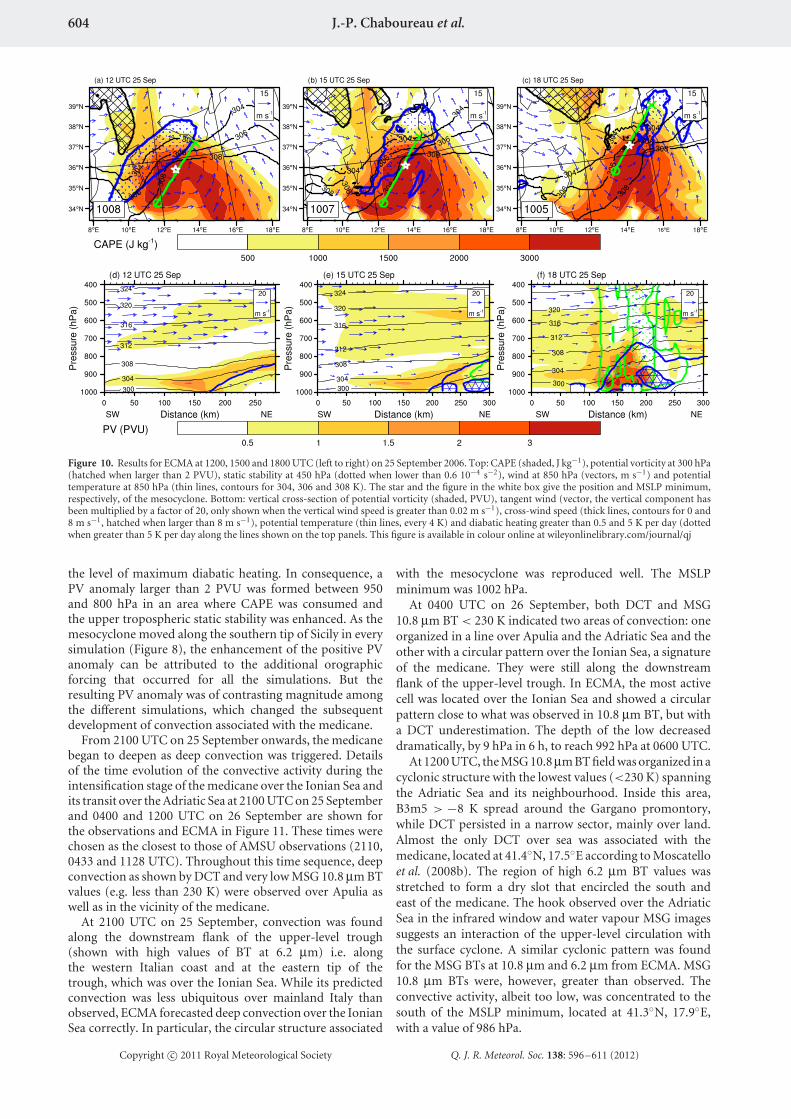
The explosive development of the medicane is now examinedbased on the most successful forecasts: ECMA. Prior tothe triggering of convection starting at 2100 UTC on25 September, the mesocyclone developed a positive low-level PV anomaly as it moved along the cold front (Figure 10).At 1200 UTC, a low-level PV was located south of thecold front, in the warm sector characterized by convectiveavailable potential energy (CAPE) greater than 3000 J kg−1
and reduced static stability at 450 hPa, just underneath thesouthern tip of the upper-level trough.
At 1500 UTC, a positive anomaly is still associated withthe shallow mesocyclone (Figure 10(e)). The transverse windwas increased at low levels, allowing PV advection along thesloping isentropes, while cross-wind can transport warm,moist air at low levels. This configuration is reminiscentof an environment favourable to the development of aRossby diabatic wave (e.g. Mallet et al., 1999; Wernli et al.,2002). However, the upward motion was too small (less than0.02 m s−1) and, even though diabatic heating over 0.5 Kper day occurred along the cold front, it was too far awayfrom the mesocyclone to enhance its associated positive PVanomaly.
Instead, the PV at low level was mainly formed becauseof orographic forcing as shown at 1800 UTC (Figure 10(c)).Cross-wind stronger than 8 m s−1 was present at less than50 km from the mesocyclone centre. The southeasterlywarm, moist air was blocked by Sicily, which resulted instrong upward motion leading to cloud diabatic heating. Interms of PV, latent heat release is primarily associated withproduction of PV at low levels and destruction of PV above
Copyright c© 2011 Royal Meteorological Society Q. J. R. Meteorol. Soc. 138: 596–611 (2012)
604 J.-P. Chaboureau et al.
Figure 10. Results for ECMA at 1200, 1500 and 1800 UTC (left to right) on 25 September 2006. Top: CAPE (shaded, J kg−1), potential vorticity at 300 hPa(hatched when larger than 2 PVU), static stability at 450 hPa (dotted when lower than 0.6 10−4 s−2), wind at 850 hPa (vectors, m s−1) and potentialtemperature at 850 hPa (thin lines, contours for 304, 306 and 308 K). The star and the figure in the white box give the position and MSLP minimum,respectively, of the mesocyclone. Bottom: vertical cross-section of potential vorticity (shaded, PVU), tangent wind (vector, the vertical component hasbeen multiplied by a factor of 20, only shown when the vertical wind speed is greater than 0.02 m s−1), cross-wind speed (thick lines, contours for 0 and8 m s−1, hatched when larger than 8 m s−1), potential temperature (thin lines, every 4 K) and diabatic heating greater than 0.5 and 5 K per day (dottedwhen greater than 5 K per day along the lines shown on the top panels. This figure is available in colour online at wileyonlinelibrary.com/journal/qj
the level of maximum diabatic heating. In consequence, aPV anomaly larger than 2 PVU was formed between 950and 800 hPa in an area where CAPE was consumed andthe upper tropospheric static stability was enhanced. As themesocyclone moved along the southern tip of Sicily in everysimulation (Figure 8), the enhancement of the positive PVanomaly can be attributed to the additional orographicforcing that occurred for all the simulations. But theresulting PV anomaly was of contrasting magnitude amongthe different simulations, which changed the subsequentdevelopment of convection associated with the medicane.
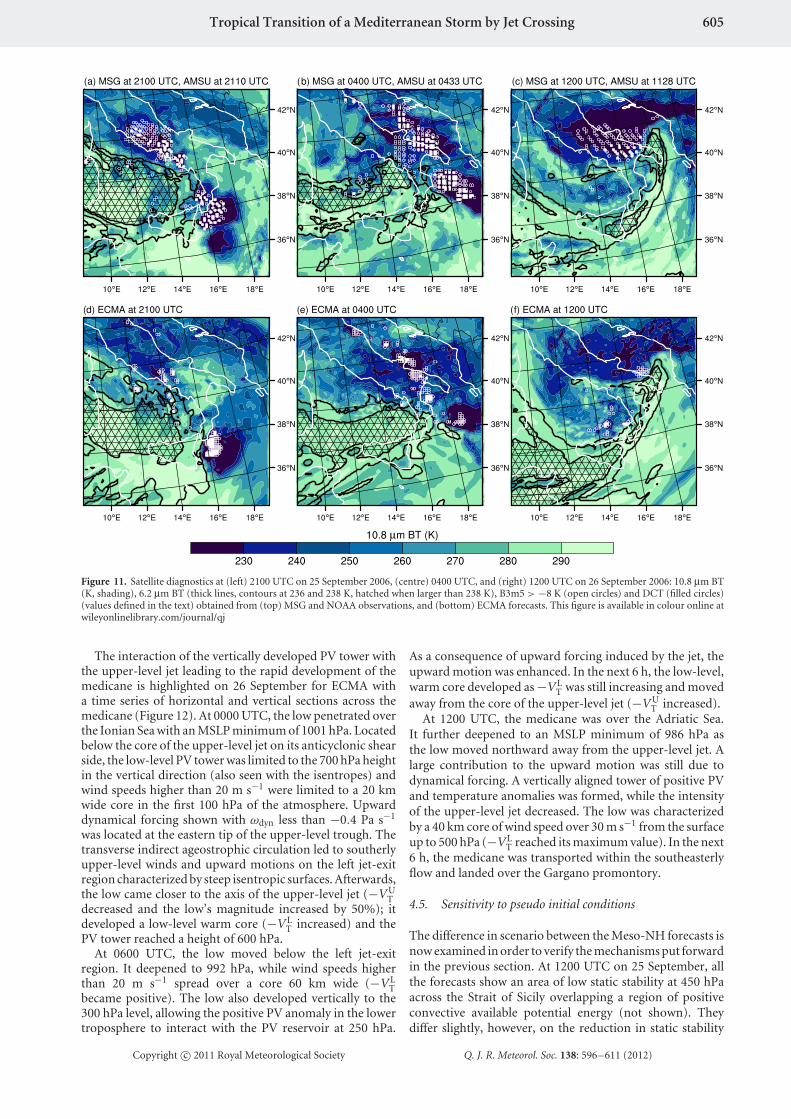
From 2100 UTC on 25 September onwards, the medicanebegan to deepen as deep convection was triggered. Detailsof the time evolution of the convective activity during theintensification stage of the medicane over the Ionian Sea andits transit over the Adriatic Sea at 2100 UTC on 25 Septemberand 0400 and 1200 UTC on 26 September are shown forthe observations and ECMA in Figure 11. These times werechosen as the closest to those of AMSU observations (2110,0433 and 1128 UTC). Throughout this time sequence, deepconvection as shown by DCT and very low MSG 10.8 µm BTvalues (e.g. less than 230 K) were observed over Apulia aswell as in the vicinity of the medicane.
At 2100 UTC on 25 September, convection was foundalong the downstream flank of the upper-level trough(shown with high values of BT at 6.2 µm) i.e. alongthe western Italian coast and at the eastern tip of thetrough, which was over the Ionian Sea. While its predictedconvection was less ubiquitous over mainland Italy thanobserved, ECMA forecasted deep convection over the IonianSea correctly. In particular, the circular structure associated
with the mesocyclone was reproduced well. The MSLPminimum was 1002 hPa.
At 0400 UTC on 26 September, both DCT and MSG10.8 µm BT < 230 K indicated two areas of convection: oneorganized in a line over Apulia and the Adriatic Sea and theother with a circular pattern over the Ionian Sea, a signatureof the medicane. They were still along the downstreamflank of the upper-level trough. In ECMA, the most activecell was located over the Ionian Sea and showed a circularpattern close to what was observed in 10.8 µm BT, but witha DCT underestimation. The depth of the low decreaseddramatically, by 9 hPa in 6 h, to reach 992 hPa at 0600 UTC.
At 1200 UTC, the MSG 10.8 µm BT field was organized in acyclonic structure with the lowest values (<230 K) spanningthe Adriatic Sea and its neighbourhood. Inside this area,B3m5 > −8 K spread around the Gargano promontory,while DCT persisted in a narrow sector, mainly over land.Almost the only DCT over sea was associated with themedicane, located at 41.4◦N, 17.5◦E according to Moscatelloet al. (2008b). The region of high 6.2 µm BT values wasstretched to form a dry slot that encircled the south andeast of the medicane. The hook observed over the AdriaticSea in the infrared window and water vapour MSG imagessuggests an interaction of the upper-level circulation withthe surface cyclone. A similar cyclonic pattern was foundfor the MSG BTs at 10.8 µm and 6.2 µm from ECMA. MSG10.8 µm BTs were, however, greater than observed. Theconvective activity, albeit too low, was concentrated to thesouth of the MSLP minimum, located at 41.3◦N, 17.9◦E,with a value of 986 hPa.
Copyright c© 2011 Royal Meteorological Society Q. J. R. Meteorol. Soc. 138: 596–611 (2012)
Tropical Transition of a Mediterranean Storm by Jet Crossing 605
Figure 11. Satellite diagnostics at (left) 2100 UTC on 25 September 2006, (centre) 0400 UTC, and (right) 1200 UTC on 26 September 2006: 10.8 µm BT(K, shading), 6.2 µm BT (thick lines, contours at 236 and 238 K, hatched when larger than 238 K), B3m5 > −8 K (open circles) and DCT (filled circles)(values defined in the text) obtained from (top) MSG and NOAA observations, and (bottom) ECMA forecasts. This figure is available in colour online atwileyonlinelibrary.com/journal/qj
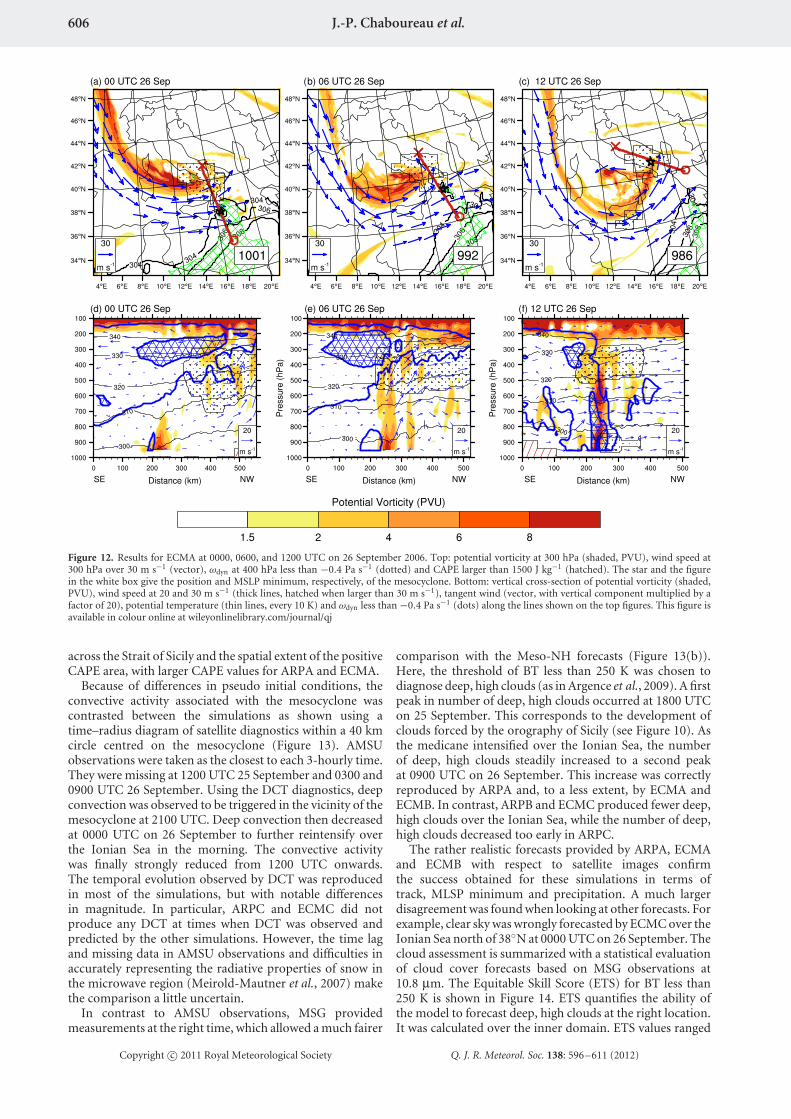
The interaction of the vertically developed PV tower withthe upper-level jet leading to the rapid development of themedicane is highlighted on 26 September for ECMA witha time series of horizontal and vertical sections across themedicane (Figure 12). At 0000 UTC, the low penetrated overthe Ionian Sea with an MSLP minimum of 1001 hPa. Locatedbelow the core of the upper-level jet on its anticyclonic shearside, the low-level PV tower was limited to the 700 hPa heightin the vertical direction (also seen with the isentropes) andwind speeds higher than 20 m s−1 were limited to a 20 kmwide core in the first 100 hPa of the atmosphere. Upwarddynamical forcing shown with ωdyn less than −0.4 Pa s−1
was located at the eastern tip of the upper-level trough. Thetransverse indirect ageostrophic circulation led to southerlyupper-level winds and upward motions on the left jet-exitregion characterized by steep isentropic surfaces. Afterwards,the low came closer to the axis of the upper-level jet (−VU
Tdecreased and the low’s magnitude increased by 50%); itdeveloped a low-level warm core (−VL
T increased) and thePV tower reached a height of 600 hPa.
At 0600 UTC, the low moved below the left jet-exitregion. It deepened to 992 hPa, while wind speeds higherthan 20 m s−1 spread over a core 60 km wide (−VL
Tbecame positive). The low also developed vertically to the300 hPa level, allowing the positive PV anomaly in the lowertroposphere to interact with the PV reservoir at 250 hPa.
As a consequence of upward forcing induced by the jet, theupward motion was enhanced. In the next 6 h, the low-level,warm core developed as −VL
T was still increasing and movedaway from the core of the upper-level jet (−VU
T increased).At 1200 UTC, the medicane was over the Adriatic Sea.
It further deepened to an MSLP minimum of 986 hPa asthe low moved northward away from the upper-level jet. Alarge contribution to the upward motion was still due todynamical forcing. A vertically aligned tower of positive PVand temperature anomalies was formed, while the intensityof the upper-level jet decreased. The low was characterizedby a 40 km core of wind speed over 30 m s−1 from the surfaceup to 500 hPa (−VL
T reached its maximum value). In the next6 h, the medicane was transported within the southeasterlyflow and landed over the Gargano promontory.
4.5. Sensitivity to pseudo initial conditions
The difference in scenario between the Meso-NH forecasts isnow examined in order to verify the mechanisms put forwardin the previous section. At 1200 UTC on 25 September, allthe forecasts show an area of low static stability at 450 hPaacross the Strait of Sicily overlapping a region of positiveconvective available potential energy (not shown). Theydiffer slightly, however, on the reduction in static stability
Copyright c© 2011 Royal Meteorological Society Q. J. R. Meteorol. Soc. 138: 596–611 (2012)
606 J.-P. Chaboureau et al.
Figure 12. Results for ECMA at 0000, 0600, and 1200 UTC on 26 September 2006. Top: potential vorticity at 300 hPa (shaded, PVU), wind speed at300 hPa over 30 m s−1 (vector), ωdyn at 400 hPa less than −0.4 Pa s−1 (dotted) and CAPE larger than 1500 J kg−1 (hatched). The star and the figurein the white box give the position and MSLP minimum, respectively, of the mesocyclone. Bottom: vertical cross-section of potential vorticity (shaded,PVU), wind speed at 20 and 30 m s−1 (thick lines, hatched when larger than 30 m s−1), tangent wind (vector, with vertical component multiplied by afactor of 20), potential temperature (thin lines, every 10 K) and ωdyn less than −0.4 Pa s−1 (dots) along the lines shown on the top figures. This figure isavailable in colour online at wileyonlinelibrary.com/journal/qj
across the Strait of Sicily and the spatial extent of the positiveCAPE area, with larger CAPE values for ARPA and ECMA.
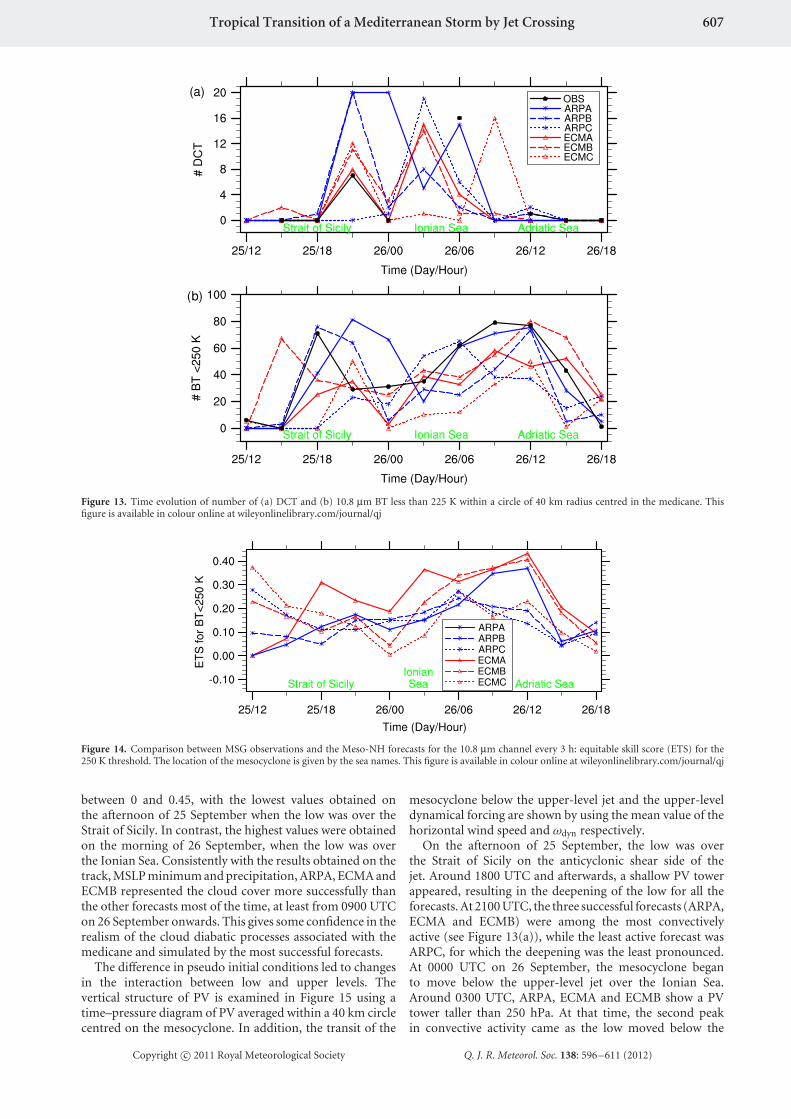
Because of differences in pseudo initial conditions, theconvective activity associated with the mesocyclone wascontrasted between the simulations as shown using atime–radius diagram of satellite diagnostics within a 40 kmcircle centred on the mesocyclone (Figure 13). AMSUobservations were taken as the closest to each 3-hourly time.They were missing at 1200 UTC 25 September and 0300 and0900 UTC 26 September. Using the DCT diagnostics, deepconvection was observed to be triggered in the vicinity of themesocyclone at 2100 UTC. Deep convection then decreasedat 0000 UTC on 26 September to further reintensify overthe Ionian Sea in the morning. The convective activitywas finally strongly reduced from 1200 UTC onwards.The temporal evolution observed by DCT was reproducedin most of the simulations, but with notable differencesin magnitude. In particular, ARPC and ECMC did notproduce any DCT at times when DCT was observed andpredicted by the other simulations. However, the time lagand missing data in AMSU observations and difficulties inaccurately representing the radiative properties of snow inthe microwave region (Meirold-Mautner et al., 2007) makethe comparison a little uncertain.
In contrast to AMSU observations, MSG providedmeasurements at the right time, which allowed a much fairer
comparison with the Meso-NH forecasts (Figure 13(b)).Here, the threshold of BT less than 250 K was chosen todiagnose deep, high clouds (as in Argence et al., 2009). A firstpeak in number of deep, high clouds occurred at 1800 UTCon 25 September. This corresponds to the development ofclouds forced by the orography of Sicily (see Figure 10). Asthe medicane intensified over the Ionian Sea, the numberof deep, high clouds steadily increased to a second peakat 0900 UTC on 26 September. This increase was correctlyreproduced by ARPA and, to a less extent, by ECMA andECMB. In contrast, ARPB and ECMC produced fewer deep,high clouds over the Ionian Sea, while the number of deep,high clouds decreased too early in ARPC.
The rather realistic forecasts provided by ARPA, ECMAand ECMB with respect to satellite images confirmthe success obtained for these simulations in terms oftrack, MLSP minimum and precipitation. A much largerdisagreement was found when looking at other forecasts. Forexample, clear sky was wrongly forecasted by ECMC over theIonian Sea north of 38◦N at 0000 UTC on 26 September. Thecloud assessment is summarized with a statistical evaluationof cloud cover forecasts based on MSG observations at10.8 µm. The Equitable Skill Score (ETS) for BT less than250 K is shown in Figure 14. ETS quantifies the ability ofthe model to forecast deep, high clouds at the right location.It was calculated over the inner domain. ETS values ranged
Copyright c© 2011 Royal Meteorological Society Q. J. R. Meteorol. Soc. 138: 596–611 (2012)
Tropical Transition of a Mediterranean Storm by Jet Crossing 607
Figure 13. Time evolution of number of (a) DCT and (b) 10.8 µm BT less than 225 K within a circle of 40 km radius centred in the medicane. Thisfigure is available in colour online at wileyonlinelibrary.com/journal/qj
Figure 14. Comparison between MSG observations and the Meso-NH forecasts for the 10.8 µm channel every 3 h: equitable skill score (ETS) for the250 K threshold. The location of the mesocyclone is given by the sea names. This figure is available in colour online at wileyonlinelibrary.com/journal/qj
between 0 and 0.45, with the lowest values obtained onthe afternoon of 25 September when the low was over theStrait of Sicily. In contrast, the highest values were obtainedon the morning of 26 September, when the low was overthe Ionian Sea. Consistently with the results obtained on thetrack, MSLP minimum and precipitation, ARPA, ECMA andECMB represented the cloud cover more successfully thanthe other forecasts most of the time, at least from 0900 UTCon 26 September onwards. This gives some confidence in therealism of the cloud diabatic processes associated with themedicane and simulated by the most successful forecasts.
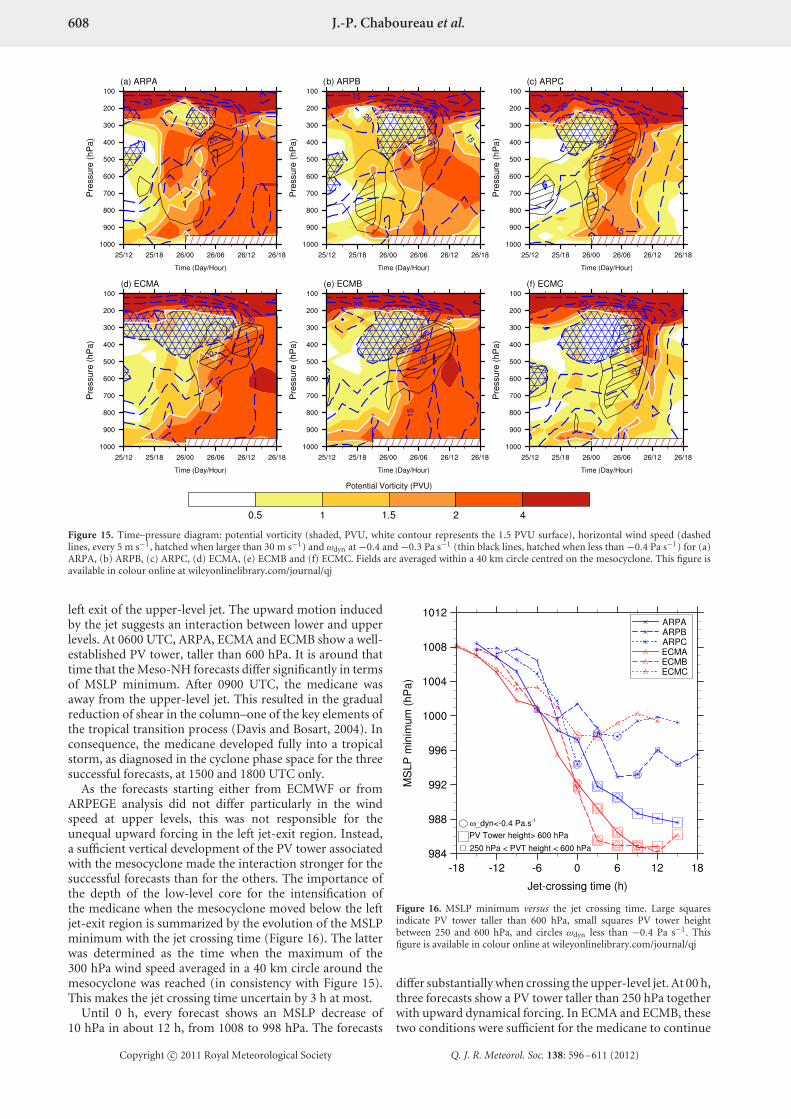
The difference in pseudo initial conditions led to changesin the interaction between low and upper levels. Thevertical structure of PV is examined in Figure 15 using atime–pressure diagram of PV averaged within a 40 km circlecentred on the mesocyclone. In addition, the transit of the
mesocyclone below the upper-level jet and the upper-leveldynamical forcing are shown by using the mean value of thehorizontal wind speed and ωdyn respectively.
On the afternoon of 25 September, the low was overthe Strait of Sicily on the anticyclonic shear side of thejet. Around 1800 UTC and afterwards, a shallow PV towerappeared, resulting in the deepening of the low for all theforecasts. At 2100 UTC, the three successful forecasts (ARPA,ECMA and ECMB) were among the most convectivelyactive (see Figure 13(a)), while the least active forecast wasARPC, for which the deepening was the least pronounced.At 0000 UTC on 26 September, the mesocyclone beganto move below the upper-level jet over the Ionian Sea.Around 0300 UTC, ARPA, ECMA and ECMB show a PVtower taller than 250 hPa. At that time, the second peakin convective activity came as the low moved below the
Copyright c© 2011 Royal Meteorological Society Q. J. R. Meteorol. Soc. 138: 596–611 (2012)
608 J.-P. Chaboureau et al.
Figure 15. Time–pressure diagram: potential vorticity (shaded, PVU, white contour represents the 1.5 PVU surface), horizontal wind speed (dashedlines, every 5 m s−1, hatched when larger than 30 m s−1) and ωdyn at −0.4 and −0.3 Pa s−1 (thin black lines, hatched when less than −0.4 Pa s−1) for (a)ARPA, (b) ARPB, (c) ARPC, (d) ECMA, (e) ECMB and (f) ECMC. Fields are averaged within a 40 km circle centred on the mesocyclone. This figure isavailable in colour online at wileyonlinelibrary.com/journal/qj
left exit of the upper-level jet. The upward motion inducedby the jet suggests an interaction between lower and upperlevels. At 0600 UTC, ARPA, ECMA and ECMB show a well-established PV tower, taller than 600 hPa. It is around thattime that the Meso-NH forecasts differ significantly in termsof MSLP minimum. After 0900 UTC, the medicane wasaway from the upper-level jet. This resulted in the gradualreduction of shear in the column–one of the key elements ofthe tropical transition process (Davis and Bosart, 2004). Inconsequence, the medicane developed fully into a tropicalstorm, as diagnosed in the cyclone phase space for the threesuccessful forecasts, at 1500 and 1800 UTC only.
As the forecasts starting either from ECMWF or fromARPEGE analysis did not differ particularly in the windspeed at upper levels, this was not responsible for theunequal upward forcing in the left jet-exit region. Instead,a sufficient vertical development of the PV tower associatedwith the mesocyclone made the interaction stronger for thesuccessful forecasts than for the others. The importance ofthe depth of the low-level core for the intensification ofthe medicane when the mesocyclone moved below the leftjet-exit region is summarized by the evolution of the MSLPminimum with the jet crossing time (Figure 16). The latterwas determined as the time when the maximum of the300 hPa wind speed averaged in a 40 km circle around themesocyclone was reached (in consistency with Figure 15).This makes the jet crossing time uncertain by 3 h at most.
Until 0 h, every forecast shows an MSLP decrease of10 hPa in about 12 h, from 1008 to 998 hPa. The forecasts
Figure 16. MSLP minimum versus the jet crossing time. Large squaresindicate PV tower taller than 600 hPa, small squares PV tower heightbetween 250 and 600 hPa, and circles ωdyn less than −0.4 Pa s−1. Thisfigure is available in colour online at wileyonlinelibrary.com/journal/qj
differ substantially when crossing the upper-level jet. At 00 h,three forecasts show a PV tower taller than 250 hPa togetherwith upward dynamical forcing. In ECMA and ECMB, thesetwo conditions were sufficient for the medicane to continue
Copyright c© 2011 Royal Meteorological Society Q. J. R. Meteorol. Soc. 138: 596–611 (2012)
Tropical Transition of a Mediterranean Storm by Jet Crossing 609
to deepen and to develop a PV tower taller than a 600 hPaheight. In ARPA, the upward forcing at 06 h resulted in arapid development of a tall PV tower. In ARPC, the medicanedid not develop despite a PV tower taller than 250 hPa andthe presence of dynamical forcing. This can be explained bythe track of the cyclone over land, which strongly reducedthe surface latent heat flux. From 06 h, the forecasts with aless developed PV tower (ARPB and ECMC) filled up anddecayed when crossing the upper-level jet. This suggests thatthese unsuccessful forecasts did not develop as the low-levelcore was not high enough to interact with the upper-leveltrough.
5. Summary and discussion
The medicane considered in this study appeared early inthe morning of 26 September 2006 over the Ionian Sea andmoved northeastwards, affecting Apulia, where wind gustsexceeding 40 m s−1 and an MSLP minimum of 986 hPawere recorded (Moscatello et al., 2008a), making this caseprobably the deepest medicane on record (Fita et al., 2007).Documented from both the observational (Moscatello et al.,2008b; Claud et al., 2010; Conte et al., 2011) and numerical(Moscatello et al., 2008a; Davolio et al., 2009; Miglietta et al.,2011) points of view, the role of the upper-level trough onthe intensification of the storm has been evaluated for thefirst time.
The upper-level trough was downstream of a Rossby waveperturbed by the extratropical transition of the ex-tropicalcyclone Helene that started on 22 September. This resulted invery poor forecasts of the medicane and its associated troughby the ECMWF model beyond lead times of 84 h. Workis currently under way to test whether a higher resolutionwould provide a better forecast of the extratropical transitionof Helene and of the medicane downstream (Pantillon et al.,2011). At shorter range, the forecast skill increased withdecreasing lead times. The best forecast from both ARPEGEand ECMWF was obtained when starting at 1200 UTC on25 September, in agreement with the results of Davolioet al. (2009). At that time, the southern tip of the upper-leveltrough was well sampled by radiosondes launched fromTunis and Trapani. Although a PV tower built upward,suggesting the tropical transition of the medicane into atropical storm, the low did not deepen enough. This wasattributed to the low resolution of the global model (about25 km) compared to the size of the storm (a diameter of60 km).
The Meso-NH forecasts performed better than their globalmodel counterparts. Three forecasts out of six reached theMSLP minimum of 986 hPa observed on the Salentinepeninsula. Comparisons with cloud cover and convectiveactivity observed from space confirmed the good qualityof the successful forecasts. The sensitivity of the Meso-NH forecasts to the initial conditions was explained by thereduced static stability found at the southern tip of the upper-level trough. This modified the convective activity in thevicinity of the mesocyclone during its transit over the IonianSea. A sufficiently vertically developed PV tower (deeper than600 hPa) then made the mesocyclone deepen explosivelywhen crossing the left jet-exit region. The resulting fulltropospheric PV tower classified the medicane as a tropicalstorm over the Adriatic Sea.
This study underlines the forcing by the upper-leveljet on the final stage of the medicane intensification and
its importance on the forecast skill. This is the first timethat such a mechanism has been shown for a medicane.While a deep, cut-off, cold core is usually observed atmid–upper tropospheric levels at the formation of amedicane, the upper-level jet is absent in most cases.Pytharoulis et al. (2000) discussed the potential importanceof the subtropical jet in a medicane case study, butthey concluded that the jet was too far away from themedicane to have promoted its evolution. In a case ofexplosive cyclogenesis resulting in the 40-year-record MSLPminimum of 972 hPa over the eastern Mediterranean, theinfluence of a very intense upper-level jet was seen to becrucial for the intensification of the ‘bomb’, but not becauseof jet crossing. Instead, Lagouvardos et al. (2007) invoke thenegative (cyclonic) tilting of the trough that forms a bulb ofpositive PV anomaly leading to a local destabilization of theatmosphere right above the cyclone.
The intensification of the storm as it crossed the left jet-exit region was seen to be the key factor in the explosivedevelopment of Lothar, a North Atlantic storm that hitwestern Europe in December 1999 (Wernli et al., 2002). Avertically aligned tower of positive PV was formed from themerging of a stratospheric PV anomaly with the diabaticallyproduced PV feature at the time of maximum stormintensity. The absence of cloud diabatic heating inhibitedthe rapid intensification of Lothar (Wernli et al., 2002).Although not tested here, a similar inhibition was obtainedfor the medicane when the latent heat release was switched offin sensitivity experiments (Moscatello et al., 2008a; Davolioet al., 2009).
It would be interesting to evaluate the role of the upper-level jet using a PV inversion technique as in Argenceet al. (2009), for example. However, modifying the upper-level trough would change the triggering of convection;hence the development of the medicane over the IonianSea before its passage below the upper-level jet. Therefore,the task of evaluating the role of the upper-level troughwith respect to convection would be difficult. Furthermore,convection triggered over sea is often difficult to predictaccurately in the short term (e.g. Clark and Chaboureau,2010). Perturbation studies could be conducted to lookat the sensitivity of the medicane predictability to therepresentation of these key elements.
Acknowledgement
The authors thank Gwenaelle Paque for her preliminaryresults, which inspired the present work, Jean-PierreCammas for the use of the AB omega inversion code, andthe anonymous referees for their constructive comments.This study was sponsored by the French Ministry ofResearch through project ANR-VMC2007 ‘Forecast andprojection in climate scenario of Mediterranean intenseevents: Uncertainties and Propagation on environment’(MedUP) and by the Institut National des Sciences del’Univers through the EPIGONE project. Florian Pantillonwas supported by a CNRS and Meteo-France PhD grant.Computer resources were allocated by GENCI (project90569). MSG observations were obtained from SATMOS.AMSU data were obtained through the French Mixed ServiceUnit ICARE. QuikScat data are produced by Remote SensingSystems and sponsored by the NASA Ocean Vector WindsScience Team.
Copyright c© 2011 Royal Meteorological Society Q. J. R. Meteorol. Soc. 138: 596–611 (2012)
610 J.-P. Chaboureau et al.
References
Anwender D, Harr PA, Jones SC. 2008. Predictability associated withthe downstream impacts of the extratropical transition of tropicalcyclones: case studies. Mon. Weather Rev. 136: 3226–3247.
Argence S, Lambert D, Richard E, Chaboureau JP, Sohne N. 2008.Impact of initial conditions uncertainties on the predictability ofheavy rainfall in the Mediterranean: a case study. Q. J. R. Meteorol.Soc. 134: 1775–1788.
Argence S, Lambert D, Richard E, Chaboureau JP, Arbogast P,Maynard K. 2009. Improving the numerical prediction of a cyclone inthe Mediterranean by local potential vorticity modifications. Q. J. R.Meteorol. Soc. 135: 865–879.
Bechtold P, Bazile E, Guichard F, Mascart P, Richard E. 2001. A mass fluxconvection scheme for regional and global models. Q. J. R. Meteorol.Soc. 127: 869–886.
Campins J, Jansa A, Genoves A. 2006. Three-dimensional structure ofwestern Mediterranean cyclones. Int. J. Climatol. 26: 323–343.
Chaboureau JP, Bechtold P. 2002. A simple cloud parameterizationderived from cloud resolving model data: diagnostic and prognosticapplications. J. Atmos. Sci. 59: 2362–2372.
Chaboureau JP, Bechtold P. 2005. Statistical representation ofclouds in a regional model and the impact on the diurnal cycleof convection during tropical convection, cirrus and nitrogenoxides (TROCCINOX). J. Geophys. Res. 110: D17103, DOI: 10.1029/2004JD005645.
Chaboureau JP, Claud C. 2006. Satellite-based climatology ofMediterranean cloud systems and their association with large-scale circulation. J. Geophys. Res. 111: D01102, DOI: 10.1029/2005JD006460.
Chaboureau JP, Pinty JP. 2006. Validation of a cirrus parameterizationwith Meteosat Second Generation observations. Geophys. Res. Lett.33: L03815, DOI: 10.1029/2005GL024725.
Chaboureau JP, Sohne N, Pinty JP, Meirold-Mautner I, Defer E,Prigent C, Pardo JR, Mech M, Crewell S. 2008. A midlatitudecloud database validated with satellite observations. J. Appl. Meteorol.Climatol. 47: 1337–1353.
Clark H, Chaboureau JP. 2010. Uncertainties in short-term forecasts of aMediterranean heavy precipitation event: assessment with satelliteobservations. J. Geophys. Res. 115: D22213, DOI: 10.1029/2010JD014388.
Claud C, Alahmmoud B, Funatsu BM, Chaboureau JP. 2010.Mediterranean hurricanes: large-scale environment and convectiveand precipitating areas from satellite microwave observations. Nat.Hazards Earth Syst. Sci. 10: 2199–2213.
Conte D, Miglietta MM, Levizzani V. 2011. Analysis of instability indicesduring the development of a Mediterranean tropical-like cycloneusing MSG-SEVIRI products and the LAPS model. Atmos. Res. 101:264–279.
Cuxart J, Bougeault P, Redelsperger JL. 2000. A turbulence schemeallowing for mesoscale and large-eddy simulations. Q. J. R. Meteorol.Soc. 126: 1–30.
Davies-Jones R. 1991. The frontogenetical forcing of secondarycirculations. Part I: The duality and generalization of the Q vector. J.Atmos. Sci. 48: 497–509.
Davis CA, Bosart LF. 2004. The TT problem. Bull. Am. Meteorol. Soc. 85:1657–1662.
Davolio S, Miglietta MM, Moscatello A, Pacifico F, Buzzi A, Rotunno R.2009. Numerical forecast and analysis of a tropical-like cyclone in theIonian Sea. Nat. Hazards Earth Syst. Sci. 9: 551–562.
Fita L, Romero R, Luque A, Emanuel K, Ramis C. 2007. Analysis of theenvironments of seven Mediterranean tropical-like storms using anaxisymmetric, nonhydrostatic, cloud resolving model. Nat. HazardsEarth Syst. Sci. 7: 41–56.
Funatsu BM, Claud C, Chaboureau JP. 2007. Potential of AdvancedMicrowave Sounding Unit to identify precipitating systems andassociated upper-level features in the Mediterranean region: casestudies. J. Geophys. Res. 112: D17113, DOI: 10.1029/2006JD008297.
Funatsu BM, Claud C, Chaboureau JP. 2009. Comparison between thelarge-scale environment of moderate and intense precipitating systemsin the Mediterranean region. Mon. Weather Rev. 137: 3933–3959.
Gregory D, Morcrette JJ, Jakob C, Beljaars AM, Stockdale T. 2000.Revision of convection, radiation and cloud schemes in the ECMWFmodel. Q. J. R. Meteorol. Soc. 126: 1685–1710.
Harr PA, Anwender D, Jones SC. 2008. Predictability associated withthe downstream impacts of the extratropical transition of tropicalcyclones: methodology and a case study of Typhoon Nabi (2005).Mon. Weather Rev. 136: 3205–3225.
Hart RE. 2003. A cyclone phase space derived from thermal wind andthermal asymmetry. Mon. Weather Rev. 131: 585–616.
Homar V, Romero R, Stensrud D, Ramis C, Alonso S. 2003. Numericaldiagnosis of a small, quasi-tropical cyclone over the westernMediterranean: dynamical vs. boundary factors. Q. J. R. Meteorol.Soc. 129: 1469–1490.
Jones SC, Harr PA, Abraham J, Bosart LF, Bowyer PJ, Evans JL,Hanley DE, Hanstrum BN, Hart RE, Lalaurette F, Sinclair MR,Smith RK, Thorncroft C. 2003. The extratropical transition oftropical cyclones: forecast challenges, current understanding, andfuture directions. Weather Forecast. 18: 1052–1092.
Lafore JP, Stein J, Asencio N, Bougeault P, Ducrocq V, Duron J,Fischer C, Hereil P, Mascart P, Masson V, Pinty JP, Redelsperger JL,Richard E, Vila-Guerau de Arellano J. 1998. The Meso–NHAtmospheric Simulation System. Part I: Adiabatic formulation andcontrol simulations. Scientific objectives and experimental design.Ann. Geophys. 16: 90–109.
Lagouvardos K, Kotroni V, Nickovic S, Jovic D, Kallos G. 1999.Observations and model simulations of a winter sub-synoptic vortexover the central Mediterranean. Meteorol. Appl. 6: 371–383.
Lagouvardos K, Kotroni V, Defer E. 2007. The 21–22 January 2004explosive cyclogenesis over the Aegean Sea: observations and modelanalysis. Q. J. R. Meteorol. Soc. 133: 1519–1531.
Laviola S, Miglietta MM, Levizzani V. 2011. Satellite and numericalmodel investigation of two mesoscale convective systems over centralMediterranean. J. Hydrometeorol. 12: 634–649.
Mallet I, Cammas JP, Mascart P, Bechtold P. 1999. Effects of clouddiabatic heating on the early development of the FASTEX IOP17cyclone. Q. J. R. Meteorol. Soc. 125: 3439–3467.
McTaggart-Cowan R, Galarneau RJ Jr, Bosart LF, Milbrandt JA. 2010.Development and tropical transition of an Alpine lee cyclone. Part I:Case analysis and evaluation of numerical guidance. Mon. WeatherRev. 138: 2281–2307.
Meirold-Mautner I, Prigent C, Defer E, Pardo JR, Chaboureau JP,Pinty JP, Mech M, Crewell S. 2007. Radiative transfer simulationsusing mesoscale cloud model outputs: comparisons with passivemicrowave and infrared satellite observations for mid-latitudes. J.Atmos. Sci. 64: 1550–1568.
Miglietta MM, Moscatello A, Conte D, Mannarini G, Lacorata G,Rotunno R. 2011. Numerical analysis of a Mediterranean ‘hurricane’over south-eastern Italy: sensitivity experiments to sea surfacetemperature. Atmos. Res. 101: 412–426.
Mlawer EJ, Taubman SJ, Brown PD, Iacono MJ, Clough SA. 1997.Radiative transfer for inhomogeneous atmospheres: RRTM, avalidated correlated-k model for the longwave. J. Geophys. Res. 102D:16663–16682.
Moscatello A, Miglietta MM, Rotunno R. 2008a. Numerical analysis of aMediterranean ‘hurricane’ over southeastern Italy. Mon. Weather Rev.136: 4373–4397.
Moscatello A, Miglietta MM, Rotunno R. 2008b. Observational analysisof a Mediterranean ‘hurricane’ over southeastern Italy. Weather 63:306–311.
Noilhan J, Planton S. 1989. A simple parameterization of landsurface processes for meteorological models. Mon. Weather Rev. 117:536–549.
Pantillon F, Mascart P, Chaboureau JP, Lac C, Escobar J, Duron J. 2011.Seamless MESO-NH modeling over very large grids. C. R. Mecanique339: 136–140.
Pinty JP, Jabouille P. 1998. A mixed-phase cloud parameterization foruse in a mesoscale non-hydrostatic model: simulations of a squallline and of orographic precipitations. In Conference on Cloud Physics.American Meteorological Society: Everett, WA; 217–220.
Pyle ME, Keyser D, Bosart LF. 2004. Diagnostic study of jet streaks:kinematic signatures and relationship to coherent tropopausedisturbances. Mon. Weather Rev. 132: 297–319.
Pytharoulis I, Craig GC, Ballard S. 2000. The hurricane-likeMediterranean cyclone of January 1995. Meteorol. Appl. 7: 261–279.
Reale O, Atlas R. 2001. Tropical cyclone-like vortices in the extratropics:observational evidence and synoptic analysis. Weather Forecast. 16:7–34.
Riemer M, Jones SC. 2010. Downstream impact of tropical cyclones ona developing baroclinic wave in idealized scenarios of extratropicaltransition. Q. J. R. Meteorol. Soc. 136: 617–637.
Riemer M, Jones SC, Davis CA. 2008. The impact of extratropicaltransition on the downstream flow: An idealized modelling study witha straight jet. Q. J. R. Meteorol. Soc. 134: 69–91.
Sanders F, Gyakum JR. 1980. Synoptic-dynamic climatology of the‘bomb’. Mon. Weather Rev. 108: 1589–1606.
Sohne N, Chaboureau JP, Guichard F. 2008. Verification of cloud coverforecast with satellite observation over West Africa. Mon. WeatherRev. 136: 4421–4434.
Copyright c© 2011 Royal Meteorological Society Q. J. R. Meteorol. Soc. 138: 596–611 (2012)

Tropical Transition of a Mediterranean Storm by Jet Crossing 611
Stein J, Richard E, Lafore JP, Pinty JP, Asencio N, Cosma S. 2000.High-resolution non-hydrostatic simulations of flash-flood episodeswith grid-nesting and ice-phase parameterization. Meteorol. Atmos.Phys. 72: 203–221.
Uccellini LW. 1986. The possible influence of upstream upper-level
baroclinic processes on the development of the QE II storm. Mon.Weather Rev. 114: 1019–1027.
Wernli H, Dirren S, Liniger MA, Zillig M. 2002. Dynamical aspects ofthe life cycle of the winter storm ‘Lothar’ (24–26 December 1999). Q.J. R. Meteorol. Soc. 128: 405–429.
Copyright c© 2011 Royal Meteorological Society Q. J. R. Meteorol. Soc. 138: 596–611 (2012)