Embed Size (px)
Citation preview

CHUVA reveals very diverse cloud processes in tropical continental regions
and contributes to improving satellite precipitation estimation, nowcasting,
cloud-resolving models, and the understanding of cloud electrification.
THE CHUVA PROJECTHow Does Convection Vary across Brazil?
by Luiz A. T. MAchAdo, MAriA A. F. SiLvA diAS, cArLoS MorALeS, GiLberTo FiSch, dAnieL viLA, rAcheL ALbrechT, STeven J. GoodMAn, ALAn J. P. cALheiroS, ThiAGo biScAro, chriSTiAn KuMMerow,
JuLiA cohen, dAvid FiTzJArrALd, ernAni L. nASciMenTo, Meiry S. SAKAMoTo, chriSToPher cunninGhAM, JeAn-Pierre chAboureAu, wALTer A. PeTerSen, dAvid K. AdAMS, LucA bALdini, cArLoS F. AnGeLiS, Luiz F. SAPucci, PAoLA SALio, henrique M. J. bArboSA, eduArdo LAnduLFo, rodriGo A. F. SouzA,
richArd J. bLAKeSLee, JeFFrey bAiLey, SAuLo FreiTAS, wAGner F. A. LiMA, And ALi ToKAy
T he CHUVA project—CHUVA, meaning “rain” in Portuguese, is the acronym for the Cloud Processes of the Main Precipitation Systems in
Brazil: A Contribution to Cloud-Resolving Modeling and to the Global Precipitation Measurement (GPM)—began in 2010 and has conducted five field campaigns; the last experiment will be held in Manaus as part of the Green Ocean Amazon (GoAmazon) experiment in 2014 (see http://campaign.arm.gov /goamazon2014/ for a detailed description). CHUVA’s main scientific motivation is to contribute to the understanding of cloud processes, which represent one of the least understood components of the cli-mate system.
Brazil has an area of 8.5 million square kilometers and lies primarily south of the equator and within the tropics. Therefore, Brazil is ideally situated for study-ing tropical continental convection over a broad range of precipitation regimes within a single country. In northeastern Brazil, a semiarid region, the CHUVA project was designed to characterize warm clouds (Costa et al. 2000) and the organized convection influenced by the intertropical convergence zone and easterly waves (Kouadio et al. 2012). Cotton (1982) defines warm clouds as clouds in which the ice phase
does not play a substantial role in the precipitation process. In the Amazon, specifically in the Belém and Manaus regions, the main targeted precipitation regimes were tropical squall lines (Cohen et al. 1995); local convection, which is strongly forced by the diurnal cycle (Machado et al. 2002); and mesoscale convective systems (Rickenbach 2004). In southern Brazil, at the boundary of the tropical and subtropical regions, CHUVA measured the convection associ-ated with cold fronts (Garreaud 2000), mesoscale convective complexes (Salio et al. 2007), and strongly electrified convection (Cecil and Blankenship 2012). The field campaigns in each of these regions collected detailed observations of various rainfall regimes over a tropical continental region to improve our under-standing of cloud processes. The campaigns focused on the following applications: satellite precipitation estimation, cloud-resolving models, nowcasting, and cloud electrification. CHUVA is contributing to the National Aeronautics and Space Administra-tion (NASA)–Japan Aerospace Exploration Agency (JAXA) GPM, the National Oceanic and Atmospheric Administration (NOAA) Geostationary Operational Environmental Satellite R-series (GOES-R), and the GoAmazon programs.
1365SEPTEMBER 2014AMERICAN METEOROLOGICAL SOCIETY |

Schumacher and Houze (2003) demonstrated large seasonal and regional variability in the stratiform rain fraction (the contribution of stratiform pre-cipitation to the total precipitation) over Brazil using the Tropical Rainfall Measuring Mission (TRMM) Precipitation Radar (PR). Precipitation estimation has been noticeably improved by the TRMM and the development of new algorithms (Tapiador et al. 2012). However, precipitation estimation over land using passive radiometers still has several deficiencies. Specifically, precipitation is indirectly estimated (Berg et al. 2006). Moreover, precipitation from warm clouds is largely underestimated, especially when using microwave radiometers, and contributes (7.5% on average) to the total rainfall in tropical coastal regions (Liu and Zipser 2009). Over land, microwave satellite precipitation estimates exploit the relation-ship between ice aloft and rainfall at the surface. Because these clouds have no ice, the precipitation estimates for warm-cloud rainfall are inaccurate. For example, during November 2008, 283 mm of rainfall, mostly from orographic warm clouds, was measured by rain gauge over 24 h in southeast-ern Brazil. However, only very light precipitation amounts (approximately 30 mm) were estimated using satellite data (Silva Dias 2009). Williams and Stanfill (2002) discuss the formation of warm-cloud rainfall in the context of cloud condensation nuclei and updrafts and contrast the marine and continental environments.
The passive microwave rainfall sensors used by the GPM constellation to achieve 3-h rainfall esti-mates have largely relied on ice scattering signals
to convert brightness temperature depressions into rainfall rates over continental regions. The CHUVA field campaigns, in addition to their focus on the microphysical properties of tropical clouds, have an important role in improving existing algorithms for precipitation retrieval for the GPM mission. There-fore, an important component of CHUVA was to provide a homogeneous dataset to the community that supports GPM algorithm development in both warm- and cold-phase clouds. As mentioned, warm-rain clouds are particularly challenging for the passive microwave remote sensing of precipitation. CHUVA data will help address this issue.
The dataset collected in this project, combined with cloud modeling, is expected to create a solid basis for the development of improved database on cloud process over the continental tropics. This dataset contains hydrometeor classifications, thermody-namics profiles, rainfall drop size distributions, and several remote sensing (both active and passive) cloud property measurements. Realistic parameterizations of cloud processes are a prerequisite for reliable cur-rent and future climate simulations. Meteorological models, at very high resolution, explicitly describe cloud processes to a large degree; however, the cloud microphysics and turbulent processes require param-eterization. Morrison and Grabowski (2007) demon-strate the large sensitivity of high-resolution simula-tions to the microphysical parameterizations. The CHUVA dataset, combining model, satellite, radar, radiometer, and other in situ data, will provide an opportunity to validate and improve cloud-resolving models over various tropical continental regions.
AFFILIATIONS: MAchAdo, viLA, ALbrechT, cALheiroS, biScAro, cunninGhAM, AnGeLiS, SAPucci, FreiTAS, And LiMA—Centro de Previsão de Tempo e Estudos Climáticos, Instituto Nacional de Pesquisas Espaciais, São José dos Campos, Brazil; SiLvA diAS And MorALeS—Instituto de Astronomia, Geofísica e Ciências Atmosféricas, Universidade de São Paulo, São Paulo, Brazil; FiSch—Instituto de Aeronaútica e Espaço, Departamento de Ciência e Tecnologia Aeroespacial, São Paulo, Brazil; Goodman—GSFC, Greenbelt, Maryland; KuMMerow—Cooperative Institute for Research in the Atmosphere, Colorado State University, Fort Collins, Colorado; Cohen—Instituto de Geociências, Universidade Federal do Pará, Belém, Pará, Brazil; FiTzJArrALd—Atmospheric Sciences Research Center, University at Albany, State University of New York, Albany, New York; nASciMenTo—Departamento de Física, Universidade Federal de Santa Maria, Santa Maria, Rio Grande do Sul, Brazil; SAKAMoTo—Fundação Cearense de Meteorologia, Fortaleza, Brazil; chAboureAu—Laboratoire d’Aérologie, University of Toulouse, Toulouse, France; PeTerSen—NASA Wallops Flight Facility, Wallops Island, Virginia; AdAMS—Centro de Ciencias de la Atmósfera, Universidad Nacional Autónoma de México, Mexico City, Mexico;
bALdini—Istituto di Scienze dell’Atmosfera e del Clima, CNR, Rome, Italy; SALio—Universidade de Buenos Aires, Buenos Aires, Argentina; bArboSA—Instituto de Física, Universidade de São Paulo, São Paulo, Brazil; LAnduLFo—Instituto de Pesquisas Energéticas e Nucleares, São Paulo, Brazil; SouzA—Universidade do Estado do Amazonas, Manaus, Amazonas, Brazil; bLAKeSLee—NASA Marshall Space Flight Center, Huntsville, Alabama; bAiLey—University of Alabama in Huntsville, Huntsville, Alabama; ToKAy—University of Maryland, Baltimore County, Baltimore, MarylandCORRESPONDING AUTHOR: Luiz A. T. Machado, Centro de Previsão de Tempo e Estudos Climáticos, Instituto Nacional de Pesquisas Espaciais, Rodovia Pres. Dutra, km 40, Brasil, Cachoeira Paulista/SP, 12630-000 Brazil.E-mail: [email protected]
The abstract for this article can be found in this issue, following the table of contents.DOI:10.1175/BAMS-D-13-00084.1
In final form 2 March 2014©2014 American Meteorological Society
1366 SEPTEMBER 2014|

GOES-R, the next generation of NOAA geosta-tionary satellites, includes a new capability for total lightning detection from the Geostationary Lightning Mapper (GLM). The GLM will aid in forecasting severe storms and tornadic activity and will address convective weather impacts on aviation safety and efficiency (Goodman et al. 2013). The CHUVA measurements provide a high-fidelity dataset for GLM application development in continental tropi-cal regions.
This study outlines the motivation for develop-ing the CHUVA project and general information on the measurement strategy and how to access the database and the project web page. Additionally, this study presents a specific description of each field experiment, a discussion of the preparation for the final campaign, and a summary of the main results and activities for project outreach.
MOTIVATION. CHUVA’s principal motivation is the description and understanding of the cloud processes of the various precipitation regimes of Brazil. The expected results include improved satellite precipitation estimates, especially from warm clouds; cloud-resolving model evaluation; development of nowcasting techniques for intense thunderstorms; and an improved understanding of the cloud electri-fication processes in the tropics and subtropics. The CHUVA project addresses the following questions:
• How can satellite estimates of warm-cloud precipi-tation be improved?
• How can GPM satellite-based retrievals of rainfall over the continent be improved?
• What are the typical cloud processes that occur in the main precipitation regimes of Brazil?
• What are the major surface and boundary layer processes relevant to the formation and mainte-nance of clouds?
• What are the primary processes in the evolution from shallow to deep convection, and how do cloud microphysical and electrification processes evolve during this transition and cloud life cycle?
• How can the representation of clouds and accuracy be improved in cloud-resolving models, especially for intense thunderstorms?
• How can all of the acquired knowledge be utilized to improve nowcasting and forecasting in tropical regions?
To answer these questions, the CHUVA project focused on collecting data that describe the mul-tidimensional structure of clouds in different
precipitation regimes. These data include 1) the selected cloud properties from X-band dual-polarization radar (X-Pol) and Micro Rain Radar (MRR) data; 2) satellite and radar precipitation fields, cloud-type classification, and cloud and rain cell life cycles; 3) the electric fields and lightning associated with clouds from the lightning network and field mills (an electromechanical device that measures the strength of the electrostatic field at the surface), which are essential for describing thunderstorm elec-trification processes; and 4) mesoscale atmospheric conditions and surface fluxes from rawinsondes and from towers to assess the atmospheric dynamical and thermodynamic properties. These data are combined with a cloud-resolving model [the Brazilian version of the Regional Atmospheric Modeling System (BRAMS)] to describe the typical cloud processes of the various precipitation regimes. As proposed by Negri et al. (2014), comparing satellite and/or radar measurements with virtual images simulated by radiative transfer and cloud-resolving model outputs can validate the model and create a microphysical database.
These datasets are specifically used to 1) test dif-ferent methodologies for estimating warm-cloud precipitation; 2) evaluate the possible relationships between integrated ice content, electrification, and precipitation as functions of the cloud life stage; 3) employ different satellite rainfall algorithms and assess the associated regional errors; 4) describe the temporal evolution of the electrical field during thun-derstorm development in conjunction with the radar polarimetric variables; 5) investigate the column-integrated atmospheric water vapor during periods preceding intense thunderstorms; and 6) analyze the capability of cloud-resolving models to describe the microphysical properties and the effect of the turbulence parameterization on cloud organization.
EXPERIMENTAL DESIGN. Sites and measure-ment strategies. CHUVA consists of six field cam-paigns, five of which have already taken place. The sixth will be carried out in 2014 in Manaus as part of the GoAmazon initiative (http://campaign.arm.gov /goamazon2014/). Figure 1 (left) shows the experi-mental sites of the CHUVA projects and illustrates the main precipitation regime expected in each region. Figure 1 (right) also shows a schematic representation of the measurement strategy employed in the CHUVA campaigns. A primary instrument used for CHUVA is a mobile X-band dual-polarization (dual-pol) radar. Schneebeli et al. (2012) give a detailed description of the radar, operation, and data processing. The
1367SEPTEMBER 2014AMERICAN METEOROLOGICAL SOCIETY |

radar scan strategy consists of a volume scan with 10–14 elevations (depending on the main type of clouds targeted) and at least one range–height in-dicator (RHI) scan along the direction of the main instrumentation site. The RHI is performed with an antenna rotation rate of 9° s–1, a high angular resolu-tion (every 0.50°), and a high sampling frequency (obtained using 150 samples per ray) to ensure a high vertical resolution and data accuracy. The en-tire procedure (strategy) also includes a differential reflectivity (ZDR) offset check using a vertical mea-surement along the column above the radar. Figure 1 presents a typical description of the measurement strategy. The distance between the radar site and the main site is approximately 20 km; the main site is equipped with the following basic instruments (see Table 1 for a detailed description): impact (Joss–Valdwogel) and laser [OTT Particle Size and Velocity (PARSIVEL) and Thies] disdrometers; rain gauges (tipping bucket employed in a dual-gauge configura-tion at the main site); and a microwave radiometer (MP3000A with 35 channels) ranging from 22.00 to 30.00 GHz (21 channels), a range associated with water vapor emissions, and from 51.00 to 59.00 GHz (14 channels), a range associated with molecular oxygen emissions (Ware et al. 2003). Additionally, the main site instrumentation includes one verti-cally pointing K-Band (24.1 GHz) Micro Rain Radar [see Peters et al. (2005) for a detailed description], a Raman lidar at 532/604 nm, a GPS dual-frequency re-ceiver to retrieve the column-integrated atmospheric water (Sapucci et al. 2007), a field mill, and a surface weather station to measure surface latent and sensible
heat f luxes, soil moisture, and temperature. In addi-tion to the main site, two to four other sites instru-mented with disdrometers, rain gauges, a GPS receiver, and field mills (variable number) were installed at various distances from the radar. Rawinsondes were routinely released (at least twice a day). During spe-cific intensive observation periods (IOPs), a triangle of rawinsondes in a nearly equilateral arrangement was launched four times a day (0000, 0600, 1200, and 1800 UTC).
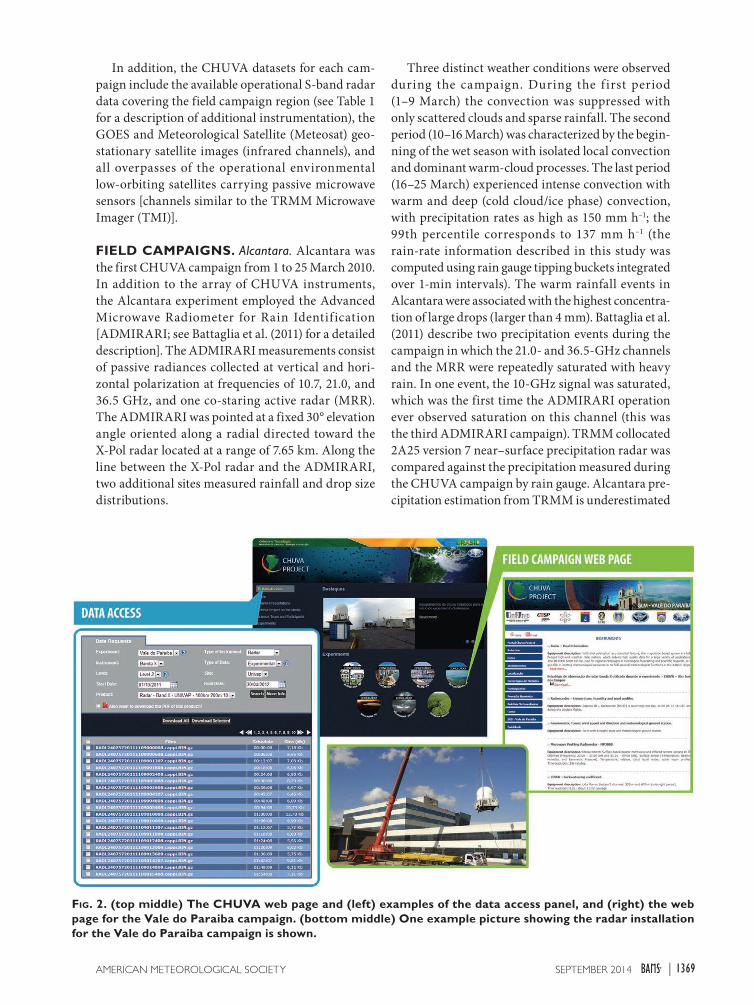
Data access and the CHUVA web page. The CHUVA website (http://chuvaproject.cptec.inpe.br) is the primary access to the CHUVA information and data. For each campaign, a specific web page was devel-oped (Fig. 2). These web pages contain a wide variety of information, including the daily weather report, instrument strategy, instrument locations, quick looks of the main events, data reports, cloud pictures, and the Severe Storm Observation System CHUVA (SOS-CHUVA), a geographical information system that utilizes data from the CHUVA project and allows retrospective access to the radar, satellite, and model images, when available. The use of SOS-CHUVA for nowcasting will be discussed in more detail in the “CHUVA outreach” section. The CHUVA dataset has been preprocessed and is available through the CHUVA website. Data can be accessed at different levels. For example, level 0 data from the X-band radar are raw data in ASCII and universal format (UF), level 1 data consist of the attenuation-corrected (ZH and ZDR) data in ASCII and UF [see Testud et al. (2000) for a detailed description of the attenuation correction], and level 2 data consist of the corrected reflectivity constant altitude plan position indicators (CAPPIs) at various altitude levels. Additional corrections, such as the correction for bias due to a wet radome and the ZDR offset adjustment, are not applied in this dataset. However, instructions and tables are accessible to the users for their own applications. Data for each instru-ment come with a “readme” file with information about the data and how to manipulate the files. All raw data and several processed data (level 2) are publicly available through the CHUVA website.
Fig. 1. (left) A description of the CHUVA field campaigns over Brazil and an illustration of the main precipitation regimes. (right) The reference measure-ment strategy adopted during the field campaigns, along with the radar site and main site with other ground instruments.
1368 SEPTEMBER 2014|
In addition, the CHUVA datasets for each cam-paign include the available operational S-band radar data covering the field campaign region (see Table 1 for a description of additional instrumentation), the GOES and Meteorological Satellite (Meteosat) geo-stationary satellite images (infrared channels), and all overpasses of the operational environmental low-orbiting satellites carrying passive microwave sensors [channels similar to the TRMM Microwave Imager (TMI)].
FIELD CAMPAIGNS. Alcantara. Alcantara was the first CHUVA campaign from 1 to 25 March 2010. In addition to the array of CHUVA instruments, the Alcantara experiment employed the Advanced Microwave Radiometer for Rain Identification [ADMIRARI; see Battaglia et al. (2011) for a detailed description]. The ADMIRARI measurements consist of passive radiances collected at vertical and hori-zontal polarization at frequencies of 10.7, 21.0, and 36.5 GHz, and one co-staring active radar (MRR). The ADMIRARI was pointed at a fixed 30° elevation angle oriented along a radial directed toward the X-Pol radar located at a range of 7.65 km. Along the line between the X-Pol radar and the ADMIRARI, two additional sites measured rainfall and drop size distributions.
Three distinct weather conditions were observed during the campaign. During the f irst period (1–9 March) the convection was suppressed with only scattered clouds and sparse rainfall. The second period (10–16 March) was characterized by the begin-ning of the wet season with isolated local convection and dominant warm-cloud processes. The last period (16–25 March) experienced intense convection with warm and deep (cold cloud/ice phase) convection, with precipitation rates as high as 150 mm h–1; the 99th percentile corresponds to 137 mm h–1 (the rain-rate information described in this study was computed using rain gauge tipping buckets integrated over 1-min intervals). The warm rainfall events in Alcantara were associated with the highest concentra-tion of large drops (larger than 4 mm). Battaglia et al. (2011) describe two precipitation events during the campaign in which the 21.0- and 36.5-GHz channels and the MRR were repeatedly saturated with heavy rain. In one event, the 10-GHz signal was saturated, which was the first time the ADMIRARI operation ever observed saturation on this channel (this was the third ADMIRARI campaign). TRMM collocated 2A25 version 7 near–surface precipitation radar was compared against the precipitation measured during the CHUVA campaign by rain gauge. Alcantara pre-cipitation estimation from TRMM is underestimated
Fig. 2. (top middle) The CHUVA web page and (left) examples of the data access panel, and (right) the web page for the Vale do Paraiba campaign. (bottom middle) One example picture showing the radar installation for the Vale do Paraiba campaign is shown.
1369SEPTEMBER 2014AMERICAN METEOROLOGICAL SOCIETY |

by more than 50%. Of all the campaigns to date, Alcantara has the highest average rainfall rate from warm clouds (7.2 mm h–1), one of the largest vertically integrated water vapor values, and high cloud water contents for nonprecipitating clouds (0.34 mm), only slightly smaller than observed in Belém. Alcantara also has the highest CAPE; the 99th percentile cor-responds to 1950 J kg–1.
Fortaleza. The data collection period spanned 3– 28 April 2011, during the rainy season. The main site was installed in the yard of the Civil Defense Organization (the organization responsible for responding to natural disasters) in Fortaleza. A partnership with Fundação Cearense de Meteorologia e Recursos Hídricos (FUNCEME) was established for
monitoring intense thunderstorms. The X-Pol radar was installed in the city of Osorio, 20.5 km from the main CHUVA site. Additionally, three more sites with disdrometers, rain gauges, and GPS receivers were installed around Fortaleza, and the most distant was 32.6 km from the radar. Given that the focus of this campaign was warm-cloud processes and deep con-vection associated with the intertropical convergence zone (ITCZ), a volume scan strategy was implemented with 13 elevations focusing on both the lower and upper troposphere (i.e., warm and deep cloud types). As already mentioned, the strategy for all campaigns included a ZDR offset check and RHIs scans. For Fortaleza, two RHI scans were performed: one over the main site and another at 180°, perpendicular to the coast, where most systems propagate into the
Table 1. Description of the experiment period, additional instruments, and the radars employed during each campaign, and a description of the instruments at the main site.
Experiment Period Additional instruments Radars
Alcantara 1–25 Mar 2010 ADIMIRARI radiometer EEC X-band dual-pol
Fortaleza 3–28 Apr 2011 — Gematronik Meteor 50DX X-Pol
Belém 1–30 Jun 2011Controlled meteorological balloons and GPS network
Gematronik Meteor 50DX X-Pol and S-band Doppler
Vale do Paraiba 1 Nov 2011–31 Mar 2012Lightning detection networks
and high-speed camerasGematronik Meteor 50DX X-Pol
and 2 S-band Doppler
Santa Maria 5 Nov–12 Dec 2012Mesoscale network of
automated weather stationIACIT 2 S-band Doppler
Main site
Instruments Manufacture Measurement Retrieval parameter
Microwave radiometer
MP3000A (Radiometrics)35 microwave brightness
temperature channels [22–30 and 51–59; IR channel (9–11 µm)]
Temperature, humidity, water vapor density, and liquid water
profiles and integration
DisdrometerJoss–Valdwogel (RD-80, Disdromet
Ltd.) and PARSIVEL (OTT Inc.)DSD impact (Joss–Valdwogel)
and laser (PARSIVEL)DSD, rain rate, liquid water
content, and terminal velocity
Rain gaugeTipping bucket (Hydrological Services
rain gauge 0.01 in. (0.254 mm)Rainfall Rain rate
Vertical-pointing radar
Micro Rain Radar (MRR-2), vertical pointing—24.1 GHz (METEK)
Doppler spectralReflectivity, rain rate, liquid
water content, terminal velocity, and path-integrated attenuation
LidarVisible Raman lidar at 532/604 nm
(LB10 D-200, Raymetrics)Backscattering extinction
profileCloud and aerosol extinction profile and cloud thickness
GPSTrimble NetR8 Global Navigation
Satellite System (GNSS) receptor dual frequency
Zenithal tropospheric delay Integrated water vapor
Surface tower
Solar Kipp & Zonen instruments, Campbell Scientific and LI-COR, Inc. weather instruments, CS7500, open
path analyzer measuring CO2 and H
2O
surface fluxes using eddy covariance technique
Surface weather variables, soil and temperature, radiative
budget, and CO2 and H
2O eddy
covariance
Radiative budget, soil temperature and moisture, surface air relative humidity,
temperature and wind, moisture, CO
2, and heat fluxes
1370 SEPTEMBER 2014|
continent. Three complete scans (volume scan, RHIs, and vertically pointing) were run in 20-min cycles and a zero check (background noise estimation) was performed once per hour.
Rawinsondes were launched in Fortaleza every 6 h. However, in the time interval of 8–17 April, two additional sites located 135 km away in the cities of Quixeramobim and Mossoró were added, and these began to launch rawinsondes concurrently. This nearly equilateral triangular sounding array was designed to cover mesoscale systems penetrating the continent. During this period, multiple organized convective systems crossed the array in succession.
The maximum rainfall intensity recorded during the campaign was 152 mm h–1, with the drop size distributions (DSDs) revealing a large population of large (>4 mm) raindrops. Fortaleza had the largest average vertically integrated water vapor (56.1 mm) and the highest melting level (4.7 km). These charac-teristics suggest that the rainfall events in Fortaleza appear to have a very important warm process when producing rain drops. Additionally, the stratiform rainfall in Fortaleza exhibited the highest and least prominent brightband (BB) peak intensity (Calheiros and Machado 2014). Fortaleza had the second highest CAPE; the 99th percentile corresponds to 1840 J kg–1.
Belém. The Belém campaigns was performed during the period 1–30 June 2011, toward the end of the wet season and during the period of maximum squall-line frequency [see Garstang et al. (1994) and Cohen et al. (1995) for a detailed description of Amazonian squall lines]. Negri et al. (2000) used a satellite-derived gauge-adjusted precipitation climatology from microwave measurements (i.e., the Goddard profiling algorithm). They found a persistent local rainfall maximum at 1800 LST, which moved inland at 2100 LST, because of interactions between sea breeze and squall-line formation and propagation into the Amazon along the northern coast of Brazil.
The X-Pol radar was installed on the roof of the Meteorology Department of the Federal University of Pará along the Guamá River, a tributary of the Amazon River. Two main sites were set up, one in Outeiro and another in Benevides, 23.0 and 27.7 km from the radar, respectively. In general, rawinsondes were launched twice daily in Belém, with the ex-ception of an intensive observation period from 18 to 26 June, during which four rawinsondes were launched daily in the cities of Tomé Açu and São Miguel, approximately 120 km apart. The radar volume scan strategy was similar to that used in the previous experiments. Additionally, within the
10-min scan period strategy, 10 more RHIs were performed (separated by 1.5°) perpendicular to the Amazon River covering the rawinsondes triangle network. In addition to the typical CHUVA instru-mentation, a mesoscale GPS meteorological network was established (Adams et al. 2011) with 15 stations in close proximity (a 5–10-km separation distance with-in Belém and a 40-km distance outside of Belém). This GPS network provided very high spatial and temporal resolution for the column-integrated atmospheric water vapor and its variability. Additionally, three field mill sensors were installed at Belém and the main sites. Finally, controlled meteorological (CMET) balloons (Voss et al. 2005) were launched from Tomé-Açu, Pará. These balloons are altitude controlled via satellite, and the winds were determined using GPS tracking and a package carrying temperature and moisture sensors. Two CMETs were launched 12 h apart. The CMET measurements (i.e., temperature and relative humidity) show the same boundary layer structure as the Tomé-Açu rawinsondes. Each CMET was recovered. The CMETs landed in the Tocantins River after 6 h of flight. During the flights, a mesoscale convective system to the south led to a strong directional wind shear in the lower layers. Preliminary numerical studies using the BRAMS model employing back trajectory are consistent with a southerly flow in response to a depression associated with the interaction of a mesoscale convective system and a developing sea breeze, which also promoted a southerly flow.
Several squall lines formed along the coast and sea-breeze front, propagating inland over the Amazonian rain forest, as described earlier by Cohen et al. (1995). However, several of the observed squall lines were not initiated along the coast but along the bound-ary of the rain forest and the semiarid region to the east of Belém. These squall lines propagated almost parallel to the coast. Another interesting feature was the multiscale nature of these large squall lines. Embedded in the large cloud deck, successively small-er-scale propagating rainfall cell lines were detected by the radar. Figure 3 displays one example of the con-secutive RHI scans through the squall line on 7 June 2011. A typical vertical cross section of the evolving squall line is apparent; initially shallow warm clouds develop, followed by rapidly deepening clouds up to 14 km. Following the convective region, the stratiform sector evolved with a clear bright band and a cloud top of approximately 13 km at 2200 UTC. During the dissipation phase (cloud collapse), the cloud-top height decreases and the brightband region intensi-fies. The brightband signature is the result of complex
1371SEPTEMBER 2014AMERICAN METEOROLOGICAL SOCIETY |

microphysical processes that occur when snowflakes melt in stratiform precipitation (Fabry and Zawadzki 1995). More than 20 rain events crossed the experi-mental region; the rain rate at the 99th percentile was 122 mm h–1. The CAPE was also very high. However, the CAPE was less than at Alcantara and Fortaleza; the 99th percentile corresponds to 1380 J kg–1.
Vale do Paraíba. The Vale do Paraíba campaign had the longest duration, with an IOP from 1 November to 22 December 2011, followed by a second period with less intensive measurements continuing through 31
March 2012. The instrumentation was installed along a line perpendicular to the coast. The radar was 90 km inland from the ocean at an elevation of 650 m. The main site was installed 11 km from the X-Pol radar, and a succession of sites (spaced by approximately 20 km) was installed along a line perpendicular to the ocean. These sites had at least one GPS integrated precipitable water (IPW) station, one disdrometer, and multiple rain gauges. Additionally, five field mills, spaced 1 km apart, formed a very high-spatial-resolution array close to the radar. The radar strategy was designed to run for 6 min.
During November and the first week of December, the region had an anomalous southeasterly f low, decreasing the air temperature and increasing convective inhibition. From the second week of December through March, several intense thun-derstorms and some severe weather events were reported in the region.
The primary objective of this campaign was to study storm elec-trification. As such, comprehensive ground-based measurements of total lightning activity were col-lected to improve our understanding and knowledge of thunderstorm initiation and behavior and also to develop more advanced nowcasting tools that combine radar, lightning, satellite, and numerical weather prediction (Goodman et al. 2012). The second objective was to conduct cross-network intercomparisons and capability assessments of operational and research ground-based regional 2D and 3D total lightning map-ping networks that might be useful for merging with or validating the space-based lightning measurements becoming available late this decade. This specific component of the field experiment included a very success-ful collaboration among Brazilian, U.S., and European organizations (from universities and industry). The participating lightning location sys-tems (LLSs) were Sferics Timing and Ranging Network (STARNET), Rede Integrada Nacional de Detecção de Descargas Atmosféricas (RINDAT), World Wide Lightning Location
Fig. 3. The sequence of the RHI over a squall line crossing the main site. The illustration is presented for each hour from 1700 to 2400 UTC (7 Jun 2011) for the Belém field campaign.
1372 SEPTEMBER 2014|

Network (WWLLN), Arrival Time Difference Net-work (ATDnet), Vaisala Global Lightning Dataset 360 (GLD360) and Total Lightning Sensor (TLS200), Sistema Brasileiro de Detecção de Descargas Atmos-féricas (BrasilDAT), Lightning Network (LINET), and Lightning Mapping Array (LMA). The last four networks were deployed along a short baseline for total (intracloud and cloud to ground) lightning detection in support of the development of proxy datasets and validation protocols in preparation for the next gen-eration of operational weather satellites (Goodman et al. 2013) and the Meteosat Third Generation Light-ning Imager in 2018 (Höller et al. 2013). The lightning measurements provided by these LLSs were made concurrently with overpasses of the TRMM Lightning Imaging Sensor (LIS) and the Spinning Enhanced Visible and Infrared Imager (SEVIRI) on the Meteosat Second Generation satellite. A 10-station Lightning Mapping Array network, expanded to 12 stations in early December and then providing near-real-time data, was deployed over the eastern region of the Vale do Paraiba in the vicinity of São Paulo to be one of the references for total lightning measurements. The distance between the LMA stations was 15–30 km, and the network “diameter” was approximately 60 km. Bailey et al. (2011) discuss a similar LMA configura-tion that provides accurate 3D lightning mapping and good detection efficiency as far as 150 km from the network center. This specific network installed in CHUVA has no information about the specific ef-ficiency detection; this information will be available only after the cross-network intercomparisons.
The combined lightning, satellite, and radar data provide the most comprehensive dataset to date. The dataset prepares users for the next generation of geostationary satellite imagery and lightning map-pers using SEVERI and LIS measurements. Figure 4 presents an example of the characteristic lightning data collected during one overpass of the TRMM satellite. The LMA and the LIS were able to detect and locate lightning from various subcomponents of individual flashes.
Additionally, nowcasting applications were tested based on detailed information of intense thunder-storms that produced hail, damaging winds, and flooding over the metropolitan area of São Paulo and Vale do Paraiba. Figure 5 provides an example of a severe weather event that produced very large hail (up to 20 mm) and flooding in the region. A rapid increase in lightning source numbers, known as the “lightning jump,” first discussed by Williams et al. (1999), is associated with severe weather, occurred in advance of the hail event. Figure 5a shows the
15-min accumulated LMA source density (number of sources in a 1 × 1 km2 grid during a 15-min period) plotted in latitude–longitude, latitude–height, and longitude–height projections and the observed sig-nature of the lightning jump. This cell was initiated southwest of Sao Paulo and traveled through Sao Paulo and Guarulhos cities with reflectivities greater than 40 dBZ from 1700 to 1830 UTC, reaching values greater than 65 dBZ at 1745 UTC when hail was reported in downtown Sao Paulo. Moreover, 15 min later, hail and flooding were reported in Guarulhos, which corresponds with the maximum observed LMA sources (Fig. 5b). The electrical structure of this cell exhibited two well-developed charge centers with maximum activity near 1800 UTC. This lighting source maximum (lightning jump) has been associated with severe weather, including tornadoes (Schultz et al. 2009). The lightning activity had two major source regions at approximately 7 and 10 km. These thunderstorms extended to a height of 18 km. Cloud electrification is tightly controlled by updrafts
Fig. 4. (top) The coincident lightning observations at 1900 UTC 10 Feb 2012 during an LIS overpass from approximately 1901:10 to 1903:24 UTC. The plotted ground-based lightning data are limited both tempo-rally and spatially to the LIS overpass limits. (bottom left) The LIS pixels (gray squares) and the ground strikes detected by LMA very high frequency (VHF) sources (the colored dots are a function of the time). The projections (middle left) east–west and (bottom right) north–south as functions of the altitude and (middle right) the number of sources as a function of the altitude are also shown.
1373SEPTEMBER 2014AMERICAN METEOROLOGICAL SOCIETY |

and precipitation formation. Therefore, monitoring lightning activity inside a cloud can lead to severe weather warnings detected by a lightning-jump signature.
The LMA mapped the convective cells in near–real time. The most recent 10 min of the LMA lightning data were uploaded to the CHUVA nowcasting website (SOS) every 5 min. This site provides civil defense, management organizations, electrical power companies, and the public with information on real-time convection and lightning threat.
During the Vale do Paraiba campaign, sev-eral intense thunderstorms and some severe weather events were recorded, including a downburst, causing destruction of many trees, and many cases of hailstorms. The rain rate at the 99th percentile at the main site was 137 mm h–1. Warm clouds during the Vale do Paraiba campaign had a lower frequency and average rain rate than the other CHUVA tropical sites. Moreover, nonprecipitating clouds exhibited a small average cloud integrated liquid water content
(0.13 mm) and the largest difference with the adia-batic calculation. One possible reason for this finding is the dry entrainment effect that reduces the liquid water content below the estimated adiabatic value. The CAPE value at Vale do Paraiba was nearly identi-cal to the observations in Belém; the 99th percentile corresponds to 1260 J kg–1. The Vale do Paraiba and Santa Maria locations had smaller average integrated water vapor amount (27 and 29 mm, respectively) compared with the sites located closer to the equator.
Santa Maria. The Santa Maria campaign, named CHUVA SUL, took place from 5 November to 12 December 2012. Zipser et al. (2006) report that very intense thunderstorms are observed in this region and mesoscale convective systems organized by the penetration of cold fronts are common. Liu et al. (2010) used a 10-yr satellite database from TRMM to show that most precipitation in this region (more than 2000 mm yr–1) comes from thun-derstorms. During the campaign, the rain rate at
Fig. 5. (a) Accumulated LMA lightning source density (number of sources in a 1 × 1 km2 grid box during a 15-min period) for a hail-producing convective cell on 7 Jan 2012. (top) A plan (latitude–longitude) view and (bottom) height–longitude views of the convective cell. Horizontal black lines in the bottom panels indicate the approximate heights of the –10° and –40°C isotherms, where most of the electrical charge transfer occurs. (b) Time evolution of the maximum reflectivity and the number of LMA lightning sources. Red lines indicate hail occurrences in São Paulo and Guarulhos [the two cities shown in (a)]. Only data from the hail-producing convective cell are shown.
1374 SEPTEMBER 2014|

the 99th percentile was 106 mm h–1. Six mesoscale convective systems crossed the region during the campaign, with intense activity confined primarily to Argentina and Uruguay. On 1 December, a con-vective event brought down trees near the main site and was considered the most intense storm crossing the sites. Unfortunately, the X-band radar suffered a voltaic arc and could not be repaired in time for the campaign. However, two S-band radars operated by the Brazilian Air Force, one in Santiago and another in Cambuçu, 100 and 180 km from the main site, respectively, made measurements during this event. These radars ran a volume scan strategy, employing 15 elevations every 10 min. All of the CHUVA instru-ments were installed similar to the other campaigns using rainfall measurement sites, a GPS mesoscale network, and a field mill network. Additional in-strumentation included surface weather stations in a mesoscale network composed of six stations spaced 20 km apart. The rawinsondes were launched twice a day. During the occurrence of organized systems, soundings were also launched every 6 h in Santiago and Cruz Alta, approximately 120 km apart. The Santa Maria campaign showed the lowest value for CAPE; the 99th percentile corresponds to only 400 J kg–1, larger values were only observed close to the six main events. A unique activity in CHUVA SUL was the use of the High-Resolution Limited-Area Model Ensemble (HRLAMENS). The HRLAMENS effort was developed under mutual collaboration between CHUVA and the La Plata Basin Research and Development Project (LPB–RDP, which focuses on high-impact weather), which aimed to furnish additional information on the total amounts and locations of precipitation and their uncertainties. The HRLAMENS was composed of five models [two ver-sions of the BRAMS model and three versions of the Weather Research and Forecasting Model (WRF)], which were integrated using the Centro de Previsão de Tempo e Estudos Climáticos (CPTEC) supercom-puting facilities. Moreover, four other model configu-rations were run in other institutions in Brazil and Argentina. This core set of models was designed to be driven by selected global ensemble prediction system members from CPTEC and the National Centers for Environmental Prediction (NCEP). The simulations were homogeneous in domain size and horizontal and vertical resolution (2-km grid spacing and 41 levels). Partner institutions in the project assisted with the multimodel composition in their respective models [WRF running at University of Buenos Aires, WRF running at University of Santa Maria, and Nonhydrostatic Mesoscale (Méso-NH) model from
the Laboratoire d’Aerologie (France)]. The results are still being evaluated. Nevertheless, preliminary con-clusions indicate, as expected, sensitivity to the lat-eral boundary conditions and model characteristics. The ultimate objective is to find an optimal balance among ensemble members that would improve the current state of rainfall predictions for the region.
GoAmazon—Manaus. The GoAmazon experiment seeks to understand the interaction of aerosol and cloud life cycles. The GoAmazon experiment will be performed in Manaus, a megacity of almost 1.8 million people in the central Amazon. Two IOPs are being prepared for 2014, one in February–March, during the wet season, and another in September–October, at the end of the dry season. The GoAmazon experiment consists of several combined efforts, including the deployment of the Atmospheric Radia-tion Measurement Program (ARM) mobile facility (Cadeddu et al. 2013); the Grumman Gulfstream 159 (G-1) aircraft (from the Pacific Northwest National Laboratory) to collect chemistry and microphysical properties; Aerosol, Cloud, Precipitation, and Radia-tion Interactions and Dynamics of Convective Cloud Systems (ACRIDICON) with the High-Altitude and Long-Range Research Aircraft (HALO), which is the new research aircraft of the German Science Community (Gulfstream G-550); and the CHUVA project. The CHUVA campaign will employ an X-Pol measurement strategy that provides volume scans and several RHIs over the sites in coordination with the ARM cloud radar. It is important to note that the GPM core observatory will be launched during the first IOP. Hence, there will be an opportunity to com-bine data from the TRMM and GPM core satellites with those collected during GoAmazon to study cloud and precipitation processes over one of the rainiest continental regions of the planet.
CHUVA OUTREACH. The SOS-CHUVA nowcasting system. The SOS-CHUVA is a web-based geographic information system combining observations from radar, lightning networks, satellite images, numerical models, and nowcasting procedures. This is a useful tool to interpret, summarize, and integrate the envi-ronmental information and display and send warn-ings for emergency management groups. In addition, SOS-CHUVA is an open access system serving the population through real-time information, thereby reducing citizen vulnerability. By taking advantage of the instrumentation employed in each campaign, a nowcasting pilot project is set up for each region that addresses specific vulnerabilities and needs. The
1375SEPTEMBER 2014AMERICAN METEOROLOGICAL SOCIETY |

SOS-CHUVA provides high-resolution radar, satellite, and lightning data nearly in real time. It also provides the results from several nowcasting applications, in-cluding the radar forecast for the next 10 min [based on Fortracc, Vila et al. (2008), and the Rainbow data processing system software] and the lightning prob-ability (Machado et al. 2009), among several other functions, such as the total integrated precipitation for each neighborhood. For the regions outside of the radar coverage, the system provides information based on the hydroestimator and the Fortracc nowcasting cloud systems for the following 2 h using geostation-ary satellite data. The system also provides forecast data from the BRAMS cloud-resolving model at a resolution of a few kilometers. The SOS-CHUVA in each campaign was developed in partnership with the local civil defense and fire departments.
Training and education and workshop. Outreach activities are an important component of the CHUVA project. For example, training lectures were presented to local students during each campaign via a 1-week course that covered themes of nowcasting, cloud-resolving models, polarimetric radar, satellite data usage, lidar, GPS, and cloud microphysics. The lectures were offered to graduate and undergraduate
students in environmental sciences; more than 100 students attended each campaign course. The pro-grams and details of each course are available from the specific web page of the campaign.
Finally, an international workshop was organized in May 2013 in São Paulo. Access to the abstracts and the presentations is available at the following URL: http://chuvaproject.cptec.inpe.br/portal/workshop /index.html.
DISCUSSION. The use of similar instruments across campaigns in the various precipitation regimes makes it possible to study the regional contrasts and correspondences. Figure 6 illustrates examples of similarities and differences among the various pre-cipitation regimes. Figure 6a shows the DSD adjust-ment to the gamma function [using the momentum method described by Tokay and Short (1996)] in the three-dimensional space of the gamma parameters: the intercept (N0) in the x axis, the shape (m) in the y axis, and the width (Λ) in the z axis, using the same procedure employed by Cecchini et al. (2014). In this three-dimensional space (a logarithmic option is applied to N0 to adjust the data to the same range), the DSD gamma parameters are represented for the Vale do Paraiba, Belém, and Santa Maria campaigns.
Fig. 6. (a) The DSD gamma parameters for Vale do Paraiba (black dots), Belém (brown dots), and Santa Maria (white dots) in the three-dimensional space composed by N0, m, and Λ. The color of the interpolated surface is associated with the Λ values. (b) The cumulative rainfall as a function of WII for Alcantara, Fortaleza, Belém, and Vale do Paraiba. (c) The cumulative convective cloud cover (TIR < 235 K) as a function of the cloud-cluster effective radius for each campaign.
1376 SEPTEMBER 2014|
Each point in this diagram corresponds to a specific DSD. We note the regional differences in the fre-quency of occurrence over the gamma parameter’s spatial domains. However, it is very interesting to see that all points, regardless of the regime, are nearly over the same adjusted surface. Therefore, we can parameterize the gamma distribution using only two independent parameters. The raindrop size dis-tribution characteristics observed by surface-based disdrometers can distinguish different precipitation systems. Tokay et al. (2002) demonstrated the pres-ence of more large drops and small concentration in the easterly regime than in the westerly regime in the southwestern Amazon Basin. In their study, DSD differences were also observed between the monsoon and break regimes in northwestern Australia. The DSD features from CHUVA will be analyzed in detail after the completion of the GoAmazon project.
Another example of regional contrasts and simi-larities is presented in Fig. 6b using the warm cloud–ice cloud index (WII). The WII is defined as the ratio of the difference between the cloud thickness of the cloud layer below and above the freezing level and the total cloud thickness (see Fig. 6b for a schematic view and the associated equation). The WII was computed using the vertical profile of ref lectivity (VPR) by employing data from the X-Pol RHI scanning mode and the collocated rawinsondes (±3-h interval) over the main site. Only continuous cloud layers were considered in this analysis; multilayer clouds were discarded. A continuous layer cloud was defined as having a continuous layer with values larger than 0 dBZ in the warm sector and –10 dBZ in the layer above the 0°C isotherm. Different thresholds were used because ice has a smaller refractive index than liquid water. All rain events (rain rate greater than 0.1 mm h–1) from nonmultilayer clouds and when rawinsonde data were available were computed in the WII analysis. The thickness of the layer under the melting layer (L1) was defined as the layer between the lifting condensation level (LCL) and the melting level (both obtained from rawinsondes). The LCL is used to avoid possible rain layers detected by the radar below the cloud base. The parameter L2, characteriz-ing the layer above the melting layer, is defined as the thickness of the layer between the melting level and the last level of the continuous layer of reflectivities larger than –10 dBZ. L2 roughly represent the cloud layer above the 0°C isotherm because radar does not detect the cloud boundaries. The WII ranges from 1 (a pure warm cloud) to –1 (clouds associated only with ice and/or supercooled water). Figure 6b presents the rainfall cumulative frequency for each WII value. The
cumulative rainfall is obtained from a disdrometer located at the main site along the RHI azimuth direc-tion employed to build the VPR. The population for each site (rainfall cases at the main site were associ-ated with a single layer cloud that occurred within the 6-h interval centered on the rawinsonde launch time) is variable, ranging from 116 in Alcantara to 1500 in Vale do Paraiba, depending on the number of rainy days, the frequency of multilayer clouds, and the duration of the campaign. The cumulative rainfall, for each site, is presented as function of the WII values in Fig. 6b to give information about the specific cloud population of WII values in the total rainfall. Two different behaviors can be observed in Fig. 6b.The first behavior corresponds to negative WII values, responsible for approximately 70%–75% of the total precipitation amount. Vale do Paraiba and Belém exhibit deep clouds with a layer L2 above the melting level that is nearly 3 times larger (a WII value of approximately –0.5) than the warm layer L1; for Fortaleza and Alcantara, this layer is only 1.5 times larger than the warm layer (a WII around –0.3). The second behavior, accounting for the remaining 30%–25% of precipitation, is nearly linearly distrib-uted for the positive values of the WII, except for Vale do Paraiba. These clouds are characterized by rain processes that are primarily below the melting layer. Alcantara, Belém, and Fortaleza present a very similar behavior; approximately 25% of the precipita-tion is from clouds with most of their thickness below the melting layer (associated with warm processes). However, the Vale do Paraiba rainfall events display a different behavior, in which a very small portion (i.e., less than 5%) of the rainfall is associated with warm clouds. This clearly shows a distinction between coastal and continental rainfall events; a different population of rainfall events from warm clouds was observed. This difference could be the reason for the cloud process in the clean maritime air near the coast and the more polluted air inland.
Another regional comparison was performed to evaluate cloud organization using GOES images. Figure 6c shows the cumulative distribution of the convective cloud fraction (defined as 10.7-µm bright-ness temperature smaller than 235 K) as a function of the cloud-cluster effective radius [an equivalent area circle; effective radius = (area/π)1/2]. This convective cloud size distribution only includes clouds with very high cloud tops (i.e., colder than 235 K). Therefore, no warm clouds are included. The calculation was performed using the same procedure as employed by Machado and Rossow (1993) over a region centered on the main site with a radius of 250 km. The regional
1377SEPTEMBER 2014AMERICAN METEOROLOGICAL SOCIETY |

convective cloud size distributions are very similar. Approximately 80% of the convective cloud fraction is explained by cloud organization with radii smaller than 31 km for all regions. Only slight regional dif-ferences are noted for convective cloud organization smaller than 31 km effective radius. Alcantara and Belém have fewer small convective clouds than the other sites. Moreover, Vale do Paraiba exhibits more moderately sized systems (approximately 31 km). However, the largest difference is for convective cloud organization larger than 31 km. Santa Maria has the largest cloud organization, probably due to the more baroclinic instability favoring large MCCs and cold fronts.
The CHUVA dataset has just begun to be explored, but some clear regional characteristics can already be described. The warm clouds in Alcantara feature very large droplets (disdrometer measurement) and high liquid water content (microwave radiometer). Several pixels that were classified as stratiform due to the presence of a bright band exhibiting large reflectivities and rain-rate values. It is possible that the ice aloft, prior to the brightband formation, is sufficiently vigorous to produce larger rain rates than expected for normal stratiform cloud conditions. The largest CAPE found in Alcantara could explain this strength in the ice production. The highest and most prominent bright band was observed in Alcantara, which agrees with this notion. Deep convective clouds in Fortaleza display the largest amount of rainwater below the melting layer. Costa et al. (2000) showed different DSDs for maritime, coastal, continental, and polluted warm clouds in the Fortaleza region. They demonstrated a pronounced increase in con-centration and a decrease in the maximum droplet diameter as the clouds moved from the ocean to the continent into polluted regions. The high CAPE for these coastal sites helps the development of deep convection. However, these coastal tropical sites have more warm-rain clouds and less deep convection than the Vale do Paraiba and Santa Maria locations. Several processes must be considered, such as the small concentration of cloud condensation nuclei (CCN) at the coastal sites. Moreover, the larger trade wind inversion could contribute suppressing deep convection and increase warm-cloud formation.
The deepest clouds were recorded in Santa Maria, Belém, and Vale do Paraiba. These are the regions of very deep clouds, often with cloud tops above 15 km, and organized convection with a more dominant ice phase. Belém presented the most developed glaciated layer (above 7 km), whereas Vale do Paraiba displayed the most developed mixed-phase layer, That is,
between the melting layer and 7 km (Calheiros and Machado 2014).
SUMMARY. CHUVA provides a comprehensive dataset characterizing the main precipitation regimes in Brazil. The project consistently uses a core comple-ment of instrumentation for each campaign and has recorded and made available high-spatial-resolution and high-temporal-resolution observations (ground and satellite based) of cloud and precipitation char-acteristics.
CHUVA field campaigns around the tropical region of Brazil provide education and training with respect to the employed instrumentation and the physical processes describing cloud and rainfall formation. CHUVA takes advantage of the instru-mentation to present a nowcasting testbed based on SOS-CHUVA. CHUVA data are available through the website, which include all of the information on each campaign, daily reports, data strategy, quick looks, instrument locations, and photos.
The CHUVA project contributes to the GLM effort to develop algorithms based on the planned GOES-R and Meteosat third-generation lightning sensors and the preparation of the GPM validation and algorithm development. The large number of warm-rain clouds measured in various regions is an important resource for the satellite precipitation algorithms, especially for GPM, to test the ability of retrieving rainfall from non-ice-scattering clouds over land.
Open access to the database will certainly con-tribute to improving the knowledge of clouds over tropical regions and advance the description and parameterization of cloud processes.
ACKNOWLEDGMENTS. This work was supported by FAPESP Grant 2009/15235-8, the CHUVA Project. Special thanks to Mário Figueiredo for maintaining the CHUVA database; Claudinei Camargo for assisting in figure prepa-ration; Jorge Melo and Jorge Marton for their engineering support during the field campaigns; Moacir Lacerda, Evandro Anselmo, and João Neves for their support during lightning installation; and Izabelly Carvalho for process-ing the disdrometer dataset. The authors acknowledge the anonymous reviewers and the comments provided by Earle Williams. The authors also thank all of the participants in the CHUVA field campaigns who contributed directly or indirectly during the years of field work.
REFERENCESAdams, D. K., and Coauthors, 2011: A dense GNSS
meteorologica l network for obser v ing deep
1378 SEPTEMBER 2014|

convection in the Amazon. Atmos. Sci. Lett., 12, 207–212, doi:10.1002/asl.312.
Bailey, J. C., L. D. Carey, R. J. Blakeslee, S. J. Goodman, R. I. Albrecht, C. A. Morales, and O. Pinto Jr., 2011: São Paulo Lightning Mapping Array (SP-LMA): Deployment and plans. Proc. 14th Int. Conf. on Atmospheric Electricity, Rio de Janeiro, Brazil, International Commission on Atmospheric Electricity. [Available online at www.icae2011.net .br/index.pt.html.]
Battaglia, A., P. Saavedra, C. A. Morales, and C. Simmer, 2011: Understanding three-dimensional effects in polarized observations with the ground-ba sed A DM I R A R I rad iometer du r i ng t he CHUVA campaign. J. Geophys. Res., 116, D09204, doi:10.1029/2010JD015335.
Berg, W., T. L’Ecuyer, and C. Kummerow, 2006: Rainfall climate regimes: The relationship of regional TRMM rainfall biases to the environment. J. Appl. Meteor. Climatol., 45, 434–454, doi:10.1175/JAM2331.1.
Cadeddu, M. P., J. C. Liljegren, and D. D. Turner, 2013: The Atmospheric Radiation Measurement (ARM) program network of microwave radiometers: Instrumentation, data, and retrievals. Atmos. Meas. Tech. Discuss., 6, 3723–3763, doi:10.5194/amtd-6 -3723-2013.
Calheiros, A. J. P., and L. A. T. Machado, 2014: Cloud and rain liquid water statistics in the CHUVA campaign. Atmos. Res., 144, 126–140, doi:10.1016/j .atmosres.2014.03.006.
Cecchini, M. A., L.A.T. Machado, and P. Artaxo, 2014: Droplet size distributions as a function of rainy system type and cloud condensation nuclei con-centrations. Atmos. Res., 143, 301–312, doi:10.1016/j .atmosres.2014.02.022.
Cecil, D. J., and C. B. Blankenship, 2012: Toward a global climatology of severe hailstorms as estimated by satellite passive microwave imagers. J. Climate, 25, 687–703, doi:10.1175/JCLI-D-11-00130.1.
Cohen, J. C. P., M. A. F. da Silva Dias, and C. A. Nobre, 1995: Environmental conditions associ-ated with Amazonian squall lines: A case study. Mon. Wea. Rev., 123, 3163–3174, doi:10.1175/1520 -0493(1995)1232.0.CO;2.
Costa, A. A., C. J. de Oliveira, J. C. P. de Oliveira, and A. J. C. Sampaio, 2000: Microphysical observations of warm cumulus clouds in Ceará, Brazil. Atmos. Res., 54, 167–199, doi:10.1016/S0169-8095(00)00045-4.
Cotton, W. R., 1982: Modification of precipitation from warm clouds—A review. Bull. Amer. Meteor. Soc., 63, 146–160, doi:10.1175/1520-0477(1982)0632.0.CO;2.
Fabry, F., and I. Zawadzki, 1995: Long-term radar observations of the melting layer of precipitation
and their interpretation. J. Atmos. Sci., 52, 838–851, doi:10.1175/1520-0469(1995)0522.0.CO;2.
Garreaud, R. D., 2000: Cold air incursions over subtropi-cal South America: Mean structure and dynamics. Mon. Wea. Rev., 128, 2544–2559, doi:10.1175/1520 -0493(2000)1282.0.CO;2.
Garstang, M., H. L. Massie, J. Halverson, S. Greco, and J. Scala, 1994: Amazon coastal squall lines. Part I: Structure and kinematics. Mon. Wea. Rev., 122, 608–622, doi:10.1175/1520-0493(1994)1222.0.CO;2.
Goodman, S. J., and Coauthors, 2012: The GOES-R Proving Ground: Accelerating user readiness for the Next Generation Geostationary Environmen-tal Satellite System. Bull. Amer. Meteor. Soc., 93, 1029–1040, doi:10.1175/BAMS-D-11-00175.1.
—, and Coauthors, 2013: The GOES-R Geostationary Lightning Mapper (GLM). Atmos. Res., 125–126, 34–49, doi:10.1016/j.atmosres.2013.01.006.
Höller, H., H.-D. Betz, C. A. Morales, R. Blakeslee, J. C. Bailey, and R. I. Albrecht, 2013: Multi-sensor field studies of lightning and implications for MTG-LI. Extended Abstracts, 2013 EUMETSAT Meteorological Satellite Conf. and 19th Satellite Meteorology, Ocean-ography, and Climatology Conf., Vienna, Austria, EUMETSAT and Amer. Meteor. Soc.. [Available online at http://elib.dlr.de/85861/.]
Kouadio Y. K., J. Servain, L. A. T. Machado, and C. A. D. Lentini, 2012: Heavy rainfall episodes in the eastern Northeast Brazil linked to large-scale ocean–atmosphere conditions in the tropical Atlantic. Adv. Meteor., 2012, 369567, doi:10.1155/2012/369567.
Liu, C., and E. J. Zipser, 2009: “Warm rain” in the tropics: Seasonal and regional distributions based on 9 yr of TRMM data. J. Climate, 22, 767–779, doi:10.1175/2008JCLI2641.1.
—, E. R. Williams, E. J. Zipser, and G. Burns, 2010: Diurnal variations of global thunderstorms and elec-trified shower clouds and their contribution to the global electrical circuit. J. Atmos. Sci., 67, 309–323, doi:10.1175/2009JAS3248.1.
Machado, L. A. T., and W. B. Rossow, 1993: Structural characteristics and radiative properties of tropical cloud clusters. Mon. Wea. Rev., 121, 3234–3260, doi:10.1175/1520-0493(1993)1212.0.CO;2.
—, H. Laurent, and A. A. Lima, 2002: Diurnal march of the convection observed during TRMM-WETAMC/LBA. J. Geophys. Res., 107(D20), 8064, doi:10.1029/2001JD000338.
—, W. F. S. Lima, O. Pinto Jr., and C. A. Morales, 2009: Relationship between cloud-to-ground discharge and penetrative clouds: A multi-channel satellite application. Atmos. Res., 93, 304–309, doi:10.1016/j .atmosres.2008.10.003.
1379SEPTEMBER 2014AMERICAN METEOROLOGICAL SOCIETY |
Morrison, H., and W. W. Grabowski, 2007: Comparison of bulk and bin warm-rain microphysics models using a kinematic framework. J. Atmos. Sci., 64, 2839–2861, doi:10.1175/JAS3980.
Negri, A. J., E. N. Anagnostou, and R. F. Adler, 2000: A 10-yr climatology of Amazonian rainfall de-rived from passive microwave satellite observa-tions. J. Appl. Meteor., 39, 42–56, doi:10.1175/1520 -0450(2000)0392.0.CO;2.
Negri, R. G., L. A. T. Machado, S. English, and M. Forsythe, 2014: Combining cloud-resolving model with satellite for cloud process model simulation validation. J. Appl. Meteor. Climatol., 53, 521–533, doi:10.1175/JAMC-D-12-0178.1.
Peters, G., B. Fischer, H. Münster, M. Clemens, and A. Wagner, 2005: Profiles of raindrop size distributions as retrieved by microrain radars. J. Appl. Meteor., 44, 1930–1949, doi:10.1175/JAM2316.1.
Rickenbach, T. M., 2004: Nocturnal cloud systems and the diurnal variation of clouds and rainfall in south-western Amazonia. Mon. Wea. Rev., 132, 1201–1219, doi:10.1175/1520-0493(2004)1322.0.CO;2.
Salio, P., M. Nicolini, and E. J. Zipser, 2007: Mesoscale convective systems over southeastern South America and their relationship with the South American low-level jet. Mon. Wea. Rev., 135, 1290–1309, doi:10.1175/MWR3305.1.
Sapucci, L. F., L. A. T. Machado, J. F. G. Monico, and A. Plana-Fattori, 2007: Intercomparison of integrated water vapor estimates from multisensors in the Amazonian region. J. Atmos. Oceanic Technol., 24, 1880–1894, doi:10.1175/JTECH2090.1.
Schneebeli, M., J. Sakuragi, T. Biscaro, C. F. de Angelis, I. Carvalho da Costa, C. A. Morales, L. Baldini, and L. A. T. Machado, 2012: Polarimetric X-band weather radar measurements in the tropics: Radome and rain attenuation correction. Atmos. Meas. Tech., 5, 2183–2199, doi:10.5194/amt-5-2183-2012.
Schultz, C. J., W. A. Petersen, and L. D. Carey, 2009: Preliminary development and evaluation of lightning jump algorithms for the real-time detection of severe weather. J. Appl. Meteor. Climatol., 48, 2543–2563, doi:10.1175/2009JAMC2237.1.
Schumacher, C., and R. A. Houze, 2003: Stratiform rain in the tropics as seen by the TRMM Precipitation Radar. J. Climate, 16, 1739–1756, doi:10.1175/1520 -0442(2003)0162.0.CO;2.
Silva Dias, M. A. F., Ed., 2009: As chuvas de novembro de 2008 em Santa Catarina: Um estudo de caso visando à melhoria do monitoramento e da previsão de eventos extremos. Tech. Note, São José dos Campos, INPE, 67 pp. [Available online at www.ciram.com.br/ciram_arquivos /arquivos/gtc/downloads/NotaTecnica_SC.pdf.]
Tapiador, F. J., and Coauthors, 2012: Global precipita-tion measurement: Methods, datasets and applica-tions. Atmos. Res., 104–105, 70–97, doi:10.1016/j .atmosres.2011.10.021.
Testud, J., E. Le Bouar, E. Obligis, and M. Ali-Mehenni, 2000: The rain profiling algorithm applied to polari-metric weather radar. J. Atmos. Oceanic Technol., 17, 332–356, doi:10.1175/1520-0426(2000)0172.0.CO;2.
Tokay, A., and D. A. Short, 1996: Evidence from tropical raindrop spectra of the origin of rain from strati-form versus convective clouds. J. Appl. Meteor., 35, 355–371, doi:10.1175/1520-0450(1996)0352.0.CO;2.
—, A. Kruger, W. Krajewski, and A. Perreira, 2002: Measurements of drop size distribution in south-western Amazon region. J. Geophys. Res., 107, 8052, doi:10.1029/2001JD000355.
Vila, D. A., L. A. T. Machado, H. Laurent, and I. Velasco, 2008: Forecast and Tracking the Evolution of Cloud Clusters (ForTraCC) using satellite infrared imagery: Methodology and validation. Wea. Forecasting, 23, 233–245, doi:10.1175/2007WAF2006121.1.
Voss, P. B., E. E. Riddle, and M. S. Smith, 2005: Alti-tude control of long-duration balloons. J. Aircr., 42, 478–482, doi:10.2514/1.7481.
Ware, R., R. Carpenter, J. Güldner, J. Liljegren, T. Nehrkorn, F. Solheim, and F. Vandenberghe, 2003: A multichannel radiometric profiler of temperature, humidity, and cloud liquid. Radio Sci., 38, 8079, doi:10.1029/2002RS002856.
Williams, E. R., and S. B. Stanfill, 2002: The physi-cal origin of the land–ocean contrast in lightning activity. C. R. Phys., 3, 1277–1292, doi:10.1016 /S1631-0705(02)01407-X.
—, and Coauthors, 1999: The behavior of total l ightning activity in severe Florida thunder-storms. Atmos. Res., 51, 245–265, doi:10.1016/S0169 -8095(99)00011-3.
Zipser, E. J., C. Liu, D. J. Cecil, S. W. Nesbitt, and D. P. Yorty, 2006: Where are the most intense thunder-storms on Earth? Bull. Amer. Meteor. Soc., 87, 1057–1071, doi:10.1175/BAMS-87-8-1057.
1380 SEPTEMBER 2014|