Embed Size (px)
Citation preview
TRAVEL DEMAND MODELING: ACTIVITY ANALYSIS FOR
PERSON ALLOCATION AND INTERNET USE
By
SUDHAKAR REDDY ATHURU
Thesis
Submitted to the Faculty of the
Graduate School of Vanderbilt University
in partial fulfillment of the requirements
for the degree of
MASTER OF SCIENCE
in
CIVIL ENGINEERING
August, 2004
Nashville, Tennessee
Approved:
Karthik K. Srinivasan
Robert E. Stammer

ACKNOWLEDGEMENTS
This thesis was successfully completed thanks to many persons who helped me at various stages.
I would like to especially thank Dr. Karthik Srinivasan, who is my advisor, for his extensive technical
support during the course of this thesis production. I would also like to thank Dr. Robert Stammer, who
took time from his busy schedule to review my manuscript in a limited time. Further, I thank Dr.
Sankaran Mahadevan, Dr. David Kossan and Dr. Malcolm Baird for their encouragement during my
graduate program.
I would like to thank my friends Arun Krishnamurthy, Avinash Unnikrishnan, Ganesh
Shanmugam, Nithin Gomez, Md. Rafi, Ramesh Rebba, Srinivas Nandana, and Venkat Jayaraman for
making my stay in Nashville more enjoyable. I also thank Dr. Ravi Sankar Jonnalagadda for his
continuing moral support. And most importantly, I would also like to extend my heart-felt thanks to my
parents, uncle, brothers and other family members for their moral support throughout my graduate
curriculum.
iii
TABLE OF CONTENTS
Page
ACKNOWLEDGEMENTS ............................................................................................................ ii
LIST OF TABLES ......................................................................................................................... v
LIST OF FIGURES........................................................................................................................ vi
Chapter
I. INTRODUCTION................................................................................................................. 1
Background..................................................................................................................... 1 Motivation....................................................................................................................... 3 Objectives and overview of approach................................................................................ 5 Structure of thesis ............................................................................................................ 7
II. BACKGROUND AND LITERATURE REVIEW.................................................................. 8
Introduction ..................................................................................................................... 8 Conceptual and modeling frameworks ............................................................................... 9 Activity-types and empirical analysis ................................................................................. 12 Household role and within-household interactions ............................................................... 14 Role of ICT and advanced technologies on activity allocation.............................................. 18
Role of ICT’s on telecommuting ............................................................................ 18 Influence of ICT’s on e-shopping behavior .............................................................. 19 Effect of different types of ICT devices on overall travel and activity patterns ..................................................................................................... 19 Other ICT related studies ....................................................................................... 20 Limitations of these studies..................................................................................... 21 Summary......................................................................................................................... 21
III. PERSON ALLOCATION TO ACTIVITIES........................................................................... 23
Introduction ..................................................................................................................... 23 Literature review related to person allocation..................................................................... 25 Data and descriptive statistics........................................................................................... 28 Modeling framework and calibration procedure.................................................................. 30
Behavioral framework............................................................................................. 30 Special features of this framework........................................................................... 31 Model specification ................................................................................................. 31 Modeling modifications to accommodate these features............................................. 34
Hypothesis ...................................................................................................................... 37 Model results and discussion............................................................................................. 38
Household role effects ............................................................................................ 38 Person characteristics ............................................................................................. 40 Role of constraints .................................................................................................. 40 Within-household differences in activity allocation across different episodes ................................................................................................................. 41 Between-household differences ............................................................................... 41
Assumptions and validation............................................................................................... 45 Summary......................................................................................................................... 46
iv
IV. PHYSICAL/VIRTUAL ACTIVITY PARTICIPATION ........................................................ 52
Introduction ..................................................................................................................... 52 Data description and descriptive statistics .......................................................................... 53 Modeling structure ........................................................................................................... 54
Logit model structure .............................................................................................. 55 Assumptions and exceptions .................................................................................... 56
Results and discussion...................................................................................................... 56 Performance Measures.................................................................................................... 56
Models of ICT use patterns ..................................................................................... 57 Relation between physical and virtual activity participation......................................... 58 Relative propensity of in-home and out-of-home participation for discretionary and maintenance activities ................................................... 59 Duration of in-home and out-of-home episodes for maintenance and discretionary activities ........................................................ 60 Interactions between travel, activity pattern, and ICT use .......................................... 62 Summary and Conclusions ....................................................................................... 62
V. CONCLUSIONS.................................................................................................................... 69
Overview ........................................................................................................................ 69 Salient findings and their significance................................................................................. 70
Person allocation patterns ........................................................................................ 70 ICT use patterns ..................................................................................................... 71
Directions for future research........................................................................................... 73
REFERENCES .............................................................................................................................. 74
v
LIST OF TABLES
Table Page
3.1 Household and person attribute descriptive statistics ................................................................48
3.2 Results of both maintenance and discretionary activities, within-household differences ...........................................................................................................................49
3.3 Mean probabilities of household individuals to evaluate across-household differences ...........................................................................................................................50
3.4 Model validation: estimation of calibration model for predicted dataset and calibrated dataset..................................................................................................................51
4.1 Logit models for internet use and internet-related activity participation at person level..........................................................................................................................64
4.2 Logit models for out-of-home versus in-home maintenance and discretionary activities...............................................................................................................................65
4.3 Regression models for duration of in-home and out-of-home maintenance and discretionary activities ...........................................................................................................66
4.4 Poisson model for number of travel activities and regression model for duration of travel per person ..................................................................................................67

vi
LIST OF FIGURES
Figure Page
3-1 Activity episode allocation to individuals ...................................................................................30
4.1 Schematic representation of interactions between physical and virtual activity participation and ICT use trends ..................................................................................68
1
CHAPTER I
INTRODUCTION
1.1 Background
The limitations of trip-based approaches to travel demand modeling, especially its deficiencies
with regard to dealing with dimensions such as trip-chaining, departure time, household interactions, etc.
have been well-recognized. These shortcomings result from the fact that trip-based analysis does not
explicitly account for the fact that the demand for travel is derived from the need for activity participation
at different locations (Pas et al., (1996); Kurani et al., (1996); and Pendyala et al., (1996)). One
consequence of these shortcomings is that trip-based models are not policy sensitive to changes in
underlying activity patterns and associated behavior, and therefore are more correlational rather than
causal in character. Given these limitations, there is growing interest in analyzing and representing
individual traveler behavior together with the underlying activity patterns (Kitamura, (1996); Axhausen
and Garling, (1992); and Bhat, (1997)). Recent developments such as increased computational power,
availability of richer activity-episode level disaggregate data, and the development of more flexible
statistical models are also supporting the analysis of interdependent, and more complex traveler decisions
than ever before (Bhat, (1997); Bowman et al.,(1996); Revelt and Train, (1998); and Kitamura et al.,
(1996)).
Several behavioral dimensions that come under the scope of activity-based approaches (Kitamura,
(1995)), but were not adequately captured in trip-based traditional four-step models, include:
• Constraints that affect activity and travel patterns (e.g., work start time, store hours, vehicle
sharing, and parking cost)
• Scheduling of activities and trips over time and space: for instance, when to engage in what type
of activities, in what sequence, and at what locations.
• Within-day variations in behavior and demand, as another special aspect of behavioral change
(e.g., part-time carpooling, trip-chaining, task sharing),
• Trip-chaining: combining stops into a trip-chain,
• In-home/out-of-home activity substitution (e.g., going out for a movie vs. watching TV at home),
which is directly related to trip generation,
• Inter-personal linkages, which may take on the form of task and resource assignment (e.g.,
vehicle allocation within a household) and resource sharing (e.g., carpooling by family members),
2
joint activity engagement (family dinner at a restaurant), and activity generation (e.g., a child's
baseball/recreational activity generating the parent's activity of chauffeuring the child).
Capturing these richer and inter-related activity-travel dimensions poses several conceptual,
measurements, data and modeling difficulties when compared to trip-based models. Despite these
challenges, the activity-based framework offers the following advantages which more than offset its
disadvantages (Kitamura, (1996)) as follows:
• richer representation of time of day choices: which enables predicting travel behavior more
holistically;
• more accurate evaluation of transportation control measures: this framework is capable of
realistically assessing the impact of congestion mitigation or other transportation control
measures more accurately by considering impacts on daily travel, and by using the richer set of
decision dimensions noted above.
• more comprehensive view than trip-based models: this framework treats a daily activity-travel
pattern as a whole, thus avoiding the shortcomings of conventional trip-based methods;
• increased realism: since this approach explicitly includes effect of constraints such as vehicle
ownership, household role, etc. , the approach facilitates more realistic prediction and scenario
analyses;
• more policy sensitive: activity-based models provides planners with a richer range of tools since
the approach can be used to influence activities directly rather than influencing trips indirectly.
For instance, the approach can be used to analyze the effect of new activity opportunities (e.g.
day-care facilities at work), change in activity patterns (increased work-duration or work
flexibility) etc.
Due to these conceptual advantages of activity-models, a relatively large body of knowledge has
started to emerge in relation to the various aspects of activity-based analysis of travel behavior and
demand. In this context, studies have mostly focused on the following dimensions of analysis: i) activity
generation including number of tours, and trips produced by a household, ii) activity scheduling including
timing of activities, duration, and timing of trips, iii) activity allocation which pertains to allocation of
activity episodes to different tours performed by individuals in the household. The research along these
lines is briefly reviewed in Chapter 2. While most studies have focused on the first two of these
dimensions, this thesis focuses on two dimensions of activity-travel behavior which have received
comparatively less attention. This thesis aims to investigate activity allocation, particularly, the allocation
of activities between household members, and the role of interactions between Internet and
3
Communications Technology (ICT) use, activity and travel patterns. The allocation between household
members is important in the context of various aspects of travel demand including trip-chaining, vehicle
ownership and use levels, and time-of-day decisions, with implications for congestion, air-quality, and
others. The interest in ICT technologies on activity patterns stems from their potential to increase
connectivity and access, as well as their potential to eliminate certain types of trips. Given their
conflicting effects on travel demand, and the rapid growth in use of these technologies, a systematic
examination of how ICT use affects activity patterns, and travel patterns is essential.
The rest of this chapter is organized as follows. Section two describes the motivation for this
study from an empirical and practical perspective. The next section discusses the objectives and the
scope of this thesis. The approach used in this study is also outlined in this section. The final section
(Section 1.4) presents the structure of the thesis and provides a brief overview of the following chapters.
1.2 Motivation
This study aims to analyze activity-travel patterns of households in the context of travel demand
analysis for transportation planning purposes. Specifically, the following two dimensions will be
investigated:
1. Person allocation: allocation of activities among household members, and
2. the influence of Information and Communication Technologies (ICT’s) on activity and travel patterns.
The main activity types under consideration in this study are discretionary and maintenance
activities. In contrast, discretionary activities are those that can be performed at the discretion of the
household or its members (for instance, recreational, social, games, community/civic activities, volunteer,
etc.). For instance, a household may choose to participate in a few, if any, recreational activities on a
certain day. In keeping with its flexible nature, the choice of location, and timing of discretionary
activities is also flexible. Consequently, substitution across household members may be permissible in
some discretionary activities. Maintenance activities, on the other hand, are those required for the
maintenance of the household and include: shopping, banking, laundry, household and personal chores,
appointments (medical etc.), eat meal, and pick-up/drop-off activities etc. There is a wide range of
variation with regard to the flexibility in location, timing, and person participating in maintenance
activities depending on the specific activity purpose. In this study, subsistence activities are not the focus
of analysis since these activities tend to be personalized with limited potential for change of person,
location or timing dimension. Unlike, maintenance and discretionary activities, subsistence activities are
excluded from this study. Subsistence activities include activities pertaining to work, school, and others
that are essential activities that must be performed at fixed locations/times for most individuals.
4
Furthermore, these are highly individualized activities that cannot be performed by others in the
household.
The motivation for this study is two-fold: first, person allocation to activities is important from a
behavioral perspective, since person allocation patterns can strongly influence vehicle occupancy levels,
trip-chaining and mode choice and thus have significant implications for congestion, air-quality, and
demand estimation for transit. For instance, how a household with one car allocates the activities and the
vehicle across household members can determine the mode choice and timing of the various trips in the
household. The allocation of several activities and trips to a single person (say the employed head of the
household) may result in a greater degree of trip consolidation and trip-chaining, resulting in lower
emissions rate, where several of these trips may be performed during the evening peak period or post-
peak period. In contrast, in a household (with many adults and many vehicles), where the tasks may be
delegated more evenly across members, more trips may result and may be staggered over time (possibly
leading to lower congestion), resulting in fewer chained trips and worse environmental impact. In this
respect, this study aims to explicitly analyze the allocation of maintenance and discretionary activities to
household members.
From a practical standpoint, person allocation of activities has substantial practical implications
in the context of: evaluation of vehicle occupancy based traffic management strategies such as: High
Occupancy Vehicle (HOV) and High Occupancy Travel (HOT) lanes (person allocation may be used to
determine the type of households and the conditions when activities are less likely to be flexible with
regard to person occupancy - solo versus joint activities). Similarly, disregarding the constraints on trip-
chaining and joint travel (that may arise due to household interaction and may favor one mode over
another) can result in erroneous and misleading demand estimates while assessing the effectiveness of
alternative transit improvement policies. For instance, the improvement of travel time or waiting time
through more frequent services may prove to be ineffective and expensive, if there is a significant demand
for trip-chaining on a route that may not be served by the transit. Furthermore, the person allocation
patterns can also affect the departure time of trips which in turn affects the time-varying nature of
congestion patterns on the network. Given these motivating considerations, there is a need for richer
behavioral and policy sensitive representation of person allocation in activity-based microsimulation
models of travel demand.
Second, recent advances in Information and Communication Technologies (ICT) make activities
possible to conduct virtually, thus obviating the need for physical travel, at least for some types of
activities. Activities that may be performed virtually include: online shopping, telecommuting,
teleconferencing, information gathering, and maintenance activities (e.g. online banking). Further, as the
prices of ICT products and services fall due to improved economies of scale, the adoption and use of
5
these ICT devices (e.g. cell phones) continues to grow rapidly. These socio-technological developments
offer individuals both the opportunity and the ability to substantially alter their activity and travel
patterns. ICT use may contribute towards reducing urban congestion and air-quality problems (by
replacing travel with virtual activities); on the other hand, they may also generate significant additional
and induced travel due to the increased connectivity and access to resources that they provide. Thus,
empirical insights on how the growing ICT use affects travel patterns and vice-versa has important
implications for travel demand forecasting. While some researchers have investigated the effect of
internet technologies on specific activities such as shopping or work trips, the interaction between ICT,
activity, and travel patterns has not been adequately analyzed. Therefore, this paper investigates the
linkages between ICT use, activity participation decisions, and travel patterns using recent empirical
activity-diary data from the San-Francisco Bay Area (MTC, (2000); and Vaughn, (2003)).
ICT use can lead to a range of changes in activity travel patterns, including substitution,
generation, and modification (Mokhtarian et al., (1997); and Krizek et al., (2003)). Substitution and
modification of trips can have a significant impact on transportation system performance. For instance,
the availability of virtual activities could result in fewer and/or more efficient trips in some cases. On the
one hand, ICT use can promote more frequent yet more efficient trips, whereas, on the other hand ICTs
can eliminate certain types of trips. Thus, ICTs can significantly affect mobility and travel demand,
although the magnitude and nature of their impact is unclear as yet and requires more detailed analysis.
The relative impacts on substitution, generation, and modification have important implications from a
travel demand management perspective. The greater connectivity and mobility also indicates the potential
for aggravation of urban congestion and air-quality problems with increasing connectivity and growing
adoption of ICT systems.
1.3 Objectives and overview of approach
Based on the motivating considerations noted above, the following six objectives are considered
in this study. The first three relate to person allocation models, and the last three are related to activity
participation and ICT use:
1. To develop a methodology to model person allocation to activities that partially addresses the
shortcomings of existing models.
2. Investigate the effect of socio-demographic, household role, and trip attributes on activity allocation
and explore the role of constraints on time, vehicle availability, cost, and coordination on activity
allocation among household members.
6
3. Analyze differences between households in allocation of persons to activities and the underlying
factors.
4. Propose empirical models and analyze the ICT use patterns of individuals.
5. Investigate the linkages between ICT use and physical/virtual activity participation for discretionary
and maintenance activities.
6. Analyze the interactions between observed daily travel patterns (represented by the dimensions of trip
frequency and trip duration), ICT use and individual’s activity attributes.
To achieve the first three objectives, this thesis proposes a series of disaggregate discrete choice
models with suitable econometric specification for the analysis of person allocation of activities (i.e. to
household members). The differences in allocation between maintenance and discretionary activities are
analyzed explicitly by calibrating two sets of logit-based multinomial choice models. The analysis in this
study is based on the disaggregate activity travel data from the Bay Area Travel Survey 1996, which
contains rich data on activity episode records. This data was obtained using a two-day activity diary
survey from 3,344 households. In this survey, data was collected on activity participation of individuals
including details of each activity episode by each household member (more than 14 years of age). The
activity data includes purpose, location, and duration of each activity, along with the associated travel
attributes.
To address the objectives in relation to the ICT objectives (objectives 4-6), this study uses
disaggregate activity travel data from the Bay Area Travel Survey 2000 (MTC, (2000)), since the earlier
survey data did not contain ICT use information. In particular, a series of discrete and continuous
statistical models are estimated using the rich and highly disaggregate activity diary from the San-
Francisco Bay Area. With regard to ICT use and virtual activity participation, five binary discrete choice
models are estimated. The first is a binary logit model for analyzing whether an individual used internet
on a given day or not. The remaining four models investigate the use of internet (yes/no) for various
activity types such as: subsistence, browsing, recreational and maintenance activities as defined by the
discrete binary dependent variables. The second set of models analyzes the following dimensions: in-
home versus out-of-home discretionary episode choice, in-home versus out-of-home maintenance activity
participation (using binary logit models), and the durations of in-home and out-of-home episodes for
these activities (using regression models). The third set of models focuses on two travel dimensions,
namely, duration and frequency of daily trips by an individual. In this set of models, the effect of ICT use,
individual and household attributes on daily travel decisions are investigated. The travel activities cover
multiple modes including driving, walking, bus, and others. The duration analysis is conducted using a
regression model, whereas, frequency analysis is performed using a Poisson regression model. Statistical
7
significance tests are used to identify main factors affecting the relationship between key explanatory
variables and dependent variables described above.
1.4 Structure of thesis
Chapter 1 describes the conceptual basis for pursuing activity-based travel demand modeling and
its advantages. Further the objectives of this study and the motivation for investigating these objectives
are also discussed. Chapter 2 reviews relevant literature on activity based analysis and highlights
significant findings in existing literature in relation to the objectives of this study. This chapter also
identifies some key limitations and gaps in existing studies with regard to the objectives of this study. In
Chapter 3, a model is proposed for the analysis of activity allocation across household members. The key
factors affecting the activity allocation decision are identified by estimating an empirical model using the
1996 San-Francisco Bay-Area activity survey data. The differences between households are compared
based on the modeling results. The framework for modeling and analyzing the influence of ICT patterns
on activity and travel behavior are presented in Chapter 4. The empirical effects of ICT use, socio
demographic, household, person, and trip characteristics on travel are also presented and discussed. The
final chapter summarizes the key findings from this study and proposes directions for future research.
8
CHAPTER II
BACKGROUND AND LITERATURE REVIEW
2.1 Introduction
The need for more accurate forecasting tools with richer analytical and theoretical basis than the
conventional four step process is a primary motivation for activity-based demand modeling approaches.
From a policy standpoint, the thrust towards intermodal transportation systems, requirement of congestion
management systems for large urban areas (population >200000 people), and growing concern about air-
quality are also providing strong impetus for the development of forecasting tools that can provide richer
insights and greater accuracy (Goulias, (1996). The need for policy sensitive analysis of travel demand in
turn necessitates a deeper and richer understanding of temporal, spatial, and behavioral elements
underlying observed travel and associated activity patterns. Toward this end, activity based approaches
propose a framework wherein travel is analyzed as daily or multi-day patterns of behavior, related to and
derived from differences in life styles and activity participation among the population (Jones et al.,
(1990)).
As a research framework, activity-based analysis is concerned with the formation and execution
of activity and travel patterns by households. The choice dimensions underlying these patterns include:
creation of activity schedules, the mapping of activities in time and space, linkages within a household,
activity type choice, and the resulting travel decisions including mode, timing, trip duration and distance
of trips (Kurani, (1996)). The study of how these decisions are made requires a basic understanding of the
activity scheduling mechanisms, linkages between the members of a household that perform the activities,
the corresponding resource availability, feasibility constraints, and institutional regulations that may limit
the patterns, and the supply side opportunities for activity participation.
The major conceptual differences between activity and trip-based approaches may be summarized
as follows:
1. The activity-based frameworks explicitly recognize and seek to operationalize the notion that the
demand for travel is derived from the need to participate in activities at geographically dispersed locations
(Oi and Shuldiner, (1962)).
2. In contrast to the focus on individuals as the source/generators of travel, households are assumed to
generate activities that result in observed travel patterns. This generation of activities is essential to fulfill
subsistence roles (work, education), maintenance of the household (shopping etc.), and recreational needs
of the household (entertainment, exercise etc.).
9
3. The focus is less on vehicle trips but more on household members’ participation in activities. Given its
stronger behavioral and psychological underpinnings than trip-based approaches, over the past decade
several conceptual frameworks and operational activity-travel simulation systems have also been
developed. Many modeling studies have been conducted into the various dimensions associated with
activity-travel patterns especially over the last decade, leading to a large and rapidly growing body of
knowledge. These developments have contributed significantly towards making an activity-based
approach a vibrant area of continuing research.
This chapter discusses salient issues, insights and models of relevance from activity-based
modeling approaches to travel demand analysis. The purpose of this review is two-fold. First, the review
aims to describe the essential characteristics of the process under study, and outline the approaches
adopted by various researchers while highlighting their salient advantages and limitations. Second, an
attempt is made to synthesize current knowledge on activity-based analysis particularly in the context of
the objectives of this study (presented in Chapter 1). Therefore, this review is not intended to be
comprehensive in the related streams of research, which bear more detailed investigations. In view of the
objectives of this study, this chapter focuses on the following three broad areas: modeling approaches,
broad empirical findings and substantive insights in relation to activity based models, and review of
literature on person allocation and ICT use on activity pattern and travel behavior.
Accordingly, first, the literature pertaining to conceptual and modeling frameworks is presented
in Section 2.2. In Section 2.3, the classification of activities into various categories, and broad trends
based on activity types reported in the literature are briefly discussed. Section 2.4 summarizes salient
findings on intra-household interactions and inter-household differences in activity patterns. The
following section presents a discussion of research on impacts of ICT (Information and Communication
Technologies) and advanced technologies on activity and travel patterns. The chapter is concluded with a
discussion of salient gaps and limitations of existing studies in relation to the objectives of this thesis.
2.2 Conceptual and modeling frameworks
Transportation planning agencies, nationwide, are engaged in collecting large amounts of highly
disaggregate data on activity and travel patterns of households. Examples of such large activity-travel
databases include the San Francisco Bay Area Activity-Travel Survey (1996) and the Puget Sound
Transportation Panel (1987-1999) [Metropolitan Transportation Commission, Vaughn et al., (1996); and
Viswanathan et al., (2001)]. These data are intended to convey a more accurate picture of travel-demand
than trip-based models and provide a better basis for evaluating investments and assessing alternative
transportation control measures, possibly using micro simulation approaches [Jones et al. (1990);
Kitamura et al. (1996); and Bhat et al. (2004)].
10
However, these activity travel databases are large and contain data on complex relationships
between numerous inter-related activity and travel choice dimensions [Pas (1996); Pendyala et al.
(1996); and Bowman et al. (1996)]. The size of the databases can be illustrated through the Bay Area
Travel Survey that consists of records of 203,000 activities, and 64,000 trips (to be used in this study).
Activity travel data can be represented in the following form. Observed activity travel patterns
(Sitn) for a given individual i, on day t, who undertakes n activities can be expressed as follows:
Sitn = { (T1,A1), (T2,A2),…………., (Tn,An)} (1)
The vector of travel decisions Tr (for the rth activity) consists of the decisions of travel mode,
route, departure time, destination, and trip-time. The vector of activity decisions, Ar, is made up of the
dimensions of activity purpose, duration, location, and others.
Despite the deceptive simplicity of equation 1, the actual activity travel patterns are extremely
complex [Bhat et al. (1999)]. The complexity arises due to: a) large number of multivariate (correlated),
multinomial (many alternatives for each choice dimension such as departure time, activity sequencing
decisions) decision dimensions, b) complex linkages over time and space, and c) significant heterogeneity
(variations across different population segments) in activity participation and travel. These sources of
complexity pose significant methodological and computational challenges in developing data mining and
analysis methods for activity-travel data. These are illustrated below in the context of existing analyses
methods.
Existing methods to analyze activity-travel behavior can be classified into three categories:
extensions of trip-based methods, econometric frameworks to model joint choice decisions, and
combinations of pattern matching and segmentation methods. Methods in the first category focus on the
analysis of extended trip units such as trip-chains and usually model related choice dimensions jointly
[Bhat et al. (1997)]. While this approach is more accurate than a trip-based model, the approach still
retains many limitations of trip-based models including its inability to account for time-of-day and across-
tour effects.
To overcome these limitations, the second class of models attempts to jointly model all relevant
choice dimensions selected by an individual [Bowman et al. (1996); and Kitamura et al. (1996)]. This
approach models the observed pattern of choices jointly by successively conditioning on the previous
events in the day. Thus the likelihood of observing a sequence Sitn of activity and travel choices is given
as:
P{ Sitn} = P[(T1,A1)] P[(T2,A2) | (T1,A1)].… P[(Tn,An)| {(T1,A1),., (Tn-1,An-1)}] (2)
The choice dimensions within travel and activity vectors (T, A) are similarly decomposed. This
approach is theoretically appealing, but computationally expensive due to the large dimensionality of
models and parameters. There are practical parameter identification problems (in statistical models) due
11
to the non-convexity of the likelihood function. Further the systems of models are susceptible to
inconsistency and bias and error propagation if the choice sets or correlations are misspecified.
The third category of models uses a combination of clustering and discriminant analyses to
analyze activity patterns [Recker et al., (1986a&1986b); and Garling et al. (1994)]. In these models
patterns are represented by character strings, and are clustered based on heuristic dissimilarity measures.
Factors influencing cluster membership is determined by discriminant analysis. This approach, though
intuitively simple and computationally inexpensive, is behaviorally and methodologically limited in
capturing interactions between correlated multiple dimensions.
A fourth category of models aims to analyze the scheduling of activities through the analogue of
computerized production systems that comprise a set of rules in the form of condition-action (If-Then)
pairs (See Garling et al., (1994)). Generally these approaches tend to separate out generation and
scheduling activities, whereas, the joint modeling of generation and scheduling is likely to be more
realistic due to the mutual interdependence of certain common factors (Bhat and Koppelman, (1999)).
Computational Process Models are production systems models that are based on a set of rules in the form
of condition-action pairs (Garling et al., (1994); and Miller et al., (2003)). Compared to the first two
categories of models, which capture causal relationships using a system of equations and have a strong
statistical foundation to test alternative hypotheses, the latter two approaches are based on heuristics and
simulation-based approaches.
The common feature in all the approaches noted above is that they focus on the following
decision dimensions in general: generation of activities at the household level, scheduling of activities
over time and space, interactions between activity and travel decisions over the day/week/other time
period of analysis, interactions between and within-households given the numerous spatial, temporal and
interpersonal constraints that affect activity participation and travel choices. However, they differ from
each other with respect to the primary decision variables, the temporal resolution of analysis (episode
level, daily level, weekly level, choice set construction, econometric basis etc., computational complexity,
and explicit or implicit nature of treatment of constraints.
The existing modeling frameworks may be summarized by the following observations. First, the
sources of complexity highlighted earlier have been shown to be empirically significant and modeling
methods must account for these relationships. Second, existing data analysis methods have significant
shortcomings from computational, methodological, or behavioral perspectives. For instance, there are
significant gaps in these approaches with regard to the treatment of choice set formation, sequencing,
constraints, endogeneity, dynamics and correlations, and heterogeneity. More efficient and focused
12
analysis methods are needed to address these shortcomings, particularly, in the context of emerging
dimensions such as the role of advanced telecommunication technologies, or household interactions.
2.3 Activity-types and empirical analysis
Given the differences across activity patterns and constraints across different types of activities,
typically activities are classified into the following three categories to classify activities: Subsistence,
Maintenance and Discretionary or Leisure activities. The activities separated into these categories vary
primarily in terms of their spatial and temporal characteristics. Subsistence activities refer to activities
which are essential for the household such as work, education etc. and are typically non-home based and
performed at fixed locations and often at fixed times (start and end-times) with little flexibility about
these dimensions and are highly periodic in nature. In contrast, discretionary activities have substantial
flexibility about whether or not they need to be performed, where, and when and therefore tend to be
fairly the spectrum in terms of spatial and temporal flexibility and periodicity. These refer to activities
such as groceries, filling gas, shopping, and others. which can be performed at not necessarily at fixed
times, and possibly at different locations. In terms of periodicity, they may be cyclical (for e.g. regular
grocery shopping, or irregular in frequency such as specialty or gift shopping). These differences in the
nature of activity patterns are also reflected as differences in travel patterns, in terms of time-of-day,
mode-choice, destination location etc. Therefore, segmenting activity and travel patterns based on activity
purpose is essential.
Several studies have adopted this segmentation approach in analyzing activity and travel demand.
There is a significant body of travel behavior literature on subsistence activities particularly focusing on
work travel and commuting behavior. Numerous studies in this context (over the last three decades) have
focused mainly on the dimensions of route, departure time, and mode choice of commuters, since
destination choice is fixed. Factors influencing route choice include: travel time on alternate routes, habit,
familiarity with the area, scenic nature, presence of congestion/accidents, availability and use of traffic
information etc. Factors that affect departure time on the other hand are schedule delay (early and late),
travel time, route-choice dimensions, travel time variability in the network, and others. Perhaps, the most
extensively studied choice dimension in this regard is mode-choice which appears to be affected by:
level-of-service attributes of modes such as travel time, waiting time, access time, transfer time across
modes and on-time reliability, cost, convenience, and socio-demographic characteristics such as vehicle
ownership, income, age, gender, and others. There is also a line of work that focuses on trip-chaining
during the work commute. Along this line, some of the key factors that affect trip-chaining behavior are
car-availability per worker in the household, license-holding, presence of children in household, income,
13
joint activity participation, occupation, number of days to work, and car requirement for job etc. Recently,
several studies have also investigated the influence of work activity on non-work travel and activities.
Activities such as grocery shopping, and irregular shopping are classified as maintenance
activities in some studies, although there have been significant variation in this nomenclature across
studies. Among these shopping behavior has begun to receive increasing attention for several reasons.
First, the Nationwide Personal Transportation Survey (NPTS), 1995 (See FHWA and BTS, 1995) shows
that 20.2 percent of total trips are shopping trips which is greater than the work trip percentage (17.7%).
Second, there is significant flexibility associated with shopping trips for several reasons: i) they are
spatially and temporally less rigid in character relative to work trips, ii) non-workers play an important
role in performing shopping trips who have greater degree of time-flexibility, and iii) several avenues for
e-shopping and e-commerce are recently emerging which may eliminate the need for travel associated
with shopping in some cases. Further, observing workers trip-chaining commuting trips with shopping
activities along the way which can strongly affect travel patterns (this trip-chaining may render particular
modes unattractive for commute mode choice - e.g. bus due to the difficulty in carrying goods or grocery
bags.). Several studies that have investigated shopping related activity and travel have noted the
importance of the following factors: age, gender, time-constraints, income of household, ratio of
workers/non-workers, presence and age of children, institutional timings (of shop and work), cost of
activity, household role, land-use and supply opportunities on the duration of activity, location and
distance of travel, and the mode chosen for travel. Recent studies are also examining the role of internet
on electronic shopping behavior of consumers (Farag et al, (2003); and Casas et al., (2001)). For reasons
noted above, non-work activity in general and shopping activity travel in particular has been receiving
increasing attention in recent research studies (Bhat., (1998); Steed and Bhat, (2000b); Bhat and Steed,
(2000)).
Discretionary activities include activities such as entertainment, hobbies, visiting, and exercise.
Given the greatest degree of temporal and spatial flexibility in these activities, the elasticity to travel time
is observed to be the least elastic (compared to the previous two types of activities) and the cost elasticity
is perhaps the most. Studies focusing on discretionary activities have investigated the activity duration,
location, mode, and timing of such activities, and the associated mode choice (Bhat and Lockwood,
(2004)). For instance, Bhat and Lockwood, (2004) analyzed weekend day social-recreational activity
episodes using 2000 San Francisco bay area travel survey. The authors formulated a mixed logit model
for four choices: physically active recreational travel, physically active recreational activity, physically
passive recreational travel and physically passive recreational activity. The authors found that senior
adults (older than 65 years) are most likely to participate in physically active travel recreation compared
to other recreation categories. Higher income households are less likely to pursue physically active travel
14
episodes for recreation. The authors also noted a higher propensity to participate in physically active
travel episodes on Sundays compared to Saturdays. Other major findings along this line of investigation
include: (a) economic characteristics of the household play a strong role: income, car-availability, (b)
highly elastic to price and inelastic to travel time, (c) personality related factors play an important role -
health consciousness, variety seeking, and (d) household structure and life-cycle play an important role
with greater participation is observed of younger and older respondents, for different reasons. The
younger respondents were more likely to participate in recreational activities such as exercise, and
physical fitness, whereas, older respondents have greater time-availability to pursue other discretionary
activities.
2.4 Household role and within-household interactions
Subsistence activities are mostly personalized activities (such as work, or school) where
substitution across household members is not possible. In contrast, task-sharing and delegation between
different household members is possible for maintenance and discretionary activities. For this reason, this
review primarily focuses on household role, and inter-person interaction mainly in the context of
maintenance and discretionary activities. However, the role of work-related trips on such household
interaction is also discussed. Jones et al., (1990) identify use of households as the decision-making unit
and incorporation of inter-personal constraints as two important emerging features of activity analysis.
Bhat and Koppelman, (1999) in their review of activity-based travel demand modeling noted that
“…efforts which accommodate inter-individual interactions in activity patterns with efforts that use a
continuous time domain is likely to be a very fruitful area for further research.” In the past few years,
this important feature in activity-travel analysis is gaining research attention. For instance, Gliebe and
Koppelman (2001) remarked that joint activities tend to have a longer duration than non-work
independent activities, and persons tend to stay out later and travel farther from home.
Several studies have examined the interaction between household members in the context of
activity allocation to household members. Hagerstrand’s (1970) pioneering work on activity-based
frameworks in the early 70’s identifies three such constraints influencing such interactions: coupling
constraints, capability constraints and authority constraints. Coupling constraints relate to the need for
coordination between household members’ activities (for. e.g. due to joint activity participation).
Capability constraints on the other hand refer to the limitations of an individual/household to undertake
certain types of activities (e.g. lack of car/license). Authority constraints refer to institutional or other
constraints which are imposed externally and are generally binding.
The interaction between workers and non-workers in a household in terms of activity allocation
has been receiving increasing research attention. Along this line, Bhat and Mishra (2003) investigated the
15
following decisions for non-workers: stop occurrence, stop type, and activity sequencing. They reported
that non-workers in households with several employed individuals are less likely to leave home during the
day. In contrast, individuals in a single-member and couple households, and in high income-earning
households, are more likely to venture out-of-home to participate in activities. Goulias and Kim, (2001)
analyzed activity and travel patterns at multi-level both at household level and person level. Activity
patterns are classified into four groups of persons called worker-A, worker-B, Shopper and inactive
individuals, based on the length and purpose of the trip. Similarly, travel patterns are also grouped into
four groups of persons called non-motorized, car or carpool, public and immobile based on the mode of
transportation. Explanatory variables that were significant in this study include person level, household
level, time related, and accessibility characteristics.
Some researchers have focused on joint activity participation as a measure of household
interaction. Joint travel by household members was modeled by Vovsha et al, (2003) at various stages:
based on purpose of the activity, joint travel is classified based on the composition of participating
members (such as joint tours with adults only, children only and adults with children). The primary
conclusion in the study was that a significant percentage of household trips involved joint travel, and joint
travel is common for school, maintenance and discretionary purposes. Balasubramanian and Goulias,
(1999) presented a probit-model for the analysis of solo and joint trip making behavior. They found that
life cycle stage has significant effect on joint trips such as trips made by multi-adult older household.
Further, household with children are more likely to participate in joint trips. The authors also reported that
persons classified as shoppers and car-poolers have a higher probability of making joint trips compared to
others. In a similar study, Stopher and Metcalfe, (1999) observed that the time allocation of households to
activites varied significantly based on life-cycle groups.
Other researchers have investigated household interaction and allocation based on gender,
household role, and other factors. A recent study that examined individuals’ participation in activities is
by Bhat and Srinivasan, (2004). In this study, the authors evaluated the factors that affect the allocation of
shopping activities in households with couples. A nested model is developed for generation and allocation
of shopping activities (for male only, female only, both independently and both jointly) and a hazard
duration model is estimated for duration of shopping (male, female and joint). The authors reported the
following findings: ‘the work duration of household heads negatively impacts the decision to undertake
shopping during the day, a female non worker is more likely to be allocated the shopping responsibility
compared to male non worker and both adults, on weekends, are found more likely to perform shopping
activities jointly’ (Bhat, (2004)). Along similar lines, Scott et al, (2002) performed empirical analysis on
out-of-home activities of three types of households: couple, non-worker; couple, one worker; and couple,
two worker households and reported the following findings. The presence of children in a couple, non-
16
worker household result in more number of independent activities by males than females. More number
of joint activities is found in households where children are present. Females who live in two worker and
one vehicle households are more likely to participate in independent activities than females in multiple
vehicle households. Other studies have also noted that joint activity between adult heads of households is
significantly affected by the presence of children (Jones et al., (1990), Balasubramanian and Goulias,
(1999); and Townsend (1987)). Simma and Axhausen, (2001) used structural equation models to capture
the interactions between heads of the households with regard to participation in out-of-home activities.
Dependent variables include number of cars, number of maintenance trips, number of leisure trips, and
number of day distance trips by both males and females. Explanatory variables such as person
characteristics, accessibility and activity related characteristics strongly affected the allocation of trips.
While the studies above analyze activity participation propensity, some researchers analyze the
household role by examining time allocation patterns across household members. For instance, Goulias et
al., (2001) found that males allocate more time to subsistence activities compared to females and non-
workers allocate more time to maintenance activities compared to workers. Gliebe and Koppelman,
(2001) estimated time allocation for different out-of-home activities by adult household members using
proportional share model. Independent and joint activities are classified into subsistence, maintenance,
leisure and home activities. The number of children, ages 0-17 years, had a significant positive effect on
the time allocated to out-of-home independent maintenance activities by females relative to males. The
variable, autos per person, was also found to have positive effect on time allocated to independent
maintenance and leisure activities.
Golob and McNally, (1997) use a structural equations model to explain activity interactions and
related travel between heads of households. Their analysis is limited to modeling activity participation
and travel of couple households. By analyzing the durations of activities and travel for maintenance,
discretionary and work activities, they reported significant interactions between members of household in
their activity participations. However, they did not consider joint activity participation or joint travel in
their analysis. Fujii et al., (1999) also used structural equation model system to study individuals’ joint
activity engagement. In this study, two models were presented: one for travel patterns and quality of life
and the other for time allocation. They concluded that individuals prefer out-of-home solo activities to
out-of-home joint activities with family members. They observed that a worker or a housewife is more
likely to prefer spending time with family members at home.
Examining the reasons behind such inter-person interactions, Srinivasan and Bhat, (2003) suggest
four factors which may lead to interdependencies among the activity-travel characteristics of household
members: a) members of a household may share the responsibility in undertaking maintenance activities,
leading to substitution effects among the members; b) companionship desires may motivate household
17
members to undertake activities jointly; c) member of household acting as ‘chauffeur’ to enable other
members participate in activities, e.g. chauffeuring children to school; and, d) compulsion to share the use
of single car. The activity-travel behaviors of individuals, therefore, are dependent on those of other
members of the household. Based on empirical analysis, Srinivasan and Bhat, (2003) found that gender,
sharing the use of a single car, and presence of only one licensed driver in the household affect allocation
of household shopping activities.
Townsend et al(1987) developed a conceptual framework for the analysis of multi-day activity
patterns of households and their members, based on household utility maximization as weighted by the
power of individual members. He showed evidence for the existence of three constructs related to intra-
person and interpersonal time trade-offs in activity and travel patterns – efficiency, companionship and
power/altruism. Efficiency was found in the case of single mothers who take specialized roles and link
efficient linking of trips in tours. Companionship was observed while engaging adults without children in
joint activities. Power is illustrated by individuals with more income, job status and education avoiding
household maintenance activities, as contrasted with altruism in which more powerful individuals forgo
free time to fulfill maintenance activities or help less powerful members of the household (children). He
also found evidence of both substitution and complementary effects in husband-wife task allocation.
Scott and Kanorglou, (2002) also study interactions between household heads in the generation of
daily household non-work, out-of-home activity episodes using a trivariate ordered probit model. These
authors suggest two reasons for why household-level models may result in better demand forecasts than
individual models: First, individual level models are incapable of handling complex responses to TDM
measures, such as re-assignment of maintenance activities to a ‘better’ placed individual, and second,
individual level models do not account for joint out-of-home activities. The modeling framework used by
Scott, (2001) explicitly recognizes, a) membership identity within a household, b) the activity setting
(independent or joint), and c) activity episodes as units of analysis.
The studies cited above analyze the activity participation patterns of household members in terms
of couple households, life cycle groups, time allocation to various activities, joint activity engagement,
and interactions among household individuals. These studies have presented empirical evidence,
important insights and conceptual framework in relation to activity engagement of household members.
However, above studies also have some limitations which cannot be ignored. For instance, differences
across households in allocation patterns among head of the household, spouse, children, parent, and in-
law have not been investigated. Similarly, specific person choice has not been considered in several
studies (since the allocation is based on gender or employment characteristics). The lack of person
specific identification of activity allocation may lead to misspecification because of correlated errors and
will not distinguish activity participation by members with the same characteristics (e.g. between
18
household non-workers). The current study addresses these shortcomings and investigates these aspects
and significance of these aspects is discussed in sections 3.6.1, 3.6.2, and 3.6.3. Some other limitations of
the above studies include: inadequate treatment of correlations between household members, variability
within and between members, and neglect of a significant fraction of other trips which are performed by
household members other than head of the household and spouse. The current study aims to address these
limitations and presents empirical evidence that some of these factors are empirically significant.
2.5 Role of ICT and advanced technologies on activity allocation in the household
The advances in information and communication technologies in the form of internet, telephone,
mobile phones etc. today offer three key capabilities that can significantly alter activity and travel patterns
of users: a) greater connectivity to people and resources, b) greater selectivity through the ability to search
and browse, and c) the ability to perform many activities which required out-of-home travel previously,
using electronic means (virtual activities). Given the increasing diffusion of these ICT technologies, the
activity patterns and household allocation, and associated travel patterns will also change. In this context,
the review below discusses relevant literature from the following four research threads pertaining to the
role of ICT on activity and travel patterns: i) Telecommuting - the role of ICT’s on work activity
participation, ii) E-shopping - the role of ICT’s in shopping activities, iii) the effect of different types of
ICT devices on overall travel and activity patterns and iv) findings from other studies in relation to
substitution, modification of travel activities due to ICT use.
2.5.1 Role of ICT’s on telecommuting
In the context of telecommuting: Mokhtarian and Salomon, (1997) analyzed the influence of
attitudinal factors while modeling the preference to telecommute. Their results highlighted the role of
facilitating factors and constraints (e.g. job suitability) in telecommuting decisions, in addition to the
effect of key travel related factors such as commute time, commute stress and personal benefits.
Similarly, Mokhtarian and Meenakshisundaram, (1999) studied substitution and complementarity effects
among the different modes of communication at the individual level. Structural equation models are used
to analyze various factors involved in this context. Net generation of communication was found in a six-
month period and complementarity is found across different modes of communication. These modes
include phone, fax, e-mail, personal meeting and trips. Wells et al., (2001) presented case studies on the
implications of telecommuting on travel behavior, based on surveys conducted in the twin cities of
Minnesota. They found that telecommuters tend to have significantly longer commutes than non-
telecommuters. Mokhtharian, (1989) reviewed and identified additional relationships between
transportation and telecommunications in addition to present conceptual relationship. Two empirical
19
examples based on video conference and telecommuting are presented, the former is an example of
stimulation and the latter one could be considered as an example for reduction of travel.
2.5.2 Influence of ICT’s on e-shopping behavior
The influence of ICT’s on shopping behavior has also been receiving increasing attention
recently. Farag et al., (2003) studied the impacts of e-shopping on personal travel behavior. Their findings
suggest that electronic shopping can result in saving time for consumers. They also noted that the
propensity for online shopping does not differ significantly across urban and rural areas. Middle -aged
males are found to prefer online shopping activities to their female cohorts. Casas et al., (2001) also
studied the impacts of online shopping on travel based on a one-day activity data. They concluded that the
individuals who took part in Internet shopping do not make fewer ‘physical’ shopping trips.
2.5.3 Effect of different types of ICT devices on overall travel and activity patterns
Another interesting line of inquiry relates to the relationships between travel patterns and ICT use
is evaluating the effects of ICT devices on travel. Along this line, Hjorthol, (2002) tried to explain the
relation between daily travel and computer use at home, especially with regard to the degree of
substitution. Access to information technology is found to have significant impact on travel activities.
However, the author could not see any direct substitution effect of computer access at home on travel
patterns. Bhat et al., (2003) focused on the effects of mobile phone and home computer usage on out-of-
home non-maintenance shopping patterns. Their results show some evidence to substitution and
complementary effects among different groups of individuals. For instance, mobile phone usage can
result in a substitution effect on shopping trips for individuals, with certain educational and demographic
characteristics. Senbil and Kitamura, (2003) investigated the effect of cellular and home phones on travel
behavior. In this study frequency and duration of activities like home, work, discretionary and joint
discretionary activities are modeled in relation to the number of phone-based communication activities.
Poisson, Tobit regression and structural equation models are used to estimate these effects. The empirical
findings suggested that the use of cell phones is positively correlated with work duration, and the
frequency of joint discretionary activities. Classie and Rowe, (1992) investigated the interaction between
telephone use and mobility. They found that two thirds of the total telephone traffic is related to an
individual’s mobility. Further they estimated seven percent increase in urban peak hour traffic due to
hypothetical telephone network breakdown.
Viswanathan and Goulias, (2001) studied the impact of many types of ICT devices on total
duration of travel and total duration of activities. They found that computer usage at work or school
increases the daily activity durations but has no effect on travel duration. Internet users are found to spend
20
less time on travel, whereas mobile phone user increases the duration of travel, but not the activity
episodes. However, only aggregate travel durations in a day were modeled, and the influence on different
activity purposes was not considered. Handy and Yantis, (1997) studied the impacts of
telecommunications technologies on non-work travel behavior. Three specific activities are considered in
this study: movie watching, shopping and banking based on in-home and out-of-home activity
participation, based on a survey. They found that in-home entertainment activities (e.g. movie watching
on television or video) correlated positively with an increase in travel. Home shopping (though Internet
shopping was not considered) also results in an increase in travel by the shopper. ATM banking seems to
be effective in reducing trips to the bank, while at the same time ATM banking increases the number of
transactions (i.e. efficiency) of the bank.
2.5.4 Other ICT related studies
Some other studies explore and examine theoretical concepts and patterns behind the ICT use. In
this regard, Golob and Regan, (2001) provide an extensive and thorough review of the range of potential
impacts of information technology on personal travel and commercial vehicle operations by reviewing
prior studies. The explanation of impacts of IT on personal travel behavior includes e-shopping,
telecommuting, mobile working and so forth, and the need to collect ICT use related information in the
context of activity diary data is emphasized. Marker and Goulias, (2000) focused on the possible benefits
gained from trip replacement and load consolidation while presenting the analysis of online grocery
shopping. In this context, they stated that benefits are likely to be small if trip-chaining is normally
implemented during shopping trips. The authors also indicated that time savings from Internet activity
may lead to more trips being generated. Kilpala et al, (2001) explore the implications of E-Commerce on
transportation, particularly, the role of e-commerce on travel activities relating to the grocery industry.
Krizek and Johnson, (2003) highlighted the role of trip substitution, modification, and generation, which
resulted from ICT use and propose a conceptual and qualitative framework for the analysis of ICT’s. This
paper builds upon this theoretical framework using empirical models to analyze the relationships between
ICT use, activity and travel patterns, and to obtain insights on potential substitution, modification, and
generation effects. Another qualitative study is by Salomon, (1986), who reviewed literature related to the
current topic, and explained the interactions between transport and various communication applications
like remote work, teleconferencing, tele -services, mobile communications and electronic message
transfer. He finally emphasized the necessity of empirical studies in this field and need to model
behavioral changes and complex relationships. Selvanathan and Selvananthan, (1994) presented an
empirical analysis of the demand for public transport, private transport and communication for two
countries, the U.K and Australia. They concluded (by examining elasticities of use with cost) that in both
21
countries, public transport is a necessity and private transport is a luxury, whereas transport and
communication collectively as a group is a luxury.
2.5.5. Limitations of these studies
Some of the limitations of prior studies are presented in this section. The prior research studies
have not investigated the interactions between ICT use, Activity pattern and Travel Pattern holistically,
since the primary purpose in many studies has been to analyze ICT impact on a specific trip/activity
purpose. Similarly, the purpose for ICT use in activity participation is not studied and whole day activity
pattern are not analyzed. Furthermore, the influence of ICT use on inter-person interdependence within a
household has not been sufficiently examined, and the effect of cross-substitution between different
activity types and different ICT uses and travel needs to be investigated. For example, the effect cross-
substitution of one virtual activity type on the other virtual activity and the effect of one virtual activity
type on another physical activity is of interest for predicting travel demand. This study aims to overcome
some of these shortcomings by investigating these research issues.
2.6 Summary
This chapter provides an overview of various aspects of activity episode analysis. The review of
prior studies along this line indicate that activity based modeling approach provides a more powerful and
versatile framework for travel demand modeling. However, this analysis is methodologically challenging
because of the large number of inter-dependent dimensions of interest such as household relations,
vehicle status, workers status, presence of children, cost constraints, time constraints, and location and
situational constraints. Further, there is a growing body of empirical knowledge on activity travel
behavior which has highlighted the importance of several key factors including person attributes,
household attributes, socio demographic factors, trip related characteristics, household role, and cost, time
and situational constraints.
However, several dimensions are not sufficiently investigated in the previous literature. These
include: (a) interactions within households and differences between households, (b) the role of ICT’s on
activity based analysis rather trip based analysis, (c) interactions between physical and virtual activities,
(d) need for more holistic patterns of analysis that take into account correlations of various sources, and
treatment of all individuals in the household (some individuals are not considered in the prior studies),
and (e) other dimensions such as sequencing of activities and associated dynamic methodologies.
Exploring some of these dimensions forms the main focus of this thesis. This thesis seeks to
partially address the gaps noted above by developing two sets of models: models of person allocation to
activities, and models of ICT use and its effect on activity travel patterns. The following chapter examines

22
the person allocation in a household (without reference to presence of ICT’s). The modeling frameworks
and the specific objectives of this analysis are presented in the next chapter. A variety of statistical models
are estimated using the Bay Area Travel Survey 1996 data. Chapter 4 investigates the role of ICT’s on
activity and travel patterns jointly using the Bay Area Travel Survey 2000 data. The modeling framework
used for this analysis and the salient findings are also presented in this chapter.
23
CHAPTER III
PERSON ALLOCATION TO ACTIVITIES
3.1 Introduction
In this chapter, the allocation of household members for participation in discretionary and
maintenance activities is investigated. Specifically, this chapter examines how individual household
members are selected and assigned to participate in out-of-home discretionary and maintenance activities.
In analyzing household person allocation to activities, the following dimensions will be considered: solo
versus joint activities, within-household interactions, differences in activity allocation across households,
and the role of constraints (e.g. time, cost, and vehicle availability).
The primary motivation for investigating person allocation to activities is two-fold: First, from a
behavioral perspective, person allocation patterns can strongly influence vehicle occupancy levels, trip-
chaining and mode choice and thus have significant implications for congestion, air-quality, and demand
estimation for transit. For instance, how a household with one car allocates the activities and the vehicle
across household members can determine the mode choice and timing of the various trips in the
household. The allocation of several activities and trips to a single person (say the employed head of the
household) may result in a greater degree of trip consolidation and trip-chaining, resulting in lower
emission rate, with several of these trips being performed during the evening peak period or post-peak
period. In contrast, in a household (with many adults and many vehicles), where the tasks may be
delegated more evenly across members, more trips may result and may be staggered over time (possibly
leading to lower congestion), resulting in fewer chained trips and worse environmental impact. The need
for joint trips, trip-chaining (e.g. discretionary activities) or sequencing constraints of prior
activity/vehicle allocation in the same day may render the transit mode relatively unattractive compared to
the automobile in some cases. On the other hand, the activity and vehicle allocation in some households
(e.g. one vehicle household) may necessitate the use of transit by other household members or
postponement of trips to a later time.
Second, these behavioral issues also have substantial practical implications in the context of:
evaluation of vehicle occupancy based traffic management strategies such as: High Occupancy Vehicle
(HOV) and High Occupancy Travel (HOT) lanes. (person allocation may be used to determine conditions
and households, and activities which are less likely to be elastic in terms of person occupancy - solo
versus joint activities). Similarly, disregarding the constraints on trip-chaining and joint travel, that arises
from person allocation to activities and within-household interactions can result in erroneous and
misleading demand estimates while assessing the effectiveness of alternative transit improvement

24
policies. For instance, the improvement of travel time or wait time through more frequent services may
prove to be ineffective and expensive, if there is a significant need for trip-chaining on a route not served
by the transit. Given these motivating considerations, there is a need for richer behavioral and policy
sensitive representation of person allocation in activity-based microsimulation models of travel demand.
Given its significance in the context of activity-based demand analysis, the importance of
representing and capturing the person allocation to activities has been recognized by several studies
(Balasubramaniam and Goulias, (1999); Scott et al., (2002); Pendyala et al., (2002); Vovsha et al., (2003);
and Bhat et al., (2004)). Research in this area can be classified along the following four broad lines of
investigation:
a) Studies that model which person is selected for the activity (male versus female, head of
household versus spouse, worker versus non-worker, and others (Vovsha et al., (2004))
b) Studies that examine whether an activity episode involved a solo trip or a joint trip (Fujii et al.,
(1999); and Vovsha et al., (2003))
c) Studies focusing on daily and episode level time allocation of household members to activities
(Gliebe et al., (2001); and Bhat, Srinivasan and Axhausen (2004)) and
d) Comparative analyses of differences in task/activity participation among household members
based on life cycle groups and role (Balasubramanian and Goulias, (1999); Stopher and Metcalfe,
(1999); Simma et al, (2001); Scott, (2002); and Bhat et al., (2004)).
Investigations along these lines have provided valuable preliminary insights especially on within-
household allocation of tasks, particularly between solo and joint trips. A more detailed review of these
investigations and the associated findings are provided in Section 3.2. Given that research in this area is
still in its initial stages, there are some methodological and definitional challenges that are not adequately
addressed in current models of person allocation (these are discussed in Section 3.4.2 in detail). These
shortcomings and issues can lead to biased or inconsistent parameter estimates, loss in efficiency and
information in model due to aggregation, and forecast errors and inaccurate evaluation of policy impacts
(could be found more discussion in section 3.4.2).
The objectives of this chapter are as follows:
1. Develop models to analyze the effect of socio-demographic, household role, and trip attributes on
activity allocation among household members.
2. Investigate the role of constraints on time, vehicle availability, cost, and coordination on activity
allocation among household members.
25
3. Analyze differences between households in terms of allocation of persons to activities and the
underlying factors.
Addressing these substantive research objectives is likely to shed light towards the identification
of behavioral basis underlying household allocation of activities among members. Furthermore, this
analysis will also be valuable towards the development of richer activity-based micro-simulation models
with implications for demand management, evaluation of transportation policy actions etc.
To achieve these objectives, this chapter proposes disaggregate discrete choice models for the
analysis of allocation of activities to household members. The differences in allocation between
maintenance and discretionary activities are analyzed explicitly. At the empirical level, the proposed work
seeks to expand the existing body of knowledge from prior studies by explicitly investigating the
following aspects of activity allocation to household members: a) within-household interactions, b)
between household differences, c) the effect of situational constraints, and d) the influence of trip-related
factors. From a modeling standpoint, the proposed approach provides an improved representation of
activity allocation behavior than existing models by accounting for the: i) variable nature of choice set
and alternatives across households, ii) inclusion of richer choice-related information by including solo
participation by members other than the head or the spouse of the head of the household, iii) insights on
within-day time-varying nature of activity allocation within a household, and iv) richer disaggregation
and reduction in bias by analyzing allocation based on individuals instead of allocation based on gender
or employment characteristics.
The remainder of this chapter is organized as follows. In Section 3.2, related prior literature on
within-household interactions and person allocation of activities is reviewed. The activity-based data used
in this study and the descriptive statistics of the associated variables of interest in this study are presented
next, in Section 3.3. The modeling framework used to analyze person allocation to household
maintenance and discretionary activities is described in Section 3.4, whereas, the hypotheses of interest
are explained in Section 3.5, and modeling results are presented in Section 3.6, followed by Section 3.7
that discusses the model validation tasks conducted in this study. Finally, this chapter and its main results
are summarized in Section 3.8.
3.2 Literature review related to person allocation
Some of the prior studies have sought to investigate activity participation of household members
by classifying them into segments such as male or female, and worker or non-worker. For instance, Bhat
and Srinivasan, (2004) examined the factors that affect the allocation of shopping activities in couple
households. The authors used a nested model for the generation and allocation of shopping activities
26
based on gender: for male only, female only, both independently and both jointly. A hazard duration
model for the duration of shopping is also proposed based on gender: (for male, female and joint
participation). They observed that a female non worker is more likely to be allocated to the shopping
responsibility compared to male non-worker. Further, both the adults are found to be more likely to
perform shopping activities jointly on weekends than weekdays. On the other hand, Vovsha, Petersen and
Donnelly, (2004) developed a model for allocation of maintenance activities to the household members.
The maintenance activities are classified as shopping, escorting, and other maintenance activities and then
these activities are allocated to six categories of household individuals (fulltime worker, part-time worker,
university student, non worker, pre driving child and driving child). In this study, zone-of-residence and
available time window factors are evaluated in addition to household and person related factors. The
authors concluded that the accessibility of retail attractions works in favor of more frequent individual
maintenance tours and also, non-workers are found to perform maintenance activities most frequently.
In another stream of research work, the relationship between activity patterns and household role
(head of the household and spouse) is investigated. For example, Simma and Axhausen, (2001) examined
the allocation of activities between the head of the household and spouse. The authors used structural
equation models to capture the interactions between heads of the households with regard to participation
in out-of-home activities. Explanatory variables in this study include person, accessibility and activity
related characteristics. Bhat and Srinivasan, (2004); and Vovsha, Petersen, and Donnelly, (2004) have
also analyzed the factors that affect activity participation of the head of the household role. In this regard
the former study concluded that work duration of household head negatively impacts the decision to
undertake shopping during the day.
Balasubramanian and Goulias, (1999) presented a comparative analysis of solo and joint trip
making behavior. A probit model was used for conducting a trip-by-trip analysis after classifying each
trip as a solo or joint trip. They found that life cycle stage has a significant effect on joint trips by multi-
adult household. Furthermore, households with children are more likely to participate in joint trips.
Another finding is that persons classified as shoppers and carpoolers have a higher probability of making
joint trips compared to others. Joint travel by household members was also modeled recently by Vovsha
et al., (2003) at various levels. : Based on the purpose of the activity, joint travel is classified based on the
participants present in the tour (e.g. joint tours with adults only, children only and adults with children,
and person participation in fully joint tours). The primary conclusion in the study was that joint travel was
more common for school, maintenance and discretionary purposes. Along similar lines, Fujii et al, (1999)
study individuals’ joint activity engagement using a structural equation model system. Two sets of models
were presented: one for travel patterns and quality of life and the other for time allocation. Individuals’
joint activity patterns were divided into four categories (HomeFamily, HomeOthers, OutFamily and
27
OutOthers) based on the location and companions in the joint activity. In addition, solo activities were
also classified into two types: HomeAlone and OutAlone. They concluded that individuals prefer out-of -
home solo activities to out-of-home joint activities with family members whereas workers and
homemakers tend to spend more time with family members in-home.
Another aspect of activity related studies is the time allocation by individuals to various activities.
Bhat, Srinivasan and Axhausen, (2004) examined the length between successive participations in several
activity purposes over a multi-week period based on the data collected from German cities. The authors
studied five different non-work activity purposes: recreation, social, personal business, maintenance
shopping and non-maintenance shopping. They found that individuals who work longer are found to have
longer interactivity duration than individuals who work shorter durations. Individuals who use a car as
the primary mode to participate in shopping have higher inter-shopping duration than those who use other
modes. Goulias, (2001) used multilevel models to examine individuals’ choice of time allocation to
subsistence, maintenance, discretionary and travel activities. Through the use of both longitudinal and
cross sectional models, the authors found that males allocate more time to subsistence activities compared
to females and non-workers allocate more time to maintenance activities compared to workers. Gliebe
and Koppelman, (2001) estimated the time allocation for different out-of-home activities by adult
household members using a proportional share model. Independent and joint activities are classified into
subsistence, maintenance, leisure and home activities. The variable -autos per person was found to have
positive effect on the time allocated to independent maintenance and leisure activities is traded off against
the time spent in-home. The number of children (age < 17 years) had a significant positive effect on the
time allocated to out-of-home independent maintenance activities by females.
Life cycle analysis was presented by Scott, (2001); and Stopher and Metcalfe, (1999) to assess
the influence of household role on activity participation. Scott, (2001) performed an empirical analysis of
out-of-home activities across three types of households: non-worker couple; couple with a single worker;
and two-worker couple families. They noted that the presence of children in a non-worker couple
household resulted in increased male participation in independent activities. In contrast, joint activity
participation is found to increase in one-worker couple families when children are present. Females who
live in two worker couple households owning only one vehicle are more likely to participate in
independent activities compared to females from multi-vehicle households. Stopher and Metcalfe, (1999)
performed statistical analysis to infer the role of household composition and structure on activity
participation. They found that there exist significant differences between different life cycle groups. The
influence of gender and worker’s employment status were also tested. Gender was not a significant factor
whereas employment status is reported as a significant variable.
28
Most of the researchers were interested in the primary couple (i.e. the head of the household and
spouse) in a household (Simma et al., (2001); Vovsha et al., (2004); and Bhat et al, (2004)) where as the
authors in this study have also analyzed the activity patterns of other individuals. Empirical data used in
this study shows that the solo activity participation of other individuals is also significant (20% of solo
discretionary trips are performed by other than head of the household and spouse). In fact, Table 3.3,
shows that in some segments of the population, the probability of selecting other household member can
be as high as 52.9%. Analysis of activity patterns based on life cycle groups was done by many
researchers. However the current study investigates between-household differences based on life-cycle
groups.
3.3 Data and descriptive statistics
To address the objectives discussed earlier, this study uses disaggregate activity travel data from
the Bay Area Travel Survey 1996, which contains rich data at the activity episode level. This data was
obtained using a two-day activity diary survey from 3,344 households. In this survey, data was collected
on activity participation of individuals including details of activity episode participation by each
household member (14 years or older in age). The activity data includes the purpose, location, and
duration of each activity, along with the associated travel attributes. The trip attribute information
obtained includes: timing and duration of trip, origin and destination, mode of travel, trip-chaining, and
co-passengers present. The dataset also contained detailed information on household and individual
attributes of all survey respondents.
In this study, the activity travel data is used from 17500 activity episode records corresponding to
a sample size of 1174 households, collected on the first day. The current analysis focuses on the
allocation of tasks to persons only for out-of-home activities since these activities directly involve travel.
A rigorous data screening process is carried out to consider only those records with consistent and
complete data in the analysis. For instance, all activities performed by single person households are
excluded from the analysis, as the question of allocation of activities among members does not arise in
this context. Activities performed by individuals younger than 14 years of age are also excluded from the
analysis due to legal restrictions on their mobility. All records that have missing information regarding
key explanatory variables (worker status, job type, number of household individuals and cars, gender, age
and so forth) are also excluded from the analysis. However, household income values are imputed as per
the distribution of income in the remaining data. This analysis focuses only on out-of-home discretionary
and maintenance activities. Subsistence activities (such as work and school) were not considered since
they are individual specific and cannot be reallocated across household members. Maintenance activities
include episodes involving household business, household maintenance / chores, shopping, and pick up
29
and drop off activities. In contrast, discretionary activities include activities such as recreational,
entertainment, visiting, hobbies and so forth.
After this screening process, a total of 2518 valid maintenance records are used in the analysis.
Among these 2200 records are solo activities and 318 episodes consist of joint activities. Similarly among
the 1079 valid discretionary activities, there were 950 solo activities and 129 joint activities. Thus, the
major part of activities is performed as solo activities. Table 3.1 illustrates the distribution of socio-
demographic, household, and individual characteristics across the sample. The mean household size in the
sample is about 2.87. Nearly 35% of the households are single person households and were not
considered for further analysis. Among the sample households, nearly 53%, 22%, and 26% of households
consisted of 2, 3, and 4+ members respectively. The sample is nearly evenly distributed among males
and females with 49% males and 51 % females. In relation to number of workers in a household: 13% of
the households do not have any workers, 25 % are one-worker households, 52% are two-worker
households, and the remaining 10% are three or more worker households. Ten percent households are
classified into low-income (<$30,000) category, 33% medium-income ($30,000-$59,000), 44% are high-
income (>$59,000), and 12% households in the sample did not provide their household income
information. Interestingly, 18% of the households have 0-5 year old kids and a similar fraction of
households has 6-10 year old kids.
The number of valid individual members in the sample are 2692 and among them 22% are
younger individuals (14-30 years), 45 % are middle-aged (31-50 years), 24% are upper middle -aged (51-
70 years), and 9% are older individuals (>70 years). Nearly 67% of individuals in the sample were
employed, and a majority of these individuals are employed full-time (83% of employed individuals were
full-time workers). In this regard, non-worker is defined as a person who is not employed and hence,
students and retired individuals are also considered as non-workers. With regard to the distribution of
household role in the sample, 44% of individuals are head of the households, 36% are spouses, 4% are
parents / in-laws, 12% are children, and the remaining 4% individuals correspond to other household role
(sibling, grandparent, aunt/uncle). As expected most of the eligible individuals (about 88% of the sample)
hold a driver’s license and the remaining 12% don’t. This data was compared against the socio-
demographic profile of other activity based surveys to verify whether the sample is reasonably
representative of the population and the characteristics noted above found to be similar to those reported
in the other data sets: 2000 Bay Area Travel Survey (Srinivasan and Athuru, (2004)), and 1998 Miami-
Dade County Area Survey.
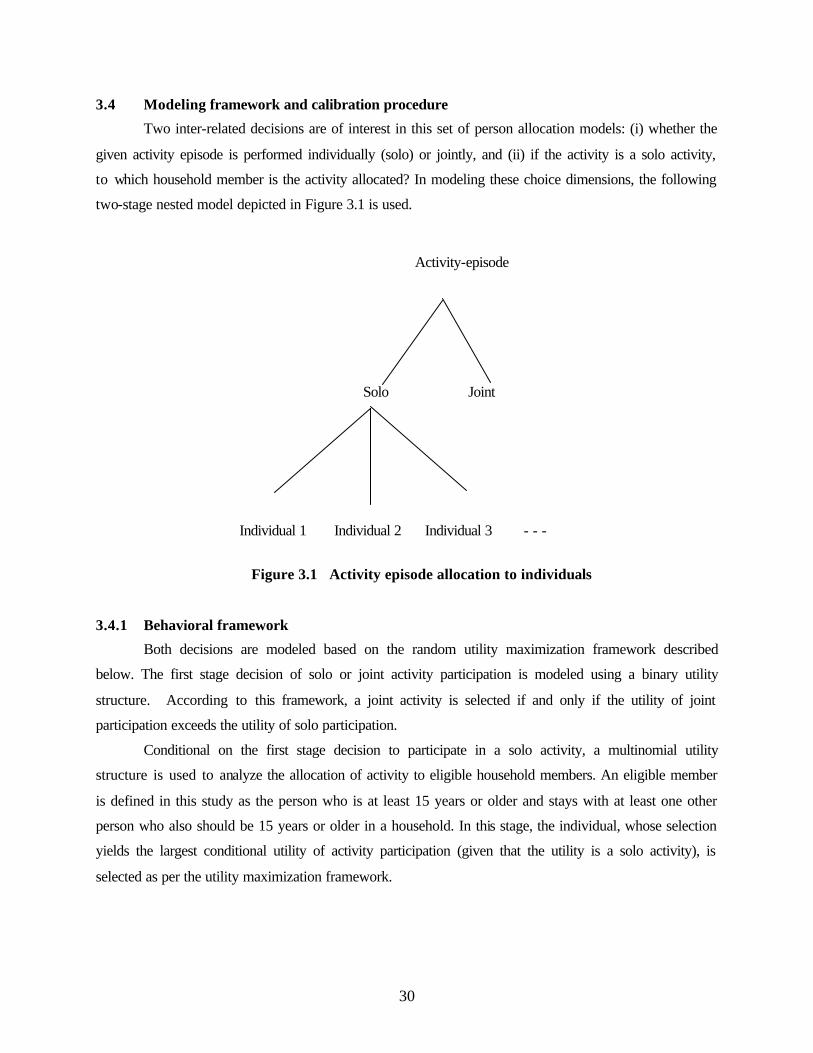
30
3.4 Modeling framework and calibration procedure
Two inter-related decisions are of interest in this set of person allocation models: (i) whether the
given activity episode is performed individually (solo) or jointly, and (ii) if the activity is a solo activity,
to which household member is the activity allocated? In modeling these choice dimensions, the following
two-stage nested model depicted in Figure 3.1 is used.
Activity-episode
Solo Joint
Individual 1 Individual 2 Individual 3 - - -
Figure 3.1 Activity episode allocation to individuals
3.4.1 Behavioral framework
Both decisions are modeled based on the random utility maximization framework described
below. The first stage decision of solo or joint activity participation is modeled using a binary utility
structure. According to this framework, a joint activity is selected if and only if the utility of joint
participation exceeds the utility of solo participation.
Conditional on the first stage decision to participate in a solo activity, a multinomial utility
structure is used to analyze the allocation of activity to eligible household members. An eligible member
is defined in this study as the person who is at least 15 years or older and stays with at least one other
person who also should be 15 years or older in a household. In this stage, the individual, whose selection
yields the largest conditional utility of activity participation (given that the utility is a solo activity), is
selected as per the utility maximization framework.
31
3.4.2 Special features of this framework
Although, both stages involve discrete unordered choices, the following distinct features of this
problem context require some significant extensions of the standard discrete choice models for its
analysis. First, this framework represents a discrete choice context where the choice set is variable in
dimension across households. For instance, the number of eligible persons who may participate in a solo
activity can vary from one household to the other, and must be appropriately modeled. More interestingly,
not only is the choice set variable in size but also variable in terms of alternatives. In contrast to standard
discrete choice models, where at least some (if not all) alternatives are common across many (if not all
observations), in this case no alternative is common across two observational units (since each eligible
individual belongs to and can be selected by one and only one household). As a result, the alternative
specific constants are not directly meaningful, as the alternatives (persons selected) vary from household
to household. Third, unlike the standard discrete choice models where the decision-maker is typically an
individual, in this case the decision-making entity corresponds to a household, which allocates activities
to members. Consequently, household attributes (e.g. number of workers), which are invariant across
household members, must be carefully specified in order to infer inter-household differences. Finally,
several sources of potential correlations must be accounted for in the model specification. These include:
unobserved shared terms across members from the same household, correlation between decisions made
across different episodes performed by the same individual, and correlations induced across conditional
solo person utility terms, due to the shared errors associated with household solo utility term. The
following model is used to capture these features of the person allocation problem context.
3.4.3 Model specification
Notations:
Let h denote the index for household h = 1,…H,
Let ih denote individual i from household h, and
Let Ih={ih = 1,2,…, number of members in household h} represent the set of household members in
household h.
Let k h represent the index of trips made by household h (subscript is dropped in what follows for ease of
notation) and Khmax represent the maximum number of trips made by household h on the given day
Let Uhksolo represent the utility of a solo activity relative to a joint activity for household h for activity k
(Uhkjoint is taken as 0 with no loss of generality).
Let Uhki =conditional utility of selecting individual i belonging to household h for participating in the kth
household activity for the day given that the activity is a solo activity.
Let δhksolo = 1 if activity k performed by household h is a solo activity
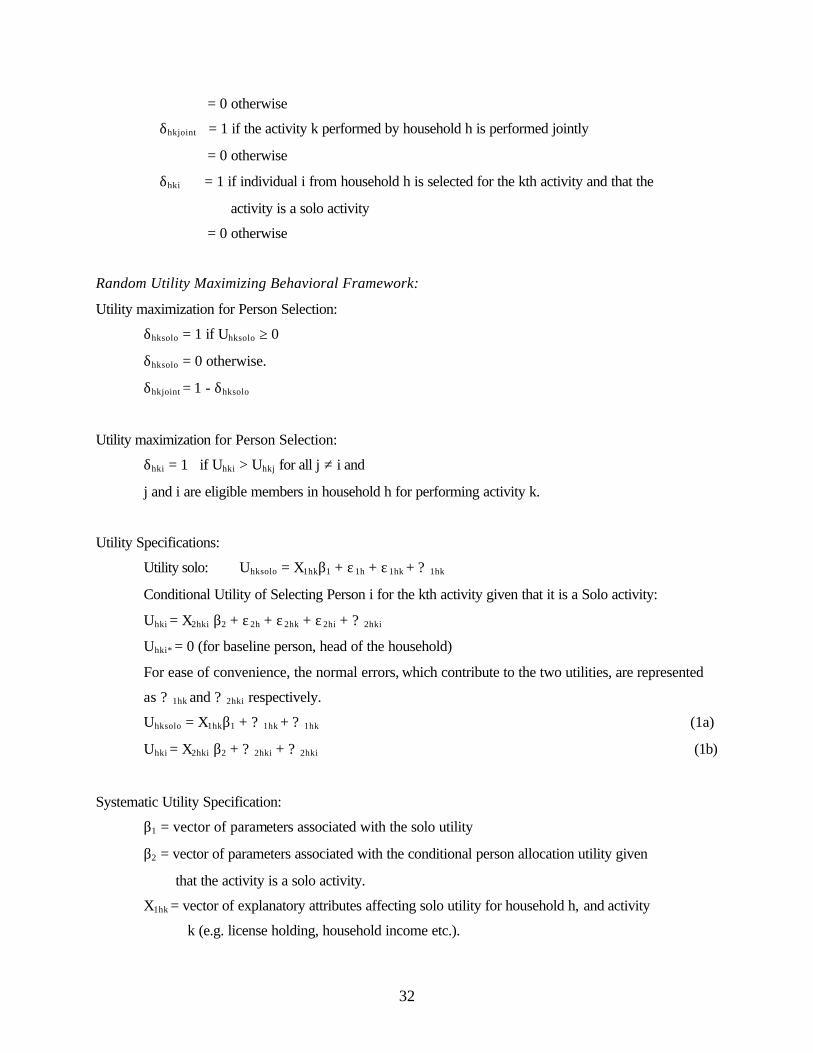
32
= 0 otherwise
δhkjoint = 1 if the activity k performed by household h is performed jointly
= 0 otherwise
δhki = 1 if individual i from household h is selected for the kth activity and that the
activity is a solo activity
= 0 otherwise
Random Utility Maximizing Behavioral Framework:
Utility maximization for Person Selection:
δhksolo = 1 if Uhksolo ≥ 0
δhksolo = 0 otherwise.
δhkjoint = 1 - δhksolo
Utility maximization for Person Selection:
δhki = 1 if Uhki > Uhkj for all j ≠ i and
j and i are eligible members in household h for performing activity k.
Utility Specifications:
Utility solo: Uhksolo = X1hkβ1 + ε 1h + ε 1hk + ? 1hk
Conditional Utility of Selecting Person i for the kth activity given that it is a Solo activity:
Uhki = X2hki β2 + ε 2h + ε 2hk + ε 2hi + ? 2hki
Uhki* = 0 (for baseline person, head of the household)
For ease of convenience, the normal errors, which contribute to the two utilities, are represented
as ? 1hk and ? 2hki respectively.
Uhksolo = X1hkβ1 + ? 1hk + ? 1hk (1a)
Uhki = X2hki β2 + ? 2hki + ? 2hki (1b)
Systematic Utility Specification:
β1 = vector of parameters associated with the solo utility
β2 = vector of parameters associated with the conditional person allocation utility given
that the activity is a solo activity.
X1hk = vector of explanatory attributes affecting solo utility for household h, and activity
k (e.g. license holding, household income etc.).
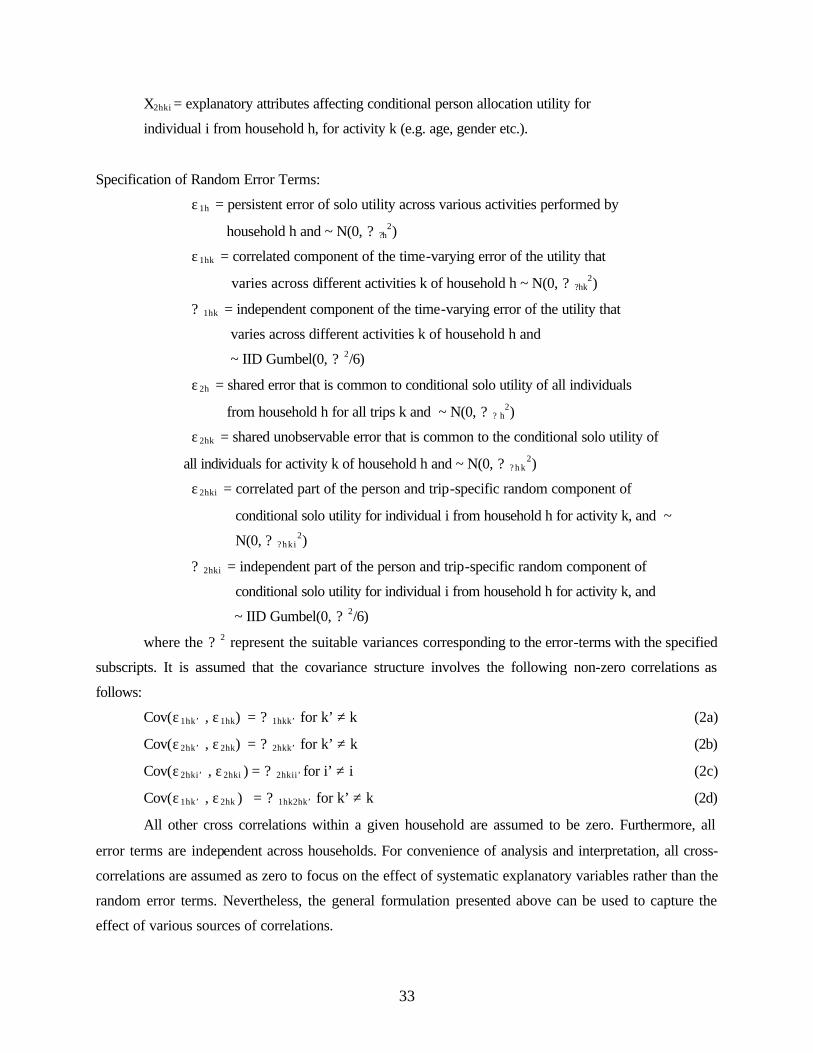
33
X2hki = explanatory attributes affecting conditional person allocation utility for
individual i from household h, for activity k (e.g. age, gender etc.).
Specification of Random Error Terms:
ε 1h = persistent error of solo utility across various activities performed by
household h and ~ N(0, ? ?h2)
ε 1hk = correlated component of the time-varying error of the utility that
varies across different activities k of household h ~ N(0, ? ?hk2)
? 1hk = independent component of the time-varying error of the utility that
varies across different activities k of household h and
~ IID Gumbel(0, ? 2/6)
ε 2h = shared error that is common to conditional solo utility of all individuals
from household h for all trips k and ~ N(0, ? ? h2)
ε 2hk = shared unobservable error that is common to the conditional solo utility of
all individuals for activity k of household h and ~ N(0, ? ? h k2)
ε 2hki = correlated part of the person and trip-specific random component of
conditional solo utility for individual i from household h for activity k, and ~
N(0, ? ? h k i2)
? 2hki = independent part of the person and trip-specific random component of
conditional solo utility for individual i from household h for activity k, and
~ IID Gumbel(0, ? 2/6)
where the ? 2 represent the suitable variances corresponding to the error-terms with the specified
subscripts. It is assumed that the covariance structure involves the following non-zero correlations as
follows:
Cov(ε 1hk’ , ε 1hk) = ? 1hkk’ for k’ ≠ k (2a)
Cov(ε 2hk’ , ε 2hk) = ? 2hkk’ for k’ ≠ k (2b)
Cov(ε 2hki’ , ε 2hki ) = ? 2hkii’ for i’ ≠ i (2c)
Cov(ε 1hk’ , ε 2hk ) = ? 1hk2hk’ for k’ ≠ k (2d)
All other cross correlations within a given household are assumed to be zero. Furthermore, all
error terms are independent across households. For convenience of analysis and interpretation, all cross-
correlations are assumed as zero to focus on the effect of systematic explanatory variables rather than the
random error terms. Nevertheless, the general formulation presented above can be used to capture the
effect of various sources of correlations.
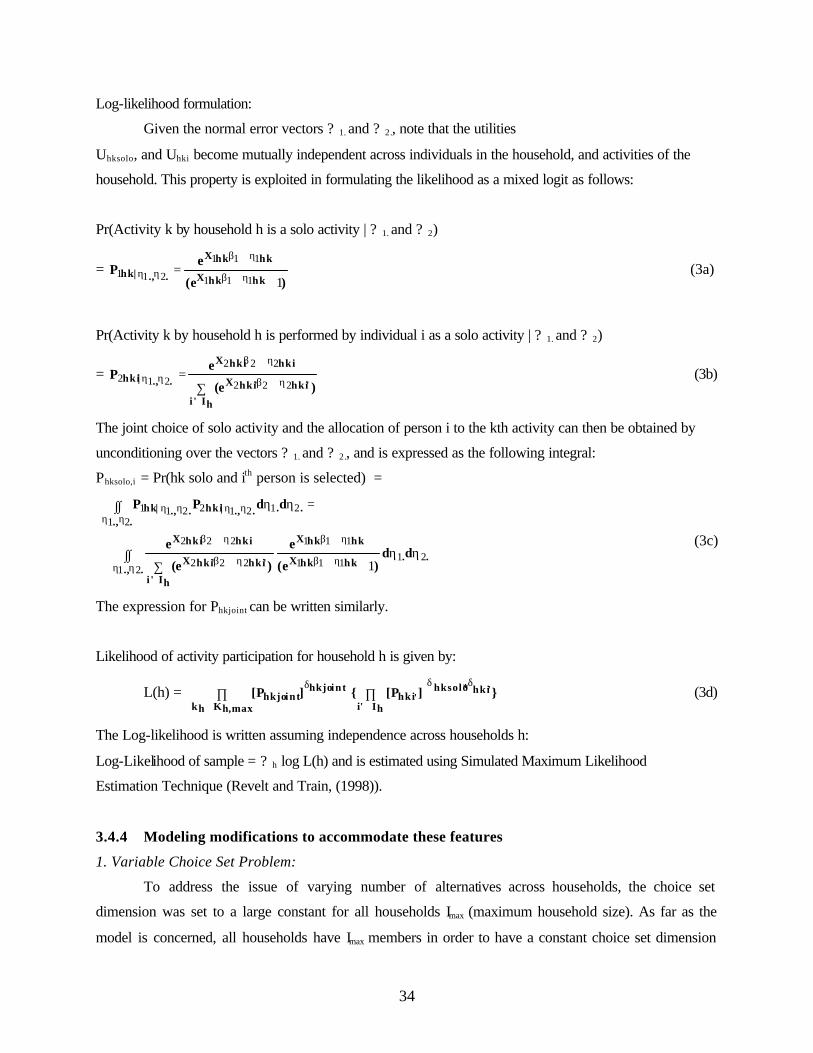
34
Log-likelihood formulation:
Given the normal error vectors ? 1. and ? 2., note that the utilities
Uhksolo, and Uhki become mutually independent across individuals in the household, and activities of the
household. This property is exploited in formulating the likelihood as a mixed logit as follows:
Pr(Activity k by household h is a solo activity | ? 1. and ? 2)
= )e(
eP
hkhkX
hkhkX
..,|hk1111
111
211+
=η+β
η+β
ηη (3a)
Pr(Activity k by household h is performed by individual i as a solo activity | ? 1. and ? 2)
= )e(
eP
'hki'hkiX
hI'i
hkihkiX
..,|hki222
222
212 η+β
∈
η+β
ηη∑
= (3b)
The joint choice of solo activity and the allocation of person i to the kth activity can then be obtained by
unconditioning over the vectors ? 1. and ? 2., and is expressed as the following integral:
Phksolo,i = Pr(hk solo and ith person is selected) =
..hkhkX
hkhkX
'hki'hkiX
hI'i
hkihkiX
..,
....,|hki..,|hk..,
dd)e(
e
)e(
e
ddPP
21111
111
222
222
21
2121221121
1ηη
+∑∫∫
=ηη∫∫
η+β
η+β
η+β
∈
η+β
ηη
ηηηηηη
(3c)
The expression for Phkjoint can be written similarly.
Likelihood of activity participation for household h is given by:
L(h) = }]P[{]P[ 'hki*hksolo'hki
hI'i
in thkjointhkjo
,maxhKhk
δδ
∈
δ
∈∏∏ (3d)
The Log-likelihood is written assuming independence across households h:
Log-Likelihood of sample = ? h log L(h) and is estimated using Simulated Maximum Likelihood
Estimation Technique (Revelt and Train, (1998)).
3.4.4 Modeling modifications to accommodate these features
1. Variable Choice Set Problem:
To address the issue of varying number of alternatives across households, the choice set
dimension was set to a large constant for all households Imax (maximum household size). As far as the
model is concerned, all households have Imax members in order to have a constant choice set dimension

35
across households but members after Ihmax are treated as virtual and ineligible members who are never
allocated to any activity. The person-level utility for ineligible members (e.g. children < 15 years of age
or virtual members) is set as a large negative number to preclude their choice for household activities.
2. Alternatives are variable across household:
The members in each household h are classified as person 1, person 2, person 3, … person Ihmax.
Thus, strictly speaking none of the alternatives are common across households. This problem can be dealt
with by treating each household as a sample and the associated activities as repeated observations for the
purpose of calibration. While the advantage of the variable alternatives across household is that household
specific parameters can be estimated but the disadvantage is the inefficiency of estimates because the
coefficients will then be based on too few observations. To overcome this problem, it is possible to
specify the alternatives in such a way that they are common across households based on household role as
head-of-the-household, spouse-of-the-head, spouse’s father, spouse’s mother, eldest child, second eldest
child and siblings. However, such a specification of alternatives directly based on household role is likely
to result in endogeneity bias, resulting in inconsistent coefficient estimates. This endogeneity bias is the
result of common unobserved terms that could simultaneously effect of household role on task allocation
to members, and the effect of household role on explanatory variables.
To illustrate, consider for example, a three-person household consisting of the head, the spouse
and a small child (say 3 years old). Assume that the baseline is the head of the household. The conditional
utility of solo participation for the spouse relative to the head may be given as:
Uspouse = b0 + b1*female + b2*presence of children 0-5 + b3*hhincome + b4*worker + error (4a)
If the household income is high, the household may engage a care-taker for the children. A
working spouse due to time constraints may be less likely to be chosen to participate in household
activities. Due to the unobserved time constraint effects and greater discretionary household income, such
a spouse may engage the services of child-care service provider. This interaction, in turn, affects the
propensity of task allocation to the spouse and can result in an endogeneity bias during estimation.
To circumvent the endogeneity issue, in this study the alternatives are not classified based on
household role but instead are labeled as person 1, person 2, … person k in each household. This labeling
is done in such a way that there is no direct linkage between this ordering and household role (in other
words, person 1 is not the head of the household in all households). To capture generic effects across
households due to the household role and life-cycle group, indicator variables are defined for each
household and member (e.g. yperson1,head = 1 if person 1 is the head of the household and is zero otherwise;
36
other indicators for spouse etc. are similarly defined). These indicator variables (except one, which is left
out as a baseline - indicator for head), are added to the conditional solo utility specification for each
person for each activity.
Uperson1 = b0 + b1* yperson1,spouse + b2*yperson1,child + b3*yperson1,parentofhead + error (4b)
The treatment of household-role as an explanatory variable instead of its treatment as a dependent
variable can reduce the potential for endogeneity bias. This specification enables capturing both non-role
specific person attributes and role -specific factors that affect person allocation, whereas, the role -specific
attributes and person-choice are confounded when alternatives are defined based on household-role in
equation Y.
3. Specification and Interpretation of ASC, ASV, and generic variables
Note that for the specification above where the alternatives are labeled person 1, person 2,
explicit capturing of an alternative specific constant that is robust across households may not be possible,
since no alternatives are common across households. Consequently, the coefficients corresponding to the
indicators can be interpreted as alternative specific constants that reflect the intrinsic propensity of a
household to select the spouse, parent/in-laws, and children etc. For the same reason, specification of
alternative specific variables is not possible (parameter values corresponding to the same attribute whose
influence changes across alternatives). Therefore, all variables in the model are captured as generic
variables in the specification, except in the case of interaction terms. In other words, the effect of gender
(say a male) remains unchanged for all males in the household. However, to account for differences
within people of the same gender, interaction terms are specified by combining two or more indicator
variables (e.g. female*presence of children in household) that account for person-specific or situational
characteristics.
4. Specification of Inter-household differences and modeling inter household differences
Between household differences are modeled at two levels. The first level is through the
specification of explanatory variables such as (1) the presence of 6-15 year old kids*part-time worker
presence, and (2) household with 0-5 kids*female) that reflect differences between households. The
household level attributes (number of cars, number of workers etc.) remains unchanged across all
persons/alternatives considered. Therefore, direct estimation of these differences is not possible, if these
terms are included in the utility of all eligible persons. Consequently, to capture inter-household
differences, the household attributes are interacted with person-level indicators and applied to the utility
37
of all but one of the eligible members in the model. While this approach is useful, in many cases
incorporating the interaction between two or more indicator variables is essential to capture this effect,
and the interpretation can become somewhat difficult and non-intuitive (for instance whether the same
effect is seen for females with older kids or for males with 0-5 year kids is not immediately obvious for
the variable 2 noted above). The other difficulty in this approach arises from the presence of similar and
correlated variables together with multiple interaction terms which makes the interpretation of the first
order effect such as gender less straight-forward.
To overcome this difficulty, another approach is proposed here which combines the statistical
model developed previously with exogenous segmentation based on categorical-type analysis is used for
analyzing inter-household differences. To analyze these differences, the individual probabilities are
estimated by using the calibrated model for each household member and each activity. These probabilities
are then aggregated to obtain the average probability of estimation for the head of the household, spouse
of the head, other solo, and joint activity participation for each household. The sample is then divided
into mutually exclusive and homogeneous exogenously defined segments (for e.g. based on number of
cars, income etc., see Section 3.6.5 or Table 3.3), and the average probabilities for each segment and
associated standard deviations are obtained. The differences across these segments (allocation of tasks to
0, 1, 2+ cars to head, spouse, joint, and other solo) are analyzed using Bonferroni confidence intervals
that permit multiple comparisons. Only statistically significant differences in task allocation across
segments are reported.
5. Treatment of Correlations and Nesting
Correlation terms in equation 2a and 2b reflect within-household correlations for solo activity and
conditional solo utility respectively. In contrast, terms given in equations 2c denote within activity
correlation across members of the same household, whereas equations 2d represent nesting effects
between solo and conditional person allocation utilities.
3.5 Hypothesis
In this section specific research questions that have guided the systematic variable specification
are presented and are classified into the following five different categories.
i) Household role: In this category, the role of different household members in performing household
activities is analyzed. The specific factors considered include the role of head of the household,
spouse, child, parent/in-law, effect of prior activity performance by males etc.
ii) Person characteristics: gender differences, age, possession of license, disability status, race of
household members are analyzed as part of the person related characteristics while allocating

38
household individuals to out-of-home maintenance and discretionary activities. Further, the
interaction between trip duration and gender on activity participation is also estimated.
iii) Role of Constraints: In general, various constraints limit / enhance the activity participation. For
example, fewer vehicles (vehicle constraint) in a household limit solo activities where as vehicle
constraint enhances joint activities, cost constraint (either gas cost or parking cost) can increase
transit use, and time constraints can limit activity participation and / or increase trip-chaining.
Other constraints including the presence of children may result in more joint maintenance activity
participation and perhaps lower levels of participation by female household members (when the
kids are young). Other constraints include coordination constraints which apply to activities that
require coordination among multiple people and synchronization of time. Location-based
constraints are related to the proximity of activity Origin-Destination from work or home, and may
result in trip-chains.
iv) Within-household variability: Variability in activity participation within a given day for each
individual is estimated by considering the previous history of activity performance of that
individual.
v) Between-household variability: The primary interest of this aspect is to explore the differences in
activity participation of head of the household, spouse and the other individuals belonging to
various types of households (classified based on household composition, structure, or socio-
economic characteristics). In this context, questions such as whether differences exist across
households that have male as a head of the household as opposed to female head are of interest.
Similarly, differences across zero-car, one-car and two or more car households, variations across
zero-non-worker, one-non-worker, two or more non-worker households are also relevant. Activity
participation differences across various households are also analyzed in terms of age groups of
couples, vehicle-adult combinations and household income.
3.6 Model results and discussion
3.6.1 Household role effects
The results provide significant evidence of the effect of life-cycle and household role on person
allocation to activities. The head of the household is generally more likely to participate in both
maintenance and discretionary activities than the spouse of the head of the household. In addition to
reflecting a greater degree of household responsibility (for the head), this may also be the result of car-
availability and sharing in some households. However, this decision is affected by the relative extent of
time constraints on the head and the spouse. Children in the household are significantly less likely to
39
perform maintenance activities (in part due to lack of mobility resulting from driving age restrictions).
These results are also corroborated by findings from other studies (Simma et al., (2001); Bhat et al.,
(2004); and Vovsha et al., (2004)).
As the number of household members who are employed increases, participation in joint
activities decreases significantly for maintenance activities (shown at the bottom of Table 3.2). This effect
may be attributed to greater income and mobility resources, and greater delegation of activities across
working adults (as there are fewer if any non-workers). Furthermore, the participation in discretionary
activities drops to an even greater extent with increasing number of workers. In addition, to the reasons
cited above, the flexible nature and timing of the discretionary activities suggest that the need and/or
ability to synchronize or coordinate joint trips diminish with increasing number of workers.
A similar employment related effect pertains to the role of female workers in the household. As
the fraction of female workers in the household increases, joint participation in discretionary activities
decreases, due to the added work-related time constraints on both male and female workers in the
household. Two other contrasting within-household interactions were also found in the data. In
households, where males perform most of the prior maintenance activities, the likelihood of female
performing current maintenance activities was lower (suggesting a gender-based allocation of tasks,
perhaps due to child care obligations of female household members). On the other hand, in case of
maintenance activities, if the head of the household performed several prior activities, the propensity to
participate in a current maintenance activity increases for the spouse, suggesting a delegative or greater
participatory role of the spouse in such a case.
The alternative specific constant for joint trip-making is negative, indicating that most activities
involve solo driving, a common trend in many U.S cities. Lower income households are more likely to
participate in joint maintenance activities than their medium and high-income counterparts, whereas, no
significant differences are seen for discretionary activities. Similarly, a greater degree of joint activity
participation was found in households with related members than households with unrelated individuals
(e.g. co-residents). This finding may be explained due to greater synergistic resource sharing (e.g.
vehicle) and activity delegation in related households.
3.6.2 Person characteristics
The attributes of household members also play a significant role in allocation. In this regard, with
increasing age the propensity of participating in a maintenance activity increased, which can be expected
due to greater household responsibility for middle aged respondents, and relatively more free time in the
case of retired individuals. In contrast, a greater propensity to participate in discretionary activities is
found as age decreases, which is also along expected lines. Data also suggest that females are more likely
40
to participate in maintenance activities than males, which may be partly due to the greater degree of
responsibility for shopping activities by female members in the household (also consistent with several
other studies Simma et al., (2001); Gliebe et al., (2001); Scott, (2001); and Stopher and Metcalfe, (1999)).
However, it was observed that females are more likely to participate in shorter duration trips than males,
suggesting that the destinations for maintenance activities are likely to be closer to anchor points (home or
work) for females than males. License holding is positively correlated with maintenance activity
participation, whereas, individuals with disability have a lower discretionary activity participation
propensity. These two observations highlight the role of mobility constraints on activity participation and
resulting travel.
3.6.3 Role of constraints
The results reveal that constraints play a substantial role in determining person allocation to
activities. Cost, time, coordination, and location/proximity factors play a key role in determining person
allocation propensity. In terms of cost, the presence of parking charges inhibited the participation of
individuals employed in the financial, educational, and health care sectors in maintenance activities. The
following findings highlight the role of time constraints. Workers are more likely to participate in
discretionary activities over the weekends compared to weekdays. Further, as the duration of work
activity increases, the propensity for participating in maintenance and discretionary activities for full-time
workers decreases. On the other hand, workers with two or more jobs were observed to be more likely to
participate in discretionary activities (possibly due to the availability of free time between jobs).
Not only in the case of workers, but also more generally joint maintenance activities are more
likely in the weekends than weekdays, suggesting the inhibitive effect of work and related time
constraints on coordination between household members. Joint activity participation (both discretionary
and maintenance) was also lower in households with 0-5 year old kids due to child-care requirements. It is
seen that female members are more likely to fulfill this responsibility, as their maintenance participation
propensity appears to reduce significantly when small children (0-5 years) are present. These observations
highlight the role of coordination and in-home activity responsibilities on joint out-of-home activities,
thus underscoring the need to jointly analyze in-home and out-of-home activity patterns.
Location and proximity factors from home and work-place also appear to influence person
allocation. For instance, full-time workers are less likely to be selected for home-based maintenance trips,
suggesting that a significant number of maintenance activities are performed en-route to and from work
locations whereas, non-workers are more likely to participate in home-based tours. Given the time
constrained nature of the former trips (due to institutional and work timings), these differences have
significant implications for VMT, duration of activity and trip, and location of activity and analysis of
41
transportation planning policies. Users without license are observed to participate in a significant amount
of non-home based activities, possibly due to their use of transit modes (requiring) with transfer from
intermediate non-home based points. The data also suggest that females are less likely to be selected for
home-based maintenance activities (than females for non-home based activities), whereas, younger
respondents are less likely to participate in home-based discretionary activities than older respondents.
3.6.4 Within-household differences in activity allocation across different episodes
Note that most of the factors discussed above pertain to how life-cycle, household and personal
attributes (head of the household, spouse, income and number of workers, age, gender, and license
holding) influence person allocation. However, these factors are essentially static within a given
household over the several different episodes during the study period (of two consecutive days).
Nevertheless, the activity participation propensity varies across episodes and over time even within a
given household. To capture these effects, the following variables are employed in the specification.
Reflecting the significance of state-dependence effects, the results indicate that individuals with greater
level of participation in prior discretionary activities are more likely to be chosen to participate in current
maintenance activities but the converse does not appear to hold. This dynamic influence may be the result
of greater access to household vehicles (especially if number of vehicles is limited), and/or greater
intrinsic trip-making or activity participation propensity of the selected individuals in the household. Note
that state dependence refers to the influence of past activity decisions on current choice outcomes.
3.6.5 Between-Household Differences
While allocating individuals to activities, between household differences have been analyzed up
to a certain extent in the joint activity model. However, to examine these differences in detail, this
analysis examines differences in probability of selecting the head of the household, the spouse, other
individuals, and joint participation across various types of market segments. These segments are based on
gender of the household head, number of workers, number of vehicles, number of children, and the
employment status of the primary couple (head and the spouse). Using the episode level model discussed
previously, the probabilities of selecting each individual in each household are first computed. These
probabilities are then aggregated and averaged across different types of market segments mentioned
above and the associated standard deviations are also computed. The mean probabilities of activity
allocation for the four levels above are then compared across different market segments. Only statistically
significant differences are reported below. The results reveal significant differences between households
in relation to socio-demographic attributes.
42
Gender of head of the household:
For instance, the gender of head of the household (hhh) affects the person allocation process for
both maintenance and discretionary activities. Households with female heads are more likely to choose
the head of the household for maintenance activities (53.6% probability, spouse = 23.6% probability) than
if the head of the household is male (39.1% for the head). In households with a male head of the
household, the participation between head and his spouse is nearly equal, whereas, maintenance appears
to be the primary responsibility of the head, if the head of the household is a female. A similar trend is
also seen for discretionary activities (hhh female 44% whereas hhh male 39%). However, no differences
are seen for joint activities based on the gender of the head of the household.
Effect of Number of cars in HHH:
In zero car households, the primary maintenance role is allocated to the head of the household
(hhh - 49%, spouse of hhh - 20.3%, others 19.6%), whereas joint participation is low (10.8%) due to the
difficulty in coordination/activity sharing with transit mode. In one car households also, the primary role
is for the head (51.7%), and can be attributed to the greater access to the vehicle for the head of the
household. However, in this case, the spouse of the head is more likely to participate in maintenance
activities (24.3%) and the probability of joint activities also increase (13.9%) due to car availability and
sharing. In contrast, the role of the other individuals in the household drops quite significantly (9.9%).
However, as the number of cars increases (from one to two or three cars), the primary role of the head
reduces significantly (from 51.7% to 42.8% for 3+ cars) and the spouse’s role increases (24.5% to
between 29 and 33%), indicating a greater redistribution of activities. The joint participation decreases
understandably from 13.9% to 11.8% indicating a greater delegative effect and more staggering of trips.
The differences across households based on car-ownership levels are virtually along the same lines for
discretionary activities. The major difference pertains to the pre-eminent role in discretionary activities
for the head of the household in zero car households (65% for hhh, spouse 18%, other 9 %, joint 8%).
Therefore, the reduction in head’s participation with increasing number of cars is also more substantial
(nearly 20% reduction in 1 car household). As the number of cars increases, the primary role of the head
reduces more drastically (it nearly halves from 65.1% for 0 cars to 35.7% for 3 cars); the spouse’s role
increases (nearly doubles 18 to 25-33%), and the participation of other household members also nearly
doubles. The joint discretionary activity propensity is at a maximum for a one-car household (13%) due to
possibly car-sharing constraints, and decreases as the number of cars (10% for 3+ cars) increases. Note
that the absence of household vehicles is also not conducive to joint discretionary activity participation
(joint activity participation = 7.6 %).
43
These results are also confirmed by differences based on number of vehicles available per driver.
As the number of vehicles per driver increases, a greater participation of other individuals (neither the
head nor the spouse) is observed. This increases from 7 to 30.3% for maintenance activities, and is even
larger for discretionary activities (ranging from 12 to 53%!). As expected the role of the head decreases
(48 to 40% for maintenance, and 44 to 23% for discretionary activities). A similar reduction (nearly 50%
drop) is also seen in spouse’s activity participation probabilities (32 to 17% maintenance, and 32 to 13%
for discretionary activities).
Household income:
Interesting differences in activity allocation are observed across different income groups. In
households with higher income, the maintenance allocation between head and spouse is more equitable
(hhh = 44%, and spouse = 36%). In contrast, in households with lower income the head of the household
plays a primary role in maintenance activities (head = 49%, spouse = 26%). A similar trend is also seen in
discretionary activities (high income: head - 41%, spouse - 35%, whereas in low income households: head
- 43%, spouse - 27%). These differences may be attributable to the greater availability of disposable
income and vehicles in higher income households, and possibly a greater value of travel time for the head
of the household in these cases. Evidence of this conjecture is also seen in the joint activity participation.
While only 11% of activities involve joint participation in high income households, nearly 16% of
maintenance and 13% of discretionary activities in lower income households involve joint activity
participation.
Presence of Kids:
The head of the household is more likely to participate in maintenance activities in households
with small children compared to those households with no kids (51 versus 46%). A similar effect is also
seen for discretionary activities (50 and 42% respectively). Interestingly, the role of the spouse (of hhh) is
also increased (36 % with kids, and 30% without children for maintenance; whereas, the corresponding
probabilities are 38% versus 29% for discretionary activities). The increase above is compensated by a
reduction in joint participation, which drops drastically with the presence of small children. The joint
activity participation probabilities average about 4% (5%), 10% (9%) and 15% (14%) respectively for
maintenance (discretionary) activities in households with 0-5 year old children, 6-15 year old children,
and no children. The solo participation of other individuals is also high in households with school going
children (6-15), with 24% (nearly a fourth of household activities) in discretionary activities and around
10% for maintenance activities. Thus, modeling activities and trips by these individuals (not just hhh and
44
spouse) at least for selected segments of the population is essential, possibly due to the non-motorized
nature of such trips, and significant contribution to household trip-making.
Employment Status of the Couple (HHH and Spouse):
To examine the role of employment status of head and spouse, the activity propensities are
compared for three groups of respondents: i) the head is full-time employed but the spouse is a non-
worker, ii) both the head and spouse are full-time workers, and iii) only the spouse is full-time employed,
the head is a non-worker. Interestingly, when both are working the participation of the head and spouse
are both higher compared to the case when the spouse is not working. For instance, the participation
propensities for maintenance were 45, and 38% respectively for the head and spouse respectively in
households where both individuals are employed, whereas, the rates were lower at 41% and 30 %
respectively. A similar trend is also observed for discretionary activity (both employed: 41, 36%
probabilities for the head and spouse respectively, whereas, the probabilities drop to 37 and 25% for
households where only the head is employed).
The overall increase for both partners is indicative of a greater level of mobility when both hhh
and spouse are employed, whereas, the increase in spouse’s participation indicates a greater degree of
activity sharing due to work-related time constraints when both members are full-time workers. While the
lower participation rate of a spouse of the head when the spouse is not a full-time worker may appear
counter-intuitive given the lack of time-constraints, this may be attributable possibly to a reduced level of
access to vehicles to non-workers in households with limited number of cars. In contrast, in households
where the spouse is a full-time worker, but the head is not employed, the head of the household plays a
key role in maintenance and discretionary activities (maintenance probabilities are: 57% head, 26%
spouse, whereas, for discretionary activities the probabilities are: 47% head and 28% spouse)
highlighting the role of spouse’s work-related time-constraints and greater time-availability with the head
of the household (possibly retired). These results emphasize the trade-off between vehicle availability
and time-availability on person allocation to activities. Note that the nature and extent of trade-off varies
across households depending on the employment status of the head of the household and his/her spouse.
Age of couple:
Differences in person allocation are also observed based on age of the couple, which is partially
reflective of life-cycle differences. In younger couples (when both hhh and spouse are less than 30 years
of age), a greater distribution of activities is observed. The probability of participation is 46% (48%) for
the head, and 43% (41%) for the spouse for maintenance (discretionary) activities, whereas joint activity
propensity is about 9%. When both partners are middle aged (30-50 years old), the head plays a slightly
45
more active role (hhh - 46%, spouse - 38% for maintenance; hhh - 40%, spouse - 36% for discretionary),
partly due to additional child-care responsibilities for the spouse in many cases, and the joint activity level
remains unchanged at around 10%. In contrast, when both the hhh and spouse belong to the older age
category (> 50 years), the joint activity participation increases between 15-17% for both maintenance and
discretionary activity. This increase may be partly attributed to the reduced time constraints possible after
retirement. The primary participant in these households is also its head (47% maintenance, 41%
discretionary), and the spouse’s role is also nearly the same as middle -aged couple (34% and 35%
respectively). Note that the participation of other individuals (solo) is the maximum (15%) for couple in
the age range 31-50 years, and may coincide with the presence of 6-15 year old children and their
participation in recreational activities. In contrast, the participation of other individuals is much lower 4-
6% for couples in other age ranges. The lower participation in younger age couples is due to lack of
children or presence of small children (0-5 years), whereas, for older couples, children are older than 18
year and are unlikely to stay with their parents.
3.7 Assumptions and validation
In this study, all records pertaining to one person household and single parents are excluded from
analysis, as the person allocation to activities is obvious. Further, this study also only focuses on person
allocation conditional on activity generation, but does not investigate the interactions between generation
and allocation. The justification for these simplifying assumptions is three-fold: First, given the large
number of models and decision variables, the simpler model choice is dictated by computational
tractability, and the ease of specification and interpretation of the assumptions. These can be relaxed in a
straightforward manner using more sophisticated models specifications as per the formulation shown in
equations (3d) analyze the decision dimensions jointly, though at considerable computational expense in
further research. Future research will also consider: dynamics and variability in person allocation across
activities within the same household, influence of vehicle availability and person location jointly with
person allocation, and the allocation of persons who participate in a joint activity.
Validation: The models presented above are validated using different data records of the same
BATS 1996 data set. For validating the models, 14,518 activity records were used that were not used for
calibration. The results are found to be robust across the two data sets for most variables, in terms of
signs, significance and magnitudes. The goodness of fit across the two samples was also comparable (ρ2 =
0.27 for maintenance, ρ2 = 0.24 for discretionary activity models in the predicted data set as opposed to ρ2
= 0.31 for maintenance and ρ2 = 0.28 for discretionary for the calibration data set). In addition, the
aggregate sample market shares are reported for three cases in Table 3.4: i) calibrated model applied to
prediction data set, ii) actual observations prediction data set and iii) calibrated model on calibration data
46
set (for comparison). It is noteworthy that the calibrated model performs quite well in predicting
aggregate market shares on the predicted data set, with errors of <1.2% for maintenance activities, and
<0.3% for discretionary activities. Thus, despite the simplifying assumptions noted above, the model
appears to provide intuitive and fairly robust insights on the role of various explanatory factors on activity
allocation to household members.
3.8 Summary
This paper investigates the allocation of household individuals to out-of-home maintenance and
discretionary activities using the rich activity-travel diary data from the San Francisco Bay Area (cite
BATS, 96). In particular, a series of models are used to (i) explore the effect of household role, person
characteristics, and trip attributes on activity allocation (ii) investigate the role of constraints on time,
vehicle availability, cost, and coordination on activity allocation among household members (iii) analyze
the differences between households in allocation of persons to activities.
The results provide significant evidence of the effect of life-cycle and household role on person
allocation to activities: the head of the household is generally more likely to participate in both
maintenance and discretionary activities than the spouse of the head of the household. As the number of
household members who are employed increases, participation in joint activities is observed to be
decreasing significantly for maintenance activities. The results also suggested a strong role of gender on
the allocation of tasks: in households, where most of the prior maintenance activities are performed by
males, the likelihood of female performing future maintenance activities was lower. Household income is
also found to have significant in activity participation patterns of household members. For instance, lower
income households are more likely to participate in joint activities than their medium and high income
counterparts.
Location and proximity factors from home and work place also appear to influence person
allocation (full time workers are less likely to participate in home-based maintenance trips, non-licensed
individuals more likely to perform non-home based trips). The results also suggest a significant drop in
non-motorized travel from 0 cars to 1 car households, a greater participation of other household
individuals occurs with an increase in the number vehicles available per driver. The analysis reveals: i) a
more equitable maintenance activity allocation between the head and the spouse in higher income
households, ii) existence of a trade-off between vehicle allocation decisions and time availability on
person allocation to activities, and iii) a greater level of activity participation by females in maintenance
activities than males. Further, various results emphasized the importance of explicitly considering the
activity participation of other household individuals (i.e., other than the head and the spouse).

47
The proposed person allocation models can be further enhanced to investigate the following research
directions in the future:
1) the use of more sophisticated error-structure to capture various sources of correlations (for e.g.
within-person, within-household etc.)
2) variables that explicitly account for the time-varying nature of household vehicle allocation
decisions and vehicle availability on person allocation decisions.
Other directions for future research are also presented in the next chapter.
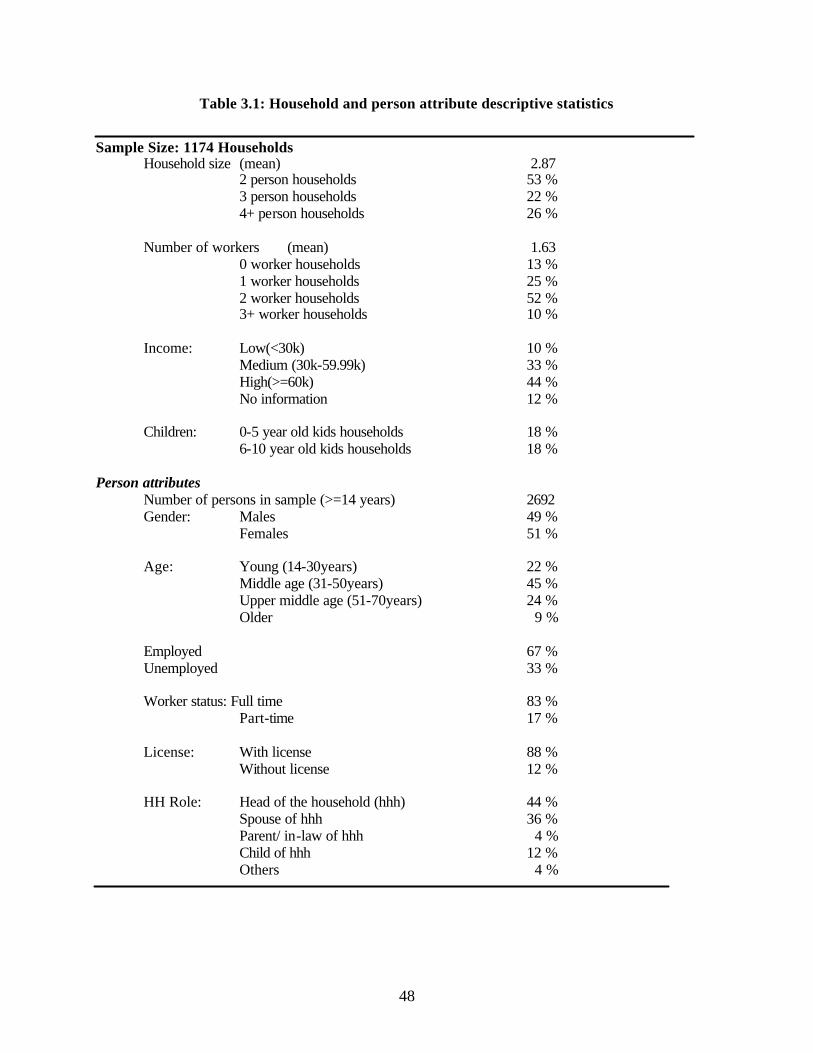
48
Table 3.1: Household and person attribute descriptive statistics
Sample Size: 1174 Households Household size (mean) 2.87 2 person households 53 % 3 person households 22 % 4+ person households 26 %
Number of workers (mean) 1.63 0 worker households 13 % 1 worker households 25 % 2 worker households 52 % 3+ worker households 10 % Income: Low(<30k) 10 % Medium (30k-59.99k) 33 % High(>=60k) 44 % No information 12 % Children: 0-5 year old kids households 18 % 6-10 year old kids households 18 %
Person attributes Number of persons in sample (>=14 years) 2692 Gender: Males 49 % Females 51 % Age: Young (14-30years) 22 % Middle age (31-50years) 45 % Upper middle age (51-70years) 24 % Older 9 %
Employed 67 % Unemployed 33 %
Worker status: Full time 83 %
Part-time 17 % License: With license 88 %
Without license 12 % HH Role: Head of the household (hhh) 44 % Spouse of hhh 36 % Parent/ in-law of hhh 4 % Child of hhh 12 % Others 4 %
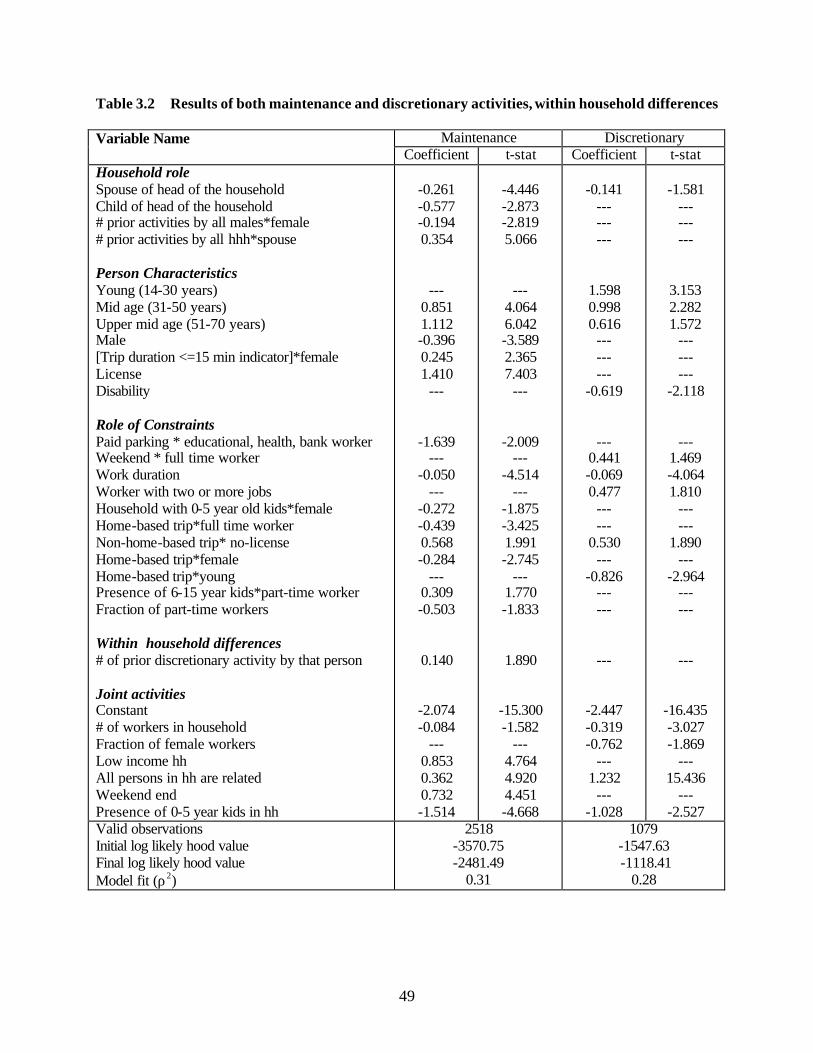
49
Table 3.2 Results of both maintenance and discretionary activities, within household differences
Maintenance Discretionary Variable Name Coefficient t-stat Coefficient t-stat Household role Spouse of head of the household Child of head of the household # prior activities by all males*female # prior activities by all hhh*spouse Person Characteristics Young (14-30 years) Mid age (31-50 years) Upper mid age (51-70 years) Male [Trip duration <=15 min indicator]*female License Disability Role of Constraints Paid parking * educational, health, bank worker Weekend * full time worker Work duration Worker with two or more jobs Household with 0-5 year old kids*female Home-based trip*full time worker Non-home-based trip* no-license Home-based trip*female Home-based trip*young Presence of 6-15 year kids*part-time worker Fraction of part-time workers Within household differences # of prior discretionary activity by that person Joint activities Constant # of workers in household Fraction of female workers Low income hh All persons in hh are related Weekend end Presence of 0-5 year kids in hh
-0.261 -0.577 -0.194 0.354
--- 0.851 1.112 -0.396 0.245 1.410
---
-1.639 ---
-0.050 ---
-0.272 -0.439 0.568 -0.284
--- 0.309 -0.503
0.140
-2.074 -0.084
--- 0.853 0.362 0.732 -1.514
-4.446 -2.873 -2.819 5.066
--- 4.064 6.042 -3.589 2.365 7.403
---
-2.009 ---
-4.514 ---
-1.875 -3.425 1.991 -2.745
--- 1.770 -1.833
1.890
-15.300 -1.582
--- 4.764 4.920 4.451 -4.668
-0.141
--- --- ---
1.598 0.998 0.616
--- --- ---
-0.619
--- 0.441 -0.069 0.477
--- ---
0.530 ---
-0.826 --- ---
---
-2.447 -0.319 -0.762
--- 1.232
--- -1.028
-1.581
--- --- ---
3.153 2.282 1.572
--- --- ---
-2.118
--- 1.469 -4.064 1.810
--- ---
1.890 ---
-2.964 --- ---
---
-16.435 -3.027 -1.869
--- 15.436
--- -2.527
Valid observations Initial log likely hood value Final log likely hood value Model fit (ρ2)
2518 -3570.75 -2481.49
0.31
1079 -1547.63 -1118.41
0.28
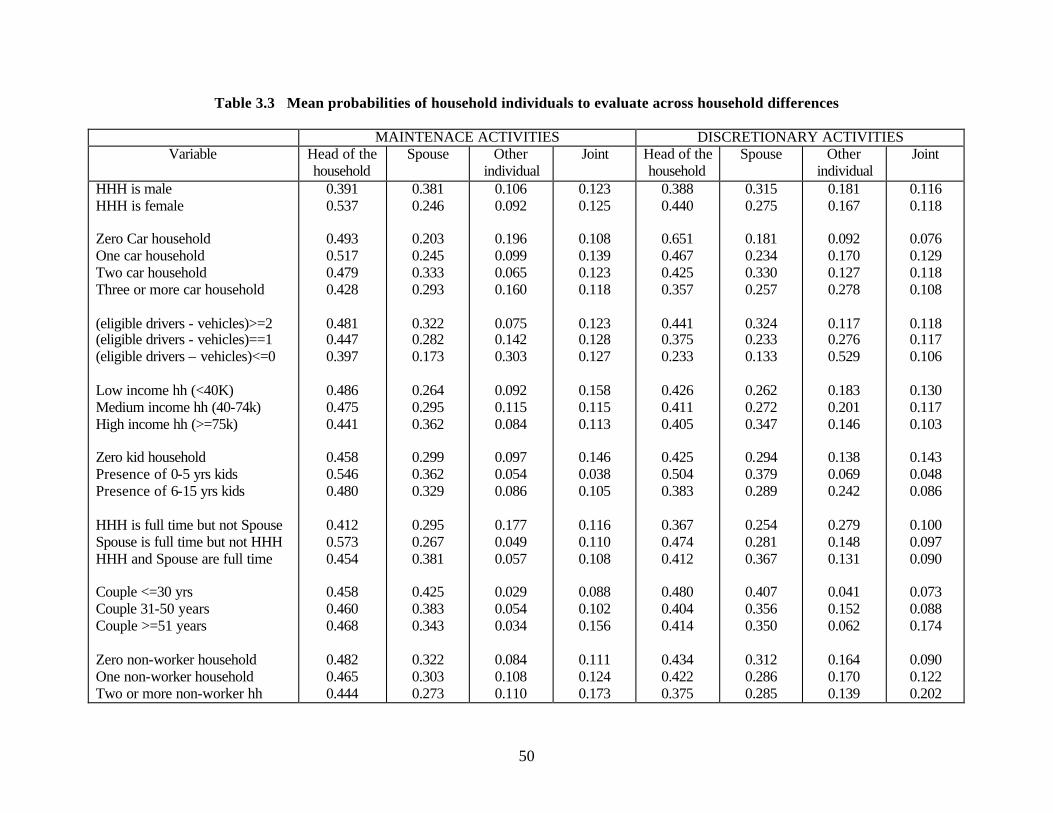
50
Table 3.3 Mean probabilities of household individuals to evaluate across household differences
MAINTENACE ACTIVITIES DISCRETIONARY ACTIVITIES Variable Head of the
household Spouse Other
individual Joint Head of the
household Spouse Other
individual Joint
HHH is male HHH is female Zero Car household One car household Two car household Three or more car household (eligible drivers - vehicles)>=2 (eligible drivers - vehicles)==1 (eligible drivers – vehicles)<=0 Low income hh (<40K) Medium income hh (40-74k) High income hh (>=75k) Zero kid household Presence of 0-5 yrs kids Presence of 6-15 yrs kids HHH is full time but not Spouse Spouse is full time but not HHH HHH and Spouse are full time Couple <=30 yrs Couple 31-50 years Couple >=51 years Zero non-worker household One non-worker household Two or more non-worker hh
0.391 0.537
0.493 0.517 0.479 0.428
0.481 0.447 0.397
0.486 0.475 0.441
0.458 0.546 0.480
0.412 0.573 0.454
0.458 0.460 0.468
0.482 0.465 0.444
0.381 0.246
0.203 0.245 0.333 0.293
0.322 0.282 0.173
0.264 0.295 0.362
0.299 0.362 0.329
0.295 0.267 0.381
0.425 0.383 0.343
0.322 0.303 0.273
0.106 0.092
0.196 0.099 0.065 0.160
0.075 0.142 0.303
0.092 0.115 0.084
0.097 0.054 0.086
0.177 0.049 0.057
0.029 0.054 0.034
0.084 0.108 0.110
0.123 0.125
0.108 0.139 0.123 0.118
0.123 0.128 0.127
0.158 0.115 0.113
0.146 0.038 0.105
0.116 0.110 0.108
0.088 0.102 0.156
0.111 0.124 0.173
0.388 0.440
0.651 0.467 0.425 0.357
0.441 0.375 0.233
0.426 0.411 0.405
0.425 0.504 0.383
0.367 0.474 0.412
0.480 0.404 0.414
0.434 0.422 0.375
0.315 0.275
0.181 0.234 0.330 0.257
0.324 0.233 0.133
0.262 0.272 0.347
0.294 0.379 0.289
0.254 0.281 0.367
0.407 0.356 0.350
0.312 0.286 0.285
0.181 0.167
0.092 0.170 0.127 0.278
0.117 0.276 0.529
0.183 0.201 0.146
0.138 0.069 0.242
0.279 0.148 0.131
0.041 0.152 0.062
0.164 0.170 0.139
0.116 0.118
0.076 0.129 0.118 0.108
0.118 0.117 0.106
0.130 0.117 0.103
0.143 0.048 0.086
0.100 0.097 0.090
0.073 0.088 0.174
0.090 0.122 0.202
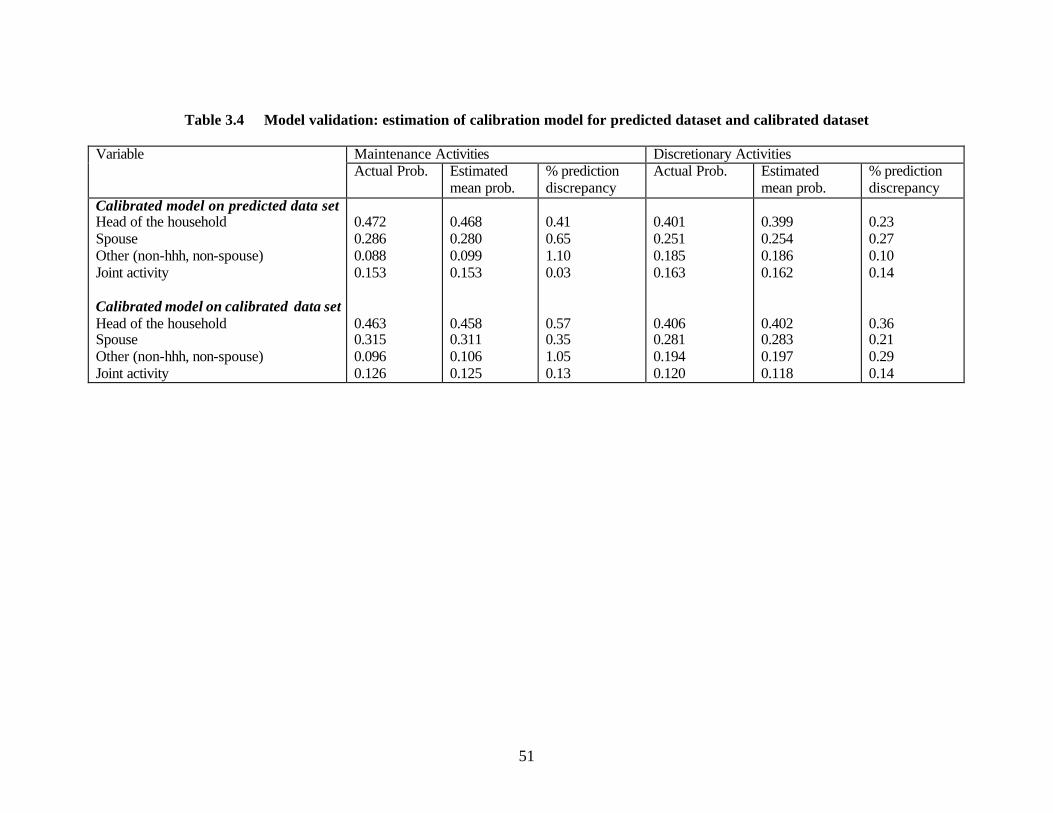
51
Table 3.4 Model validation: estimation of calibration model for predicted dataset and calibrated dataset
Maintenance Activities Discretionary Activities Variable Actual Prob. Estimated
mean prob. % prediction discrepancy
Actual Prob. Estimated mean prob.
% prediction discrepancy
Calibrated model on predicted data set Head of the household Spouse Other (non-hhh, non-spouse) Joint activity Calibrated model on calibrated data set Head of the household Spouse Other (non-hhh, non-spouse) Joint activity
0.472 0.286 0.088 0.153 0.463 0.315 0.096 0.126
0.468 0.280 0.099 0.153 0.458 0.311 0.106 0.125
0.41 0.65 1.10 0.03 0.57 0.35 1.05 0.13
0.401 0.251 0.185 0.163 0.406 0.281 0.194 0.120
0.399 0.254 0.186 0.162 0.402 0.283 0.197 0.118
0.23 0.27 0.10 0.14 0.36 0.21 0.29 0.14
52
CHAPTER IV
PHYSICAL/VIRTUAL ACTIVITY PARTICIPATION
4.1 Introduction
Recent advances in Information and Communication Technologies (ICT) make possible to
conduct activities virtually, thus obviating the need for physical travel, at least for some types of
activities. Activities that may be performed virtually include: online shopping, telecommuting,
teleconferencing, information gathering, and maintenance activities (such as online banking and bill
payment). Further, as the prices of ICT products and services fall due to improved economies of scale (for
example, cell phone use is growing rapidly), the adoption and use of ICTs continues to grow rapidly.
These socio-technological developments offer individuals both the opportunity and the ability to
substantially alter their activity and travel patterns. ICT use may contribute towards reducing urban
congestion and air-quality problems (by replacing travel with virtual activities); on the other hand, they
may also generate significant additional and induced travel due to increased connectivity and access to
resources. Thus, empirical insights on how the growing ICT use affects travel patterns and vice-versa
have important implications for planning, travel demand forecasting, and urban facility location decisions.
Given these motivating considerations, this chapter investigates the linkages between ICT use, activity
participation decisions, and travel patterns using recent empirical activity-diary data from the San-
Francisco Bay Area (MTC, (2000); and Vaughn, (2003)).
ICT use can lead to a range of changes in activity travel patterns, including substitution,
generation, and modification (Mokhtarian et al., (1997); and Krizek et al., (2003)). Substitution and
modification of trips can have a significant impact on transportation system performance. For instance,
the availability of virtual activities could result in fewer and more efficient trips. To illustrate, consider
an example where a customer seeks to purchase a product from a physical store location. For this activity,
he/she will make two trips. However, if the product is purchased online, only one trip may be needed for
delivering the product. Further, since the producer may be delivering goods to more than one customer,
these trips can be planned and executed more efficiently. In contrast, the availability of new technologies
could actually generate additional trips. Part of the trip time saved by more efficient trip patterns may be
used towards additional or longer trips. Furthermore, easy access to information and resources through
browsing and increased interpersonal communications using ICT devices, may lead to additional trips.
ICT use may also lead to a modification in current trip patterns. For instance, a user may change his
destination for shopping activities in response to price promotions found through ICT use (e.g., by
53
browsing). Although ICTs have an important impact on mobility and travel demand, the magnitude and
nature of their impact is unclear as yet.
In order to explore the linkages between ICT, travel and mobility patterns of users, this chapter
investigates three objectives. The first objective aims to analyze ICT use patterns of individuals. The
second objective investigates the linkages between ICT use and physical/virtual activity participation for
discretionary and maintenance activities. The role of ICT use attributes and the virtual activity propensity
on these decision dimensions are explicitly modeled in this objective. The final objective aims to
investigate the linkages between observed daily travel patterns (represented by the dimensions of trip
frequency and trip duration), ICT use and individual’s activity attributes. In particular, this objective
focuses on analyzing the relationship between virtual activity participation, physical activity participation,
Internet use patterns, and observed travel dimensions.
To achieve these objectives, a series of thirteen discrete and continuous econometric models are
estimated using the rich and highly disaggregate activity diary from the San-Francisco Bay Area (BATS
2000). This dataset provides three key advantages (for this analysis) compared to other datasets
containing Internet use data: i) availability of disaggregate data on physical activities, virtual activities
and travel patterns (at episode and daily levels), ii) data provides a more holistic representation of ICT use
and various virtual activities, in contrast to focused studies where interest is centered on ICT use for tele -
work or tele-shopping etc. and iii) the availability of a large real-world database (with 390,000 records per
day for two days) permits the development of richer multi-level models to explore the relationship
between ICT use, activity patterns, and travel decisions. The empirical models developed in this study
reveal evidence of significant linkages between ICT use, activity participation, and travel patterns, with
implications for developing demand management measures, promoting ICT use to reduce congestion/air-
quality problems, and forecasting future travel patterns.
The rest of this chapter is organized as follows. Section 4.2 presents the descriptive statistics of
the data that is used in this study. The model structure used in this study and assumptions and exceptions
related to models are described in Section 4.3. Model results and analysis are presented in the next
section. The final section summarizes major findings, limitations of the study and proposes some
directions for future work.
4.2 Data description and descriptive statistics
To address the objectives discussed earlier, this study uses disaggregate activity travel data from
the Bay Area Travel Survey 2000 (BATS 2000), which contains data on 780,000 activity episode records
from 15,064 households obtained using a two day activity diary survey. In this survey, data was collected
on activity participation of individuals. Further data was also obtained on daily and episode level ICT use
54
variables such as: web access at home, Internet use for work, Internet use for non work purpose, number
of faxes and phones. The dataset also contained detailed information on household and individual
attributes of all survey respondents. However, information on the presence of computers at home and
number of cell phones is not available directly.
From these records, this study uses 50,055 first day activity records, and corresponding 4,214
respondents. A rigorous screening procedure was used to eliminate records and observations with
implausible or incomplete data. For instance, missing information on Internet usage and outliers in
activity duration was treated as missing. Further, records of children of age less than 14 years were
excluded from the usable sample given that their decisions are most likely to be dependent on other adults
in the household. A total number of 2,381 usable person records were obtained after the screening
procedure.
Analysis of descriptive statistics of the sample used in this study revealed that the sample profile
matched reasonably closely in terms of activity and travel characteristics with the 1996 SF activity data
and the 1998 Miami survey data. The following respondent characteristics were observed in the sample
with 1,793 households and 4,214 persons. Household variables include income, vehicle status, phones,
faxes and Internet access. The sample consisted of 58% households with income >= $60,000, 34% of
households had an income in the range $25,000-$59,999, whereas, 8% of the households had an annual
income of less than $25,000. Nearly 31% of households had one car, and 65% had two or more cars, but
4% had zero cars. Nearly three-fourths of the sample (72%) had one phone in their household, whereas,
28% had two or more phones). Only 31% of the households in the sample had access to a fax at home,
whereas, 73% of the sample had access to the Internet from home.
Among individual attributes, the sample consisted of 48% males, and nearly 69% of the
respondents were workers. The age distribution consisted of 23% young (14-30), 42% middle aged (31-
50), 27% upper middle aged (51-70), and 8% elderly respondents (>70). The mean daily trip frequency
was 4.2 trips (std. deviation = 2.74 trips), and the mean trip duration was 93 minutes (std. Deviation was
73 minutes). In terms of ICT use, nearly 35% of respondents used Internet on the first survey day. The
proportion of in-home maintenance and discretionary activities (in terms of respective total maintenance
and discretionary activities) were 26 and 24% respectively.
4.3 Modeling structure
Three different types of dependent variables are of interest in the set of 13 models noted above.
Discrete binary decisions are of interest in relation to decisions such as Internet use/not, Internet use for
maintenance/not, in-home or out-of-home discretionary activities etc. Continuous decision dimensions
relate to durations of interest such as duration of in-home and out-of-home activity episodes, or total
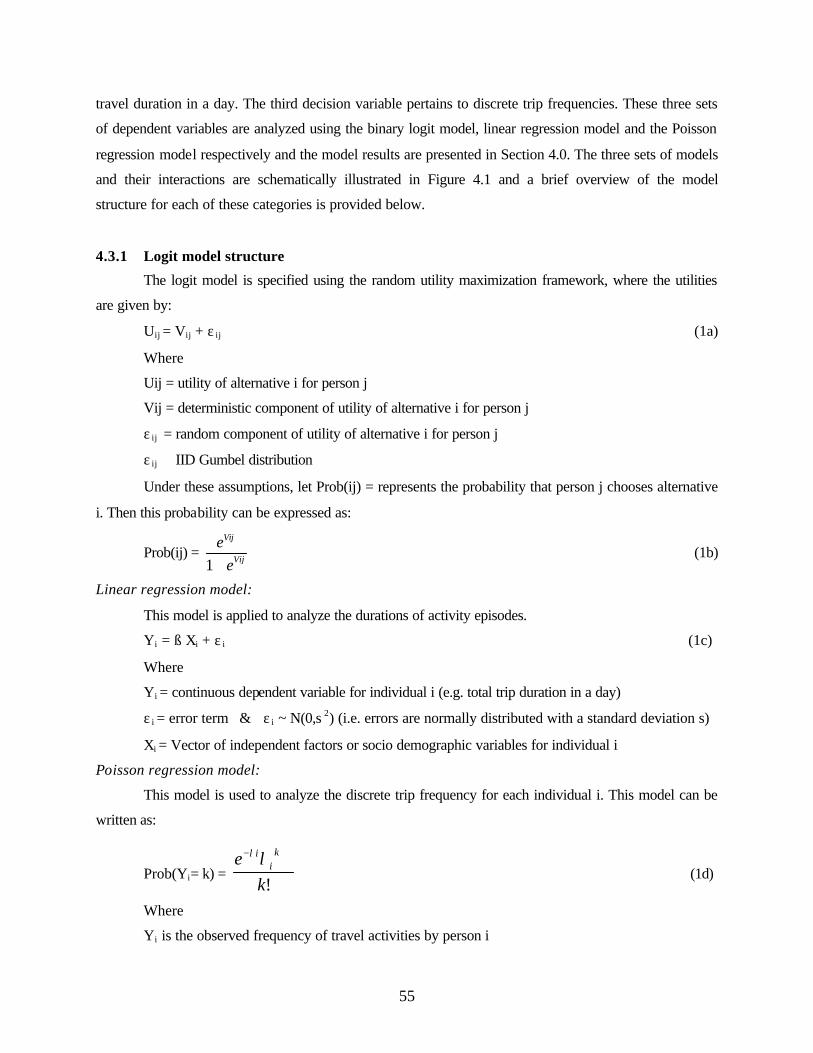
55
travel duration in a day. The third decision variable pertains to discrete trip frequencies. These three sets
of dependent variables are analyzed using the binary logit model, linear regression model and the Poisson
regression model respectively and the model results are presented in Section 4.0. The three sets of models
and their interactions are schematically illustrated in Figure 4.1 and a brief overview of the model
structure for each of these categories is provided below.
4.3.1 Logit model structure
The logit model is specified using the random utility maximization framework, where the utilities
are given by:
Uij = Vij + ε ij (1a)
Where
Uij = utility of alternative i for person j
Vij = deterministic component of utility of alternative i for person j
ε ij = random component of utility of alternative i for person j
ε ij ∼ IID Gumbel distribution
Under these assumptions, let Prob(ij) = represents the probability that person j chooses alternative
i. Then this probability can be expressed as:
Prob(ij) = 1
Vij
Vij
ee+
(1b)
Linear regression model:
This model is applied to analyze the durations of activity episodes.
Yi = ß Xi + ε i (1c)
Where
Yi = continuous dependent variable for individual i (e.g. total trip duration in a day)
ε i = error term & ε i ~ N(0,s 2) (i.e. errors are normally distributed with a standard deviation s)
Xi = Vector of independent factors or socio demographic variables for individual i
Poisson regression model:
This model is used to analyze the discrete trip frequency for each individual i. This model can be
written as:
Prob(Yi= k) = !k
e ki
iλλ−
(1d)
Where
Yi is the observed frequency of travel activities by person i
56
?i = ßXi is the mean trip frequency for individual I given the socio-demographic factors X.
Xi = vector of independent variables
4.3.2 Assumptions and exceptions
Several simplifying assumptions have been made in selecting the models above to analyze the
decision dimensions of interest. For instance, the use of the binary logit model assumes that Internet use
decisions across different virtual purposes are mutually independent. Similarly, the decisions of activity
episode durations and in-home and out-of-home activities are not modeled jointly although they are likely
to be correlated. Further, relationships and correlation between members from the same household are not
explicitly modeled. The justification for these simplifying assumptions is three-fold: First, given the large
number of models and decision variables, the simpler model choice is dictated by computational
tractability, and ease of specification and interpretation. Therefore, the initial focus in this study is on
systematic utility rather than unobserved errors. Second, since the models are presented as marginal
choice probabilities, due to these sources of misspecification, the model coefficients are likely to be
inefficient (variance of the estimator will be high, leading to less sharp inferences), but the coefficients
themselves are not subject to inconsistency or bias. Besides, given the large sample size, it is reasonable
to expect that the inefficiency issue is less severe than potential bias/inconsistency. Finally, the
assumptions above can be relaxed in a straightforward manner using more sophisticated models such as
mixed logit or MNP models to analyze the decision dimensions jointly, though at considerable
computational expense.
All models are estimated using the Maximum Likelihood Estimation technique. This technique
finds the likelihood of data and maximizes this likelihood to estimate required parameters. The factors
considered in this study include: ICT, person, worker, household related variables and also time of day
and day of week related information. The estimated model coefficients are shown in Tables 4.1 through
4.4 and the discussion on the coefficients is presented in the following section.
4.4 Results and Discussion
The modeling results (coefficients are shown in Tables 4.1-4.4) reveal a better fit for the discrete
choice dimensions than continuous decision dimensions (goodness of fit ρ2 ranges from 0.2-0.8, with two
exceptions, browsing and overall Internet use models had goodness of fit measures of 0.06 and 0.135
respectively). The model fit for duration decisions are generally poorer (suggesting a greater degree of
unaccounted variability) than the discrete decisions, and have low ρ2 values in the range of 0.04-0.07.
57
4.4.1 Models of ICT use patterns:
Role of access to communication devices
Increasing access to communication devices appears to increase the propensity of Internet use as
expected. For example, with increasing numbers of phones available to a household, the Internet use
propensity also increases. Individuals with multiple phone lines, but who live alone, are more likely to
perform maintenance activities through Internet. The presence of faxes in a household has a positive
effect on both Internet usage and performing work-related activities online. Access to the worldwide web
from home also increases the probability of Internet use for recreational purposes.
Effect of work-related attributes
As with physical activities, the types of activities performed virtually via the internet also vary
based on work-related characteristics. The availability and the need for ICT resources at work and/or
home may encourage the substitution of physical activities with virtual activities. The results show that
employees working in computer and semiconductor industries, educational or entertainment sectors are
more likely to use Internet than workers in other industries. Further, executives are found to display a
greater propensity for performing maintenance activities virtually (online), possibly due time constraints.
Workers particularly, in construction, business, or health industries tend to perform maintenance
activities online more than respondents in other professions. Workers holding multiple jobs (presumably
part-time) were found to have a greater propensity for Internet-related subsistence activities than those
with only one full-time job. With increasing income, the probability of Internet use and online
maintenance activity participation increases (possibly a reflection of access to ICT resources) a trend also
noted by Farag et al, (2003), whereas, the likelihood of recreational use of internet decreases.
Cross-substitution among virtual activities
Not only is there possible substitution between travel and virtual activities, there also appears to
be some degree of cross-substitution among virtual activities themselves. Individuals that use the Internet
for recreational activities are less likely to perform subsistence, browsing and maintenance activities
online.
Relationship between mobility and connectivity
A strong positive relationship is observed between mobility and connectivity (internet use) needs
of users. For instance, individuals with licenses are more likely to use Internet than those without licenses.
Younger and middle aged individuals are more likely to use the Internet than older individuals, also
consistent with their increased mobility levels (see Section 4.3).
58
The results indicate that Internet use can also generate additional travel. For example, individuals
who make more trips are more likely to use the Internet, also supporting the hypothesis that mobility and
connectivity are strongly positively correlated. However, individuals with longer duration of daily travel
are less likely to use the internet than individuals with shorter daily travel duration. Both these results
may be attributed to the fact that Internet use may partially offset physical travel for some types of trips
(possible substitution of travel by internet activities), thus reducing overall travel-times, which in turn
may form the basis for increased travel frequency for Internet users. This hypothesis is further
corroborated in the travel pattern model reported later in Section 4.3. However, the causality of whether
connectivity affects drivers’ mobility or vice-versa cannot be ascertained from this model, and needs
further investigation.
With the increasing number of vehicles in a household, a greater propensity of Internet use for
browsing and recreational activities is observed. This suggests that such browsing and recreational virtual
activities may contribute to additional travel by making users aware of new activity participation
opportunities (both physical and virtual). The awareness of additional discretionary activities (online) and
the availability of vehicles provide these households with the ability to pursue additional travel. Thus,
promoting virtual activities may in some cases be counterproductive in terms of trip-reduction, and air-
quality improvement measures, if this promotion leads to the pursuit of additional physical travel
opportunities.
Socio-demographic differences
There appear to be significant differences in ICT use patterns across various socio-demographic
segments of users. Individuals with African-American or Hispanic ethnicity are less likely to use the
Internet than people of other races. Males are more likely to use the Internet in general than females,
though females are more likely to perform subsistence and recreational activities online. A greater
probability of Internet use is also found among students, non-workers and occasional workers, individuals
from small households, and respondents living in rented apartments, compared to other socio-
demographic segments.
4.4.2 Relationship between physical and virtual activity participation
To study the relationship between physical and virtual activity participation patterns, this section
focuses on two types of activities: discretionary and maintenance. These two activity types have been
selected since there is significant opportunity to participate in virtual activities for these two purposes.
59
4.4.2.1 Relative propensity of in-home and out-of-home participation for discretionary and maintenance activities Effect of work-related attributes
Among worker-related attributes, respondents with flexible work times (possibly due to tele -work
arrangements) display a greater propensity for out-of-home maintenance activity participation than those
with fixed work times. Thus, flexible work policies can lead to additional trips, which may offset some of
the benefits obtained by staggering of work trips away from the peak-period. Furthermore, the additional
trips are likely to worsen air-quality problems.
Professionals and executives are more likely to pursue in-home maintenance activities than other
user groups, suggesting the substitution of some maintenance-related travel with virtual activities. This
result also corroborates the greater online maintenance activity participation of this group of users, noted
based on the models of ICT use (Section 4.1). Compared to non-workers, full-time workers are also more
likely to perform in-home discretionary activities. Given the larger propensity of non-workers to perform
physical maintenance and discretionary activities, greater degree of temporal and spatial flexibility, and
their lower virtual activity participation, demand-reduction measures aimed at non-workers, (especially
through the promotion of virtual activity participation) can lead to significant potential benefits in terms
of trip substitution.
While substitution effects noted above can lead to demand reduction for particular types of trips,
the data shows also evidence of generation of other trip types that tends to increase demand for travel. For
instance, professionals and executives, particularly workers in the health care and service sectors who are
more likely to participate in online and in-home maintenance activities also display a greater propensity
for out-of-home discretionary activities compared to non-workers and workers in other industries. The
implication of this finding is that it is essential to consider virtual and physical activity participation in all
activity types jointly (rather than one virtual activity type such as telecommute or teleshop) in order to
obtain accurate forecasts of the net impact of ICT’s on travel demand.
Effect of mobility and income
Among household characteristics, both car-ownership and income play an important role in
determining physical or virtual activity participation. Households with fewer vehicles are more likely to
participate in in-home discretionary activities. Thus, virtual activity access and connectivity can at least
partially offset mobility restrictions. On the other hand, the substitution of physical activity with virtual
activity is also higher for high-income households for maintenance activities. The likelihood of out-of-
home maintenance activity decreases, while at the same time, the propensity for online maintenance
activities increases (noted in Section 4.1).
60
Timing effects
The results also provide evidence that time-of-day and day-of-week affect the choice of physical
and virtual activity participation. Maintenance and discretionary activities requiring travel are more likely
to be conducted during morning (peak or pre-peak), and afternoon periods (possibly by non-workers),
whereas, the propensity for in-home discretionary activities increases during evening peak or night times.
Thus, there may be a differential impact of substitution of physical and virtual activities between morning
and evening peak periods, with a larger demand reduction potential during the latter. Further, physical
travel for both purposes is more likely during the weekends than the weekdays.
Socio-demographic differences
Socio-demographic patterns such as age, gender, and ethnicity affect the decision on physical and
virtual activity participation, in a manner that is consistent with their ICT use patterns discussed in
Section 4.1. Hispanic and African American respondents display a greater preference for out-of-home
maintenance activities than other ethnic groups, which is consistent with the lower internet use rate
among these groups. Respondents in the age group 31-50 years are more likely to perform discretionary
activities in-home compared to younger and older individuals, a trend consistent with the greater internet
use and online maintenance activity participation among full-time workers (a majority of which belong to
this age-group) noted previously.
4.4.2.2 Duration of in-home and out-of-home episodes for discretionary and maintenance activities
Substitution and generation effects
ICT use patterns also affect the episode duration of in-home and out-of-home activities. Users
who are more likely to use Internet for recreational purposes (obtained from models in section 4.1) are
also likely to spend less time on out-of-home discretionary activities. These results suggest that travel
becomes more efficient (either by elimination of certain physical trips or trips may be destined to nearby
locations), thus providing evidence of substitution or modification effects. In contrast, the data also
reveals a generative influence of ICT use on travel behavior, in terms of longer travel duration in the
following cases. Shorter in-home discretionary activity duration is observed for households with access to
the Internet. Similarly, the presence of fax devices at home correlates positively with longer out-of-home
discretionary activities.
Effect of work-related attributes
Work-characteristics strongly affect the duration of in-home and out-of-home maintenance
activities. Full time workers and executives spend less time on out-of-home activities than non-workers,
61
which is also corroborated by the greater internet use, especially for online maintenance activities,
observed for this user segment. This finding can be attributed to the tighter time constraints on workers
and the greater role of household maintenance activities for non-workers. However, there was no
discernible effect of work-related variables on discretionary activity duration.
Effect of mobility-related factors
Mobility-related factors affect the durations of physical and virtual activity episodes. Individuals
without a driver’s license tend to have larger out-of-home maintenance duration, possibly due to the
longer transfer, waiting and access times associated with alternative modes. Further, the in-home
maintenance duration is also larger for users in this group than for individuals with a license, suggesting
the potential to substitute physical activity access with virtual activity access to offset mobility
restrictions. As expected, the number and type of vehicles in the household also affect out-of-home
discretionary duration. Longer trips are observed in households with more cars, and shorter trips are noted
for households with bicycles.
Timing effects
As expected out-of-home discretionary activities are longer during the weekends than weekdays,
afternoons and evening peak than early morning or night times. The duration of out-of-home
maintenance activity of workers during weekends is longer than on weekdays. This suggests that although
ICTs may be effective in substituting travel with virtual activities under time constraints for certain class
of users (such as full-time workers in the weekdays), the increase in travel during weekends may partially
offset if not negate benefits that may be obtained during weekdays. Ignoring these temporal effects
(increase in weekends) could lead to serious errors of overestimating ICT impacts on demand reduction,
and policy consequences (modification can be misinterpreted as substitution effects). Thus, the findings
suggest that obtaining longitudinal data and models to jointly capture the effects of ICT use on virtual
activity and physical travel patterns is important. Not only should the longitudinal data capture activity
participation across different activity types on a given day (see cross-substitution effects in Section 4.1),
but the trends over a longer time-frame that includes week-days and weekends also needs to be analyzed.
Socio-demographic effects
Age significantly affects in-home and out-of-home activity duration. Upper middle age and old
age individuals spend more time on out-of-home maintenance activities than younger and middle aged
individuals, supporting the hypothesis in Section 4.1 that older respondents prefer to participate in
physical rather than virtual activities.
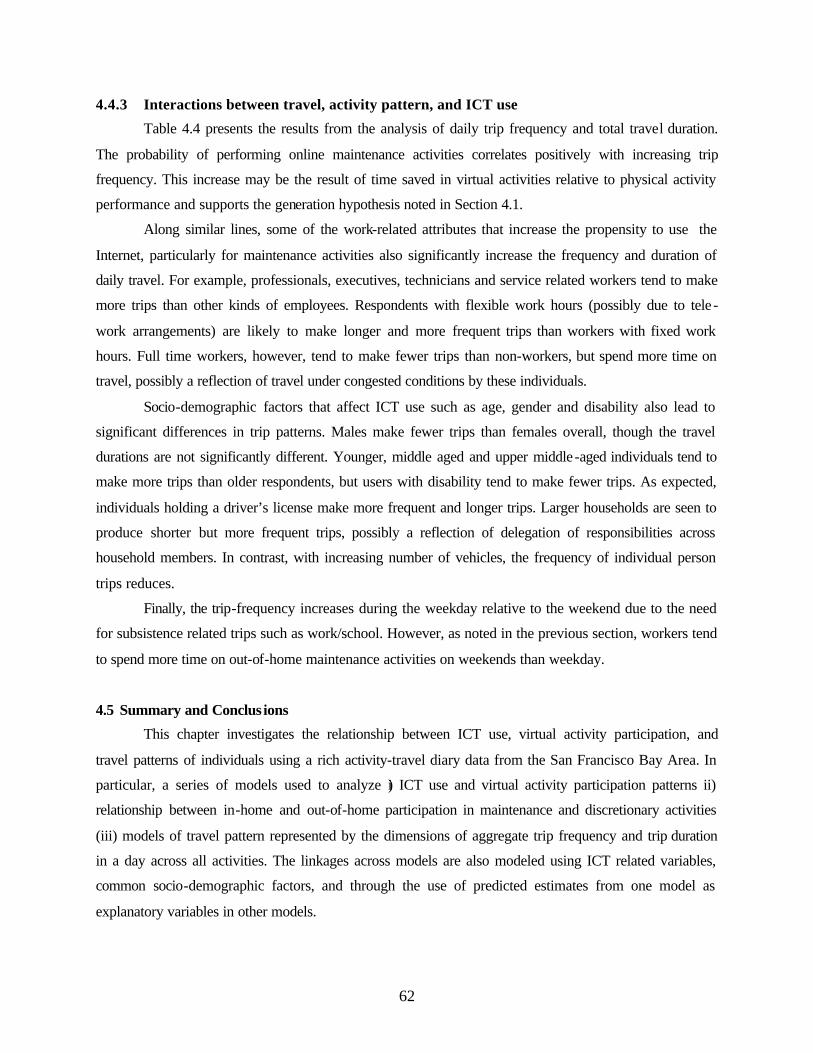
62
4.4.3 Interactions between travel, activity pattern, and ICT use
Table 4.4 presents the results from the analysis of daily trip frequency and total travel duration.
The probability of performing online maintenance activities correlates positively with increasing trip
frequency. This increase may be the result of time saved in virtual activities relative to physical activity
performance and supports the generation hypothesis noted in Section 4.1.
Along similar lines, some of the work-related attributes that increase the propensity to use the
Internet, particularly for maintenance activities also significantly increase the frequency and duration of
daily travel. For example, professionals, executives, technicians and service related workers tend to make
more trips than other kinds of employees. Respondents with flexible work hours (possibly due to tele -
work arrangements) are likely to make longer and more frequent trips than workers with fixed work
hours. Full time workers, however, tend to make fewer trips than non-workers, but spend more time on
travel, possibly a reflection of travel under congested conditions by these individuals.
Socio-demographic factors that affect ICT use such as age, gender and disability also lead to
significant differences in trip patterns. Males make fewer trips than females overall, though the travel
durations are not significantly different. Younger, middle aged and upper middle-aged individuals tend to
make more trips than older respondents, but users with disability tend to make fewer trips. As expected,
individuals holding a driver’s license make more frequent and longer trips. Larger households are seen to
produce shorter but more frequent trips, possibly a reflection of delegation of responsibilities across
household members. In contrast, with increasing number of vehicles, the frequency of individual person
trips reduces.
Finally, the trip-frequency increases during the weekday relative to the weekend due to the need
for subsistence related trips such as work/school. However, as noted in the previous section, workers tend
to spend more time on out-of-home maintenance activities on weekends than weekday.
4.5 Summary and Conclus ions
This chapter investigates the relationship between ICT use, virtual activity participation, and
travel patterns of individuals using a rich activity-travel diary data from the San Francisco Bay Area. In
particular, a series of models used to analyze i) ICT use and virtual activity participation patterns ii)
relationship between in-home and out-of-home participation in maintenance and discretionary activities
(iii) models of travel pattern represented by the dimensions of aggregate trip frequency and trip duration
in a day across all activities. The linkages across models are also modeled using ICT related variables,
common socio-demographic factors, and through the use of predicted estimates from one model as
explanatory variables in other models.
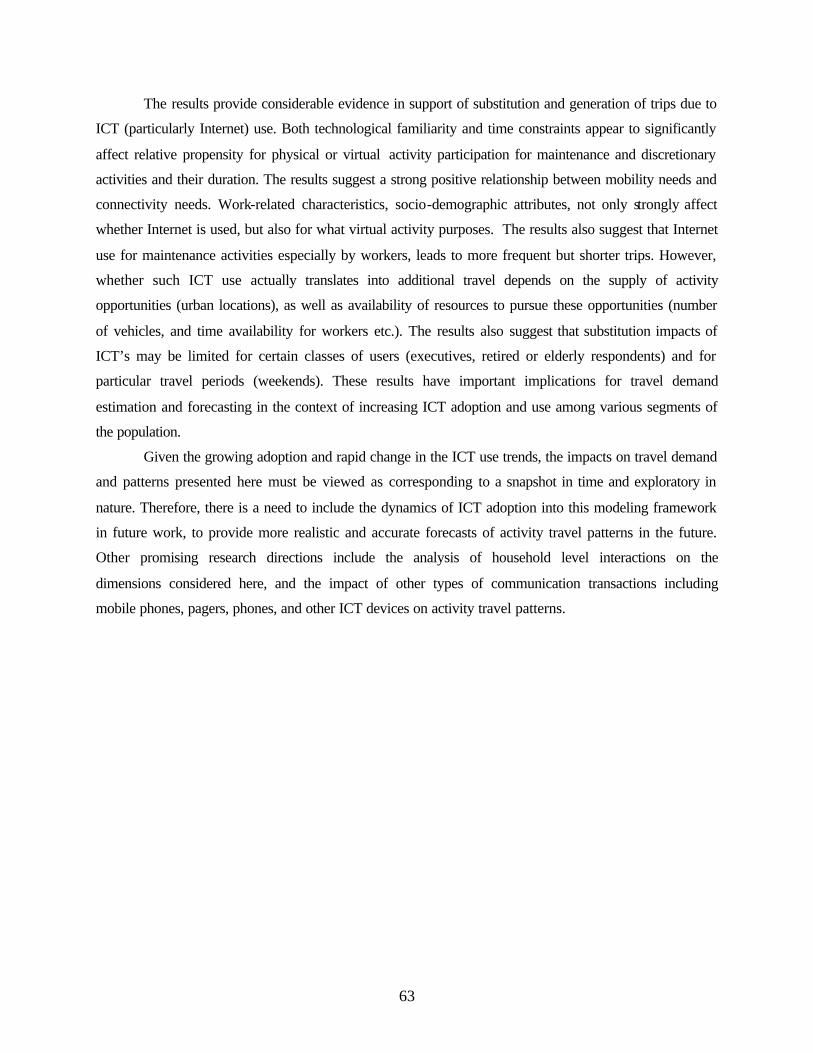
63
The results provide considerable evidence in support of substitution and generation of trips due to
ICT (particularly Internet) use. Both technological familiarity and time constraints appear to significantly
affect relative propensity for physical or virtual activity participation for maintenance and discretionary
activities and their duration. The results suggest a strong positive relationship between mobility needs and
connectivity needs. Work-related characteristics, socio-demographic attributes, not only strongly affect
whether Internet is used, but also for what virtual activity purposes. The results also suggest that Internet
use for maintenance activities especially by workers, leads to more frequent but shorter trips. However,
whether such ICT use actually translates into additional travel depends on the supply of activity
opportunities (urban locations), as well as availability of resources to pursue these opportunities (number
of vehicles, and time availability for workers etc.). The results also suggest that substitution impacts of
ICT’s may be limited for certain classes of users (executives, retired or elderly respondents) and for
particular travel periods (weekends). These results have important implications for travel demand
estimation and forecasting in the context of increasing ICT adoption and use among various segments of
the population.
Given the growing adoption and rapid change in the ICT use trends, the impacts on travel demand
and patterns presented here must be viewed as corresponding to a snapshot in time and exploratory in
nature. Therefore, there is a need to include the dynamics of ICT adoption into this modeling framework
in future work, to provide more realistic and accurate forecasts of activity travel patterns in the future.
Other promising research directions include the analysis of household level interactions on the
dimensions considered here, and the impact of other types of communication transactions including
mobile phones, pagers, phones, and other ICT devices on activity travel patterns.
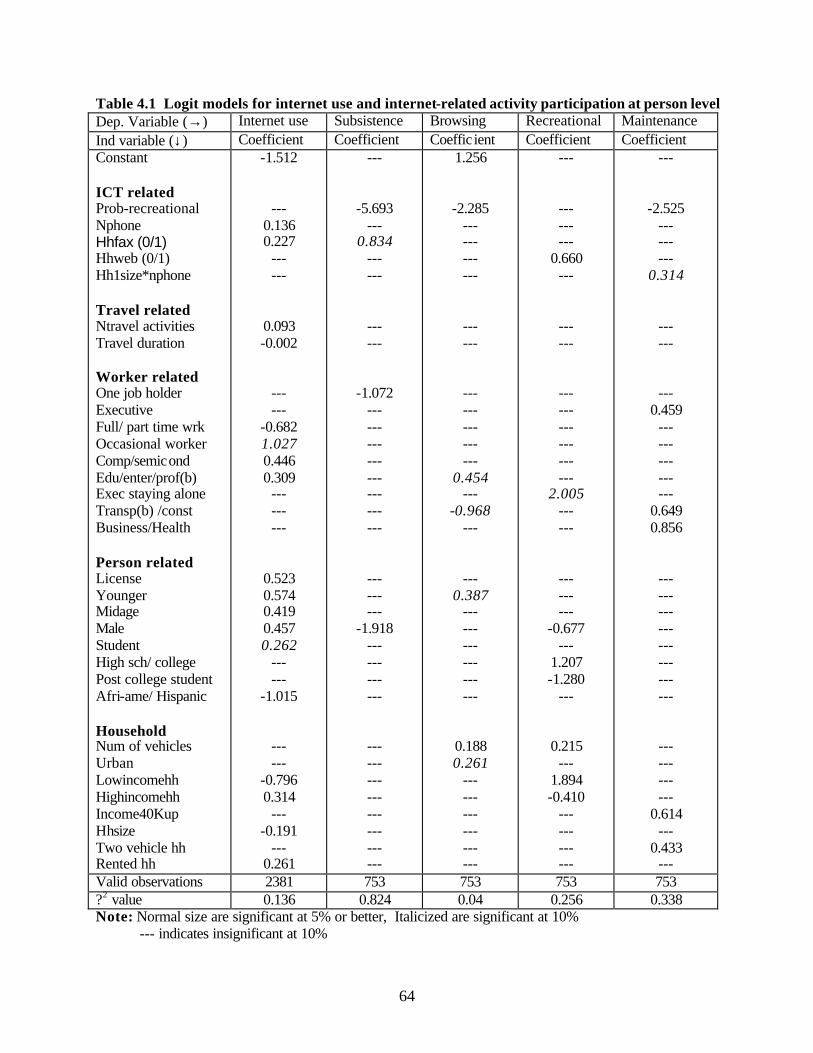
64
Table 4.1 Logit models for internet use and internet-related activity participation at person level Dep. Variable (→) Internet use Subsistence Browsing Recreational Maintenance Ind variable (↓) Coefficient Coefficient Coeffic ient Coefficient Coefficient Constant ICT related Prob-recreational Nphone Hhfax (0/1) Hhweb (0/1) Hh1size*nphone Travel related Ntravel activities Travel duration Worker related One job holder Executive Full/ part time wrk Occasional worker Comp/semicond Edu/enter/prof(b) Exec staying alone Transp(b) /const Business/Health Person related License Younger Midage Male Student High sch/ college Post college student Afri-ame/ Hispanic Household Num of vehicles Urban Lowincomehh Highincomehh Income40Kup Hhsize Two vehicle hh Rented hh
-1.512
--- 0.136
0.227 --- ---
0.093 -0.002
--- ---
-0.682 1.027
0.446 0.309
--- --- ---
0.523 0.574 0.419 0.457 0.262
--- ---
-1.015
--- ---
-0.796 0.314
--- -0.191
--- 0.261
---
-5.693 ---
0.834
--- ---
--- ---
-1.072
--- --- --- --- --- --- --- ---
--- --- ---
-1.918 --- --- --- ---
--- --- --- --- --- ---
--- ---
1.256
-2.285 ---
--- --- ---
--- ---
--- --- --- --- ---
0.454
--- -0.968
---
--- 0.387
--- --- --- --- --- ---
0.188
0.261 --- --- --- --- --- ---
---
--- --- ---
0.660 ---
--- ---
--- --- --- --- --- ---
2.005 --- ---
--- --- ---
-0.677 ---
1.207 -1.280
---
0.215
--- 1.894 -0.410
--- --- --- ---
---
-2.525 --- --- ---
0.314
--- ---
--- 0.459
--- --- --- --- ---
0.649 0.856
--- --- --- --- --- --- --- ---
--- --- --- ---
0.614
--- 0.433
--- Valid observations 2381 753 753 753 753 ?2 value 0.136 0.824 0.04 0.256 0.338 Note: Normal size are significant at 5% or better, Italicized are significant at 10% --- indicates insignificant at 10%
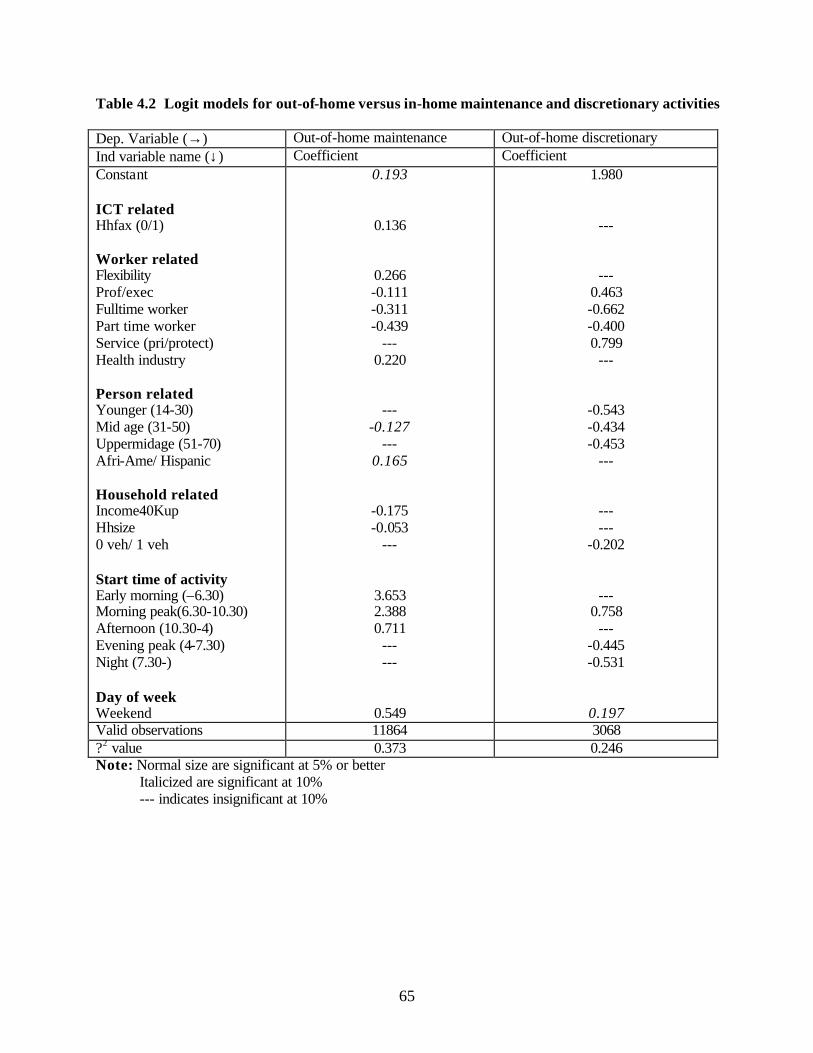
65
Table 4.2 Logit models for out-of-home versus in-home maintenance and discretionary activities Dep. Variable (→) Out-of-home maintenance Out-of-home discretionary Ind variable name (↓) Coefficient Coefficient Constant ICT related Hhfax (0/1) Worker related Flexibility Prof/exec Fulltime worker Part time worker Service (pri/protect) Health industry Person related Younger (14-30) Mid age (31-50) Uppermidage (51-70) Afri-Ame/ Hispanic Household related Income40Kup Hhsize 0 veh/ 1 veh Start time of activity Early morning (–6.30) Morning peak(6.30-10.30) Afternoon (10.30-4) Evening peak (4-7.30) Night (7.30-) Day of week Weekend
0.193
0.136
0.266 -0.111 -0.311 -0.439
--- 0.220
--- -0.127
--- 0.165
-0.175 -0.053
---
3.653 2.388 0.711
--- ---
0.549
1.980
---
--- 0.463 -0.662 -0.400 0.799
---
-0.543 -0.434 -0.453
---
--- ---
-0.202
--- 0.758
--- -0.445 -0.531
0.197 Valid observations 11864 3068 ?2 value 0.373 0.246 Note: Normal size are significant at 5% or better Italicized are significant at 10% --- indicates insignificant at 10%
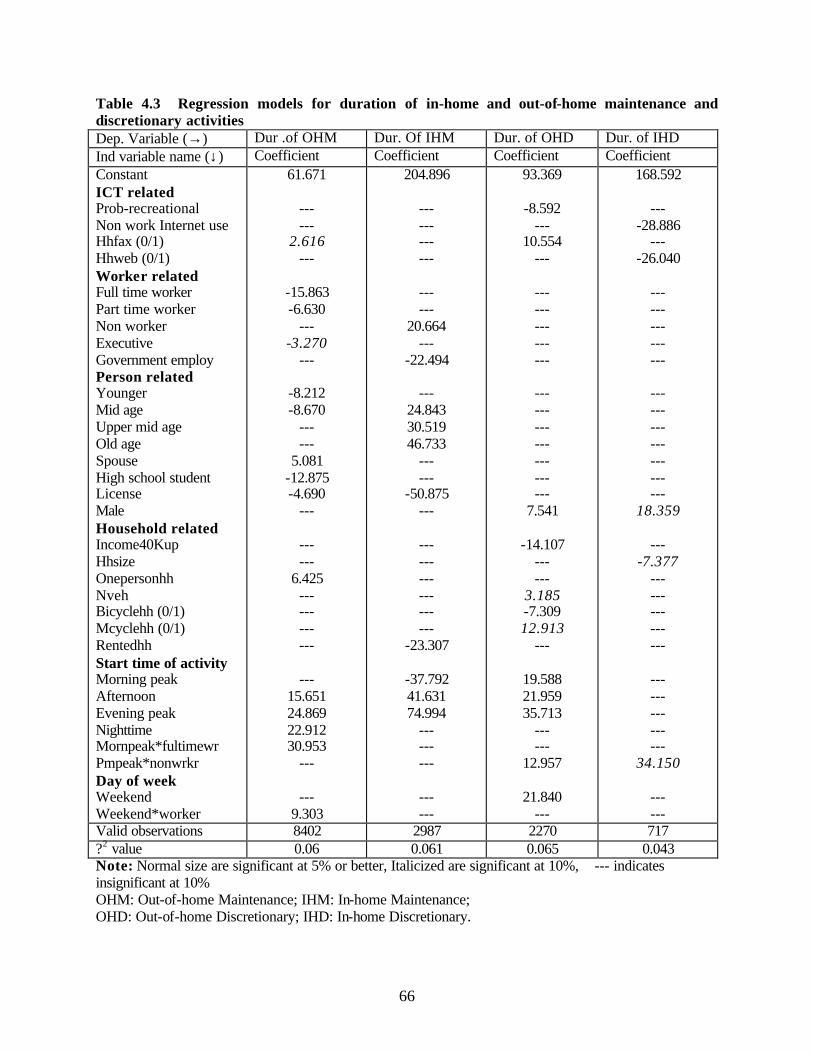
66
Table 4.3 Regression models for duration of in-home and out-of-home maintenance and discretionary activities Dep. Variable (→) Dur .of OHM Dur. Of IHM Dur. of OHD Dur. of IHD Ind variable name (↓) Coefficient Coefficient Coefficient Coefficient Constant ICT related Prob-recreational Non work Internet use Hhfax (0/1) Hhweb (0/1) Worker related Full time worker Part time worker Non worker Executive Government employ Person related Younger Mid age Upper mid age Old age Spouse High school student License Male Household related Income40Kup Hhsize Onepersonhh Nveh Bicyclehh (0/1) Mcyclehh (0/1) Rentedhh Start time of activity Morning peak Afternoon Evening peak Nighttime Mornpeak*fultimewr Pmpeak*nonwrkr Day of week Weekend Weekend*worker
61.671
--- ---
2.616
---
-15.863 -6.630
--- -3.270
---
-8.212 -8.670
---
--- 5.081
-12.875 -4.690
---
--- ---
6.425 ---
--- --- ---
---
15.651 24.869 22.912 30.953
---
--- 9.303
204.896
--- --- ---
---
--- ---
20.664 ---
-22.494
---
24.843 30.519 46.733
--- ---
-50.875 ---
--- --- --- ---
--- ---
-23.307
-37.792 41.631 74.994
--- --- ---
--- ---
93.369
-8.592
--- 10.554
---
--- --- --- --- ---
--- --- --- --- --- --- ---
7.541
-14.107 --- ---
3.185
-7.309 12.913
---
19.588 21.959 35.713
--- ---
12.957
21.840
---
168.592
--- -28.886
--- -26.040
---
--- --- --- ---
--- --- --- --- --- --- ---
18.359
---
-7.377
--- ---
--- ---
---
--- --- --- --- ---
34.150
--- ---
Valid observations 8402 2987 2270 717 ?2 value 0.06 0.061 0.065 0.043 Note: Normal size are significant at 5% or better, Italicized are significant at 10%, --- indicates insignificant at 10% OHM: Out-of-home Maintenance; IHM: In-home Maintenance; OHD: Out-of-home Discretionary; IHD: In-home Discretionary.
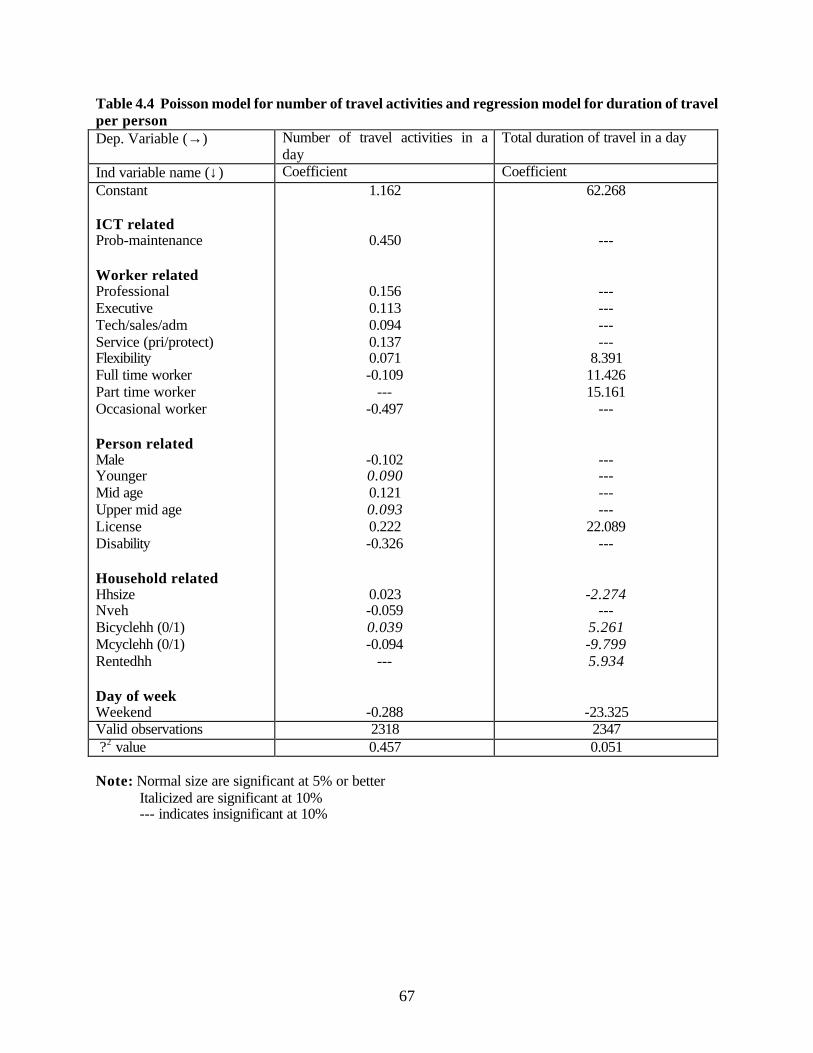
67
Table 4.4 Poisson model for number of travel activities and regression model for duration of travel per person Dep. Variable (→) Number of travel activities in a
day Total duration of travel in a day
Ind variable name (↓) Coefficient Coefficient Constant ICT related Prob-maintenance Worker related Professional Executive Tech/sales/adm Service (pri/protect) Flexibility Full time worker Part time worker Occasional worker Person related Male Younger Mid age Upper mid age License Disability Household related Hhsize Nveh Bicyclehh (0/1) Mcyclehh (0/1) Rentedhh Day of week Weekend
1.162
0.450
0.156 0.113 0.094 0.137 0.071 -0.109
--- -0.497
-0.102 0.090 0.121 0.093 0.222 -0.326
0.023 -0.059 0.039 -0.094
---
-0.288
62.268
---
--- --- --- ---
8.391 11.426 15.161
---
--- --- --- ---
22.089 ---
-2.274 ---
5.261 -9.799 5.934
-23.325 Valid observations 2318 2347 ?2 value 0.457 0.051 Note: Normal size are significant at 5% or better Italicized are significant at 10% --- indicates insignificant at 10%
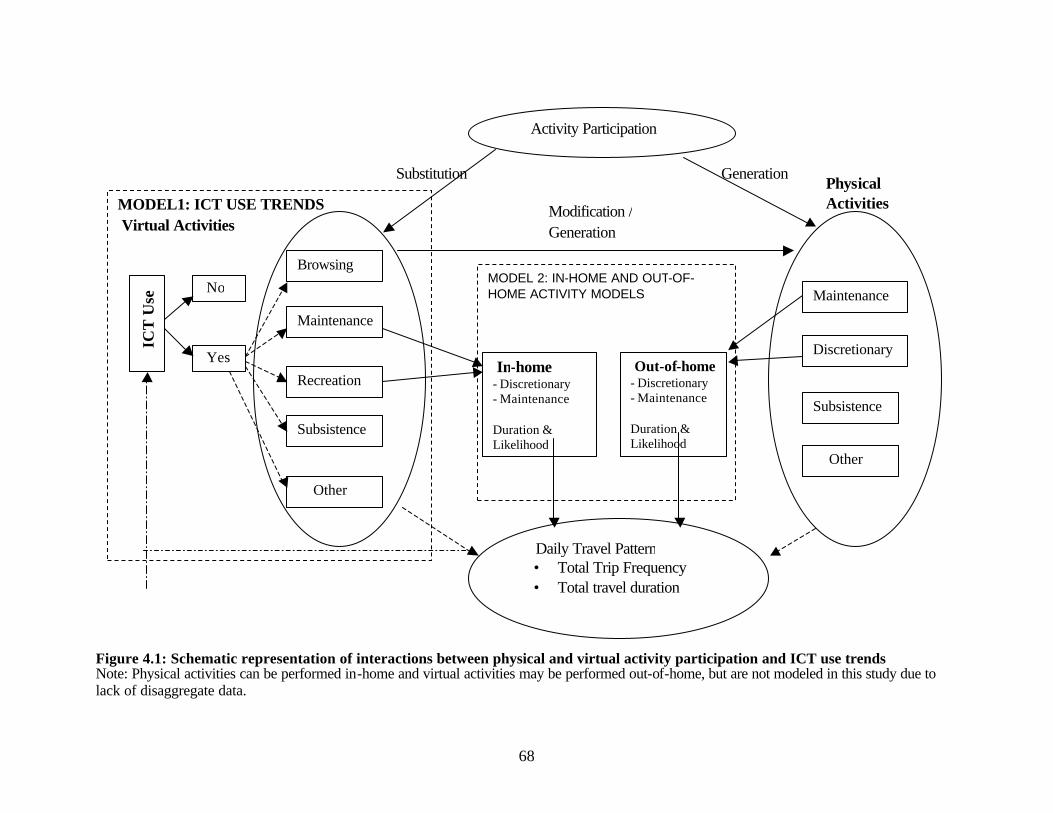
68
Figure 4.1: Schematic representation of interactions between physical and virtual activity participation and ICT use trends Note: Physical activities can be performed in-home and virtual activities may be performed out-of-home, but are not modeled in this study due to lack of disaggregate data.
Generation
Modification / Generation
Substitution Physical Activities MODEL1: ICT USE TRENDS
Virtual Activities
Activity Participation
Browsing
Maintenance
Recreation
Subsistence
Other
Maintenance
Discretionary
Subsistence
Other
Yes
No
I
CT
Use
MODEL 2: IN-HOME AND OUT-OF-HOME ACTIVITY MODELS
In-home - Discretionary - Maintenance Duration & Likelihood
Out-of-home- Discretionary - Maintenance Duration & Likelihood
Daily Travel Pattern • Total Trip Frequency • Total travel duration
69
CHAPTER V
CONCLUSIONS
5.1 Overview
This study investigated two activity-related decision dimensions: i) allocation of household
members to activities for discretionary and maintenance activities, and ii) the analysis of relationship
among Information Communication Technology (ICT) use, activity patterns and travel behavior at the
household level. These two tasks were achieved by performing activity episode analysis using San
Francisco Bay Area Travel Survey Data (1996 and 2000). In this process, the author developed and
estimated a series of econometric models, and performed extensive statistical analysis to achieve the
primary objectives of the study.
In the first task, this study investigates person allocation to activities by pursuing the following
research issues. In the first objective, household role, within-household differences, socio-demographic,
and trip attributes on activity allocation were explored. In this regard, the role of household structure and
life-cycle differences between household members, namely, the head of the household, spouse, children,
parent / in-law, and siblings were analyzed. The effect of prior activity performance history on the
probability of performing current activity was also considered as part of within household differences.
Furthermore, the influence of trip related attributes include origin and destination of travel activities,
mode, and trip-chaining characteristics on person allocation was also studied. Also, under this task, the
role of constraints on time, vehicle availability, cost, and coordination on activity allocation among
household members was examined. In addition, the influence of employment status, type of industry,
parking costs, and differences by time-of-day were assessed. Finally, in this task, the differences between
households in terms of the allocation of persons to activities were investigated. The between household
comparison revealed significant difference in person allocation based on the gender of head of the
households, number of vehicles, presence of children, vehicles per driver, income, and age differences of
a couple. In this process of investigating these objectives, a methodology was developed to model person
allocation to activities that partially addresses the shortcomings of existing models.
The second major task in this study was to explore the linkages between ICT use, travel, and
activity patterns of households. This analysis pursued the following three research objectives by
developing a series of statistical models. The first objective under the second task was to analyze the ICT
use patterns of users particularly, the dimensions of whether or not internet was used, and the purpose for
which it was used (subsistence, browsing, maintenance, and recreational). The explanatory factors
influencing these decisions were analyzed. The second objective in this task explored the linkages

70
between ICT use and physical/virtual activity participation for discretionary and maintenance activities.
Toward this end, the propensity to participate in out-of-home maintenance and discretionary activities,
and durations of out-of-home and in-home maintenance and discretionary activities were analyzed by
studying the role of person, household and activity attributes. In the third objective, this study also
investigated the linkages between observed daily travel patterns (represented by the dimensions of trip
frequency and trip duration), ICT use and individual’s activity attributes. In particular, the relationship
between virtual activity participation, physical activity participation, internet use patterns, and observed
travel dimensions were analyzed. The salient findings from the two sets of tasks are discussed in the
following section.
5.2 Salient findings and their significance
5.2.1 Person allocation patterns
The salient findings based on the person allocation models are presented below:
• The results provide significant evidence of the effect of life-cycle and household role on person
allocation to activities. The head of the household is generally more likely to participate in both
maintenance and discretionary activities than the spouse of the head of the household.
• With an increase in number of household members who are employed, participation in joint
activities decreases significantly for maintenance and discretionary activities.
• As the fraction of female workers in the household increases, joint participation in discretionary
activities decreases, due to the added work-related time constraints on both male and female
workers in the household.
• It was observed that females are more likely to participate in shorter duration trips than males,
suggesting that the destinations for maintenance activities are likely to be closer to anchor points
(home or work) for females than males.
• In terms of cost, the presence of parking charges inhibited the participation of individuals
employed in the financial, educational, and health care sectors in maintenance activities. Several
other findings are also presented that highlight the role of time constraints on activity
participation.
Location and proximity factors from home and work-place also appear to influence person
allocation. For instance, full-time workers are less likely to be selected for home-based maintenance trips,
suggesting that a significant number of maintenance activities are performed en-route to and from work
locations whereas, non-workers are more likely to participate in home-based tours. Given the time
constrained nature of the former trips (due to institutional and work timings), these differences have
71
significant implications for mobility levels (measured by VMT), duration of activity and travel episodes,
and the evaluation of transportation planning policies.
The results indicate that individuals with a greater level of participation in prior maintenance
(discretionary) activities are more likely to be chosen to participate in current discretionary (maintenance)
activities. This dynamic influence may be the result of greater access to household vehicles (especially if
number of vehicles is limited), and/or greater intrinsic trip-making or activity participation propensity of
the selected individuals in the household.
Interesting differences in activity allocation were observed across different income groups. In
households with higher income, the maintenance allocation between head and spouse is more equitable
(hhh = 44%, and spouse = 36%). In contrast, in households with lower income the head of the household
plays a primary role in maintenance activities (49%, spouse=26%). These differences may be attributable
to the greater availability of disposable income and vehicles in higher income household, and possibly
greater value of travel time for the head of the household in these cases.
The solo participation of other individuals is also high in households with school going children
(6-15), with 24% (nearly a fourth of household activities) in discretionary activities and around 10% for
maintenance activities. Thus, modeling activities and trips by these individuals is essential (not just the
head of the household and spouse) at least for selected segments of the population, possibly due to the
non-motorized nature of such trips, and significant contribution to household trip-making.
5.2.2 ICT use patterns
The main conclusion from these diverse threads of related results is that the relationship between
telecommunications and transportation is multi-directional and multi-dimensional in nature. There is
strong evidence to support each of the hypothesized interactions of ICT use, activity pattern, and travel
behavior: substitution, generation and modification.
The following salient findings are noteworthy and distinct from prior research on ICT use:
• The data suggests considerable heterogeneity across user groups in terms of the degree of
substitution between ICT use and physical activities. Executives are more likely to perform maintenance
activities online (compared to physical activities) and spend less time on out-of-home maintenance
activities. Males are less likely to perform recreational activities online, but spend more time on out-of-
home discretionary activities than females.
• Internet use can generate increased travel frequency, but may result in reduced travel duration. In
this regard, internet use is correlated positively with larger trip frequency but shorter travel durations.
72
• ICT use can also lead to substitution across virtual activities, in addition to substitution between
physical and virtual activities. For instance, individuals using Internet for recreational activities are less
likely to perform subsistence, maintenance and browsing activities online.
• Not only are there trade-offs between physical and virtual activities in a given day, but there could
also be trade-offs between physical and virtual activities over days (weekdays and weekends).
The findings from this study have the following important policy and data analysis implications:
Flexible work arrangements, made possible through ICT use, can lead to increased demand for
mobility and travel (more out-of-home maintenance activities, longer and more frequent trips are seen),
which may reduce if not negate the positive impacts of work-trip reduction. Unless the additional trips are
staggered away from peak periods and flexible work arrangements are carefully designed, congestion and
air-quality may actually become worse due to the increased demand.
Time constraints and familiarity with newer technologies tend to increase ICT use and virtual
activity participation (workers, professionals etc.). However, the extent of travel demand reduction from
such virtual activity participation may at least be partially offset by increased travel during weekends by
these respondents. These results underscore the need for data and analyses on linkages between ICT use,
physical and virtual activity participation, and travel on a given day, but also across days of the week.
ICT use can promote more frequent yet more efficient trips (more frequency-higher internet
usage, more duration-lesser internet usage). This result suggests that the impact of ICT may not be
uniformly beneficial from a travel demand management (TDM) standpoint. On the one hand, ICT use
may reduce congestion (due to more efficient trips). However, travel pattern changes due to ICT use can
also make air-quality worse in some cases due to induced and additional trips. The positive correlation
between connectivity and mobility also indicates the potential for aggravation of urban congestion and
air-quality problems with increasing connectivity and growing adoption of ICT systems. The strong
interactions between mobility and connectivity suggest the need to account for the trip-generative
influence of connectivity explicitly, in addition to the current focus on activity demand.
Promoting ICT use and virtual activity propensity may lead to travel demand reduction, but only
among certain classes of users and trip purposes (for instance, males in the context of recreational
activities, and low income households etc.). Thus, to successfully achieve travel demand reduction
through increased ICT use, tailoring these programs to users with both considerable amount of travel
activities and time constraints is essential. Though time constraints appear to encourage virtual
participation, the tangible substitution effects of such virtual activities may be less than anticipated.
73
5.3 Directions for future research
The proposed person allocation models can be further enhanced to investigate the following
research directions in the future:
3) the use of more sophisticated error-structure to capture various sources of correlations (for e.g.
within-person, within-household etc.)
4) variables that explicitly account for the time-varying nature of household vehicle allocation
decisions and vehicle availability on person allocation decisions.
5) analysis of individuals who participated in joint trips, whereas, the current study only focuses on
whether or not a given activity episode involved joint participation. Specifically, the household
members participating in the joint episode are not considered here.
6) this study mainly focuses on person allocation given the generation of discretionary and
maintenance activities. The joint analysis of generation and allocation is a promising and
computationally more intensive direction for future research.
Given the growing adoption and rapid change in the ICT use trends, the impacts on travel demand
and patterns presented here must be viewed as corresponding to a snapshot in time and exploratory in
nature. Therefore, there is a need to include the dynamics of ICT adoption into this modeling framework
in future work, to provide more realistic and accurate forecasts of activity travel patterns in the future.
Other promising research directions include the analysis of household level interactions on the
dimensions considered here, and the impact of other types of communication transactions including
mobile phones, pagers, phones etc on activity travel patterns. In this study, an implicit assumption is that
the virtual activity participation takes place at home. However, in the more general case, the modeling
framework above could be expanded by including additional choice dimensions that distinguish between
in-home and out-of-home virtual activities. Similarly, this study does not differentiate between physical
and virtual activity participation for in-home activities due to data availability issues. Therefore, the
findings from this study need to be validated from other studies when further disaggregate data on virtual
activity participation location (in-home or out-of-home) and type of in-home activities (physical or
virtual) become available.
74
REFERENCES
1. Axhausen K. and Gärling T. 1992. Activity-based approaches to travel analysis: Conceptual frameworks, models and research problems. Transport Reviews, 12, 323-341.
2. Balasubramaniam C. and Goulias K. 1999. Exploratory Longitudinal analysis of solo and joint
tripmaking. Paper presented at the 78th annual conference of the Transportation Research Board, Washington, D.C.
3. Bhat C. R. 1997. Work travel mode choice and number of non-work commute stops.
Transportation Research B. 4. Bhat C. R., Guo J. Y., Srinivasan S., and Sivakumar A. 2004. A comprehensive econometric
micro-simulator for daily activity travel patterns. Paper presented at the 83rd annual conference of the Transportation Research Board, Washington, D.C.
5. Bhat, C.R. and F.S. Koppelman. (1999) Activity-Based Modeling of Travel Demand. The
Handbook of Transportation Science, edited by R.W. Hall, Kluwer Academic Publishers, Norwell, Massachusetts, pp. 35-61.
6. Bhat C. R., and Lockwood A. 2004. On distinguishing between physically active and physically
passive episodes and between travel and activity episodes: An analysis of weekend recreational participation in the San Francisco Bay Area. Paper presented at the 83rd annual conference of the Transportation Research Board, Washington, D.C.
7. Bhat, C. R., Sivakumar, A., and Axhausen, K. W. 2003. An Analysis of the Impact of Information
and Communication Technologies on non-maintenance shopping activities. Transportation Research Part B: Methodological, Available online 1 April 2003.
8. Bhat C. R., and Srinivasan S. 2004. Modeling the generation and allocation of shopping activities in
a household. Paper presented at the 83rd annual conference of the Transportation Research Board, Washington, D.C.
9. Bhat C. R., and Srinivasan S. 2004. A multi-dimensional mixed ordered response model for
analyzing weekend activity participation accommodating demographic, internet use, residential location, and day-of-week/season effects. Paper presented at the 83rd annual conference of the Transportation Research Board, Washington, D.C.
10. Bhat C. R., Srinivasan S., and Axhausen K. W. 2004. An analysis of multiple interactivity durations
using a unifying multivariate hazard model. Paper presented at the 83rd annual conference of the Transportation Research Board, Washington, D.C.
11. Bhat C.R. and J.L.Steed (2000) A Continuous-Time Model of Departure Time Choice for Urban
Shopping Trips. Transportation Research B, 36, pp. 207-224. 12. Bowman J. L., and Ben-Akiva M. 1996. Activity-based travel forecasting. In: Activity-based travel
forecasting conference proceedings. (Ed: Engelke, L. J.), Texas Transportation Institute, College Station, Texas.
75
13. Casas, J., Zmud, J., and Bricka, S. 2001. Impact of shopping via Internet on travel for shopping purposes. Paper presented at the 80th annual conference of the Transportation Research Board, Washington, D.C.
14. Claisse G. and Rowe F. 1993. Domestic telephone habits and daily mobility. Transportation
Research part A, Vol. 27A, No.4, pp. 277-290. 15. Farag, S., Dijst, M., and Lanzendorf, M. 2003. Exploring the use of E-Shopping and its impact on
personal travel behavior in the Netherlands. Paper presented at the 82nd annual conference of the Transportation Research Board, Washington, D.C.
16. Fujii S., Kitamura R. and Kishizawa K. 1999. An analysis of individual’s joint activity engagement
using a model system of activity-travel behavior and time use. Paper presented at the 78th annual conference of the Transportation Research Board, Washington, D.C.
17. Garling T., Kwan M. P., and Golledge R.G. 1994. Computational-process modelling of household
travel decisions: Conceptual analysis and review. Transportation Research B, 28(5), 355-364. 18. Gliebe, J. P., and Koppelman F. S. 2001. A model of joint activity participation. Paper presented at
the 80th annual conference of the Transportation Research Board, Washington, D.C. 19. Golob T. F. and McNally M. G. 1997. A model of activity participation and travel interactions
between the household heads. Transportation Research Part B, 31, 3, pp. 177-194. 20. Golob, T. F., and Regan, A. C. 2001. Impacts of Information Technology on personal travel and
commercial vehicle operations: Research challenges and opportunities. Transportation Research Part C 9, 87-121.
21. Goulias K. G. 1996. Activity-based travel forecasting: What are some issues? In: Activity-based
travel forecasting conference proceedings. (Ed: Engelke, L. J.), Texas Transportation Institute, College Station, Texas.
22. Goulias K. G. and Kim T. G. 2001. A multilevel analysis of activity and travel patterns accounting
for person-specific and household-specific observed and unobserved effects simultaneously. Paper presented at the 80th annual conference of the Transportation Research Board, Washington, D.C.
23. Hagerstrand T. 1970. What about people in regional science? Papers in Regional Science, 24, 7-21. 24. Handy, S. L., and Yantis, T. 1997. The impacts of telecommunications technologies on non work
travel behavior. Southwest Region University Transportation Center, Center for Transportation Research, Austin, TX. SWUTC/97/721927-1.
25. Hensher, D. A., Milthorpe, F. W. 1987. Selectivity Correction in Discrete-Continuous Choice
Analysis - with Empirical Evidence for Vehicle Choice and Use Regional Science and Urban Economics. 123-150.
26. Hjorthol, R. J., 2002. The relation between daily travel and use of the home computer.
Transportation Research Part A 36, 437-452.
76
27. Jones P., Koppelman F., and Orfeuil, J.P. 1990. Activity analysis: state-of-the-art and future directions. In: Developments in Dynamic and Activity-Based Approaches to Travel. (Ed: Jones, P.) Avebury, Aldershot, 34-55.
28. Kasturirangan K., Pendyala R. M., and Koppelman F. S. 2002. On the role of history in modeling
activity type choice and activity duration for commuters. Paper presented at the 81st annual conference of the Transportation Research Board, Washington, D.C.
29. Kilpala, H. K., Seneviratne, P. N., and Pekkarinen, S. M. 2001. Electronic Grocery shopping and its
impact on Transportation & Logistics with special reference to Finland. Paper presented at the 80th annual conference of the Transportation Research Board, Washington, D.C.
30. Kitamura R. 1996. Applications of models of activity behavior for activity based demand
forecasting. In: Activity-based travel forecasting conference proceedings. (Ed: Engelke, L. J.), Texas Transportation Institute, College Station, Texas.
31. Krizek, K. J., and Johnson, A. 2003. Mapping the terrain of information and communications
technology (ICT) and household travel. Paper presented at the 82nd annual conference of the Transportation Research Board, Washington, D.C.
32. Kurani K. S., and Lee-Gosselin M. E. H. 1996. Synthesis of past activity analysis applications. In:
Activity-based travel forecasting conference proceedings. (Ed: Engelke, L. J.), Texas Transportation Institute, College Station, Texas.
33. Lenz B., Luley T., and Bitzer W. 2003. Will electronic commerce help to reduce traffic in
agglomeration areas? Paper presented at the 82nd annual conference of the Transportation Research Board, Washington, D.C.
34. Metropolitan Transportation Commission, http://www.mtc.ca.gov/datamart/ data source for BATS-
2000, Accessed in July 2004. 35. Miller E. J. and Roorda M. J. 2003. A prototype model of household activity/ travel scheduling.
Paper presented at the 82nd annual conference of the Transportation Research Board, Washington, D.C.
36. Misra R., Bhat C. R., and Srinivasan S. 2003. A continuous time representation and modeling
framework for the analysis of non-worker activity-travel patterns: Tour and episode attributes. Paper presented at the 82nd annual conference of the Transportation Research Board, Washington, D.C.
37. Mokhtarian P. L, 1990. A typology of relationships between telecommunications and
transportation. Transportation Research Part A, Vol. 24A, No. 3, PP231-242. 38. Mokhtarian, P. L. and Meenakshisundaram, R. 1999. Beyond tele -substitution: disaggregate
longitudinal structural equations modeling of communication impacts. Transportation Research Part C 7, 33-52.
39. Mokhtarian, P. L. and Salomon, I. 1997. Modeling the desire to telecommute: The importance of
attitudinal factors in behavioral models. Transportation Research Part A 31, No.1, 35-50.
77
40. Oi, W.Y, and Shuldiner, P.W. 1962. An Analysis of Urban Travel Demands. Northwestern University Press, Evanston, IL.
41. Pas E. I. 1996. Recent advances in activity-based travel demand modeling. In: Activity-based travel
forecasting conference proceedings. (Ed: Engelke, L. J.), Texas Transportation Institute, College Station, Texas.
42. Pendyala R. and Pas E. I. 1996. Models of activity engagement and travel behavior. In: Activity-
based travel forecasting conference proceedings. (Ed: Engelke, L. J.), Texas Transportation Institute, College Station, Texas.
43. Pendyala R. M., Yamamoto T. and Kitamura R., 2002. On the formulation of time-space prisms to
model constraints on personal activity-travel engagement. Transportation. Vol.29, pp 73-94. 44. Recker, W.W. (1995). The household activity pattern problem: General formulation and solution.
Transportation Research B, 29(1), 61-77. 45. Recker, W.W.; McNally, M.G.; Root, G.S. (1986a). A model of complex travel behavior: Part I:
Theoretical development. Transportation Research A, 20 (4), 307-318. 46. Recker, W.W.; McNally, M.G.; Root, G.S. (1986b). A model of complex travel behavior: Part II:
An operational model. Transportation Research A, 20(4), 319-330. 47. Revelt D. and Train K. 1998. Mixed Logit with Repeated Choices: Households’ Choice of
Appliance Efficiency Level, Review of Economics and Statistics, Vol. LXXX, No. 4, 647-657. 48. Salomon I. 1986. Telecommunications and travel relationships: A review. Transportation Research
Part A. Vol. 20A, No. 3, pp. 223-238. 49. Scott, D.M. and P.S. Kanorglou. (2002) An Activity-Episode Generation Model that Captures
Interactions Between Household Heads: Development and Empirical Analysis. Transportation Research Part B, 36, pp. 875-896.
50. Selvanathan E. A. and Selvananthan S. 1994. The demand for transport and communication in the
United Kingdom and Australia. Transportation Research Part B. Vol. 28B, No. 1, pp. 1-9. 51. Senbil, M., and Kitamura, R. 2003. The use of telecommunications devices and individual activities
relationships. Paper presented at the 82nd annual conference of the Transportation Research Board, Washington, D.C.
52. Simma, A. and Axhausen, K. W. 2001. Within household allocation of travel: the case of upper
Austria. Paper presented at the 80th annual conference of the Transportation Research Board, Washington, D.C.
53. Srinivasan K. K. and Athuru S. R. 2004. Modeling the interaction between internet communication
and travel activities – Evidence from Bay Area Travel Survey-2000. Paper presented at the 83rd annual conference of the Transportation Research Board, Washington, D.C. Accepted for publication in the journal of Transportation Research Board.

78
54. Steed, J.L. and C.R.Bhat (2000a) Modeling Departure Time Choice for Home-Based Non-Work Trips. Research Report SWUTC/00/167500-1. http://swutc.tamu.edu/Reports/167500-1.pdf. Accessed on October 27th, 2003
55. Steed, J.L. and C.R.Bhat (2000b) On Modeling Departure-Time Choice for Home-Based
Social/Recreational and Shopping Trips. Transportation Research Record, 1706, pp. 152-159. 56. Stopher P. R. and Metcalfe H. M. A. 1999. Household activities, lifecycle, and role allocation:
Tests on datasets from Boston and Salt Lake City. Paper presented at the 78th annual conference of the Transportation Research Board, Washington, D.C.
57. Townsend T.A. 1987. The Effects of Household Characteristics on the Multi-day Time Allocations
and Travel Activity Patterns of Households and Their Members. Unpublished Ph.D. Dissertation, Northwestern University, Evanston, IL.
58. Vaughn K., 2003. Bay Area Travel Survey 2000: Summary of a regional household survey project.
Paper presented at the 82nd annual conference of the Transportation Research Board, Washington, D.C.
59. Viswanathan, K., and Goulias, K.G. 2001. Travel behavior implications of information and
communications technologies (ICT) in the Puget Sound Region. Paper presented at the 80th annual conference of the Transportation Research Board, Washington, D.C.
60. Vovsha P., Peterson E., Donnelly R. 2003. Explicit modeling of joint travel by household members:
Statistical evidence and applied approach. Paper presented at the 82nd annual conference of the Transportation Research Board, Washington, D.C.
61. Vovsha P., Peterson E., Donnelly R. 2004. A model for allocation of maintenance activities to the
household members. Paper presented at the 83rd annual conference of the Transportation Research Board, Washington, D.C.
62. Vovsha P., Peterson E., Donnelly R. 2004. Impact of intra-household interaction on individual daily
activity-travel patterns. Paper presented at the 83rd annual conference of the Transportation Research Board, Washington, D.C.
63. Wells, K., Douma, F., Olson, L., Loimer, H., and Pansing, C. 2001. Telecommuting Implications
for Travel Behavior: Case Studies from Minnosota. Paper presented at the 80th annual conference of the Transportation Research Board, Washington, D.C.