Embed Size (px)
Citation preview
Next Generation Demand Response
Business Modeling Workshop
November 2014
Presenter:
David Dobratz, P.E., CEM
Supervisor, Direct Install & Load Response
Connecticut Light and Power / Northeast Utilities
Co- Presenter:
Ryn Hamilton
Ryn Hamilton Consulting
Introduction
2
Regulation – Federal and State Policy/Regulation
Maturation – Maturing Role of Demand Response
Other – Advances in computing, control and communications; Standards (e.g., OpenADR)
Premise – Provides premise for business model dynamics
Steps – Defines the basic steps of the value creation chain
Market – Makes an assessment of market climate and Identifies key market entities
Roles – Identifies role and position of market entities
Technology & Monitoring – Load Duration Monitoring, Monitoring Intelligence, Enabled Equipment
Teams – Break into teams, each representing a market entity
Exercise – Teams will be given a profile for the entity they are representing (business objectives and a variety
of business model options and strategies, to use in the exercise)
Presentations – Resulting business models will be briefly presented to the workshop participants as a whole
and correlated on a summarization matrix
Summarize – Aggregate findings will be discussed.
Market Climate
Building the Business Case
Business Modeling Exercises
ISO-NE interprets Order 745* to include excessive penalties on DR for under performance.
May 2014 the D.C. Circuit Court stunned observers by overturning FERC’s foundational Order 745.
Stakeholders petition court unsuccessfully. FERC and Justice Dept. have until December 16, 2014 to file an
appeal.
ISO-NE gives guidance that if the overturning of Order 745 is up held, ISO-NE will discontinue Demand
Response from its market design.
*Order 745 was so significant because it created a level playing field with generation by guaranteeing compensation based on the
market clearing locational marginal price that generators receive.
FERC recognized broader definition of Demand Response to include ancillary services which address grid
contingencies and short term imbalances in energy markets.
DR 3.0’ and smart grid introduce 2-way communications and intelligent load management to the
distribution network.
Demand Response Provider achieves recoverable asset status for specialized service
PJM has proposed a novel approach to assure a continued role for Demand Response
Market Climate
3
4
Demand Response Disruption - Order 745 Overturned
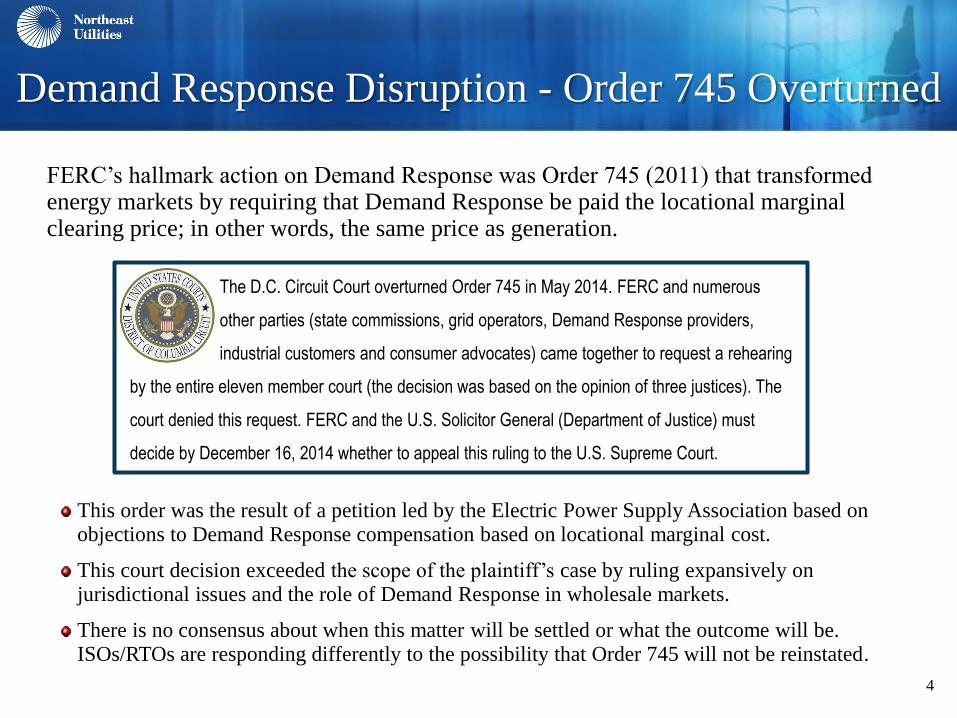
This order was the result of a petition led by the Electric Power Supply Association based on objections to Demand Response compensation based on locational marginal cost.
This court decision exceeded the scope of the plaintiff’s case by ruling expansively on jurisdictional issues and the role of Demand Response in wholesale markets.
There is no consensus about when this matter will be settled or what the outcome will be. ISOs/RTOs are responding differently to the possibility that Order 745 will not be reinstated.
FERC’s hallmark action on Demand Response was Order 745 (2011) that transformed energy markets by requiring that Demand Response be paid the locational marginal clearing price; in other words, the same price as generation.
The D.C. Circuit Court overturned Order 745 in May 2014. FERC and numerous
other parties (state commissions, grid operators, Demand Response providers,
industrial customers and consumer advocates) came together to request a rehearing
by the entire eleven member court (the decision was based on the opinion of three justices). The
court denied this request. FERC and the U.S. Solicitor General (Department of Justice) must
decide by December 16, 2014 whether to appeal this ruling to the U.S. Supreme Court.
5
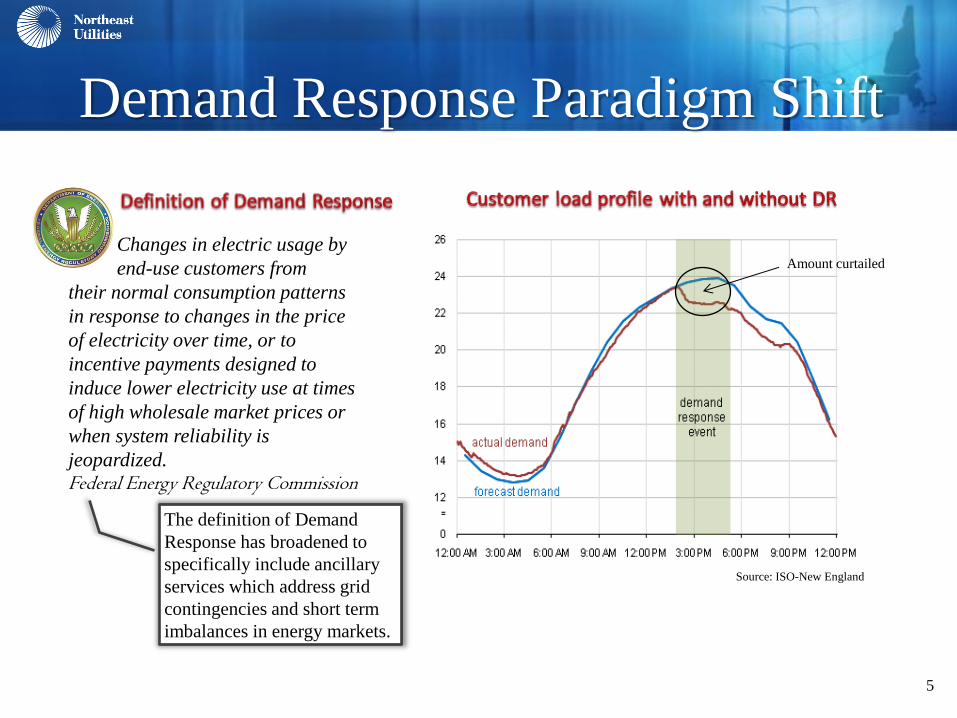
Demand Response Paradigm Shift
The definition of Demand
Response has broadened to
specifically include ancillary
services which address grid
contingencies and short term
imbalances in energy markets..
Changes in electric usage by
end-use customers from
their normal consumption patterns
in response to changes in the price
of electricity over time, or to
incentive payments designed to
induce lower electricity use at times
of high wholesale market prices or
when system reliability is
jeopardized. Federal Energy Regulatory Commission
Source: ISO-New England
Amount curtailed
6
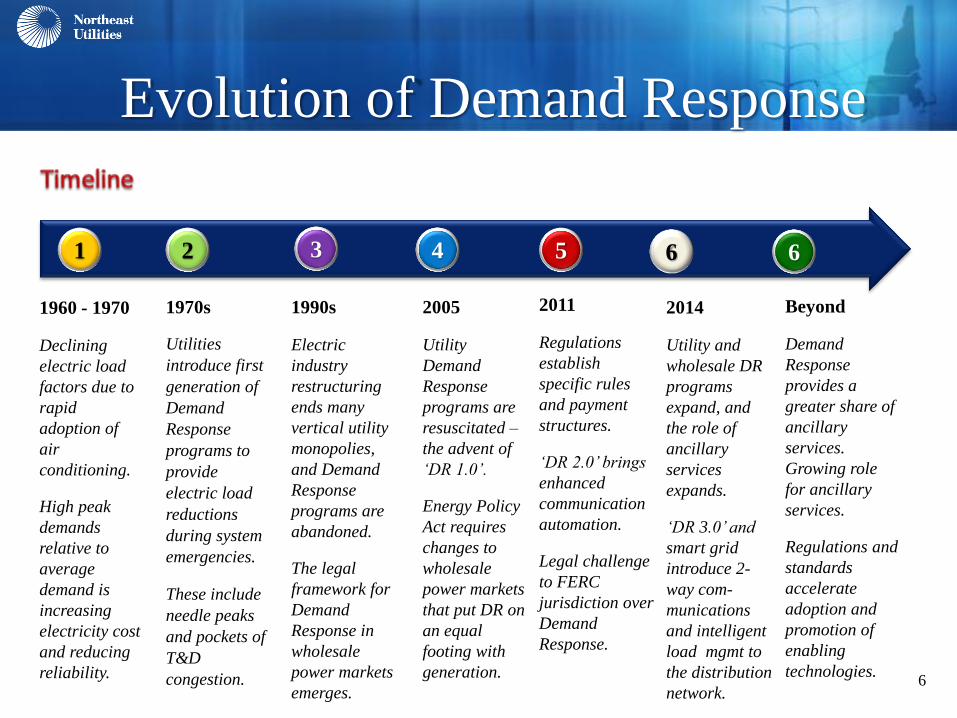
Evolution of Demand Response
1 2 4 5
1960 - 1970
Declining
electric load
factors due to
rapid
adoption of
air
conditioning.
High peak
demands
relative to
average
demand is
increasing
electricity cost
and reducing
reliability.
1970s
Utilities
introduce first
generation of
Demand
Response
programs to
provide
electric load
reductions
during system
emergencies.
These include
needle peaks
and pockets of
T&D
congestion.
1990s
Electric
industry
restructuring
ends many
vertical utility
monopolies,
and Demand
Response
programs are
abandoned.
The legal
framework for
Demand
Response in
wholesale
power markets
emerges.
2005
Utility
Demand
Response
programs are
resuscitated –
the advent of
‘DR 1.0’.
Energy Policy
Act requires
changes to
wholesale
power markets
that put DR on
an equal
footing with
generation.
2011
Regulations
establish
specific rules
and payment
structures.
‘DR 2.0’ brings
enhanced
communication
automation.
Legal challenge
to FERC
jurisdiction over
Demand
Response.
6
2014
Utility and
wholesale DR
programs
expand, and
the role of
ancillary
services
expands.
‘DR 3.0’ and
smart grid
introduce 2-
way com-
munications
and intelligent
load mgmt to
the distribution
network.
Beyond
Demand
Response
provides a
greater share of
ancillary
services.
Growing role
for ancillary
services.
Regulations and
standards
accelerate
adoption and
promotion of
enabling
technologies.
6 3
7
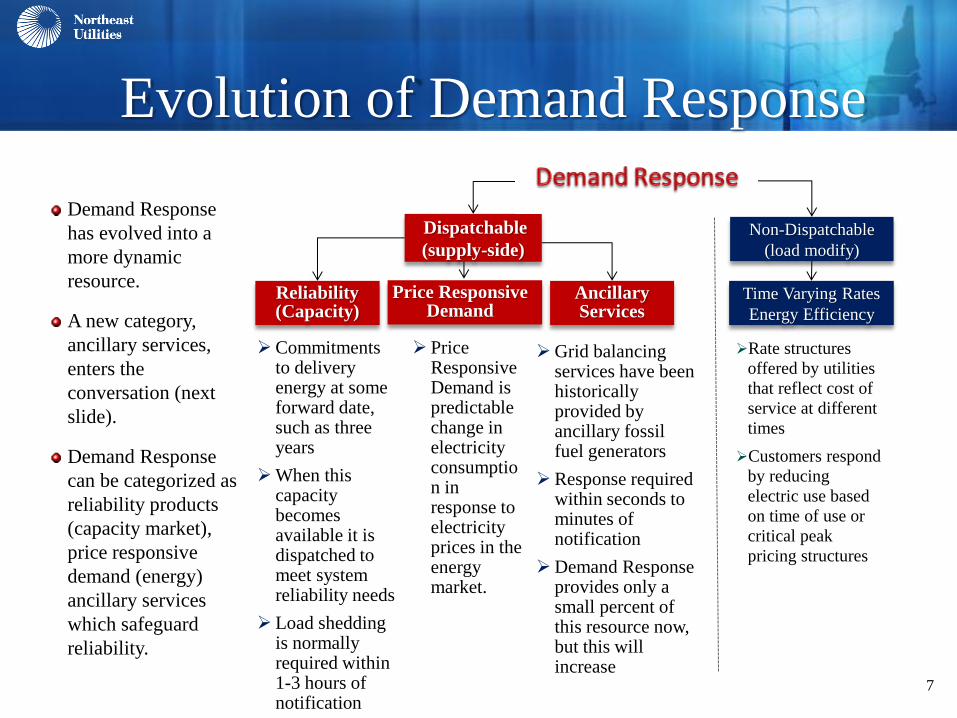
Evolution of Demand Response
Demand Response
has evolved into a
more dynamic
resource.
A new category,
ancillary services,
enters the
conversation (next
slide).
Demand Response
can be categorized as
reliability products
(capacity market),
price responsive
demand (energy)
ancillary services
which safeguard
reliability.
Rate structures
offered by utilities
that reflect cost of
service at different
times
Customers respond
by reducing
electric use based
on time of use or
critical peak
pricing structures
Non-Dispatchable
(load modify)
Price Responsive Demand
Reliability (Capacity)
Ancillary Services
Time Varying Rates
Energy Efficiency
Grid balancing services have been historically provided by ancillary fossil fuel generators
Response required within seconds to minutes of notification
Demand Response provides only a small percent of this resource now, but this will increase
Price Responsive Demand is predictable change in electricity consumption in response to electricity prices in the energy market.
Commitments to delivery energy at some forward date, such as three years
When this capacity becomes available it is dispatched to meet system reliability needs
Load shedding is normally required within 1-3 hours of notification
Dispatchable
(supply-side)

8
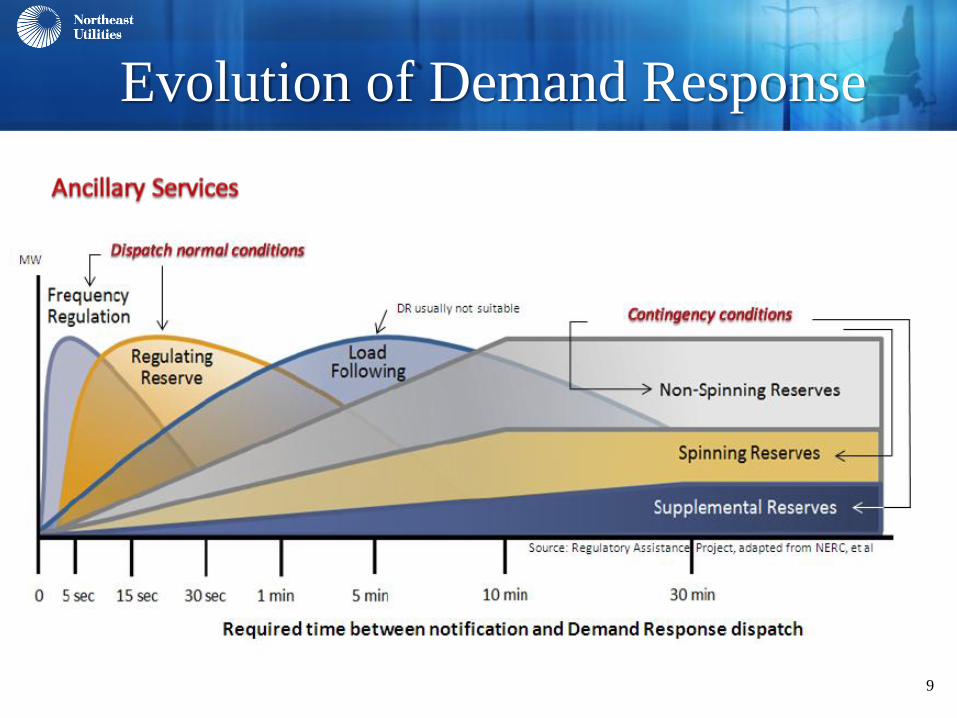
Evolution of Demand Response
Ancillary services support the
reliable operation of the transmission
system as it moves electricity. The
kinds that could potentially be
provided by Demand Response:
Operating Reserves. Supply
electricity when the grid has an
unexpected need for more power
(reduced use) on short notice in
contingency situations.
Regulation. Corrects for short
term changes in electricity use
that could affect the stability of
the power system. This is part of
normal system operations.
Changes in the power industry are creating a greater need for demand-side resources to serve moment-to-moment grid operational needs.
The use of Demand Response for ancillary services is a
refinement of an existing tactic.
Ancillary service must respond as quickly as an
ancillary power plant would, from seconds to 30
minutes.
Controlled loads that can be modulated can provide the
same quality of operating reserves and regulation
resource as a generating unit.
Ancillary services in organized markets are under the
purview of FERC which has issued several orders to
enable demand side resources to participate.
9
Evolution of Demand Response

10
Regulatory Drivers
What is the Next Evolutionary Step?
The markets and programs that Demand Response participates in are regulated at the Federal and State level. This shapes rules for participation.
State regulatory commissions govern utility operations.
Utilities, including those with statewide programs, file individual program tariffs with their respective commissions.
FERC regulates independent system operators and regional transmission operators.
These ISOs and RTOs file individual tariffs that must be approved by FERC.
Market rules
are based on
ISO tariffs.
CL&P’s program
rules and time-
varying rates are
based on their
tariffs with the
PURA.
Shapes ISO
markets, pilots
and initiatives,
some of which
are in
collaboration
with other
regulatory
authorities
Shapes NU
programs, pilots
initiatives and
collaborations
For example…
For example…
11
Regulatory Drivers
What is the Next Evolutionary Step?
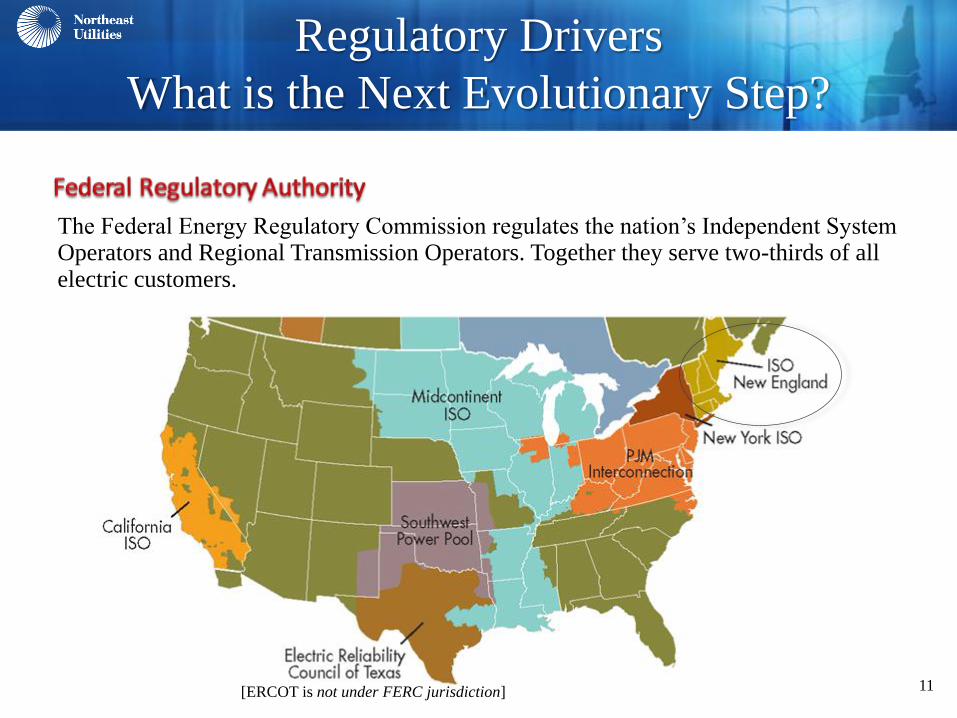
The Federal Energy Regulatory Commission regulates the nation’s Independent System Operators and Regional Transmission Operators. Together they serve two-thirds of all electric customers.
[ERCOT is not under FERC jurisdiction]

12
Regulatory Drivers
What is the Next Evolutionary Step?
FERC has been a strong proponent of Demand Response, creating rules intended to
provide a level playing field with generation.
Individual ISOs/RTOs file program tariffs with FERC, which govern how Demand Response
participates in wholesale markets, including the method of compensation.
Three ISOs/RTOs have capacity markets (ISO New England, New York ISO and PJM) that
pay incentives to attract investment in exchange for a commitment to stand ready to provide
energy into the market. The remaining ones have energy-only markets that only pay for the
energy provided.
Differences exist between various ISOs/RTOs, as well as within individual states in a
particular market. ISO New England includes the six northeast states and have a tradition of
collaborative action on energy matters. In contrast, the 13 PJM states have a much looser
affiliation but an active RTO.
13
Building the Business Case
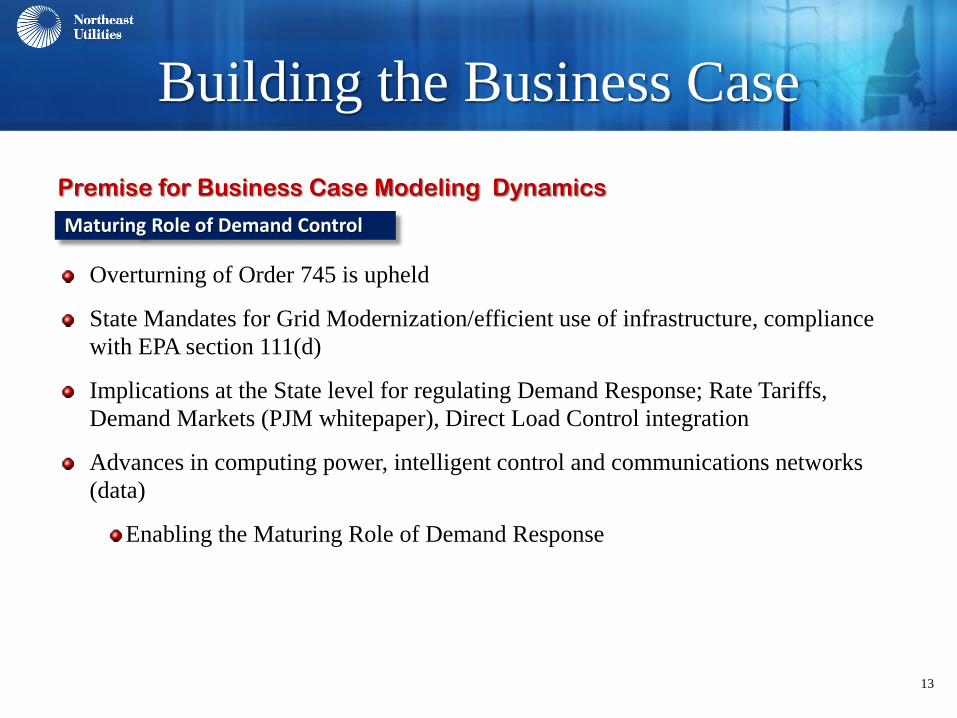
Overturning of Order 745 is upheld
State Mandates for Grid Modernization/efficient use of infrastructure, compliance
with EPA section 111(d)
Implications at the State level for regulating Demand Response; Rate Tariffs,
Demand Markets (PJM whitepaper), Direct Load Control integration
Advances in computing power, intelligent control and communications networks
(data)
Enabling the Maturing Role of Demand Response
Premise for Business Case Modeling Dynamics
Maturing Role of Demand Control

14
Building the Business Case
Basic Steps of the Value Creation Chain
Value Creation
Chain
Demand
Response
Enabled
Equipment
Control and
operational
awareness at
customer
facilities
Aggregation of
data and
communications
at LSE Level
Efficient
use of
demand
15
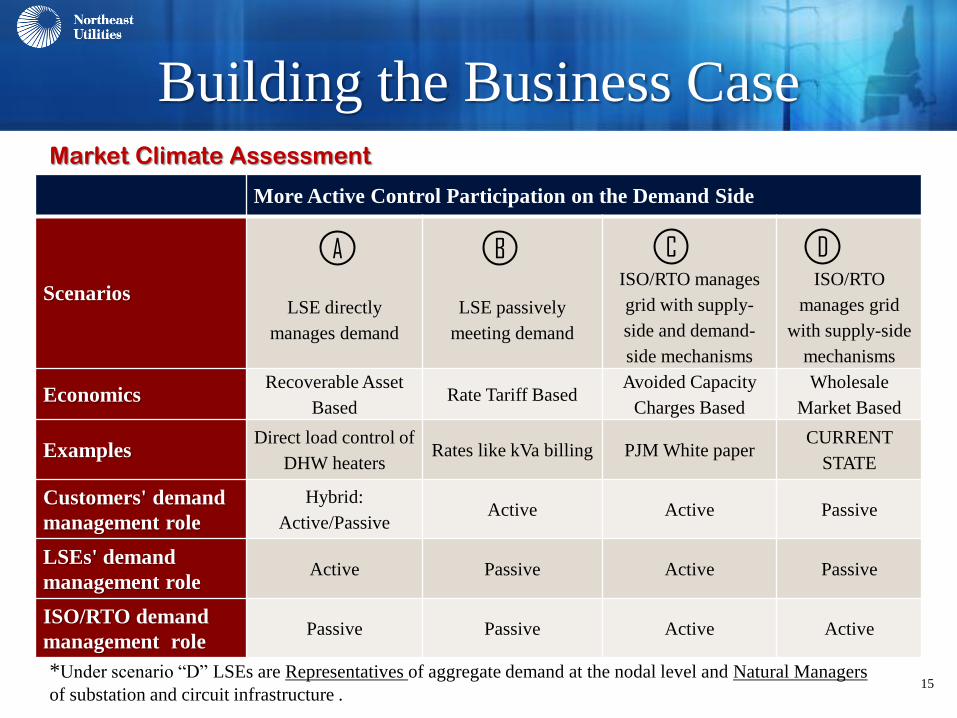
Building the Business Case Market Climate Assessment
More Active Control Participation on the Demand Side
Scenarios
LSE directly
manages demand
LSE passively
meeting demand
ISO/RTO manages
grid with supply-
side and demand-
side mechanisms
ISO/RTO
manages grid
with supply-side
mechanisms
Economics Recoverable Asset
Based Rate Tariff Based
Avoided Capacity
Charges Based
Wholesale
Market Based
Examples Direct load control of
DHW heaters Rates like kVa billing PJM White paper
CURRENT
STATE
Customers' demand
management role Hybrid:
Active/Passive Active Active Passive
LSEs' demand
management role Active Passive Active Passive
ISO/RTO demand
management role Passive Passive Active Active
*Under scenario “D” LSEs are Representatives of aggregate demand at the nodal level and Natural Managers
of substation and circuit infrastructure .
A B C D

16
Building the Business Case
Market Entities - Role
Value Creation
Chain
Demand
Response
Enabled
Equipment
Control and
operational
awareness at
customer
facilities
Aggregation of
data and
communications
at LSE Level
Efficient use
of demand
Feature Digital signal
control
Load control and
end-user facility
awareness
Data transfer and
information
management
Reduced
costs
Market Entity Equipment
provider
Demand Response
provider
Communications
and control
providers
End users and
LSE
Action Sales, installation
and compatibility
Provides load
reduction
availability and
executes reduction
commands
Facilitate data
communications
and situational
awareness
Efficient use
of demand
Customer interface
or LSE interface Customer Customer LSE
Customer and
LSE
17
Building the Business Case
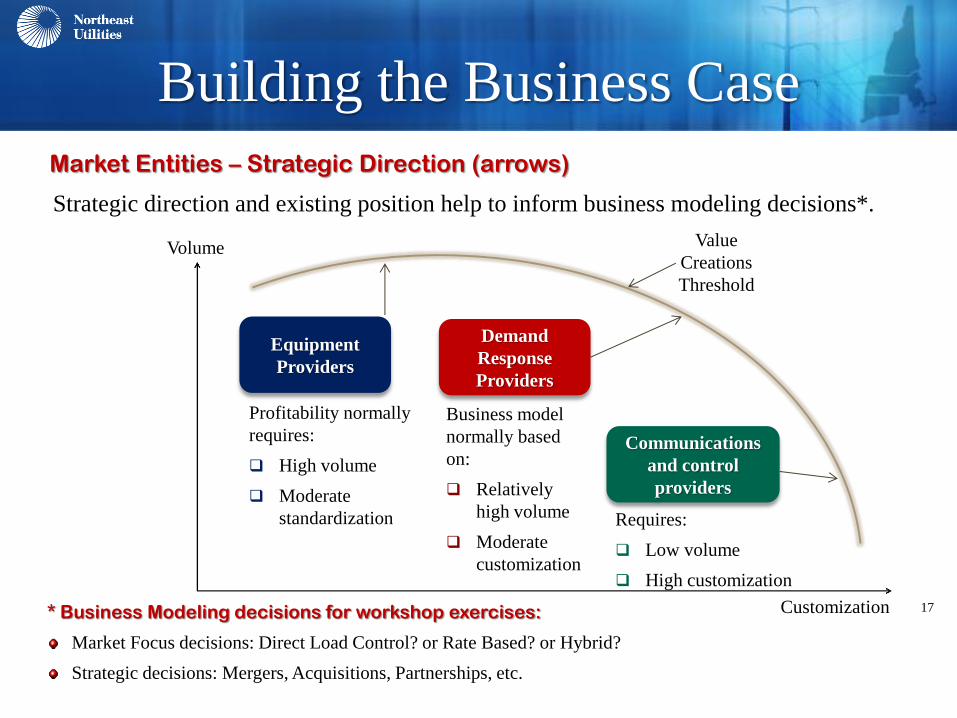
Market Entities – Strategic Direction (arrows)
Value
Creations
Threshold
Volume
Customization
Strategic direction and existing position help to inform business modeling decisions*.
* Business Modeling decisions for workshop exercises:
Market Focus decisions: Direct Load Control? or Rate Based? or Hybrid?
Strategic decisions: Mergers, Acquisitions, Partnerships, etc.
Equipment
Providers
Profitability normally
requires:
High volume
Moderate
standardization
Demand
Response
Providers
Business model
normally based
on:
Relatively
high volume
Moderate
customization
Communications
and control
providers
Requires:
Low volume
High customization

18
Building the Business Case
Technologies: Load Duration Monitoring
Equipment is running coincidently, cycling controls can harvest this available load through cycling controls
Only 5% of annual hours
represents 64% of peak load
19
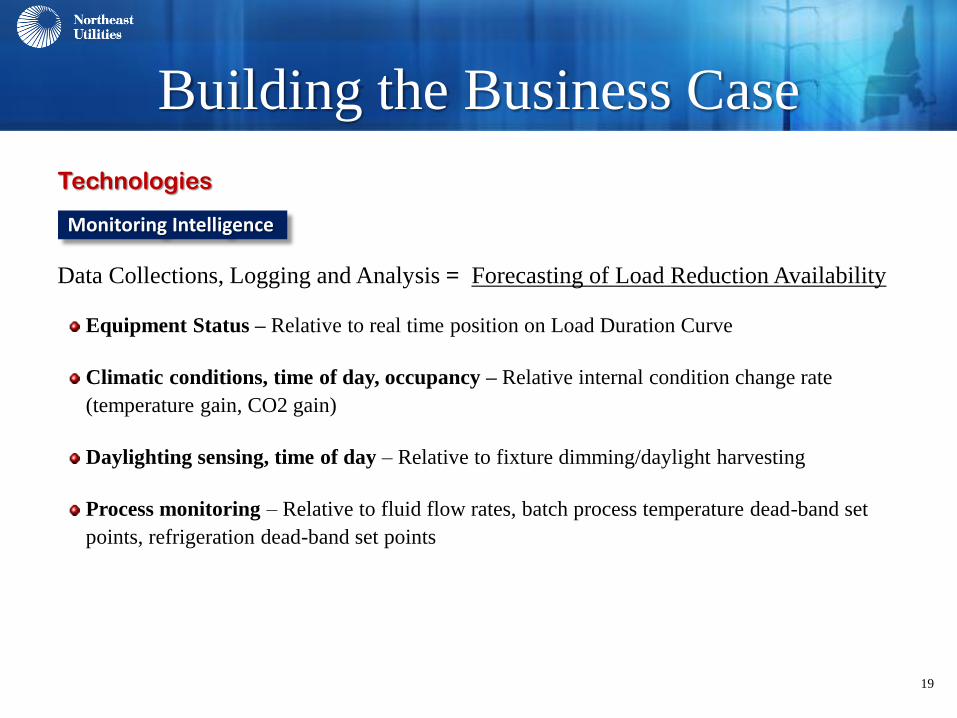
Technologies
Building the Business Case
Data Collections, Logging and Analysis = Forecasting of Load Reduction Availability
Equipment Status – Relative to real time position on Load Duration Curve
Climatic conditions, time of day, occupancy – Relative internal condition change rate
(temperature gain, CO2 gain)
Daylighting sensing, time of day – Relative to fixture dimming/daylight harvesting
Process monitoring – Relative to fluid flow rates, batch process temperature dead-band set
points, refrigeration dead-band set points
Monitoring Intelligence
20
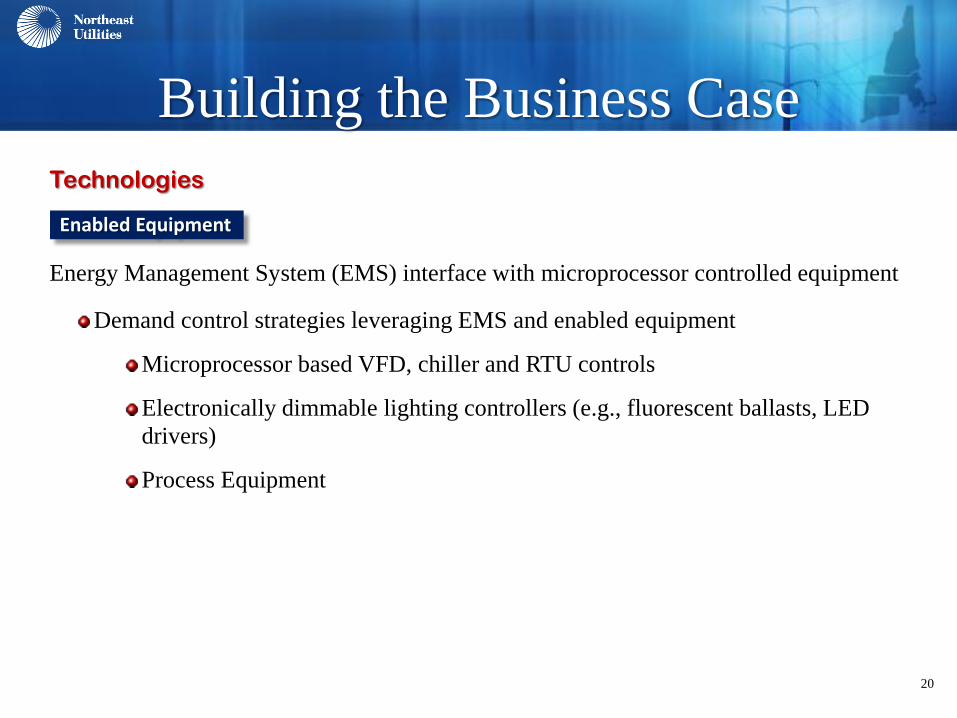
Building the Business Case
Technologies
Energy Management System (EMS) interface with microprocessor controlled equipment
Demand control strategies leveraging EMS and enabled equipment
Microprocessor based VFD, chiller and RTU controls
Electronically dimmable lighting controllers (e.g., fluorescent ballasts, LED
drivers)
Process Equipment
Enabled Equipment
21
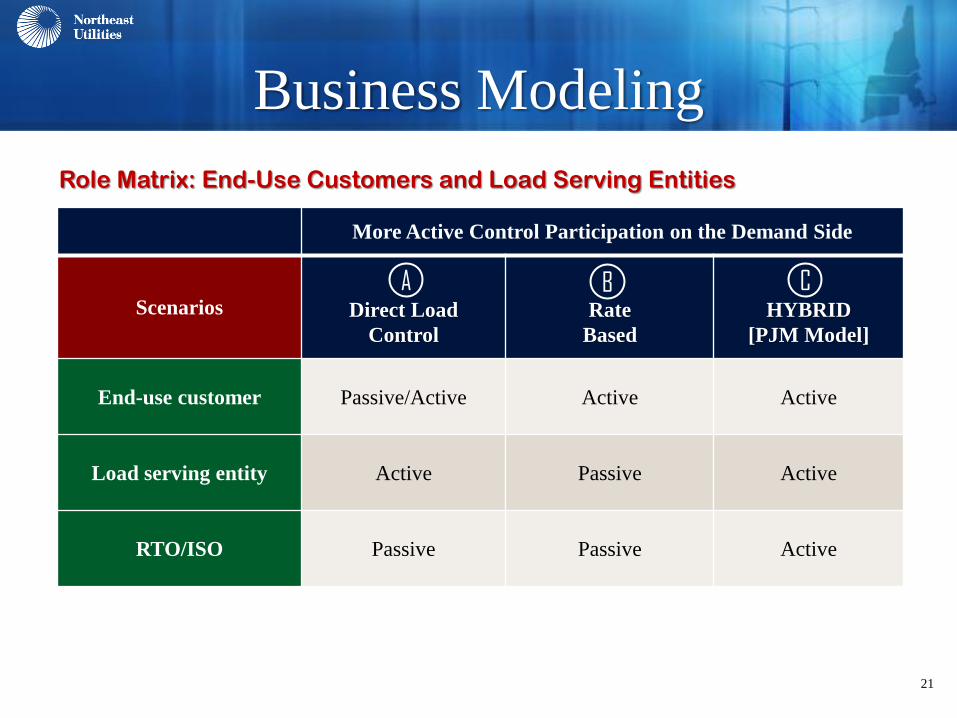
Business Modeling
More Active Control Participation on the Demand Side
Scenarios
Direct Load
Control
Rate
Based
HYBRID
[PJM Model]
End-use customer Passive/Active Active Active
Load serving entity Active Passive Active
RTO/ISO Passive Passive Active
Role Matrix: End-Use Customers and Load Serving Entities
A B C
22
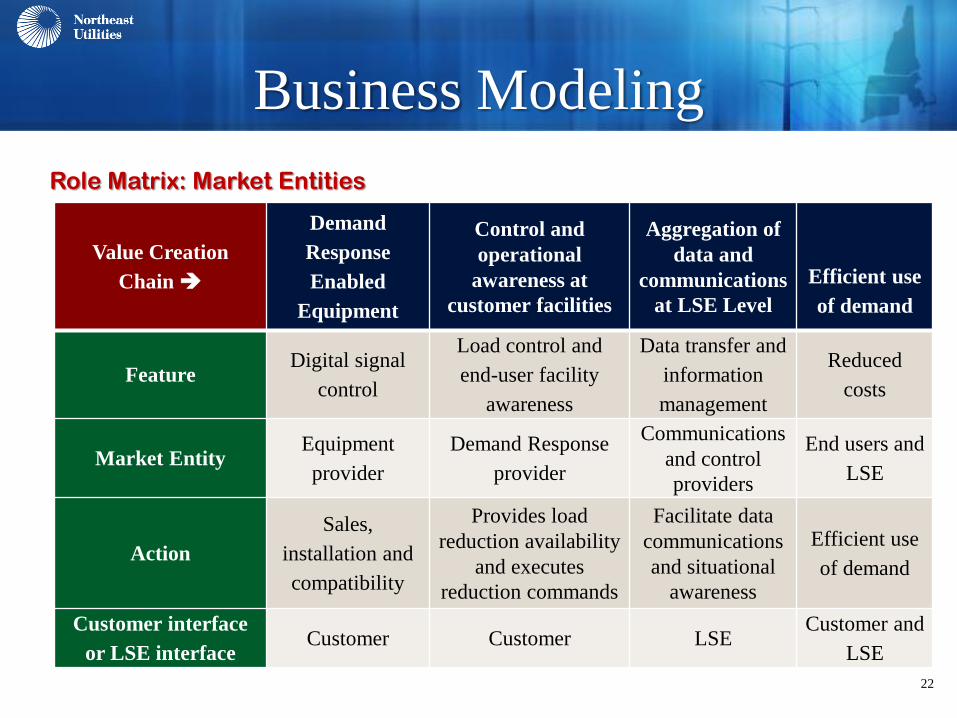
Role Matrix: Market Entities
Value Creation
Chain
Demand
Response
Enabled
Equipment
Control and
operational
awareness at
customer facilities
Aggregation of
data and
communications
at LSE Level
Efficient use
of demand
Feature Digital signal
control
Load control and
end-user facility
awareness
Data transfer and
information
management
Reduced
costs
Market Entity Equipment
provider
Demand Response
provider
Communications
and control
providers
End users and
LSE
Action
Sales,
installation and
compatibility
Provides load
reduction availability
and executes
reduction commands
Facilitate data
communications
and situational
awareness
Efficient use
of demand
Customer interface
or LSE interface Customer Customer LSE
Customer and
LSE
Business Modeling
23
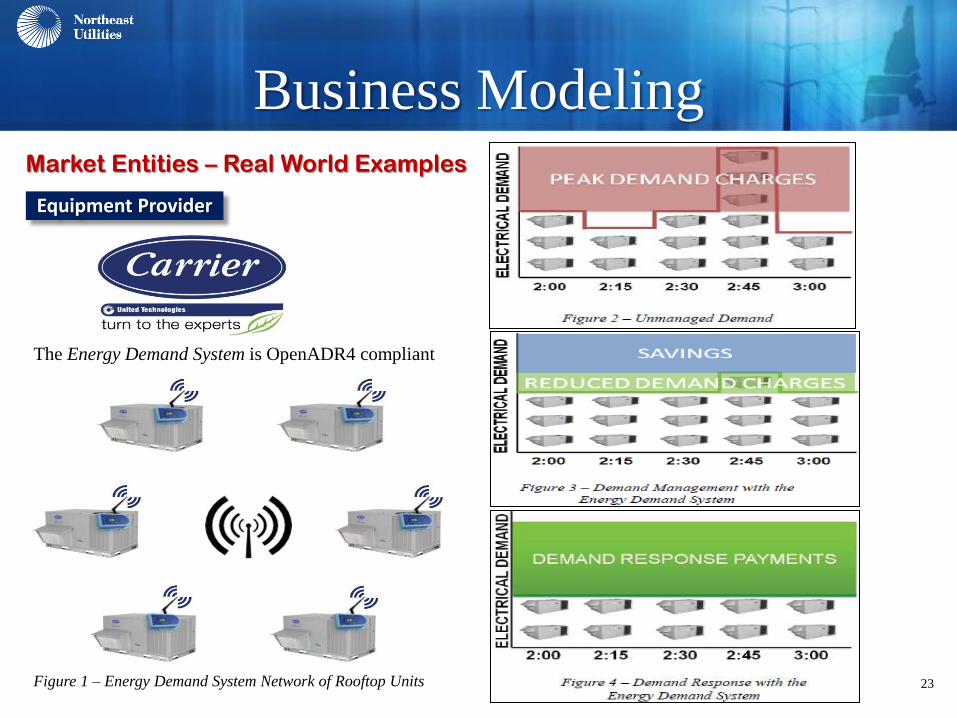
Business Modeling Market Entities – Real World Examples
Figure 1 – Energy Demand System Network of Rooftop Units
The Energy Demand System is OpenADR4 compliant
Equipment Provider
24
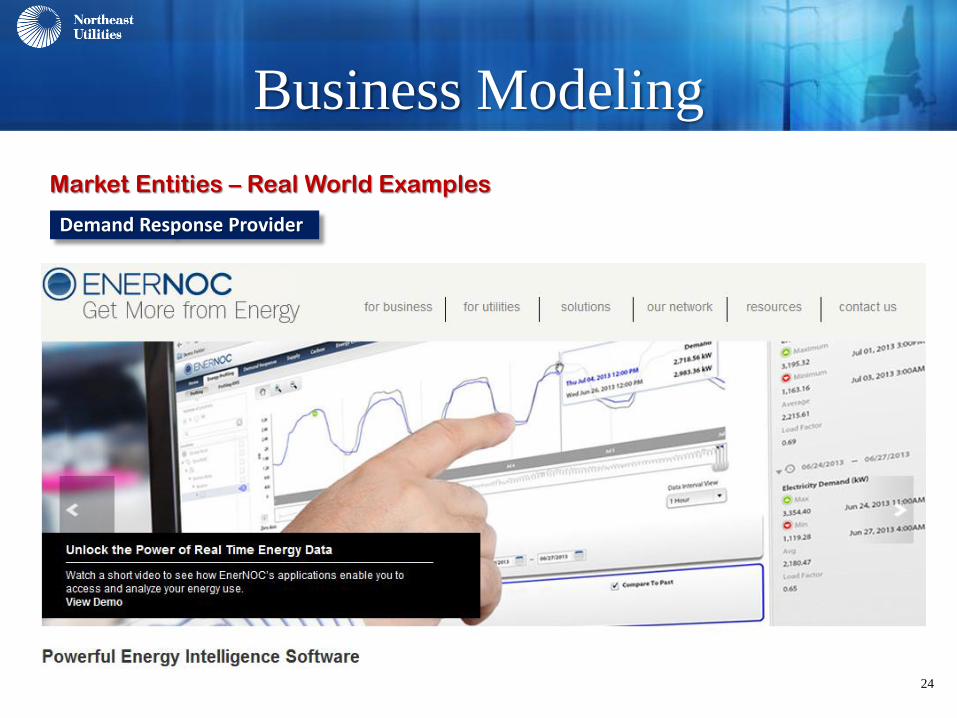
Business Modeling
Market Entities – Real World Examples
Demand Response Provider
25
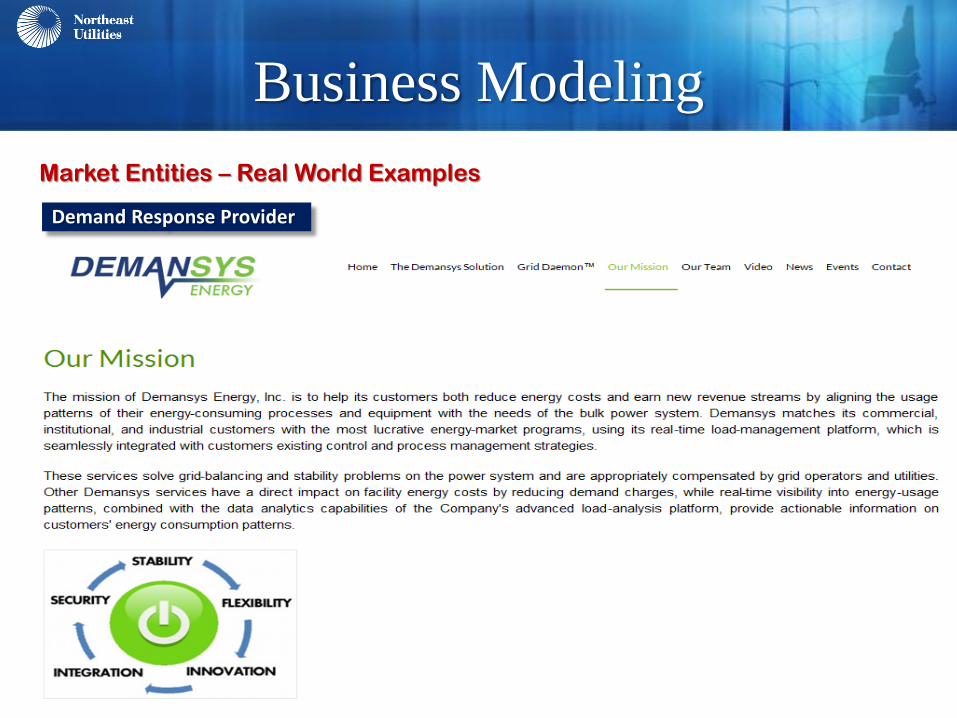
Business Modeling
Market Entities – Real World Examples
Demand Response Provider
26
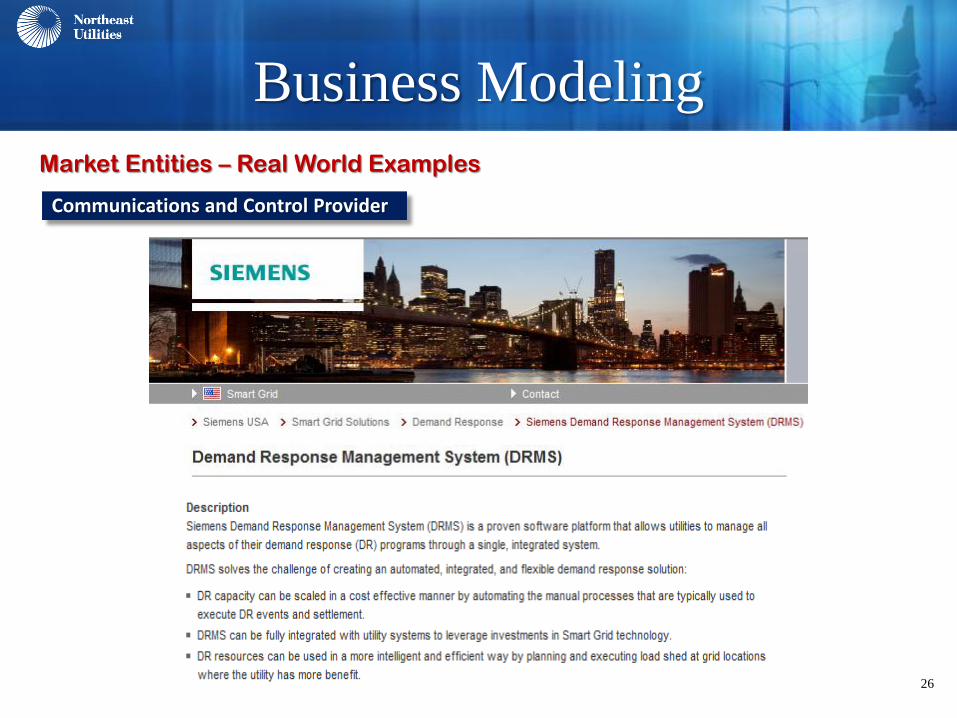
Business Modeling
Market Entities – Real World Examples
Communications and Control Provider
27
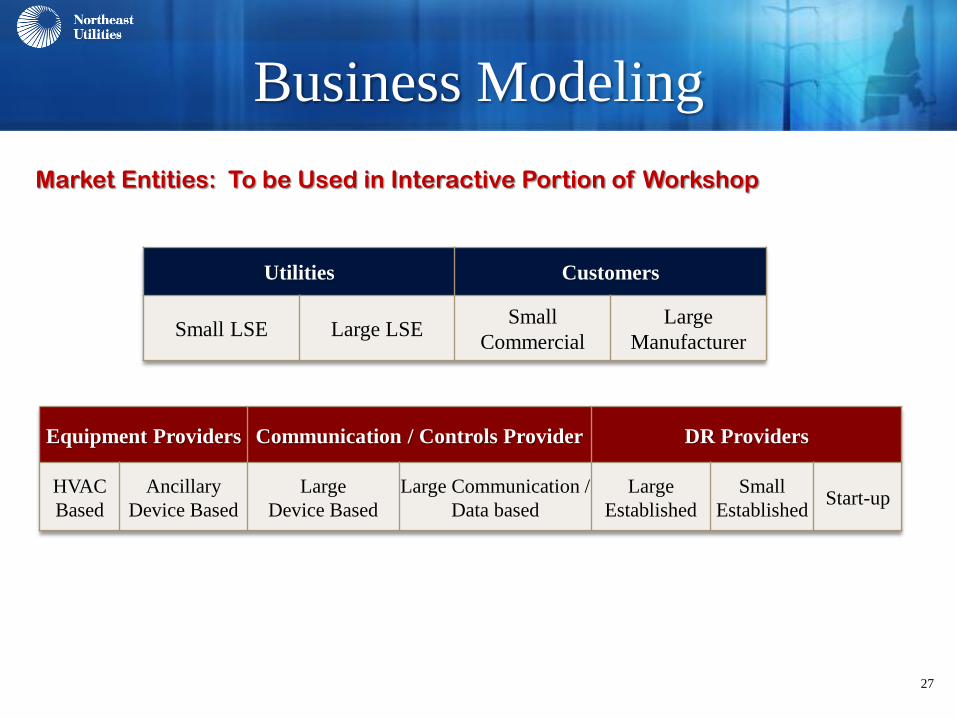
Business Modeling
Market Entities: To be Used in Interactive Portion of Workshop
Utilities Customers
Small LSE Large LSE Small
Commercial Large
Manufacturer
Equipment Providers Communication / Controls Provider DR Providers
HVAC
Based Ancillary
Device Based Large
Device Based Large Communication /
Data based Large
Established Small
Established Start-up

28
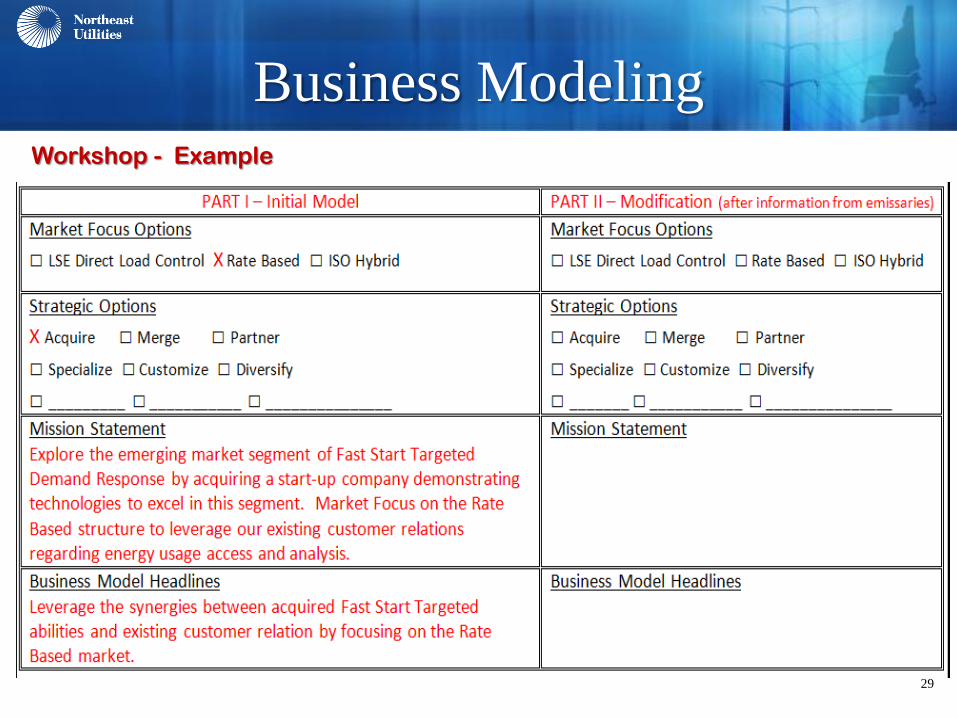
Business Modeling
Workshop - Example
29
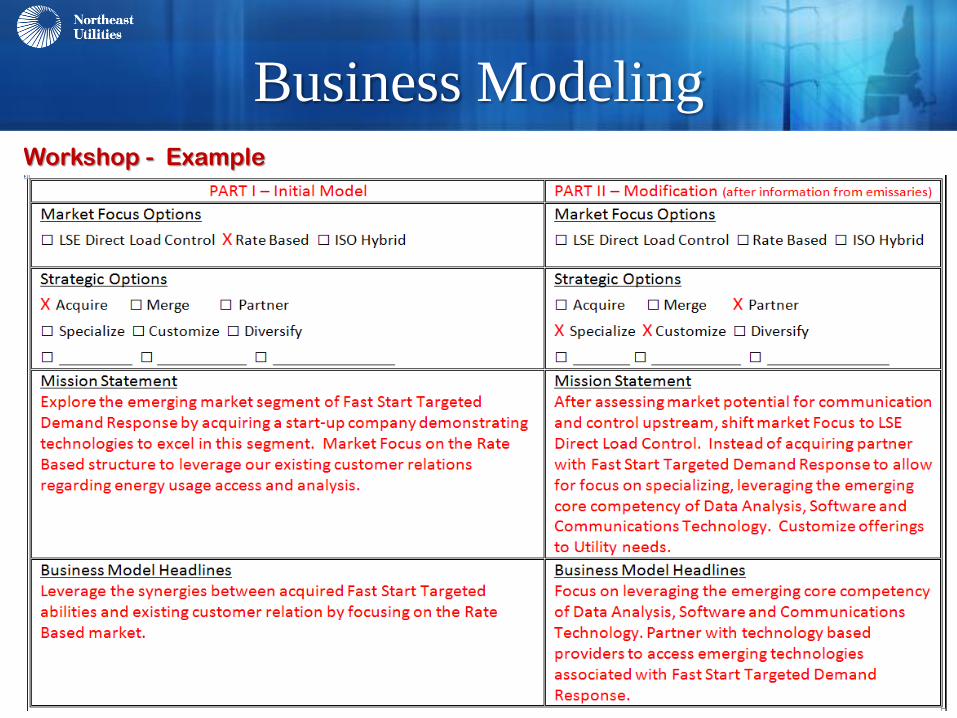
Business Modeling Workshop - Example
30
Business Modeling Workshop - Example

31
Business Modeling
Workshop - Interactive Process
Teams: Break into teams, each representing a market entity
Roles – Leader (n=2), Emissaries (n=2), Liaisons (n=2)
Representation: Teams will be given a profile for the entity they are representing
(business objectives and a variety of business model and strategy options, to use in
the exercise)
Part 1- Each team chooses options then develops Mission Statement and
Business Headline without interfacing with other teams
Part 2 – Each emissary engages two liaisons to gather Mission Statement and
Business Model Headline information. This information is used to modify
Mission Statement and Business Model Headline.
Business Models: Resulting business models will be presented to the workshop
participants as a whole and correlated on a summarization matrix.
Summary: Aggregated findings will be discussed with the group.
Business Modeling Exercises
32
Thank you!
David Dobratz, P.E., CEM
Supervisor, Direct Install and Load Response
Connecticut Light and Power / Northeast Utilities