Embed Size (px)
Citation preview

TMX Equicom Toronto
April 2, 2014
Rob Dawson, Chief Financial Officer
Siren Fisekci, VP Investor and Corporate Relations

Forward-looking information
In the interest of providing you with information regarding Canadian Oil Sands Limited (the “Corporation”), including management’s assessment of the Corporation’s future plans and operations, certain statements and
graphs throughout this presentation contain “forward-looking information” under applicable securities laws. Forward-looking statements are typically identified by words such as “anticipate”, “expect”, “believe”, “plan”, “intend”
or similar words suggesting future outcomes. Forward-looking statements in this presentation include, but are not limited to, statements and graphs (collectively “statements”) with respect to: future dividends and any
increase or decrease from current payment amounts; the expected sales volume in 2014; the expected operating expenses in 2014; the expected cash flow from operations and cash flow from operations per share in 2014;
the expected realized selling price for the Corporation’s product in 2014; the estimated value and amount of reserves recoverable and the time frame to recover such reserves; the estimated resources; the expected impact
on cash flow from operations and cash flow from operations per share from increasing/decreasing crude oil prices; the expected impact on cash flow from operations from increasing Syncrude production; the expected
foreign exchange rate in 2014; the expected West Texas Intermediate (“WTI”) price in 2014; the expected average discount for synthetic crude oil (“SCO”) to WTI in 2014; the expected amount of total major project costs,
anticipated target in-service dates and estimated completion percentages for the Mildred Lake mine train replacements and the centrifuge plant at the Mildred Lake mine; the expectation that the major project spending will
taper off in 2015; the expected major project spending in 2014-2015; the estimate that regular maintenance capital costs for the next few years will be similar to 2014; the expectation that the Corporation will finance the
major projects primarily with existing cash balances and cash flow from operations; the belief that the Corporation is positioned to fund its 2014 capital program and support its dividend while maintaining net debt within the
targeted range; all expectations regarding net debt; the anticipated amount of current taxes in 2014; the expected increase in free cash flow in 2015 assuming continued strength in world crude oil prices; plans regarding
crude oil hedges in the future; the expected benefits of the management services agreement; the anticipated benefits in extraction and upgrading resulting from Syncrude’s reliability initiatives; the belief that the reliability
initiatives in place at Syncrude will lead to higher production levels; expectations regarding the Corporation’s cash levels; Crown royalties payable; the anticipated scope and economics of the Mildred Lake mine extension
(“MLX”) project; the expectation that the MLX project should allow the Mildred Lake mine and the Aurora North mine to operate into the 2030s and 2040s, respectively; the expectation that Syncrude will submit a regulatory
application for the MLX project in 2014; the timing of construction and spending for the MLX project; the expectation that the MLX project should be the most economic new mining production to come on stream in the next
ten years because it benefits from existing infrastructure and expectations regarding the timing of planned/announced market access pipelines, and all expectations regarding the SCO-WTI-Brent differentials.
You are cautioned not to place undue reliance on forward-looking statements, as there can be no assurance that the plans, intentions or expectations upon which they are based will occur. By their nature, forward-looking
statements involve numerous assumptions, known and unknown risks and uncertainties, both general and specific, that contribute to the possibility that the predictions, forecasts, projections and other forward-looking
statements will not occur. Although the Corporation believes that the assumptions and expectations represented by such forward-looking statements are reasonable and reflect the current views of the Corporation with
respect to future events, there can be no assurance that such assumptions and expectations will prove to be correct.
The factors or assumptions on which the forward-looking statements are based include, but are not limited to: the assumptions outlined in the Corporation’s guidance document as posted on the Corporation’s website at
www.cdnoilsands.com as of the date hereof and as subsequently amended or replaced from time to time, including without limitation, the assumptions as to production, operating expenses and oil prices; the successful and
timely implementation of capital projects; Syncrude’s major project spending plans; the ability to obtain regulatory and joint venture owner approval; our ability to either generate sufficient cash flow from operations to meet
our current and future obligations or obtain external sources of debt and equity capital; the continuation of assumed tax, royalty and regulatory regimes and the accuracy of the estimates of our reserves and resources
volumes.
Some of the risks and other factors which could cause actual results or events to differ materially from current expectations expressed in the forward-looking statements contained in this AIF include, but are not limited to:
volatility of crude oil prices; volatility of the SCO to WTI differential; the impact that pipeline capacity and apportionment and refinery demand have on prices for SCO; the impacts of regulatory changes especially those
which relate to royalties, taxation, tailings, water and the environment; the impact of new technologies on the cost of oil sands mining; the impacts of rising costs associated with tailings and water management; the inability
of Syncrude to obtain required consents, permits or approvals, including without limitation, the inability of Syncrude to obtain approval to release water from its operations; the impact of Syncrude being unable to meet the
conditions of its approval for its tailings management plan under Directive 074; various events which could disrupt operations including fires, equipment failures and severe weather; unsuccessful or untimely implementation
of capital or maintenance projects; the impact of technology on operations and processes and how new complex technology may not perform as expected; the obtaining of required owner approvals from the Syncrude
Participants for expansions, operational issues and contractual issues; labour turnover and shortages and the productivity achieved from labour in the Fort McMurray area; uncertainty of estimates with respect to reserves
and resources; the supply and demand metrics for oil and natural gas; the variances of stock market activities generally; currency and interest rate fluctuations; volatility of natural gas prices; Canadian Oil Sands’ ability to
either generate sufficient cash flow from operations to meet our current and future obligations or obtain external sources of debt and equity capital; the inability of the Corporation to continue to meet the listing requirements
of the TSX; general economic, business and market conditions and such other risks and uncertainties described in the Corporation’s Annual Information Form dated February 20, 2014 and in the reports and filings made
with securities regulatory authorities from time to time by the Corporation which are available on the Corporation’s profile on SEDAR at www.sedar.com and on the Corporation’s website at www.cdnoilsands.com.
In this presentation we refer to additional GAAP and non-GAAP financial measures that do not have any standardized meaning as prescribed by Canadian Generally Accepted Accounting Principles (“GAAP”). We refer to
additional GAAP financial measures such as cash flow from operations, cash flow from operations on a per share basis and net debt. For more information on additional GAAP financial measures please refer to our 2013
Annual Management’s Discussion and Analysis which is available on the Corporation’s profile on SEDAR at www.sedar.com and on the Corporation’s website at www.cdnoilsands.com. In this presentation we also refer to
non-GAAP financial measures such as free cash flow, return on equity, enterprise value and earnings before interest and taxes. For more information on free cash flow and return on equity (referred to as return on average
shareholders’ equity in our 2013 Annual Report) please refer to our 2013 Annual Report, which is available on the Corporation’s profile on SEDAR at www.sedar.com and on the Corporation’s website at
www.cdnoilsands.com. Enterprise value and earnings before interest and taxes are discussed in this presentation.
Third party information: To the extent that information contained in this presentation, forward-looking or otherwise, has been derived from third party sources such as Bloomberg, First Energy, the US Department of
Energy, Environment Canada, the International Energy Agency, IHS CERA and the Canadian Association of Petroleum Producers, the Corporation makes no representations or warranties, express or implied, as to the
quality, accuracy and completeness of such information.

Why own COS
• Pure (100% light, sweet) crude oil investment in long-life resource
• Strong operating base with production upside potential
• High-quality, undeveloped leases for future development
• Well-positioned with financial strength and flexibility
• High dividend payout (current yield 6.2%*)
The definitive oil sands investment
* Based on March 26/14 stock price and dividend announced on Jan. 30/14, annualized

Syncrude: A high quality resource
• Strong, stable production base
• Integrated oil sands mining project
• No exposure to light/heavy differentials
• Proven technology
• Predictable reservoir recovery – over 90%
• Less exposure to natural gas prices and impact of potential CO2 legislation than SAGD projects

1.6
5.1
2.2
2.3
0 1 2 3 4 5 6 7
Prospective resources
Contingent resources
Probable - Undeveloped
Proved plus Probable - Producing
Large Syncrude reserve and resource base supports decades of production
Billions of Synthetic Crude Oil Barrels
1. All amounts gross to Syncrude. Canadian Oil Sands Limited, through its wholly-owned partnership, holds a 36.74% interest in the Syncrude Project. Based on independent reserves and resources estimates by GLJ Petroleum Consultants, Ltd. as of Dec. 31/13. See reserves and resources cautionary advisory in Canadian Oil Sands’ Annual Information Form dated Feb. 20/14 and the definitions and forward-looking information advisory.
2. Calculated as Proved Developed Producing Reserves of 2.0 billion barrels plus Probable Producing Reserves of 0.3 billion barrels. Probable Producing Reserves calculated as Total Probable Reserves of 923 million barrels (net to COS) less Probable Undeveloped Reserves of 812 million barrels (net to COS) equals 111 million barrels (net to COS) or 0.3 billion barrels (100% Syncrude).
3. Calculated as 812 million barrels (net to COS) grossed up to reflect 100% Syncrude.
4. Reserve Life Index (RLI) based on COS January 30, 2014 Guidance of approximately 105 million barrels per year of Syncrude production (38.6 million barrels net to COS).
• Mildred Lake
Extension
• Other leases
• Other leases
•Aurora South
• Mildred Lake
• Aurora North
RLI= 22 years 4 2
3
1
RLI= 21 years 4

Pure play oil sands investment
0% 20% 40% 60% 80% 100%
COS
Canadian Natural
Cenovus
Imperial
MEG
Suncor
Oil sands as % of total production
Source: FirstEnergy Capital Nov. 8/13 report
Our production is 100% light, sweet crude oil

Quality and location differentials
Cdn $/bbl Trailing 3-month
average
$40
$50
$60
$70
$80
$90
$100
$110
$120
$130
Trailing 3-Month Average
Brent
SCO
WTI
WCS
Bitumen

Kitimat
Hardisty
Edmonton
Burnaby
Cushing
Montreal
Houston
Sarnia
Patoka
Quebec City
Markets for COS’ Syncrude Production
Chicago
Syncrude
Current synthetic crude oil markets
Potential new markets

Sales volume (bbl/d)2 105,700
Operating expenses ($/bbl) 41.48
Cash flow from operations ($millions)3,4 1,158
Cash flow from operations ($/share)3 2.39 Realized selling price ($/bbl) 87.77
2014 Outlook
20141
1. 2014 Outlook as at Jan. 30/14. 2. Sales after crude oil purchases and transportation expense.
3. Additional GAAP measure. 4. 2014 CFFO includes $200 million in cash taxes.

Highly leveraged to increasing crude oil prices1
0.00
1.00
2.00
3.00
4.00
$70 $80 $90 $100 $110
Illustrative cash flow from operations ($/share)2
WTI (US$/bbl)
2014 estimate
All figures in Canadian dollars unless otherwise noted. 1. Every US $1.00/bbl WTI increase/decrease in crude oil price increases/reduces cash flow from operations/share by $0.05 after tax; see Jan. 30/14 Guidance for other
sensitivities; this assumes no other changes to operating expenses or other assumptions from the Jan. 30/14 Guidance; see the risk factors outlined in our Annual Information Form dated Feb. 21/13 as to other risks; for illustrative purposes only – COS is not expressing a particular view on crude oil prices.
2. Additional GAAP measure; assumes Jan. 30/14 Guidance of: $0.97 US$/Cdn$ FX, $5/bbl SCO discount to Cdn$WTI, $41.48/bbl operating expenses and sales of approximately 105,700 bbl/d net to COS.

Operating leverage
0
50
100
150
200
250
300
350
400
2007 2008 2009 2010 2011 2012 2013 2014F
Syncrude production
Thousand barrels per day
2014F based on Jan. 30/14 Outlook.
Average production of 287,000 bbl/d since 2007
2 million bbl change in 2014 Syncrude production impacts cash flow from operations by $40 million

Key reliability initiatives
Extraction
• Major projects in 2013/2014 renew and replace most crusher/conveyor systems
– Start-up of MLMR in Q4 2014 increases froth production capacity by ~20%
• Reduced solids content in bitumen feed
– Retrofitting centrifuges and reconfigured centrifuge bypass
Upgrading
• Replaced hydrogen plant exchangers (remaining 4th to be completed Q1 2014)
• Designing modifications to improve CO boiler performance
• Plan to improve run length of hydrotreaters

Premium product and competitive operating costs result in significant margin advantage
Average premium of $11/bbl translated to $2.4B total advantage since 2008
Realized price advantage vs. Competitor “A”
Operating cost advantage / disadvantage vs. Competitor “A”
Gross margin advantage
Source: Company “A” data based on publicly available information. Sales and operating costs are volume-weighted and use a four-quarter trailing average
Syncrude margin advantage over nearest competitor
$(5.00)
$-
$5.00
$10.00
$15.00
$20.00

Syncrude upgrader delivers significant value
$0
$20
$40
$60
$80
$100
$120
COS Mining & SAGD Peer
Typical SAGD Peer
Earnings before interest and taxes
Depreciation
Crown royalties
Other
Operating expenses and G&A
per bbl
1. COS data for the year ended December 31, 2013; Peer data updated periodically based on publicly available data as it becomes available: Cenovus Operating, MEG Net Operating Costs, Suncor Total Cash Operating Costs
2. SAGD based on average of Cenovus (Christina Lake and Foster Creek), MEG and Suncor In-situ 3. “Other” for COS and Suncor refers to non-production or development costs, MEG is share-based comp and R&D 4. COS operating expenses include Syncrude G&A 5. Earnings before interest and taxes is a non-GAAP financial measure and is calculated as net income plus tax expense plus
net finance expense plus foreign exchange gain (loss).
COS EBIT ~ $35/bbl
1, 4
1 1, 2
3
5

Compelling valuation relative to new mining projects
Project(s) Cost estimate/ Enterprise value1
Production capacity (bbl/d)
Product $ per flowing bbl
Syncrude (COS’ share)
$11.8 billion 128,000
Light, sweet synthetic
$92,000
Kearl Lake 2
(Imperial Oil) $12.9 billion 110,000
Bitumen $117,000
Horizon Phases 2/3 3
(CNRL) $12.5 billion - $14.0 billion
140,000
Light, sweet synthetic
$90,000 - $100,000
Fort Hills 4
(Suncor/Total/Teck) $15.1 billion 180,000 Bitumen $84,000
1. COS enterprise value based on market cap as at March 26/14 and net debt at December 31/13; non-GAAP measure. 2. Company estimate for cost and production capacity; includes pre-built infrastructure. 3. Company estimate for capital required for 140,000 bbl/d of growth from the Reliability-Tranche 2 and Phases 2A, 2B and 3. 4. Suncor estimate announced October 2013; includes capital spend to date.
At similar price, COS provides additional value through:
• Production today
• High quality synthetic product
• All of our reserves and resources
• High dividend payout

Investing in our business for sustained success
Major Capital Projects Total Costs 1
Total cost estimate
($B)
Total cost estimate
accuracy (% )
Estimated % complete @
12/31/132
Target in-service date
Mildred Lake mine train replacement 1.6 +15% /
-15% 80% Q4 2014
Centrifuge tailings management 0.7 +15% /
-15% 70% H1 2015
(1) Total project costs are net COS’ 36.74% working interest and include both capital and certain development expenses; costs exclude capitalized interest.
(2) The estimated percentage complete is based on hours spent as a percentage of total forecasted hours to project completion.
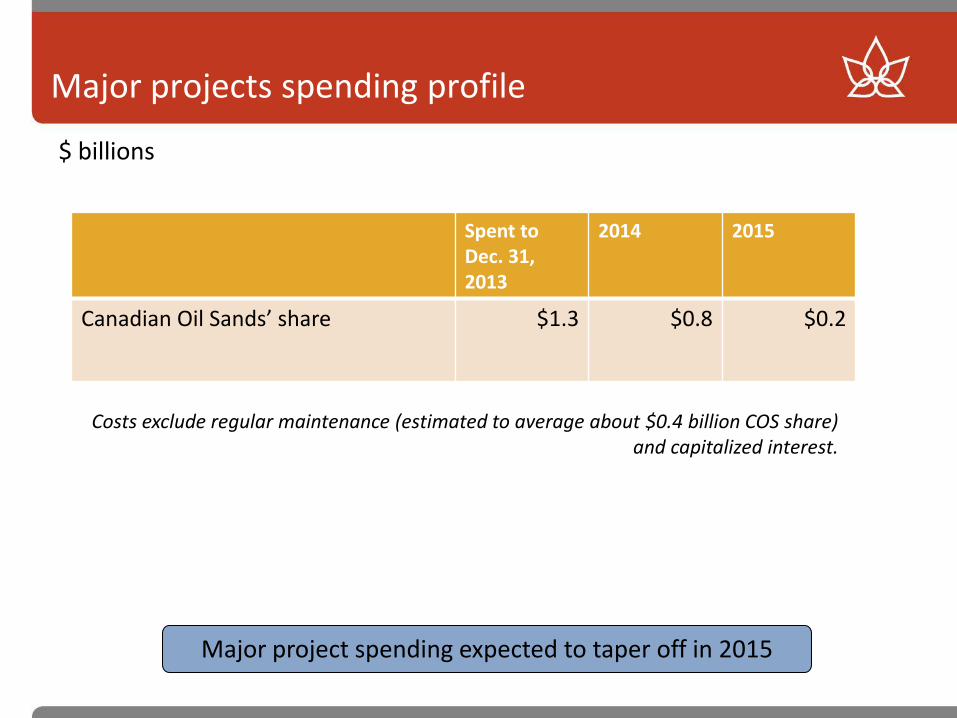
Major projects spending profile
Spent to Dec. 31, 2013
2014 2015
Canadian Oil Sands’ share $1.3 $0.8 $0.2
$ billions
Costs exclude regular maintenance (estimated to average about $0.4 billion COS share) and capitalized interest.
Major project spending expected to taper off in 2015
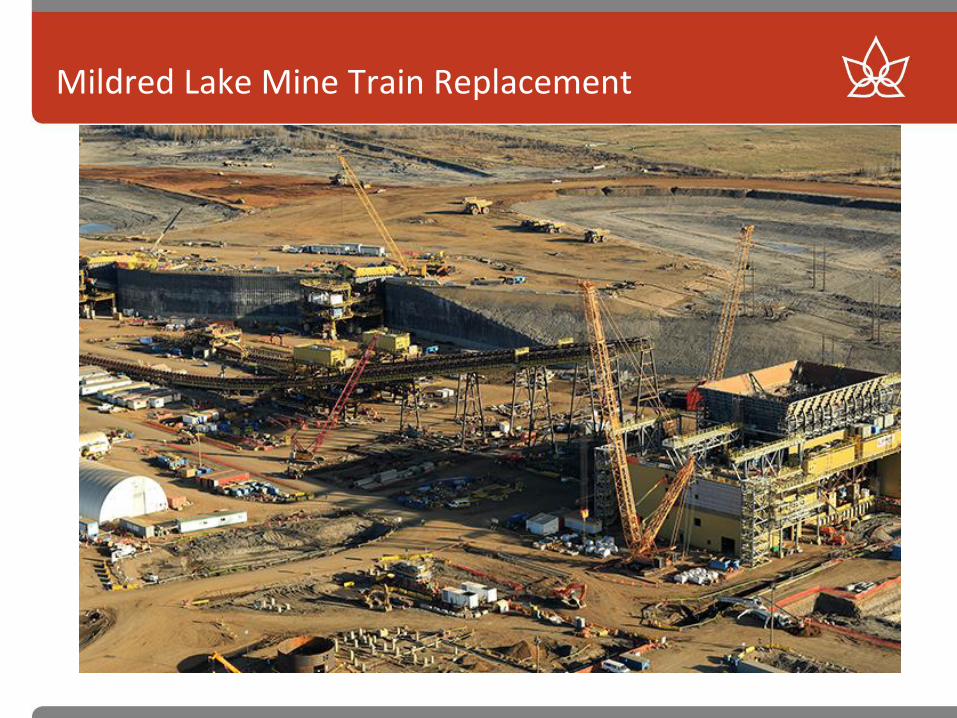
Mildred Lake Mine Train Replacement

Strong liquidity position to support capital program and healthy dividend
Based on COS’ 2014 Outlook dated Jan. 30/14; dividends assume quarterly $0.35 per share for 2014 (This is an illustrative assumption and COS is not expressing a view on its future dividends). Cash flow from operations is an additional GAAP measure. A portion of the cash balance at Dec. 31/13 will be used in 2014 to settle accounts payable of $500 million for taxes and Crown royalties.
$ millions
0
500
1000
1500
2000
Cash uses - 2014 estimate
Cash flow from operations - 2014
estimate
Cash balance @ Dec 31/13
Credit facility (undrawn)
Dividends
Capex
$1.8B
$1.2B
$0.8B
$1.5B

Managing a strong, efficient balance sheet
1. Non-GAAP measure
Net debt1, $ millions
0
500
1000
1500
2000
2005 2006 2007 2008 2009 2010 2011 2012 2013
Targeting net debt level of $1 to $2 billion

0
500
1000
1500
2000
2500
2007 2008 2009 2010 2011 2012 2013 2014 2015 2016 2017
major projects capex
maintenance capex
capitalized interest
cash flow from operations
Positioned for strong free cash flow1,2
$ millions, net to Canadian Oil Sands
(1) Free cash flow is calculated as cash flow from operations less capital expenditures and is a non-GAAP measure. (2) Data for 2009 and prior years has not been adjusted for International Financial Reporting Standards “IFRS”. (3) Maintenance capex post 2014 based on an estimated $10/bbl; capital expenditures exclude capitalized interest post 2014.
3

Dividends reflect free cash flow over time (1,2)
(1) Includes distributions on trust units prior to Dec. 31/10 (2) Free cash flow (FCF) is cash flow from operations less capital expenditures and is a non-GAAP measure
Cumulative Dividends/FCF Annual Total Dividends
$ millions
$(1,000)
$-
$1,000
$2,000
$3,000
$4,000
$5,000
$6,000
$7,000
$8,000
$(300)
$-
$300
$600
$900
$1,200
$1,500
$1,800
$2,100
$2,400
2001 2002 2003 2004 2005 2006 2007 2008 2009 2010 2011 2012 2013
Dividends
Cumulative Dividends
Cumulative FCF

Highest yield amongst peers
6.2%*
2.2%
3.5%
1.0%
0.0%
2.5%
2.9%
2.0%
COS
Canadian Natural
Cenovus
Imperial
MEG
Suncor
S&P/TSX
S&P 500 Average
Source: Bloomberg as at March 26/14 *Based on price as at March 26/14 and dividend announced Jan. 30/14, annualized.
Note: COS does not target a specific yield .

COS investment catalysts
1. Higher production through improved reliability
2. Completion of remaining major projects
• Mildred Lake Mine Replacement (MLMR)
• Tailings Centrifuge Project
3. Market access
• Narrowing of SCO-WTI-Brent differentials
4. Market view of long-term oil prices
These four catalysts
represent potential
upside to COS’ share
price
Plus, COS offers:
Higher oil prices and
lower CAD than
assumed in our
current guidance
Solid finance plan and
a strong balance
sheet
6.2% yield*
* Yield as at March 26, 2014

COS has significantly outperformed the market over the long-term
Source: Bloomberg
Average compound annual return
14%
10%
8%
-100%
0%
100%
200%
300%
400%
500%
600%
700%
Dec-0
3
Apr-
04
Aug-0
4
Dec-0
4
Apr-
05
Aug-0
5
Dec-0
5
Apr-
06
Aug-0
6
Dec-0
6
Apr-
07
Aug-0
7
Dec-0
7
Apr-
08
Aug-0
8
Dec-0
8
Apr-
09
Aug-0
9
Dec-0
9
Apr-
10
Aug-1
0
Dec-1
0
Apr-
11
Aug-1
1
Dec-1
1
Apr-
12
Aug-1
2
Dec-1
2
Apr-
13
Aug-1
3
Dec-1
3
10 Year Cumulative Return as of December 31, 2013
Canadian Oil Sands
S&P/TSX Oil & Gas
S&P/TSX Composite

Appendix

Syncrude supported by Management Services Agreement with ExxonMobil and Imperial Oil
Canadian Oil Sands (COS)
25%
Suncor
Sinopec
36.74%
12%
Nexen (CNOOC)
7.23%
Murphy Oil
Mocal
5%
Imperial Oil
XOM/IMO provide global best practices, proprietary systems and staff expertise
JV ownership structure

COS: a premier pure-play oil sands investment
• Ticker: COS on Toronto Stock Exchange
• Shares outstanding: 484.6 million
• 52 week high / low / close1: $22.59 / $18.62 / $21.59
• Market cap: $10.9 billion1
• Enterprise value: $11.8 billion2
• Quarterly dividend amount: $0.35 per share3
• High dividend payout: 6.2%4
All figures in Canadian dollars 1. As at March 26/14. 2. As at March 26/14 and net debt at Dec. 31/13; non-GAAP measure. 3. Paid on Feb. 28/14 to shareholders of record on Feb. 21/14. 4. Based on close price as at March 26/14 and dividend announced on Jan. 30/14, annualized.

Demonstrating strong return on shareholders’ equity
Average ROE of 24% since 2001
Return on Equity calculated as net income divided by average shareholders’ equity; Net income as per COS’ financial statements
Return on shareholders’ equity is a non-GAAP measure.
$-
$5.00
$10.00
$15.00
$20.00
$25.00
$30.00
$35.00
$40.00
$45.00
0%
5%
10%
15%
20%
25%
30%
35%
40%
45%
2001 2002 2003 2004 2005 2006 2007 2008 2009 2010 2011 2012 2013
Pe
rce
nta
ge
Re
turn
Canadian Oil Sands' ROE
Return on Equity
Average ROE of 24%
Average Share Price

Bitumen production projects
2 mine train moves
2 new mine train builds
2 sustaining mine train builds
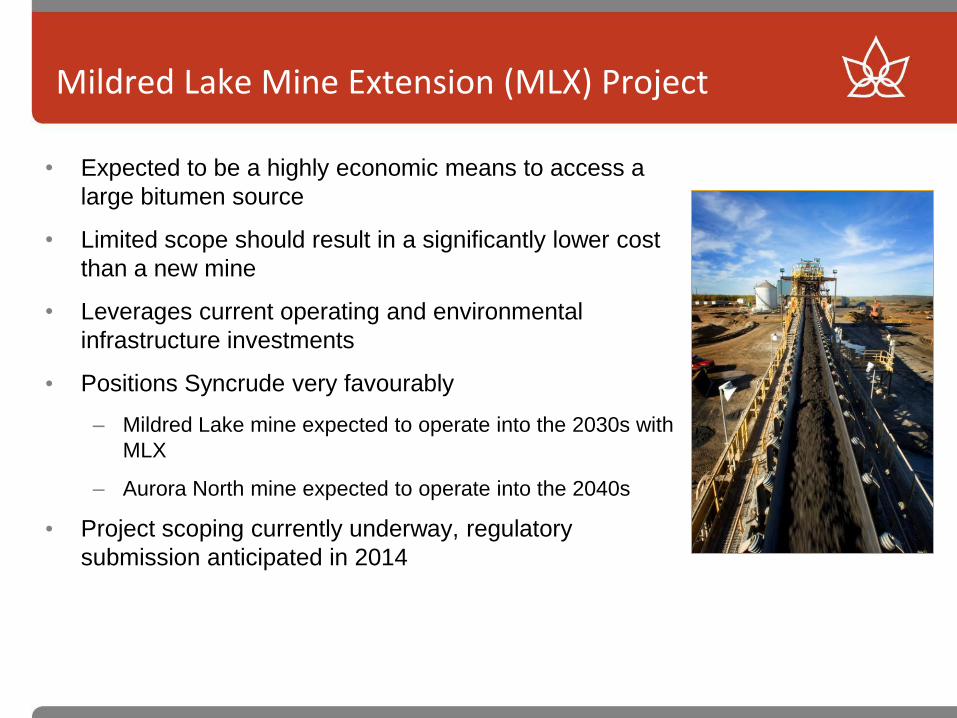
Mildred Lake Mine Extension (MLX) Project
• Expected to be a highly economic means to access a
large bitumen source
• Limited scope should result in a significantly lower cost
than a new mine
• Leverages current operating and environmental
infrastructure investments
• Positions Syncrude very favourably
– Mildred Lake mine expected to operate into the 2030s with
MLX
– Aurora North mine expected to operate into the 2040s
• Project scoping currently underway, regulatory
submission anticipated in 2014

A mine train processes oil sands ore
Surge bin
Crusher
Mix box
Hydrotransport
1
2
3
4
1 2
3
4

Access to Markets – Pipeline Expansions in Development
Source: CAPP

U.S. Oil Demand and Sources of Supply
Source: IEA Annual Energy Outlook 2012

Syncrude is a leader in sustainable oil sands development
Recognition
Reflects industry best practices
• Mining Association – Toward Sustainable Mining
• Canadian Association of Petroleum Producers – Responsible Canadian Energy Program
• Canadian Council for Aboriginal Business – Progress Aboriginal Relations Program
• Canadian Business for Social Responsibility
• Canadian Industry Program for Energy Conservation
Leading Research and Development
• Syncrude operates the industry’s only dedicated R&D centre
• Syncrude spends $60 million on R&D each year; one of Top 50 spenders in Canada
• Syncrude is a founding member of Canadian Oil Sands Network for Research and Development (CONRAD) and the Oil Sands Tailings Consortium (OSTC), which will be managed under the recently formed Canadian Oil Sands Industry Alliance (COSIA)
CSR Reporting • Syncrude publishes a bi-annual sustainability report
www.syncrudesustainability.com • Also publishes an annual Aboriginal Review

A responsible developer of the oil sands
Achievements at Syncrude
Reduced water intensity by 60% since the early 1980s
Recycle ~85% of water used
Responsible for ~70% of all reclaimed land in oil sands mining industry
Returned 3,400 hectares to nature
Planted nearly 7 million trees
One of Canada’s largest employers of Aboriginal peoples (~9% of workforce)
Conducted over $1.7 billion in business with Aboriginal companies since 1992
Over $6 million/year donated to community projects and initiatives

Oil sands industry GHG emissions are 3.5% of those of the U.S. coal industry
Source: U.S. DOE/EIA, Environment Canada 2009, CAPP

“Wells-to-wheels” CO2 emissions
Source: IHS CERA Special Report – Oil Sands Dialogue: Oil Sands, Greenhouse Gases, and US Oil Supply: Getting the Numbers Right, November 2012
Average oil
sands is
only 9%
more GHG
intensive
than
average
U.S. barrel

Environmental regulations
• GHG – Provincial regulations require 12% reduction in emission intensity over 2003 - 2005 average for
large emitters
• If not met, the emitter may:
– Pay $15/tonne levy into Climate Change and Emissions Management Fund
– Purchase Alberta based offset credits
– Purchase emission performance credits from a different Alberta facility.
– Federal government targeting 17% reduction by 2020 from 2005 levels
• Land – Alberta law requires land reclamation to productivity equal to or better than original
– Directive 074 - requirements to reduce tailings and accelerate reclamation
• Water – All existing and approved oil sands projects restricted to withdraw less than 3% of average
annual flow of Athabasca River
– Further restrictions during low flow periods; actual usage by industry less than 1% of average annual flow

Syncrude Crown royalty terms*
• Greater of 25% net bitumen revenue less capital and operating costs, or 1% of
gross bitumen revenue*
– Previously based on Synthetic Crude Oil (upgraded from bitumen) revenues
and costs
• Repay $1.25 billion plus interest over 25 years for previously deducted
upgrader growth capital
– Payments deferred during 1% royalty periods
• Pay an additional $975 million in royalties as per schedule:
– Amount will be prorated to extent Syncrude daily average bitumen production over 6-
year period less than 345 KBPD
* Terms and rates effective Jan. 1/09 to Dec. 31/15. The royalty agreements are available on the Corporation’s profile at www.sedar.com. Effective Jan. 1/16 New Royalty Framework rates apply.
2010 2011 2012 2013 2014 2015 Total
$75 mm $75 mm $100 mm $150 mm $225 mm $350 mm $975 mm
All figures gross to Syncrude

2014 Crown Royalty Calculation
1. Bitumen revenue is based on an SCO yield of 87% and a bitumen price equal to 60% of C$WTI. 2. Royalty rate is the greater of 25% of net revenue or 1% of revenue. 3. As part of the transition to the generic royalty regime, Syncrude is obligated to pay additional Crown Royalties of $975 million over 2010-
2015. The $57 million shown above is COS’ share of the 2014 expense based on accrual accounting; actual cash payments are per the schedule on previous slide. In any given year, the difference will be reflected as a change in Crown royalty payable.
See COS’ 2012 Annual MD&A dated Feb. 20/14 for further discussion on Crown royalties.
Based on 2014 Outlook provided Jan. 30/14
SCO % Mining Bitumen
Revenue1 3,386 2,469
Operating expenses (1,600) 80% (1,280)
Non-production costs (181) 80% (145)
Capital expenditures (1,014) 85% (862)
Net revenue 182
Crown royalty2 46
Upgrader growth capital recapture payment 25
Additional Crown royalty expense3 57
Total Crown royalty 128
Crown royalty (per bbl) $3.32