Embed Size (px)
Citation preview

Tine Jeppesen FIW Research ConferenceViennaDecember 10th 2010

2
Research Question and Motivation Contributions of paper Theory & Literature Data & Empirical methodology Results Conclusion

3
Does FDI affect the export participation and performance of domestic firms?
What are the channels of export spillovers?◦ Horizontal / Vertical linkages
Research Question & Motivation
4
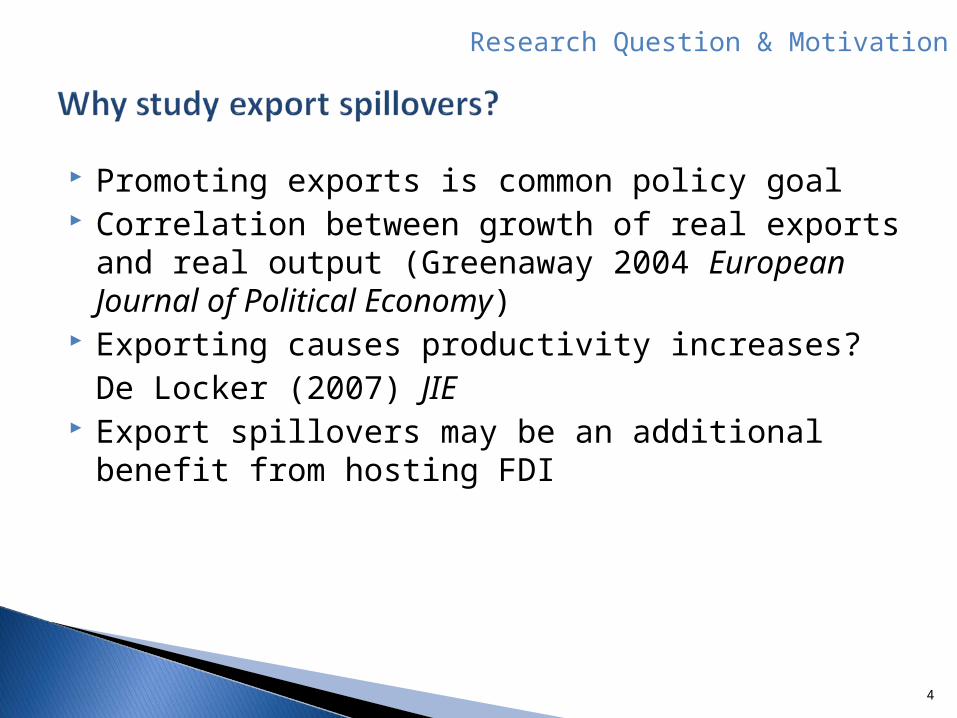
Promoting exports is common policy goal Correlation between growth of real exports and real output
(Greenaway 2004 European Journal of Political Economy) Exporting causes productivity increases?
De Locker (2007) JIE Export spillovers may be an additional benefit from hosting
FDI
Research Question & Motivation

5
Evidence from multiple countries
Region where FDI is increasing rapidly
Firm-level information on vertical linkages
Contributions

6
Findings in empirical literature on export behaviour◦ Sunk costs (Roberts & Tybout, 1997)◦ Exporter are more productive than non-exporters (Bernard & Jensen ; Melitz, 2003)
MNEs can affect export performance of domestic firms by◦ Lowering sunk costs ◦ Increasing domestic productivity
Theory & Literature
7
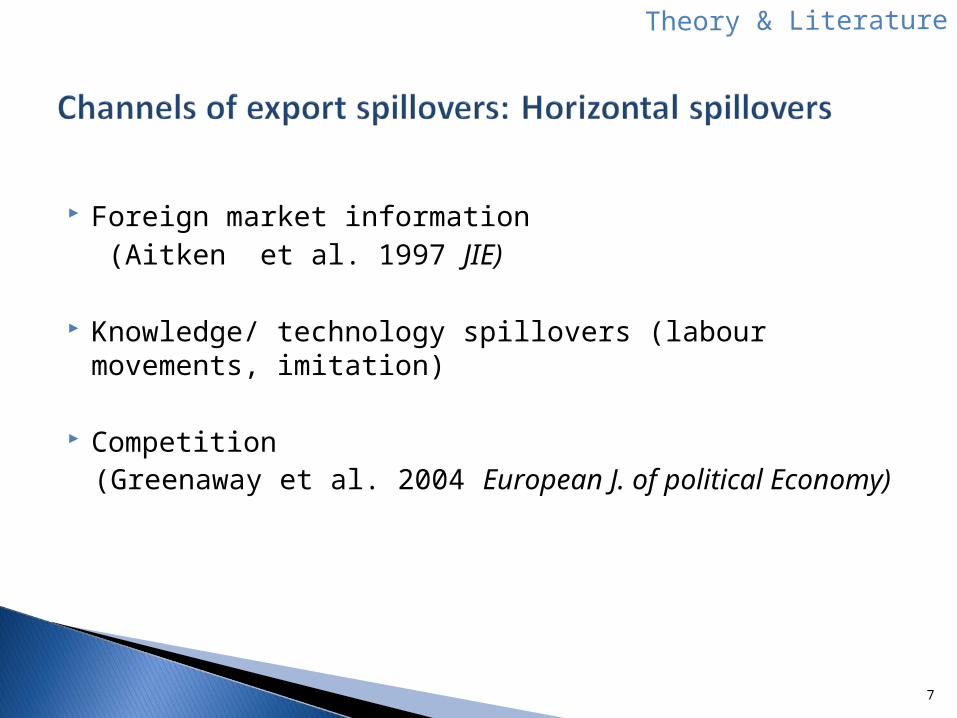
Foreign market information (Aitken et al. 1997 JIE)
Knowledge/ technology spillovers (labour movements, imitation)
Competition (Greenaway et al. 2004 European J. of political Economy)
Theory & Literature

8
Greater scope for spillovers? (Javorcik, 2004 AER)
Evidence of productivity spillovers to upstream industries in Eastern Europe (Javorcik, 2004 AER ; Gorodnichenko et al. 2007 IZA; Javorcik and Spatareanu, 2009)
Information, reputational effects
Theory & Literature

9
Enterprise Surveys, The World Bank Group Firm-level data
Survey rounds: 2002, 2005, 2008/09
Survey universe ‘commercial, service or industrial business establishments with at least five fulltime employees’
2002 and 2005: Quota Sampling 2008/09: Stratified random sampling
Data and empirical methodology

10
23 countries
Albania, Armenia, Azerbaijan, Belarus, Bulgaria, Croatia, Czech Rep. Estonia, Georgia, Hungary, Kazakhstan, Kyrgyz Rep. Latvia, Lithuania, Moldova, Poland, Romania, Russia, Slovakia, Slovenia, Tajikistan, Turkey, Ukraine.
Manufacturing industries ISIC Rev.3.1: 15-37
Small, medium and large firms
Data and empirical methodology

11
Multinationals are bigger, more productive, use a higher share of foreign inputs, supply a higher share of inputs to other multinationals and are more export oriented than domestic firms.
The same differences are found between domestic exporters and non-exporters.
Data and empirical methodology

12
Heckman selection model
Exclusion restriction: International quality certification (ISO 9000, ISO 1400)
Model is estimated only on domestic firms. Exclude government owned enterprises.
Small sample size: Only include industries with more than 5 firms
Data and empirical methodology

13
Horizontal
◦ Hor_empjkt
◦ Hor_expjkt
Vertical
◦ Share of output sold to MNE within the country (2002, 2005)◦ Share of inputs of foreign origin
jkt
fjkt
emp
emp
jkt
fjkt
Exp
Exp
Data and empirical methodology

14
Industry level controls◦ Industry share of total country exports◦ Industry share of total country employment
Standard firm-level controls◦ Labour productivity◦ Employment ◦ Age
Country, year, industry dummies
Data and empirical methodology

15
VariableMean non-exporters
Mean exporters Difference
Log of employment 3.061499 4.144874-1.08338***Log of labour productivity 9.715138 10.39924-0.6841***
Age 14.34825 20.32116-5.97291***
MNE Sales 0.030327 0.07388-0.04355***
Foreign Input 0.237899 0.372583-0.13468***Quality certificate 0.184263 0.434153-0.24989***
*** p<0.01, ** p<0.05, * p<0.1

16
Data and empirical methodology
0.2
.4.6
.81
Ind
ustr
y E
xp
ort
Sh
are
0 .2 .4 .6 .8 1Foreign Employment Share
Expshare_ind 95% CI
Fitted values
0.2
.4.6
.81
Ind
ustr
y E
xp
ort
Sh
are
0 .2 .4 .6 .8 1Foreign Export Share
Expshare_ind 95% CI
Fitted values
Industry Export Share & Foreign Presence

17
Excluding vertical linkages Including vertical linkagesParticipation Performance Participation Performance
(1) (2) (3) (4)Hor_emp 0.105 0.791*** -0.0194 0.582*Hor_exp -0.179 -0.754*** -0.288 -0.840***Mnesales 0.617*** 0.423*Foreign input 0.518*** 0.337*Expshare_ind 0.979*** 0.724** 0.279 0.767*Empshare_ind 0.117 -0.244 2.090*** 0.277log employment 0.516*** 1.404*** 0.416*** 1.495***log employment2 -0.0142 -0.0275*** -0.00212 -0.0429**log labour prod. 0.154 0.908*** -0.19 1.300***log labour prod.2 0.000632 0.00418 0.0196** -0.0141Age 0.0017 -0.00564*** 0.0034 -0.00086Quality certificate 0.304*** 0.321***Number obs. 5734 2249Uncensored obs. 1752 593Log Likelihood -5369.27 -1805.3ρ 0.215*** 0.317***
Results: All Firms
*** p<0.01, ** p<0.05, * p<0.1Clustered adjusted standard errors in parentheses
all regressions include country, year and industry dummies.Wald test rejects independence between participation and performance equation
Constant not shown

18
Results: Small Firms
*** p<0.01, ** p<0.05, * p<0.1Clustered adjusted standard errors in parentheses
all regressions include country, year and industry dummies.Wald test rejects independence between participation and performance equation
Constant not shown
Excluding vertical linkages Including vertical linkages
Participation Performance Participation Performance (1) (2) (3) (4)
Hor_emp -0.204 0.316 -0.236 -0.598
Hor_exp 0.095 -0.271 0.149 0.249
Mnesales 0.724*** 1.220***
Foreign input 0.400*** 0.642***
Expshare_ind 0.798** 1.456** -0.638 -1.929
Empshare_ind 0.2 -1.688 4.261*** 1.789
log employment 0.289 2.208*** 0.438 1.571**
log employment2 0.036 -0.24 -0.0188 -0.089
log labour prod. -0.17 0.907*** -1.658*** 1.577***
log labour prod.2 0.0206 0.00535 0.0917*** -0.0246
Age -0.000538 -0.0182** 0.00371 -0.0227**Quality certificate 0.298*** 0.469***Number obs. 2563 1233
Uncensored obs. 399 178
Log Likelihood -1502.16 -608.4ρ 0.327** 0.453*
19
Excluding vertical linkages Including vertical linkages
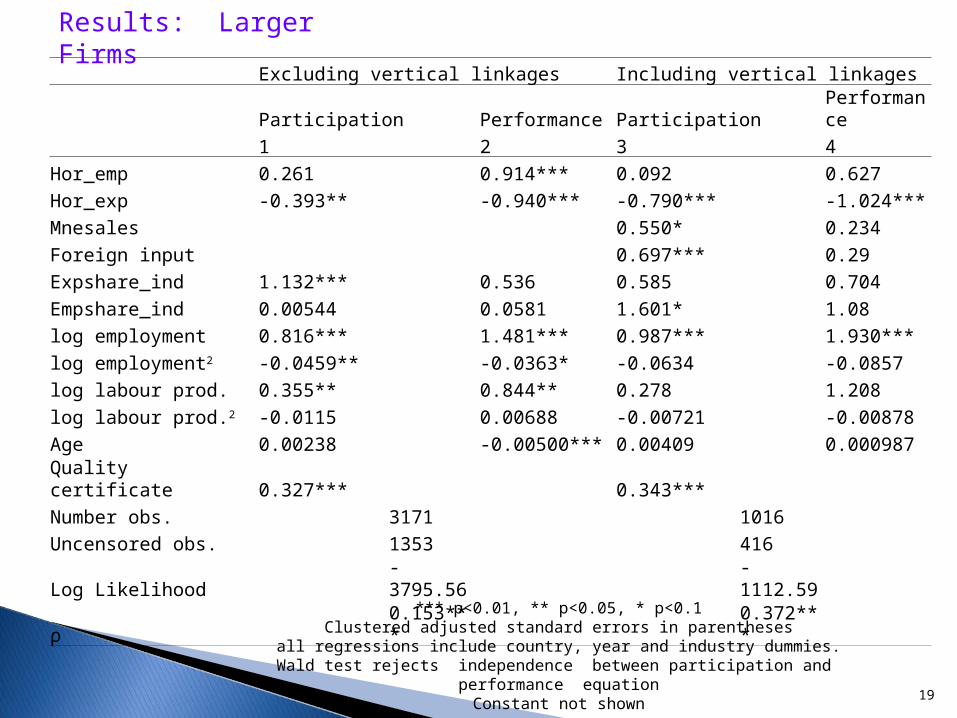
Participation Performance Participation Performance 1 2 3 4Hor_emp 0.261 0.914*** 0.092 0.627Hor_exp -0.393** -0.940*** -0.790*** -1.024***Mnesales 0.550* 0.234Foreign input 0.697*** 0.29Expshare_ind 1.132*** 0.536 0.585 0.704Empshare_ind 0.00544 0.0581 1.601* 1.08log employment 0.816*** 1.481*** 0.987*** 1.930***log employment2 -0.0459** -0.0363* -0.0634 -0.0857log labour prod. 0.355** 0.844** 0.278 1.208log labour prod.2 -0.0115 0.00688 -0.00721 -0.00878Age 0.00238 -0.00500*** 0.00409 0.000987Quality certificate 0.327*** 0.343***Number obs. 3171 1016Uncensored obs. 1353 416Log Likelihood -3795.56 -1112.59
ρ 0.153*** 0.372***
Results: Larger Firms
*** p<0.01, ** p<0.05, * p<0.1Clustered adjusted standard errors in parentheses
all regressions include country, year and industry dummies.Wald test rejects independence between participation and performance equation
Constant not shown

20
Effect of MNEs on domestic export performance is complex
Different effects of horizontal and vertical spillovers
Vertical linkages positively affects both export participation and intensity. Underlines importance of local linkages.
Conclusion