Embed Size (px)
Citation preview
National Environmental Research InstituteMinistry of the Environment . Denmark
Thermal Animal DetectionSystem (TADS)Development of a method for estimating collisionfrequency of migrating birds at offshore wind turbines
NERI Technical Report, No. 440
National Environmental Research InstituteMinistry of the Environment . Denmark
Thermal Animal DetectionSystem (TADS)Development of a method for estimating collisionfrequency of migrating birds at offshore wind turbines
NERI Technical Report, No. 4402003
Mark Desholm
Data sheet
Title: Thermal Animal Detection System (TADS)Subtitle: Development of a method for estimating collision frequency of migrating birds at
offshore wind turbines
Author: Mark DesholmDepartment: Department of Coastal Zone Ecology
Serial title and number: NERI Technical Report, no. 440
Publisher: National Environmental Research Institute©Ministry of the Environment
URL: www.dmu.dk
Date of publication: March 2003
Editor: Jan BertelsenReferee: Anthony D. Fox & Johnny Kahlert
Financial support: Elkraft System, PSO-F&U
Please cite as: Desholm, M. 2003: Thermal Animal Detection System (TADS). Development of a methodfor estimating collision frequency of migrating birds at offshore wind turbines. NationalEnvironmental Research Institute, Denmark. 27 pp. - NERI Technical Report No 440.http://faglige-rapporter.dmu.dk
Reproduction is permitted, provided the source is explicitly aknowledged.
Key words: Thermography, thermal video camera, flying birds, wind turbines, collision risk
Layout: Helle KlareskovProofreading: Else-Marie Nielsen
ISBN: 87-7772-731-2ISSN (electronic): 1600-0048
Number of pages: 27
Internet-version: The report is only available in electronic format from NERI's homepagehttp://www.dmu.dk/1_viden/2_Publikationer/3_fagrapporter/rapporter/FR440.pdf
For sale at: Ministry of the EnvironmentFrontlinienStrandgade 29DK-1401 København KDenmarkTel: +45 32 66 02 [email protected]
3
Contents
Synopsis 5
1 Introduction 7
2 Methods 9
2.1 Thermography 9
2.2 Equipment 9
2.3 Tests 13
2.3.1 Technical tests 132.3.2 Experimental tests on birds 132.3.3 Estimating the number of collisions 15
2.4 Quality control 15
3 Results 17
3.1 Technical tests 17
3.2 Experimental tests on birds 17
4 Discussion and conclusions 21
4.1 Technical tests 21
4.2 Experimental tests on birds 21
4.3 Conclusions 22
5 References 25
National Environmental Research Institute
Faglige rapporter fra DMU/NERI Technical Reports

4
5
This report presents data from equipment testsand software development for the Thermal Ani-mal Detection System (TADS) developmentproject: 'Development of a method for estimat-ing collision frequency between migrating birdsand offshore wind turbines'.
The technical tests were performed to investigatethe performance of remote controlling, video filecompression tool and physical stress of the ther-mal camera when operating outdoors and underthe real time vibration conditions at a 2 MW tur-bine. Furthermore, experimental tests on birdswere performed to describe the decreasing detect-ability with distance on free flying birds, the per-
formance of the thermal camera during poor vis-ibility, and finally, the performance of the ther-mal sensor software developed for securing high-quality data.
In general, it can be concluded that the thermalcamera and its related hardware and software,the TADS, are capable of recording migratingbirds approaching the rotating blades of a turbine,even under conditions with poor visibility. If theTADS is used in a vertical viewing scenario itwould comply with the requirements for a set-up used for estimating the avian collision fre-quency at offshore wind turbines.
Synopsis

6
7
The project 'Development of a method for esti-mating collision frequency between migratingbirds and offshore wind turbines' arose from theneed to develop a method capable of recordingthe number of avian collisions with Danish off-shore wind turbines. Following an internationalwork-shop on offshore wind farms and birds ar-ranged by NERI at the Fuglsø Center, Denmark,in November 2001 (NERI in prep.), it has becomeclear that such a method to record collisions isalso an urgent international requirement, as largeoffshore wind farms are planned to be erected inimportant marine bird areas in many Europeancountries. Several studies have demonstrated thatbirds collide with wind turbines in terrestrialhabitats (e.g. Pedersen & Poulsen 1991, Winkel-man 1992), but conditions for monitoring impactsat sea are very different from those on land. Col-lisions are also likely to occur in offshore areas,although little information exists on this subject.Hence, methods for estimating the collision fre-quency at sea also have to be developed.
The following ideal characteristics were definedas prerequisites required of any method devel-oped to estimate collision frequency of birds atoffshore wind turbines:
• As previous studies have suggested that colli-sion risk is highest at night and during peri-ods of poor visibility (fog, rain or snow), themethods must be applicable under these con-ditions;
• as collisions most likely will occur as very lowfrequency discrete events, an automated sys-tem which can collect data in the absence ofan operator is preferable and most cost effec-tive;
• as different bird species will show differentcollisions frequencies, a method capable ofdiscriminating between the species or groupsof species is needed;
• as birds have been documented to be injuredwhen caught in the wind turbulence vorticesassociated with the rotating blades, the methodshould be able to register these collisions also;
• as the study will be conducted offshore thesystem must be applicable in marine environ-ments.
Out of several different methods considered forestimating collision frequency, remote thermo-graphic monitoring, relying on a heat sensiblevideo camera (hereafter referred to as the 'ther-mal camera'), complied most with the ideal re-quirements.
This final report presents the results obtainedfrom equipment tests and software developmentfor the Thermal Animal Detection System (TADS)project: 'Development of a method for estimat-ing collision frequency between migrating birdsand offshore wind turbines'. The project was fi-nanced by Elkraft System, PSO-F&U and wasconducted in collaboration between SEAS WindEnergy Centre and National Environmental Re-search Institute (NERI), Department of CoastalZone Ecology.
I would like to thank Henrik Quist from Præci-sionsTeknik A/S for technical assistance and thepeople from ENERGI E2 A/S for their practicalhelp in the installation process at the Rødbyhavnturbine. Finally, I thank Bonus Energy A/S forhelping with the data transmission from Rødby-havn to my office at NERI.
1 Introduction

8
9
2.1 Thermography
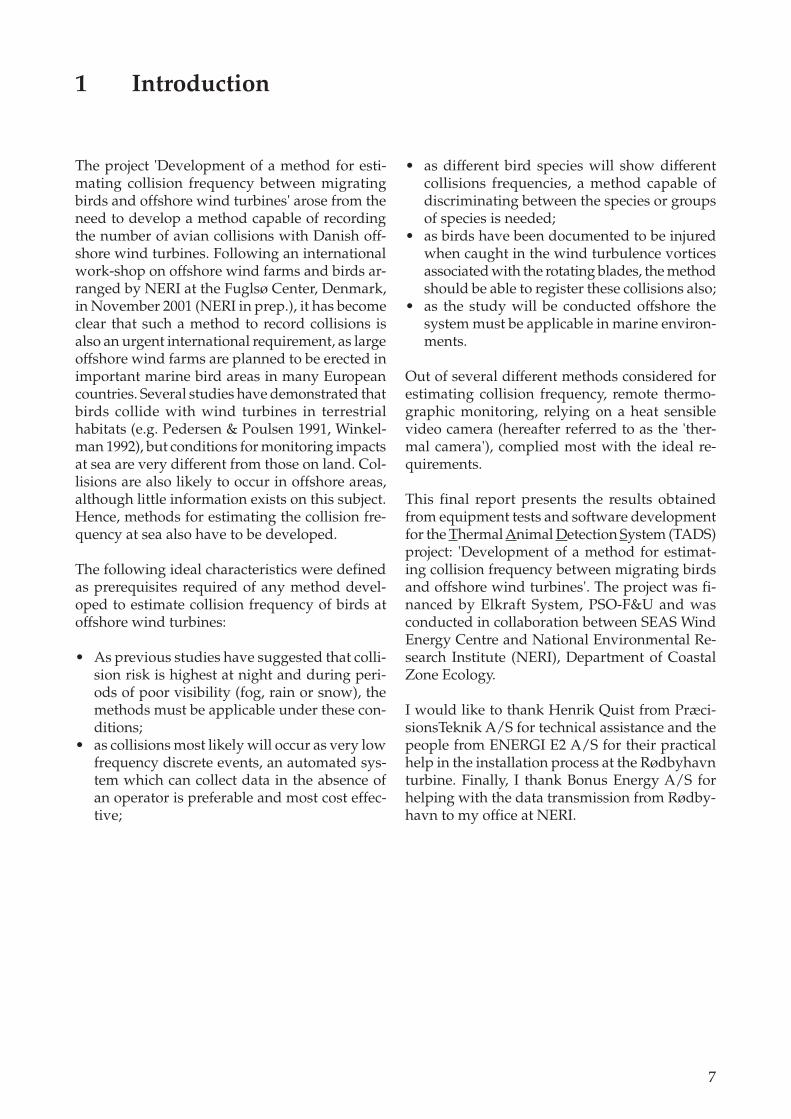
All objects with a temperature above absolutezero, i.e. -273°C, radiate heat. Thermography is amethod by use of which images of objects areobtained by measuring their own, and the re-flected, heat radiation within the infrared spec-trum of wave lengths of 2-15 m, and it contraststhe ordinary photographic images which resultfrom the reflection of visible light (Fig. 1).
The thermal camera is positioned at some dis-tance from the object, so the radiation passesthrough the atmosphere before reaching the cam-era. As the radiation is transmitted through theatmosphere, it is subject to a degree of attenua-tion due to particles, water vapour and mixtureof gases in the air. Finally, the radiation reachesthe thermal camera via a lens. The lens is madeof germanium as IR-radiation is fully absorbedby glass. This is exemplified in Figure 1, whichshows lower temperature of the glass in the sun-glasses than of the surrounding face. The cameralens focuses the heat radiation onto the heat ra-diation sensors. These elements are called the in-frared detectors and transform the received ra-diation into an electrical signal, which is thenprocessed into a visible image, i.e. the thermo-gram.
2.2 Equipment
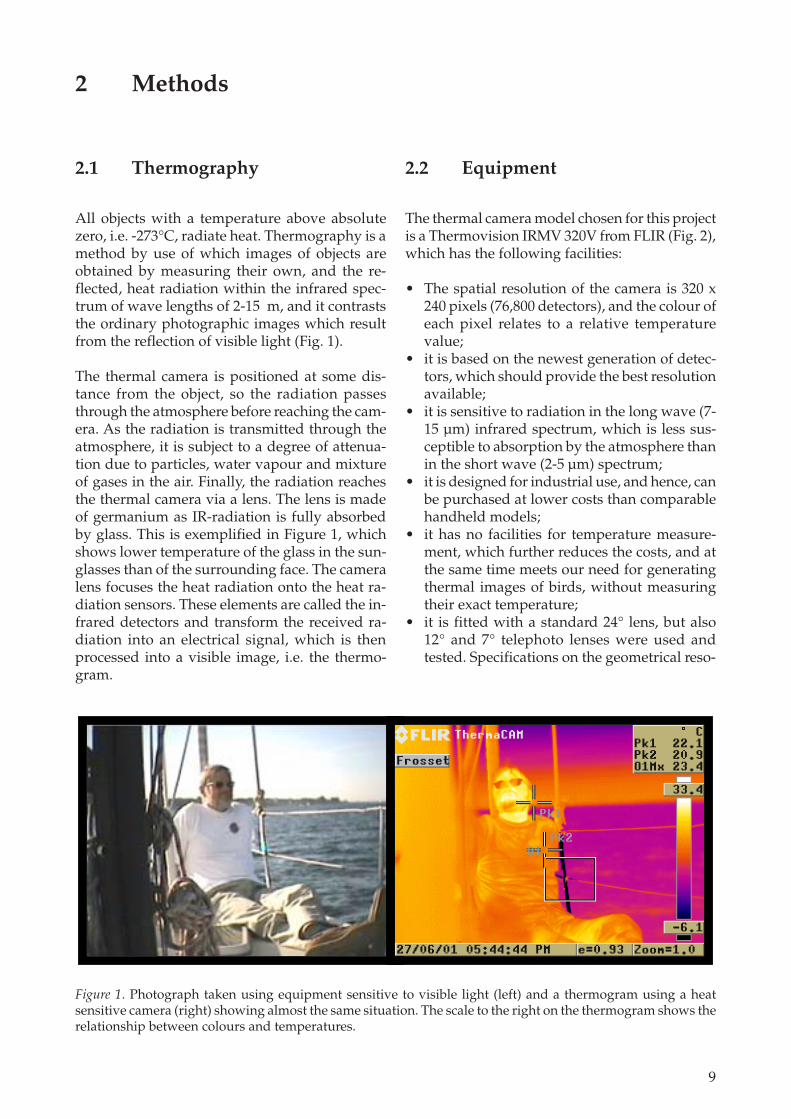
The thermal camera model chosen for this projectis a Thermovision IRMV 320V from FLIR (Fig. 2),which has the following facilities:
• The spatial resolution of the camera is 320 x240 pixels (76,800 detectors), and the colour ofeach pixel relates to a relative temperaturevalue;
• it is based on the newest generation of detec-tors, which should provide the best resolutionavailable;
• it is sensitive to radiation in the long wave (7-15 µm) infrared spectrum, which is less sus-ceptible to absorption by the atmosphere thanin the short wave (2-5 µm) spectrum;
• it is designed for industrial use, and hence, canbe purchased at lower costs than comparablehandheld models;
• it has no facilities for temperature measure-ment, which further reduces the costs, and atthe same time meets our need for generatingthermal images of birds, without measuringtheir exact temperature;
• it is fitted with a standard 24° lens, but also12° and 7° telephoto lenses were used andtested. Specifications on the geometrical reso-
2 Methods
Figure 1. Photograph taken using equipment sensitive to visible light (left) and a thermogram using a heatsensitive camera (right) showing almost the same situation. The scale to the right on the thermogram shows therelationship between colours and temperatures.
10
lution and horizontal image size for the threelenses are given in Tables 1 and 2.
For more details on the camera model Thermovi-sion IRMV 320V see specifications at the Internetsite:
http://www.flirthermography.com/sweden/cameras/infrared_camera_complete/1004/.
The camera was installed in a waterproof metalbox with remote-controlled windscreen wiperand sprinkler system (see Fig. 2), and the sprin-kler liquid should contain at least 20% alcohol toprevent freezing. The box had a window penetra-ble by IR-radiation. The camera was mounted onthe turbine with a specially designed mountingdevice made of steel (Fig. 3). This device made itpossible to manually turn the field of view in dif-ferent directions. To dampen the effects of the vi-brations from the turbine, vibration absorbersmade of rubber were fitted both between the boxand the base plate of the mount, and between themounting and the turbine (see Fig. 3).
The equipment must be lightning-shielded in or-der to secure the power installations within theturbine itself.
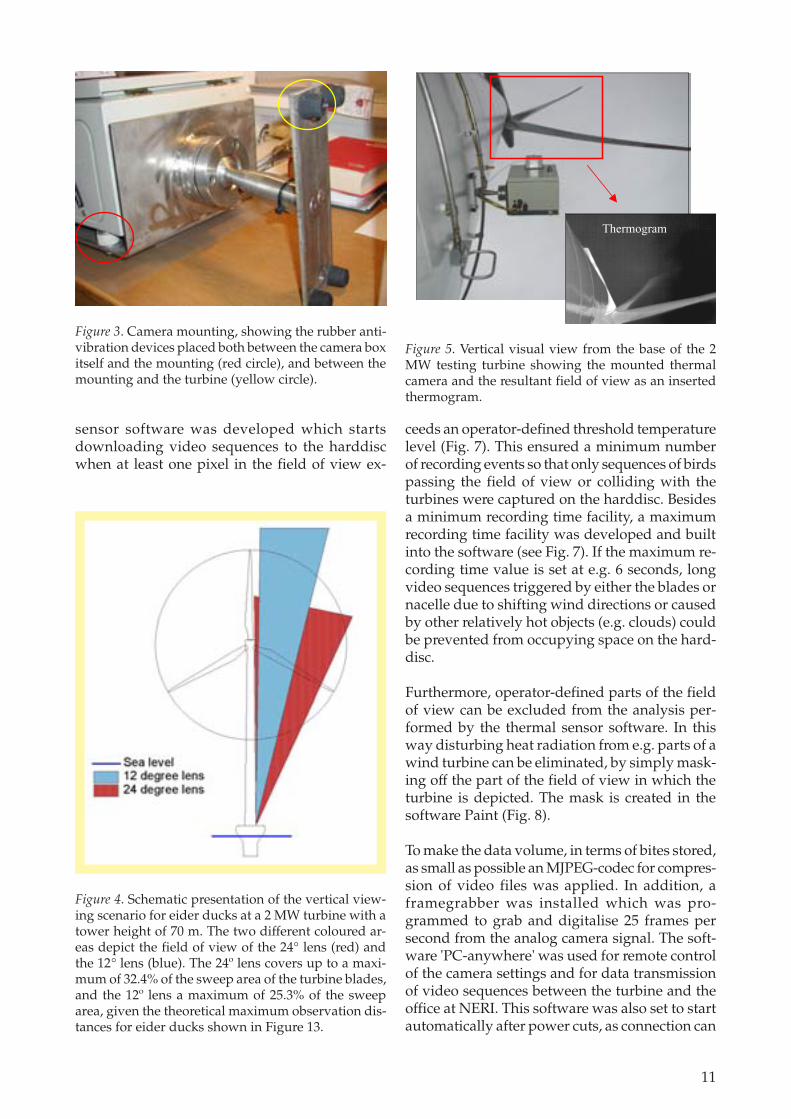
In the present study, the TADS was tested at asingle land-based 2 MW turbine (Figs. 4 and 5).The thermal camera was mounted in a verticalposition c. 4 m above ground level to create a ver-tical viewing scenario. In the tests, a 12º lens wasused and it covered c. 25% of the sweeping area,defined as the two-dimensional area swept by theblades of the turbine (see Fig. 4).
At the turbine, a computer placed inside the tur-bine tower was connected directly to the thermalcamera (Fig. 6). This computer was an 800 MHzPentium 3 which is fast and powerful enough tohandle, and temporarily, store large digital videofiles. The turbine computer was set to restart au-tomatically after unintended power cuts, as man-ual restarts are rather expensive at offshore instal-lations.
Within the present development project, thermal
Figure 2. Waterproof metal camera housing box with windscreen wiper (left) and the thermal camera inside(right).
HIS (m)
7°
12°
24°
10 m
1.2
2.1
4.2
100 m
12.2
21.0
42.0
200 m
24.4
42.0
84.0
450 m*
54.9
94.5
189.0
500 m
61.0
105.0
210.0
1000 m
122.0
210.0
420.0
5000 m
610.0
1050.0
2100.0
Table 1. Horizontal image size (HIS; in metres) forthe three types of lenses tested in the present projectat distances of 10-5,000 metres between the lens andthe object. HIS represents the distance dependenthorizontal span of the field of view measured at agiven distance from the camera in units of metres.* denotes the minimum distance between turbinesat the Rødsand/Nysted wind farm.
GR (mm)
7°
12°
24°
10 m
3.6
6.6
13.0
100 m
38.0
66.0
130.0
200 m
76.0
132.0
260.0
450 m*
171.0
297.0
585.0
500 m
190.0
330.0
650.0
1000 m
380.0
660.0
1300.0
5000 m
1900.0
3300.0
6500.0
Table 2. Geometrical resolution (GR; in millimetres)for the three types of lenses tested in the presentproject at distances of 10-5,000 metres between thelens and the object. GR represents the distance de-pendent horizontal span of each pixel measured ata given distance from the camera in units of milli-metres. * denotes the minimum distance betweenturbines at the Rødsand/Nysted wind farm.
11
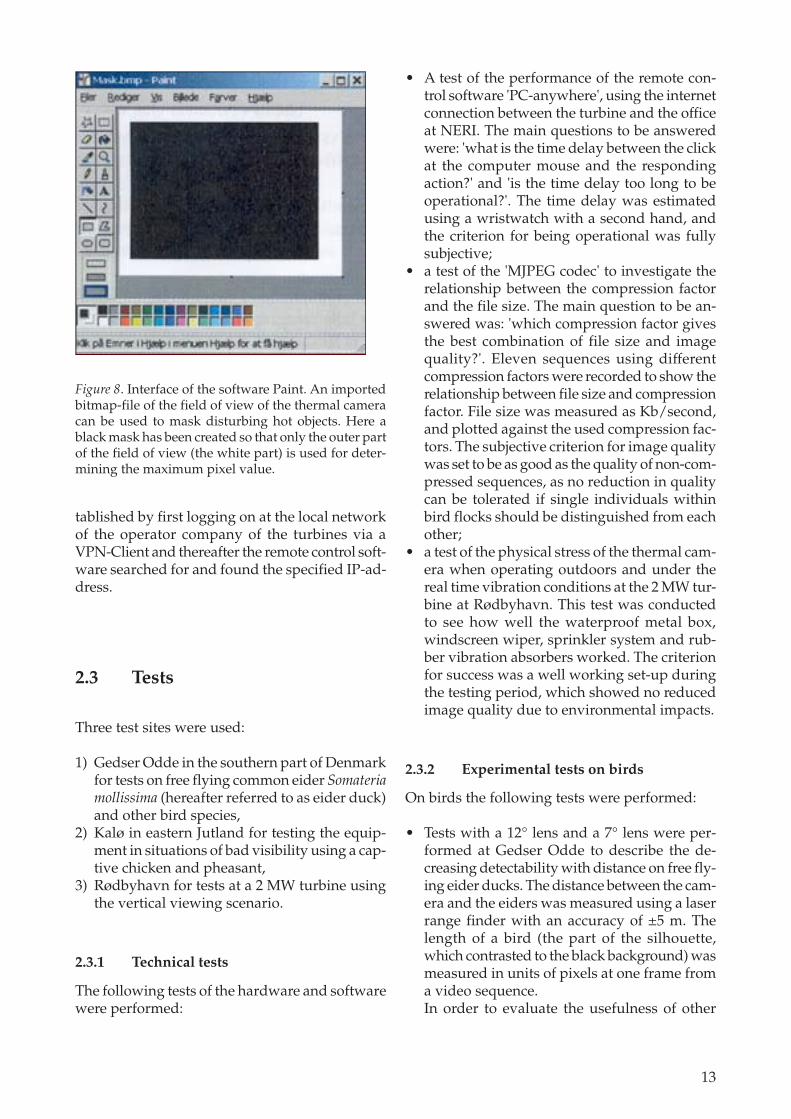
sensor software was developed which startsdownloading video sequences to the harddiscwhen at least one pixel in the field of view ex-
ceeds an operator-defined threshold temperaturelevel (Fig. 7). This ensured a minimum numberof recording events so that only sequences of birdspassing the field of view or colliding with theturbines were captured on the harddisc. Besidesa minimum recording time facility, a maximumrecording time facility was developed and builtinto the software (see Fig. 7). If the maximum re-cording time value is set at e.g. 6 seconds, longvideo sequences triggered by either the blades ornacelle due to shifting wind directions or causedby other relatively hot objects (e.g. clouds) couldbe prevented from occupying space on the hard-disc.
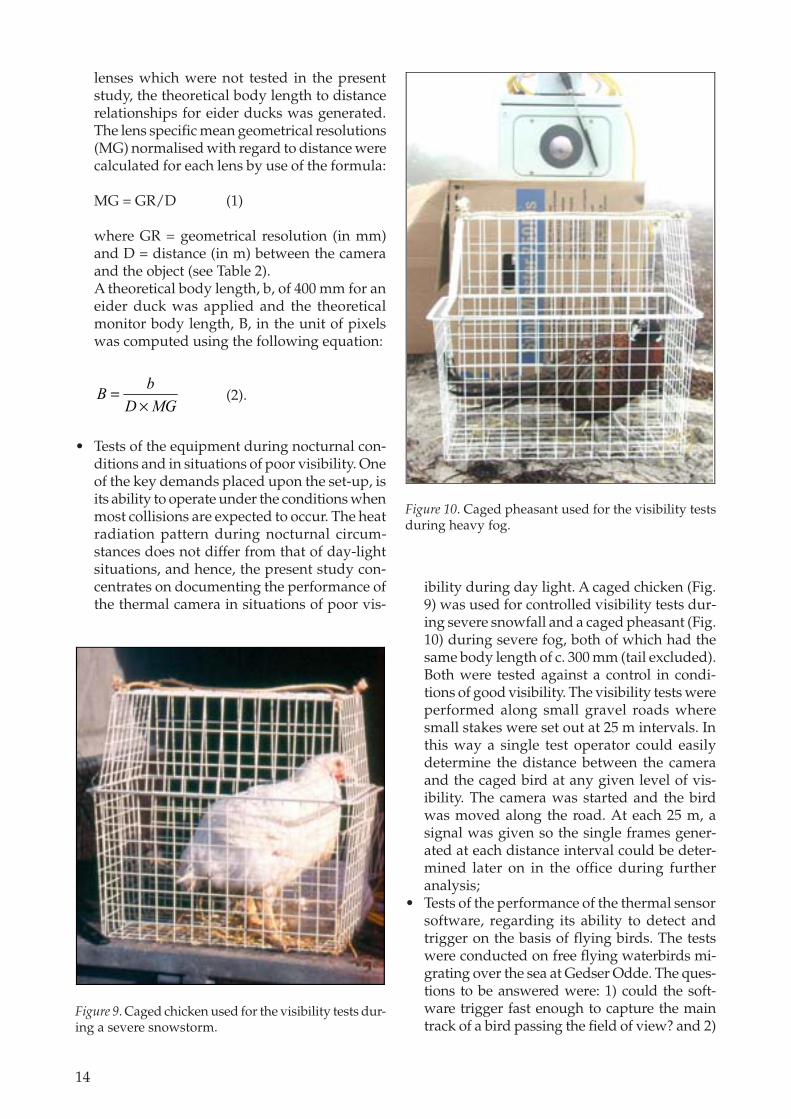
Furthermore, operator-defined parts of the fieldof view can be excluded from the analysis per-formed by the thermal sensor software. In thisway disturbing heat radiation from e.g. parts of awind turbine can be eliminated, by simply mask-ing off the part of the field of view in which theturbine is depicted. The mask is created in thesoftware Paint (Fig. 8).
To make the data volume, in terms of bites stored,as small as possible an MJPEG-codec for compres-sion of video files was applied. In addition, aframegrabber was installed which was pro-grammed to grab and digitalise 25 frames persecond from the analog camera signal. The soft-ware 'PC-anywhere' was used for remote controlof the camera settings and for data transmissionof video sequences between the turbine and theoffice at NERI. This software was also set to startautomatically after power cuts, as connection can
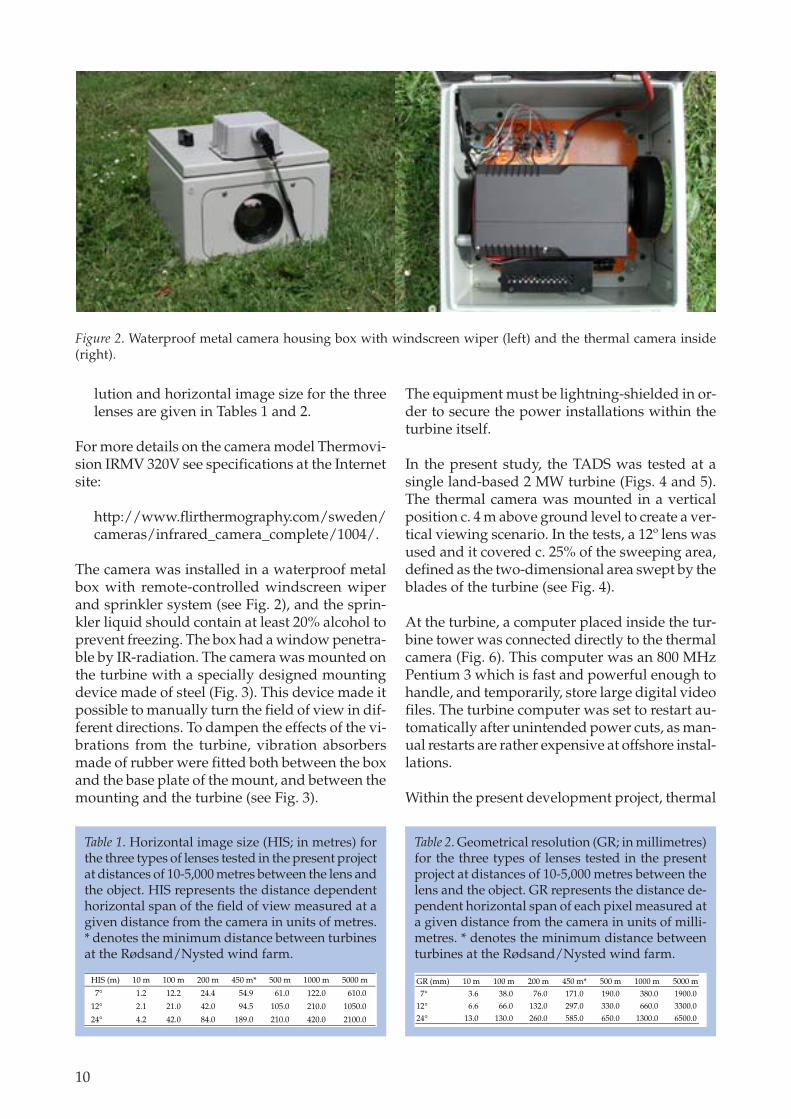
Figure 3. Camera mounting, showing the rubber anti-vibration devices placed both between the camera boxitself and the mounting (red circle), and between themounting and the turbine (yellow circle).
Figure 4. Schematic presentation of the vertical view-ing scenario for eider ducks at a 2 MW turbine with atower height of 70 m. The two different coloured ar-eas depict the field of view of the 24° lens (red) andthe 12° lens (blue). The 24º lens covers up to a maxi-mum of 32.4% of the sweep area of the turbine blades,and the 12º lens a maximum of 25.3% of the sweeparea, given the theoretical maximum observation dis-tances for eider ducks shown in Figure 13.
Thermogram
Figure 5. Vertical visual view from the base of the 2MW testing turbine showing the mounted thermalcamera and the resultant field of view as an insertedthermogram.
12
only be achieved if the remote control software isrunning.
The base computer in the turbine is remote con-trolled from the computer at the NERI office,
Computer at the turbine
Computer at the office
Camera at the turbine
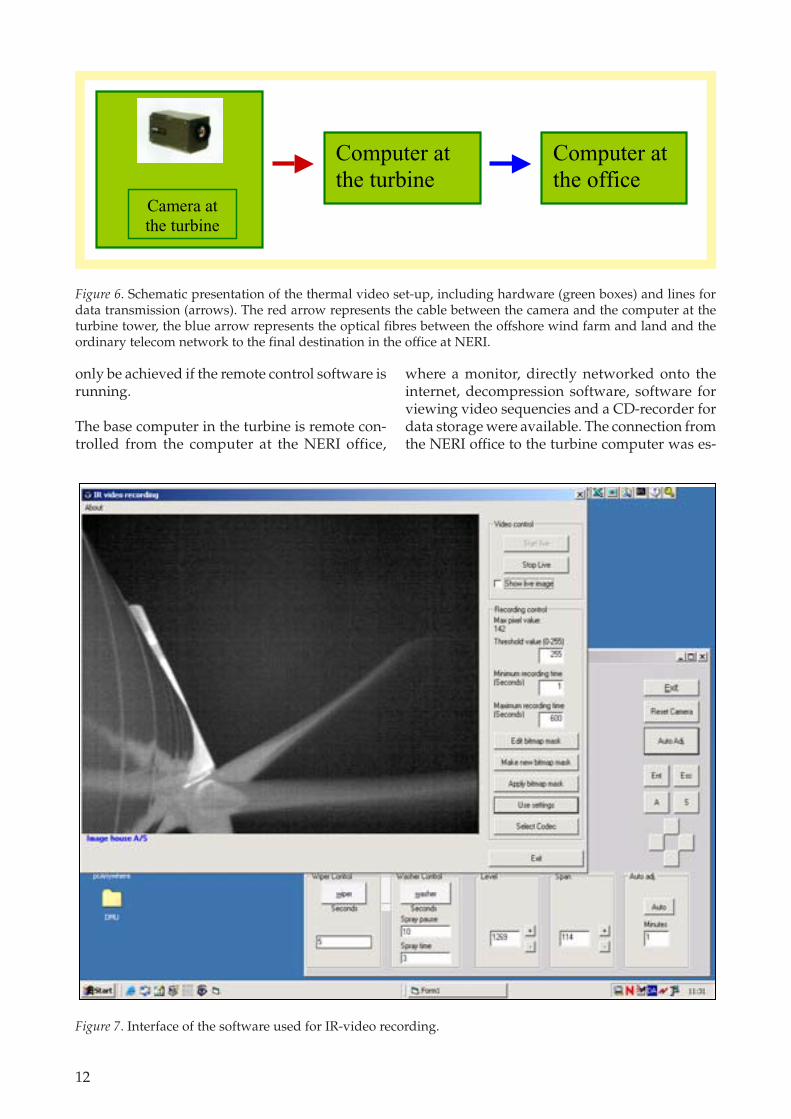
Figure 6. Schematic presentation of the thermal video set-up, including hardware (green boxes) and lines fordata transmission (arrows). The red arrow represents the cable between the camera and the computer at theturbine tower, the blue arrow represents the optical fibres between the offshore wind farm and land and theordinary telecom network to the final destination in the office at NERI.
where a monitor, directly networked onto theinternet, decompression software, software forviewing video sequencies and a CD-recorder fordata storage were available. The connection fromthe NERI office to the turbine computer was es-
Figure 7. Interface of the software used for IR-video recording.
13
tablished by first logging on at the local networkof the operator company of the turbines via aVPN-Client and thereafter the remote control soft-ware searched for and found the specified IP-ad-dress.
2.3 Tests
Three test sites were used:
1) Gedser Odde in the southern part of Denmarkfor tests on free flying common eider Somateriamollissima (hereafter referred to as eider duck)and other bird species,
2) Kalø in eastern Jutland for testing the equip-ment in situations of bad visibility using a cap-tive chicken and pheasant,
3) Rødbyhavn for tests at a 2 MW turbine usingthe vertical viewing scenario.
2.3.1 Technical tests
The following tests of the hardware and softwarewere performed:
• A test of the performance of the remote con-trol software 'PC-anywhere', using the internetconnection between the turbine and the officeat NERI. The main questions to be answeredwere: 'what is the time delay between the clickat the computer mouse and the respondingaction?' and 'is the time delay too long to beoperational?'. The time delay was estimatedusing a wristwatch with a second hand, andthe criterion for being operational was fullysubjective;
• a test of the 'MJPEG codec' to investigate therelationship between the compression factorand the file size. The main question to be an-swered was: 'which compression factor givesthe best combination of file size and imagequality?'. Eleven sequences using differentcompression factors were recorded to show therelationship between file size and compressionfactor. File size was measured as Kb/second,and plotted against the used compression fac-tors. The subjective criterion for image qualitywas set to be as good as the quality of non-com-pressed sequences, as no reduction in qualitycan be tolerated if single individuals withinbird flocks should be distinguished from eachother;
• a test of the physical stress of the thermal cam-era when operating outdoors and under thereal time vibration conditions at the 2 MW tur-bine at Rødbyhavn. This test was conductedto see how well the waterproof metal box,windscreen wiper, sprinkler system and rub-ber vibration absorbers worked. The criterionfor success was a well working set-up duringthe testing period, which showed no reducedimage quality due to environmental impacts.
2.3.2 Experimental tests on birds
On birds the following tests were performed:
• Tests with a 12° lens and a 7° lens were per-formed at Gedser Odde to describe the de-creasing detectability with distance on free fly-ing eider ducks. The distance between the cam-era and the eiders was measured using a laserrange finder with an accuracy of ±5 m. Thelength of a bird (the part of the silhouette,which contrasted to the black background) wasmeasured in units of pixels at one frame froma video sequence.In order to evaluate the usefulness of other
Figure 8. Interface of the software Paint. An importedbitmap-file of the field of view of the thermal cameracan be used to mask disturbing hot objects. Here ablack mask has been created so that only the outer partof the field of view (the white part) is used for deter-mining the maximum pixel value.
14
lenses which were not tested in the presentstudy, the theoretical body length to distancerelationships for eider ducks was generated.The lens specific mean geometrical resolutions(MG) normalised with regard to distance werecalculated for each lens by use of the formula:
MG = GR/D (1)
where GR = geometrical resolution (in mm)and D = distance (in m) between the cameraand the object (see Table 2).A theoretical body length, b, of 400 mm for aneider duck was applied and the theoreticalmonitor body length, B, in the unit of pixelswas computed using the following equation:
MGDbB×
= (2).
• Tests of the equipment during nocturnal con-ditions and in situations of poor visibility. Oneof the key demands placed upon the set-up, isits ability to operate under the conditions whenmost collisions are expected to occur. The heatradiation pattern during nocturnal circum-stances does not differ from that of day-lightsituations, and hence, the present study con-centrates on documenting the performance ofthe thermal camera in situations of poor vis-
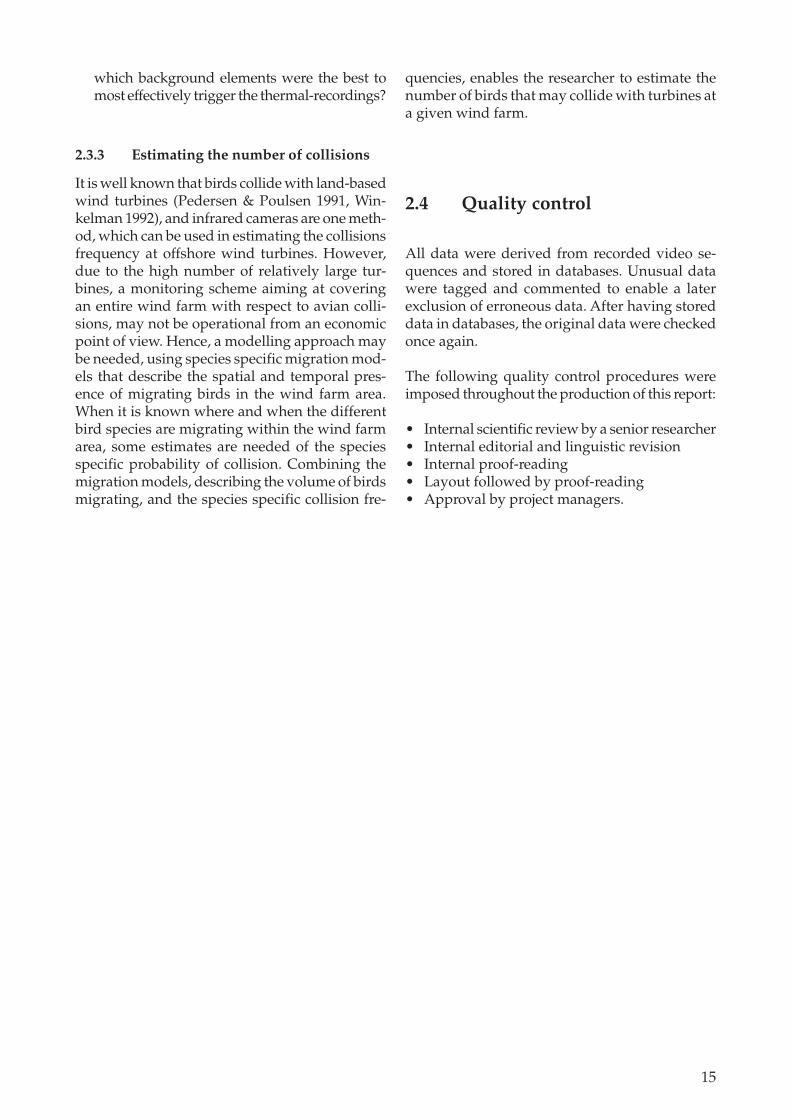
ibility during day light. A caged chicken (Fig.9) was used for controlled visibility tests dur-ing severe snowfall and a caged pheasant (Fig.10) during severe fog, both of which had thesame body length of c. 300 mm (tail excluded).Both were tested against a control in condi-tions of good visibility. The visibility tests wereperformed along small gravel roads wheresmall stakes were set out at 25 m intervals. Inthis way a single test operator could easilydetermine the distance between the cameraand the caged bird at any given level of vis-ibility. The camera was started and the birdwas moved along the road. At each 25 m, asignal was given so the single frames gener-ated at each distance interval could be deter-mined later on in the office during furtheranalysis;
• Tests of the performance of the thermal sensorsoftware, regarding its ability to detect andtrigger on the basis of flying birds. The testswere conducted on free flying waterbirds mi-grating over the sea at Gedser Odde. The ques-tions to be answered were: 1) could the soft-ware trigger fast enough to capture the maintrack of a bird passing the field of view? and 2)
Figure 9. Caged chicken used for the visibility tests dur-ing a severe snowstorm.
Figure 10. Caged pheasant used for the visibility testsduring heavy fog.
15
which background elements were the best tomost effectively trigger the thermal-recordings?
2.3.3 Estimating the number of collisions
It is well known that birds collide with land-basedwind turbines (Pedersen & Poulsen 1991, Win-kelman 1992), and infrared cameras are one meth-od, which can be used in estimating the collisionsfrequency at offshore wind turbines. However,due to the high number of relatively large tur-bines, a monitoring scheme aiming at coveringan entire wind farm with respect to avian colli-sions, may not be operational from an economicpoint of view. Hence, a modelling approach maybe needed, using species specific migration mod-els that describe the spatial and temporal pres-ence of migrating birds in the wind farm area.When it is known where and when the differentbird species are migrating within the wind farmarea, some estimates are needed of the speciesspecific probability of collision. Combining themigration models, describing the volume of birdsmigrating, and the species specific collision fre-
quencies, enables the researcher to estimate thenumber of birds that may collide with turbines ata given wind farm.
2.4 Quality control
All data were derived from recorded video se-quences and stored in databases. Unusual datawere tagged and commented to enable a laterexclusion of erroneous data. After having storeddata in databases, the original data were checkedonce again.
The following quality control procedures wereimposed throughout the production of this report:
• Internal scientific review by a senior researcher• Internal editorial and linguistic revision• Internal proof-reading• Layout followed by proof-reading• Approval by project managers.

16
17
3.1 Technical tests
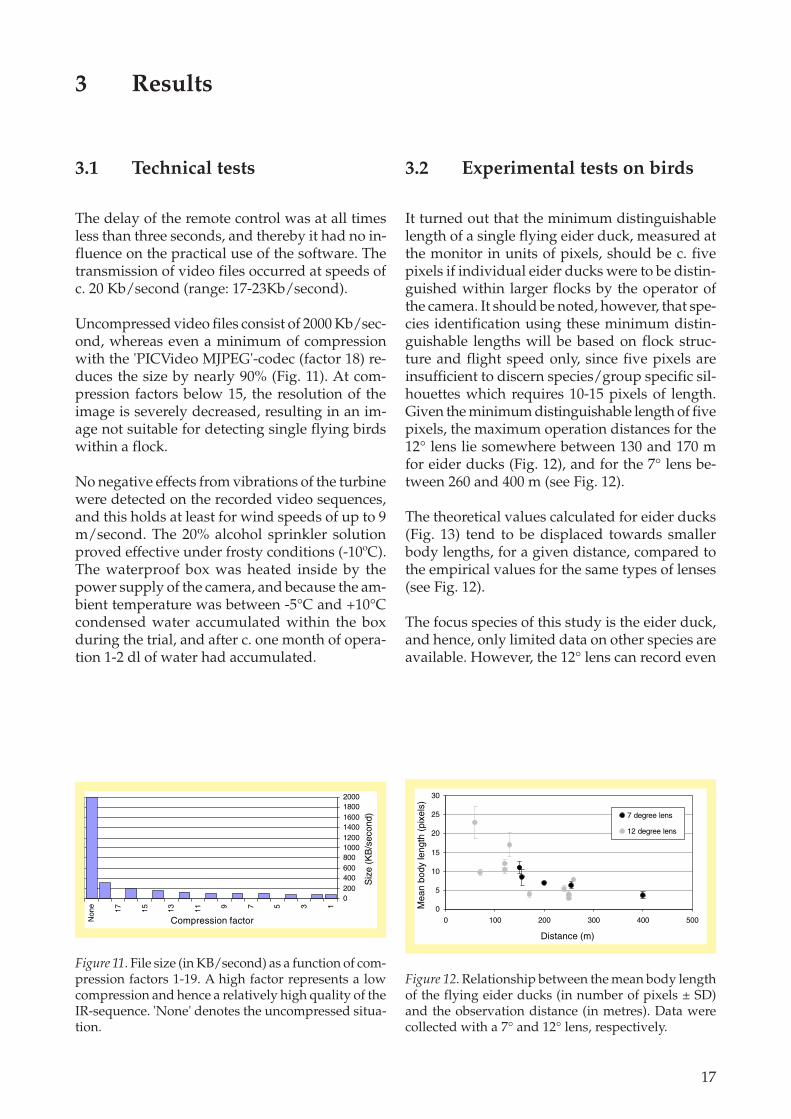
The delay of the remote control was at all timesless than three seconds, and thereby it had no in-fluence on the practical use of the software. Thetransmission of video files occurred at speeds ofc. 20 Kb/second (range: 17-23Kb/second).
Uncompressed video files consist of 2000 Kb/sec-ond, whereas even a minimum of compressionwith the 'PICVideo MJPEG'-codec (factor 18) re-duces the size by nearly 90% (Fig. 11). At com-pression factors below 15, the resolution of theimage is severely decreased, resulting in an im-age not suitable for detecting single flying birdswithin a flock.
No negative effects from vibrations of the turbinewere detected on the recorded video sequences,and this holds at least for wind speeds of up to 9m/second. The 20% alcohol sprinkler solutionproved effective under frosty conditions (-10ºC).The waterproof box was heated inside by thepower supply of the camera, and because the am-bient temperature was between -5°C and +10°Ccondensed water accumulated within the boxduring the trial, and after c. one month of opera-tion 1-2 dl of water had accumulated.
3.2 Experimental tests on birds
It turned out that the minimum distinguishablelength of a single flying eider duck, measured atthe monitor in units of pixels, should be c. fivepixels if individual eider ducks were to be distin-guished within larger flocks by the operator ofthe camera. It should be noted, however, that spe-cies identification using these minimum distin-guishable lengths will be based on flock struc-ture and flight speed only, since five pixels areinsufficient to discern species/group specific sil-houettes which requires 10-15 pixels of length.Given the minimum distinguishable length of fivepixels, the maximum operation distances for the12° lens lie somewhere between 130 and 170 mfor eider ducks (Fig. 12), and for the 7° lens be-tween 260 and 400 m (see Fig. 12).
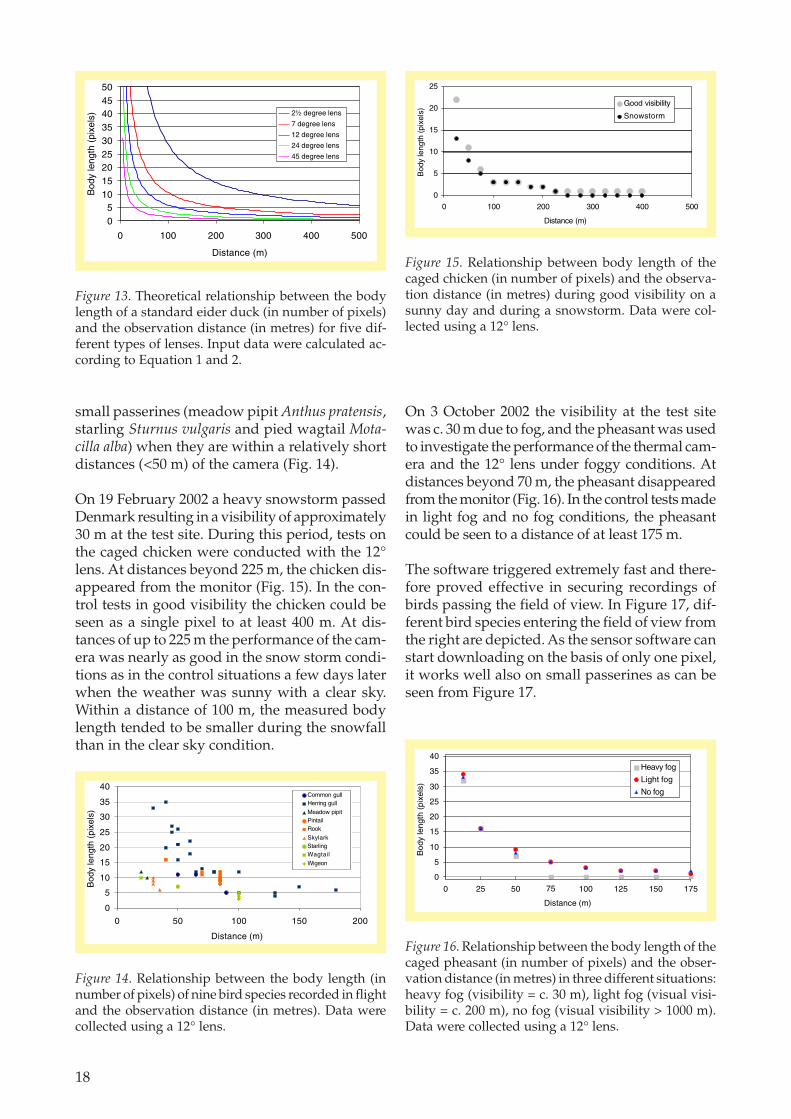
The theoretical values calculated for eider ducks(Fig. 13) tend to be displaced towards smallerbody lengths, for a given distance, compared tothe empirical values for the same types of lenses(see Fig. 12).
The focus species of this study is the eider duck,and hence, only limited data on other species areavailable. However, the 12° lens can record even
3 Results
0200400600800100012001400160018002000
1357911131517
Non
e
Siz
e (K
B/s
econ
d)
Compression factor
Figure 11. File size (in KB/second) as a function of com-pression factors 1-19. A high factor represents a lowcompression and hence a relatively high quality of theIR-sequence. 'None' denotes the uncompressed situa-tion.
0
5
10
15
20
25
30
0 100 200 300 400 500
Distance (m)
Mea
n bo
dy le
ngth
(pi
xels
)
7 degree lens
12 degree lens
Figure 12. Relationship between the mean body lengthof the flying eider ducks (in number of pixels ± SD)and the observation distance (in metres). Data werecollected with a 7° and 12° lens, respectively.
18
small passerines (meadow pipit Anthus pratensis,starling Sturnus vulgaris and pied wagtail Mota-cilla alba) when they are within a relatively shortdistances (<50 m) of the camera (Fig. 14).
On 19 February 2002 a heavy snowstorm passedDenmark resulting in a visibility of approximately30 m at the test site. During this period, tests onthe caged chicken were conducted with the 12°lens. At distances beyond 225 m, the chicken dis-appeared from the monitor (Fig. 15). In the con-trol tests in good visibility the chicken could beseen as a single pixel to at least 400 m. At dis-tances of up to 225 m the performance of the cam-era was nearly as good in the snow storm condi-tions as in the control situations a few days laterwhen the weather was sunny with a clear sky.Within a distance of 100 m, the measured bodylength tended to be smaller during the snowfallthan in the clear sky condition.
On 3 October 2002 the visibility at the test sitewas c. 30 m due to fog, and the pheasant was usedto investigate the performance of the thermal cam-era and the 12° lens under foggy conditions. Atdistances beyond 70 m, the pheasant disappearedfrom the monitor (Fig. 16). In the control tests madein light fog and no fog conditions, the pheasantcould be seen to a distance of at least 175 m.
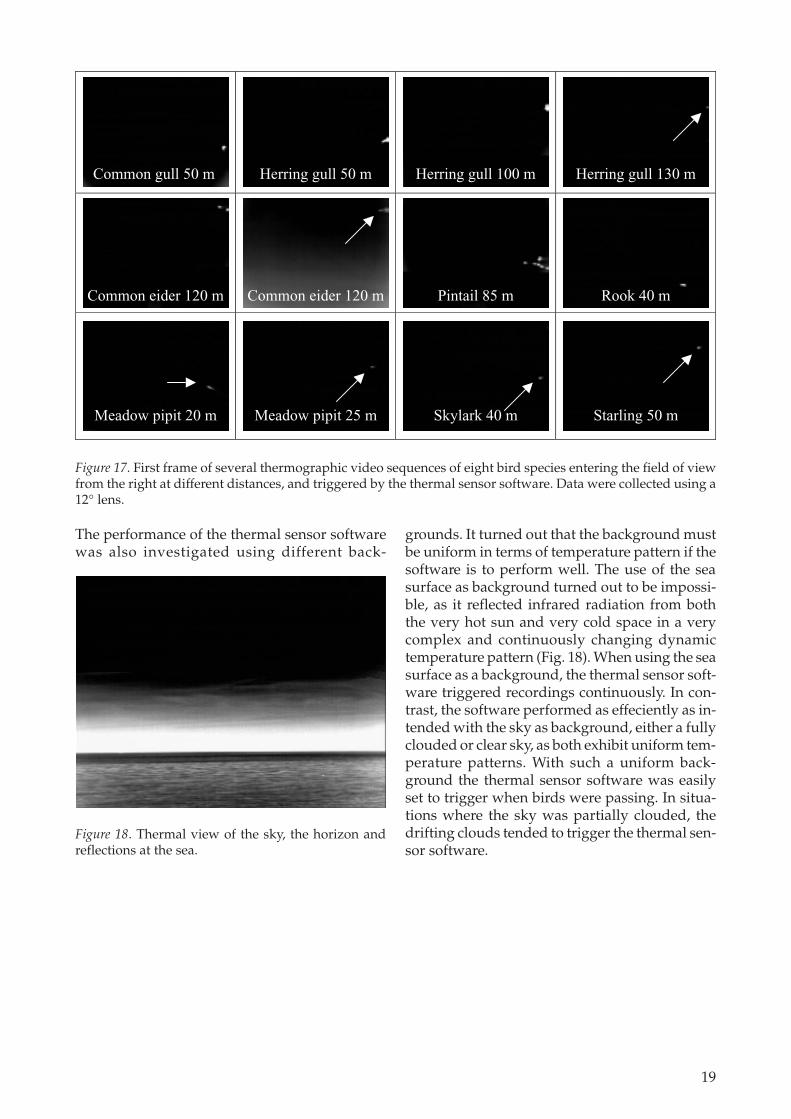
The software triggered extremely fast and there-fore proved effective in securing recordings ofbirds passing the field of view. In Figure 17, dif-ferent bird species entering the field of view fromthe right are depicted. As the sensor software canstart downloading on the basis of only one pixel,it works well also on small passerines as can beseen from Figure 17.
0
5
10
15
20
25
30
35
40
0 50 100 150 200
Distance (m)
Bod
y le
ngth
(pi
xels
)
Common gullHerring gull
Meadow pipitPintailRook
SkylarkStarlingWagtail
Wigeon
Figure 14. Relationship between the body length (innumber of pixels) of nine bird species recorded in flightand the observation distance (in metres). Data werecollected using a 12° lens.
0
5
10
15
20
25
30
35
40
0 25 50 75 100 125 150 175
Distance (m)
Bod
y le
ngth
(pi
xels
)
Heavy fog
Light fog
No fog
Figure 16. Relationship between the body length of thecaged pheasant (in number of pixels) and the obser-vation distance (in metres) in three different situations:heavy fog (visibility = c. 30 m), light fog (visual visi-bility = c. 200 m), no fog (visual visibility > 1000 m).Data were collected using a 12° lens.
0
5
10
15
20
25
0 100 200 300 400 500
Distance (m)
Bod
y le
ngth
(pi
xels
)
Good visibility
Snowstorm
Figure 15. Relationship between body length of thecaged chicken (in number of pixels) and the observa-tion distance (in metres) during good visibility on asunny day and during a snowstorm. Data were col-lected using a 12° lens.
05
101520253035404550
0 100 200 300 400 500
Distance (m)
Bod
y le
ngth
(pi
xels
) 2½ degree lens
7 degree lens
12 degree lens
24 degree lens
45 degree lens
Figure 13. Theoretical relationship between the bodylength of a standard eider duck (in number of pixels)and the observation distance (in metres) for five dif-ferent types of lenses. Input data were calculated ac-cording to Equation 1 and 2.
19
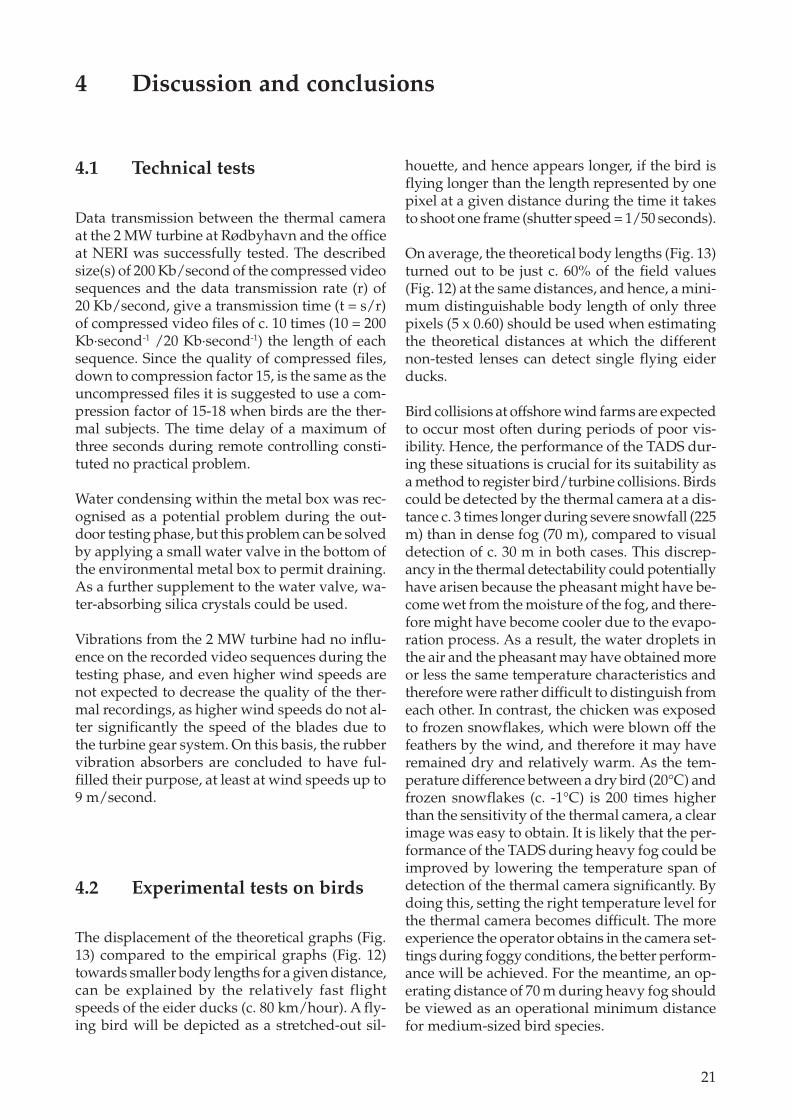
The performance of the thermal sensor softwarewas also investigated using different back-
grounds. It turned out that the background mustbe uniform in terms of temperature pattern if thesoftware is to perform well. The use of the seasurface as background turned out to be impossi-ble, as it reflected infrared radiation from boththe very hot sun and very cold space in a verycomplex and continuously changing dynamictemperature pattern (Fig. 18). When using the seasurface as a background, the thermal sensor soft-ware triggered recordings continuously. In con-trast, the software performed as effeciently as in-tended with the sky as background, either a fullyclouded or clear sky, as both exhibit uniform tem-perature patterns. With such a uniform back-ground the thermal sensor software was easilyset to trigger when birds were passing. In situa-tions where the sky was partially clouded, thedrifting clouds tended to trigger the thermal sen-sor software.
Common gull 50 m Herring gull 50 m Herring gull 100 m Herring gull 130 m
Meadow pipit 20 m Meadow pipit 25 m Skylark 40 m Starling 50 m
Common eider 120 m Common eider 120 m Pintail 85 m Rook 40 m
Figure 17. First frame of several thermographic video sequences of eight bird species entering the field of viewfrom the right at different distances, and triggered by the thermal sensor software. Data were collected using a12° lens.
Figure 18. Thermal view of the sky, the horizon andreflections at the sea.

20
21
4.1 Technical tests
Data transmission between the thermal cameraat the 2 MW turbine at Rødbyhavn and the officeat NERI was successfully tested. The describedsize(s) of 200 Kb/second of the compressed videosequences and the data transmission rate (r) of20 Kb/second, give a transmission time (t = s/r)of compressed video files of c. 10 times (10 = 200Kb·second-1 /20 Kb·second-1) the length of eachsequence. Since the quality of compressed files,down to compression factor 15, is the same as theuncompressed files it is suggested to use a com-pression factor of 15-18 when birds are the ther-mal subjects. The time delay of a maximum ofthree seconds during remote controlling consti-tuted no practical problem.
Water condensing within the metal box was rec-ognised as a potential problem during the out-door testing phase, but this problem can be solvedby applying a small water valve in the bottom ofthe environmental metal box to permit draining.As a further supplement to the water valve, wa-ter-absorbing silica crystals could be used.
Vibrations from the 2 MW turbine had no influ-ence on the recorded video sequences during thetesting phase, and even higher wind speeds arenot expected to decrease the quality of the ther-mal recordings, as higher wind speeds do not al-ter significantly the speed of the blades due tothe turbine gear system. On this basis, the rubbervibration absorbers are concluded to have ful-filled their purpose, at least at wind speeds up to9 m/second.
4.2 Experimental tests on birds
The displacement of the theoretical graphs (Fig.13) compared to the empirical graphs (Fig. 12)towards smaller body lengths for a given distance,can be explained by the relatively fast flightspeeds of the eider ducks (c. 80 km/hour). A fly-ing bird will be depicted as a stretched-out sil-
houette, and hence appears longer, if the bird isflying longer than the length represented by onepixel at a given distance during the time it takesto shoot one frame (shutter speed = 1/50 seconds).
On average, the theoretical body lengths (Fig. 13)turned out to be just c. 60% of the field values(Fig. 12) at the same distances, and hence, a mini-mum distinguishable body length of only threepixels (5 x 0.60) should be used when estimatingthe theoretical distances at which the differentnon-tested lenses can detect single flying eiderducks.
Bird collisions at offshore wind farms are expectedto occur most often during periods of poor vis-ibility. Hence, the performance of the TADS dur-ing these situations is crucial for its suitability asa method to register bird/turbine collisions. Birdscould be detected by the thermal camera at a dis-tance c. 3 times longer during severe snowfall (225m) than in dense fog (70 m), compared to visualdetection of c. 30 m in both cases. This discrep-ancy in the thermal detectability could potentiallyhave arisen because the pheasant might have be-come wet from the moisture of the fog, and there-fore might have become cooler due to the evapo-ration process. As a result, the water droplets inthe air and the pheasant may have obtained moreor less the same temperature characteristics andtherefore were rather difficult to distinguish fromeach other. In contrast, the chicken was exposedto frozen snowflakes, which were blown off thefeathers by the wind, and therefore it may haveremained dry and relatively warm. As the tem-perature difference between a dry bird (20°C) andfrozen snowflakes (c. -1°C) is 200 times higherthan the sensitivity of the thermal camera, a clearimage was easy to obtain. It is likely that the per-formance of the TADS during heavy fog could beimproved by lowering the temperature span ofdetection of the thermal camera significantly. Bydoing this, setting the right temperature level forthe thermal camera becomes difficult. The moreexperience the operator obtains in the camera set-tings during foggy conditions, the better perform-ance will be achieved. For the meantime, an op-erating distance of 70 m during heavy fog shouldbe viewed as an operational minimum distancefor medium-sized bird species.
4 Discussion and conclusions
22
The thermal sensor software, which has been de-veloped specifically for this project, has per-formed according to the specification. The record-ings are triggered extremely fast, but the perform-ance is limited to situations with either a clear orfully clouded sky. If clouds are drifting at a clearsky, they may trigger the recording due to theirrelatively high temperature of c. 10°C comparedto a background temperature of c. -40°C fromspace. Similar limitations were reported from athermography study on migrating birds at Fal-sterbo in Sweden where a vertical viewing sce-nario was applied also (Zehnder et al. 2001). Ingeneral, the thermal sensor software seems to bea robust tool to ensure that only thermographicvideo sequences with birds passing the field ofview are stored on the harddisc.
4.3 Conclusions
Under the present proposals for construction ofthe planned offshore wind farms, turbines willbe at least 110 m high and will be placed morethan 450 m apart. Based on the results from thethermal imaging equipment presented in this re-port, it was only possible to distinguish birds fromimages with minimum body lengths of 3 and 5pixels (see Figs. 12 and 13). On this basis, andgiven the planned size and distance between theturbines, it is concluded that only the 2½° lens,which was not tested in the study, would be ableto operate satisfactorily in the horizontal view-ing scenario (thermal camera at one turbine moni-toring the neighbour turbine). In the vertical view-ing scenario (thermal camera at the base of a tur-bine monitoring the sweeping area of the sameturbine), with an operational distance of 110 m,the 12º and 24º lenses (which are cheaper) can beused.
In considering choice of scenario to be used, thefollowing arguments pros and cons can be ad-duced:
• The thermographic visibility was restrictedduring trials undertaken in heavy fog to c. 70m, at which data collection can still continueusing the vertical viewing scenario.
• Species/group identification will be greatlyenhanced over the shorter distances involvedwith vertical mounting of the thermal camera,
since the long distances involved in horizon-tal mounting will increase radiation attenua-tion and reduce the amount of additional in-formation available (e.g. bird shape, behaviour,wing-beat frequency).
• The recordings of smaller passerine bird spe-cies will be much more detailed and numer-ous due to the reduction in distance, and hence,the reduced degree of attenuation at the verti-cal viewing scenario.
• The horizontal image size using a 2.5° lens willbe restricted to only 19.6 m at the distance of450 m (24.5% of the sweeping area), and hence,two cameras will be needed to obtain the samecoverage (32%) as achieved in the vertical sce-nario with the 24° lens.
Erection of a separate recording platform at thelens specific optimal distance from the turbine ofinterest could make the horizontal scenario ap-plicable. However, the erection of such a platformwith the necessary optic fibre connection to thegeneral wind farm network would be prohibi-tively costly compared to a mounting associatedwith the planned existing infrastructure.
From this it is concluded that the vertical scenariowill provide the best information.
If the vertical scenario is used, the amount of datacould be increased significantly if the mountingdevice could be rotated in different directions bythe operator remotely from the office, or moresophisticated, could follow the changes in direc-tion of the nacelle automatically, and hence theblades, during periods with changing wind di-rections. At present, the method is restricted tomonitoring the periods during which the bladesare directly above the fixed point where the ther-mal camera is mounted. If the camera could some-how follow the turbine blades as the wind chang-es, data could be collected at all stages irrespec-tive of wind direction.
In general, it can be concluded that the thermalcamera and its related hardware and software,the TADS, are capable of recording migratingbirds approaching the rotating blades of a turbine,even under conditions with poor visibility. If theTADS is used in a vertical viewing scenario itwould comply with the requirements for a set-up used for estimating the avian collision fre-quency at offshore wind turbines. The presentreport describes the TADS in the context of moni-toring avian collisions with static wind turbines
23
only, but the set-up is likely to perform just aswell on other animals, as long as the surface tem-perature is different from the temperature of thesurrounding habitat.

24
25
NERI (in prep.): International Workshop on Birdsand Offshore Wind Farms, Final Report 19-20November 2001, Fuglsø, Jutland, Denmark, 39pp.
Pedersen, M.B. & Poulsen, E. 1991:. En 90m/2 MWwindmølles indvirkning på fuglelivet. - Dan-ske Vildtundersøgelser 47: 1-44.
Winkelman, J.E. 1992: De invloed van de Sep.
proefeindcentrale te Oosterbierum (Fr.) opvogels. - 1-4 (RIN-report 92/2-5) DLO-Instituutvoor Bos. en Natuuronderzoek, Arnhem, 120pp. (In Dutch).
Zehnder, S., Åkesson, S., Liechti, F. & Bruderer, B.2001: Nocturnal autumn bird migration at Fal-sterbo, South Sweden. - Journal of Avian Biol-ogy 32: 239-248.
5 References
National Environmental Research InstituteThe National Environmental Research Institute, NERI, is a research institute of the Ministry of the Environment.In Danish, NERI is called Danmarks Miljøundersøgelser (DMU).NERI's tasks are primarily to conduct research, collect data, and give advice on problems related to the environ-ment and nature.
Addresses: URL: http://www.dmu.dk
National Environmental Research InstituteFrederiksborgvej 399PO Box 358DK-4000 RoskildeDenmarkTel: +45 46 30 12 00Fax: +45 46 30 11 14
ManagementPersonnel and Economy SecretariatResearch and Development SectionDepartment of Policy AnalysisDepartment of Atmospheric EnvironmentDepartment of Marine EcologyDepartment of Environmental Chemistry and MicrobiologyDepartment of Arctic EnvironmentProject Manager for Quality Management and Analyses
National Environmental Research InstituteVejlsøvej 25PO Box 314DK-8600 SilkeborgDenmarkTel: +45 89 20 14 00Fax: +45 89 20 14 14
Environmental Monitoring Co-ordination SectionDepartment of Terrestrial EcologyDepartment of Freshwater EcologyProject Manager for Surface Waters
National Environmental Research InstituteGrenåvej 12-14, KaløDK-8410 RøndeDenmarkTel: +45 89 20 17 00Fax: +45 89 20 15 15
Department of Landscape EcologyDepartment of Coastal Zone Ecology
Publications:NERI publishes professional reports, technical instructions, and the annual report. A R&D projects' catalogue isavailable in an electronic version on the World Wide Web.Included in the annual report is a list of the publications from the current year.
Faglige rapporter fra DMU/NERI Technical Reports
2002Nr. 402: Persistent Organic Pollutants in Soil, Sludge and Sediment. A Multianalytical Field Study of
Selected Organic Chlorinated and Brominated Compounds. By Vikelsøe et al. 96 pp. (electronic)Nr. 403: Vingeindsamling fra jagtsæsonen 2001/02 i Danmark. Wing Survey from the 2001/02 hunting
season in Denmark. Af Clausager, I. 62 s., 50 kr.Nr. 404: Analytical Chemical Control of Phtalates in Toys. Analytical Chemical Control of Chemical
Substances and Products. By Rastogi, S.C., Jensen, G.H. & Worsøe, I.M. 25 pp. (electronic)Nr. 405: Indikatorer for Bæredygtig Transport – oplæg til indhold og strategi. Af Gudmundsen, H. 112 s.,
100 kr.Nr. 406: Det landsdækkende luftkvalitetsmåleprogram (LMP). Årsrapport for 2001. Af Kemp, K. &
Palmgren, F. 32 s. (elektronisk)Nr. 407: Air Quality Monitroing Programme. Annual Summary for 2000. By Kemp, K. & Palmgren, F. 32 pp.
(electronic)Nr. 408: Blykontaminering af havfugle i Grønland fra jagt med blyhagl. Af Johansen, P., Asmund, G. &
Riget, F. 31 s. (elektronisk)Nr. 409: The State of the Environment in Denmark 2001. By Bach, H., Christensen, N. & Kristensen, P. (eds).
368 pp., 200 DKKNr. 410: Biodiversity in Glyphosate Telerant Fodder Beet Fields. Timing of Herbicide Application. By
Strandberg, B. & Bruus Pedersen, M. 36 pp. (electronic)Nr. 411: Satellite Tracking of Humpback Whales in West Greenland. By Dietz, R. et al. 38 pp. (electronic)Nr. 412: Control of Pesticides 2001. Chemical Substances and Chemical Preparations. By Krongaard, T.
Petersen, K.K. & Christoffersen, C. 28 pp. (electronic)Nr. 413: Vegetation i farvandet omkring Fyn 2001. Af Rasmussen, M.B. 138 s. (elektronisk)Nr. 414: Projection Models 2010. Danish Emissions of SO2, Nox, NMVOC and NH3. By Illerup, J.B. et al.
194 pp., 100 DKK.Nr. 415: Potential Environmental Impacts of Soil Spills in Greenland. An Assessment of Information Status
and Research Needs. By Mosbech, A. (ed.) 116 pp. (electronic)Nr. 416: Ilt- og næringsstoffluxmodel for Århus Bugt og Mariager Fjord. Modelopsætning. Af Fossing, H. et
al. 72 s., 100 kr.Nr. 417: Ilt- og næringsstoffluxmodel for Århus Bugt og Mariager Fjord. Modelopsætning og scenarier. Af
Fossing, H. et al. 178 s. (elektronisk)Nr. 418: Atmosfærisk deposition 2001. NOVA 2003. Af Ellermann, T. (elektronisk)Nr. 419: Marine områder 2001 - Miljøtilstand og udvikling. NOVA 2003. Af Ærtebjerg, G. (red.) (elektronisk)Nr. 420: Landovervågningsoplande 2001. NOVA 2003. Af Bøgestrand, J. (elektronisk)Nr. 421: Søer 2001. NOVA 2003. Af Jensen, J.P. (elektronisk)Nr. 422: Vandløb og kilder 2001. NOVA 2003. Af Bøgestrand, J. (elektronisk)Nr. 423: Vandmiljø 2002. Tilstand og udvikling - faglig sammenfatning. Af Andersen, J.M. et al. 56 s., 100 kr.Nr. 424: Burden Sharing in the Context of Global Climate Change. A North-South Perspective. By Ringius,
L., Frederiksen, P. & Birr-Pedersen, K. 90 pp. (electronic)Nr. 425: Interkalibrering af marine målemetoder 2002. Af Stæhr, P.A. et al. 88 s. (elektronisk)Nr. 426: Statistisk optimering af moniteringsprogrammer på miljøområdet. Eksempler fra NOVA-2003. Af
Larsen, S.E., Jensen, C. & Carstensen, J. 195 s. (elektronisk)Nr. 427: Air Quality Monitoring Programme. Annual Summary for 2001. By Kemp, K. & Palmgren, F. 32 pp.
(electronic)
2003Nr. 428: Vildtbestande, jagt og jagttider i Danmark 2002. En biologisk vurdering af jagtens bæredygtighed
som grundlag for jagttidsrevisionen 2003. Af Bregnballe, T. et al. 227 s. (elektronisk)Nr. 429: Movements of Seals from Rødsand Seal Sanctuary Monitored by Satellite Telemetry. Relative
Importance of the Nysted Offshore Wind Farm Area to the Seals. By Dietz, R. et al. 44 pp.(electronic)
Nr. 430: Undersøgelse af miljøfremmede stoffer i gylle. Af Schwærter, R.C. & Grant, R. 60 s. (elektronisk)Nr. 432: Metoder til miljøkonsekvensvurdering af økonomisk politik. Møller, F. 65 s. (elektronisk)Nr. 408:
Blykontaminering af havfugle i Grønland fra jagt med blyhagl. Af Johansen, P., Asmund, G. &Riget, F. 31 s. (elektronisk)
440 T
hermal A
nimal D
etection System (T
AD
S)
National Environmental Research Institute ISBN 87-7772-731-2Ministry of the Environment ISSN 1600-0048