Embed Size (px)
Citation preview

The University of ChicagoThe Booth School of Business of the University of ChicagoThe University of Chicago Law School
Deregulation, Misallocation, and Size: Evidence from IndiaAuthor(s): Laura Alfaro and Anusha ChariSource: Journal of Law and Economics, Vol. 57, No. 4 (November 2014), pp. 897-936Published by: The University of Chicago Press for The Booth School of Business of the University ofChicago and The University of Chicago Law SchoolStable URL: http://www.jstor.org/stable/10.1086/680930 .
Accessed: 07/05/2015 16:03
Your use of the JSTOR archive indicates your acceptance of the Terms & Conditions of Use, available at .http://www.jstor.org/page/info/about/policies/terms.jsp
.JSTOR is a not-for-profit service that helps scholars, researchers, and students discover, use, and build upon a wide range ofcontent in a trusted digital archive. We use information technology and tools to increase productivity and facilitate new formsof scholarship. For more information about JSTOR, please contact [email protected].
.
The University of Chicago Press, The University of Chicago, The Booth School of Business of the University ofChicago, The University of Chicago Law School are collaborating with JSTOR to digitize, preserve and extendaccess to Journal of Law and Economics.
http://www.jstor.org
This content downloaded from 45.37.104.148 on Thu, 7 May 2015 16:03:44 PMAll use subject to JSTOR Terms and Conditions

897
[ Journal of Law and Economics, vol. 57 (November 2014)]© 2014 by The University of Chicago. All rights reserved. 0022-2186/2014/5704-0036$10.00
Deregulation, Misallocation, and Size: Evidence from India
Laura Alfaro Harvard UniversityAnusha Chari University of North Carolina at Chapel Hill
Abstract
This paper examines the impact of the deregulation of compulsory industrial licensing in India on firm-size dynamics and reallocation of resources within industries. Following deregulation, resource misallocation declines and the left-hand tail of the firm-size distribution thickens significantly, which suggests increased entry by small firms. However, the dominance and growth of large incumbent firms remains unchallenged. Quantile regressions reveal that the dis-tributional effects of deregulation on firm size are significantly nonlinear. The reallocation of market shares toward a small number of large firms and a large number of small firms is characterized as the shrinking middle in Indian man-ufacturing. Small and medium-sized firms may continue to face constraints in their attempts to grow.
1. Introduction
The misallocation of resources across firms can have important effects on aggre-gate efficiency (Restuccia and Rogerson 2008; Hsieh and Klenow 2009). The gen-eral consensus is that not only do developing countries have fewer productive resources, they are also less efficient at allocating them.1 While a variety of insti-tutional features and government policies can distort resource allocation, regula-tion that distorts free entry and artificially imposes limits on firm capacity is, in our view, a critical source of inefficiency in many developing countries.
We thank an anonymous referee and participants at Columbia University’s conferences India: Economic Policies and Outcomes (2010, New York) and Trade, Poverty, Inequality and Democracy (2011, New Delhi) and seminar participants at the Darden School of Business at the University of Virginia (January 2014) for helpful comments and suggestions. We are grateful to Petia Topalova for kindly sharing her data. Work on this paper was supported by Columbia University’s Program on Indian Economic Policies, funded by a generous grant from the John Templeton Foundation. The opinions expressed in the paper are those of the authors and do not necessarily reflect the views of the John Templeton Foundation.
1 Alfaro, Charlton, and Kanczuk (2009) find that differences in resource allocation across hetero-geneous plants are a significant determinant of cross-country differences in income per worker in a sample with plant-level data for 79 developed and developing countries.
This content downloaded from 45.37.104.148 on Thu, 7 May 2015 16:03:44 PMAll use subject to JSTOR Terms and Conditions

898 The Journal of LAW & ECONOMICS
Theory suggests that entry regulation determines both the entry costs that firms face and the degree of competition between firms in an industry (Blanchard and Giavazzi 2003; Alesina et al. 2005; Ardagna and Lusardi 2009, 2010). The deregu-lation of entry can therefore reduce and reallocate rents, which leads to new dis-tributions of firms over time. Incumbent firms may lose market share when faced with new competitors, or they may consolidate their positions further if they are no longer encumbered by artificial constraints imposed by the licensing regime. Episodes that involve massive deregulation therefore provide a natural setting in which to examine patterns of resource reallocation across firms.
This is precisely the approach that we adopt in this paper. We analyze the im-pact on efficiency of eliminating a specific policy distortion: compulsory indus-trial licensing that regulated firm entry and imposed output-capacity constraints on Indian firms prior to 1991.2 Pro-market reforms in the 1990s rapidly deregu-lated significant sectors of the Indian economy previously kept off limits to pri-vate participation. Deregulation of entry and the end of industrial licensing (also known as the “license raj”) in all but a small subset of industries had the capacity to transform the competitive environment in which firms operated.3
To examine whether industrial delicensing in India led to a change in firm-size distributions, we hypothesize that the wide-ranging restrictions on entry and the artificial constraints on capacity distorted the size distribution of Indian firms. Firm-level financial statements from the manufacturing sector allow us to exam-ine the distributional impact of deregulation on firm size and profitability. We also use this information to measure the extent of resource reallocation in the de-licensed industries and examine whether the degree of misallocation declined in industries that removed restrictions on entry and capacity.
Before 1991, extensive regulation of industries placed numerous restrictions on free enterprise in India. First, entry licenses regulated the number of firms oper-ating in an industry. Second, to prevent firms from getting too large, the govern-ment implemented capacity caps that set the scale of production. Third, small-scale reservations restricted industrial production in several industries to small firms only. Finally, several industries were reserved for state-owned firms and kept off limits to private participants. Policy makers were particularly concerned about the distributional implications of broad-based deregulation, in particular if removing entry restrictions and small-scale industry reservations would drive out small firms unable to compete with large firms, thus destroying the small-firm style of development that was championed after independence.
Because the licensing policy in India had regulated both output capacity and free entry, deregulation relaxed the policy constraints on two margins that, in theory, could act as countervailing forces on firm size. Removing artificial capac-ity restrictions could lead to an increase in average size as firms expanded. Al-
2 An industrial license not only regulated whether a firm could enter an industry but also specified the maximum amount a firm could produce.
3 Incorporation year data from the Centre for Monitoring the Indian Economy (CMIE), Prow-ess [searching “incorporation year”] (http://prowess.cmie.com), show that thousands of new private firms were incorporated following deregulation.
This content downloaded from 45.37.104.148 on Thu, 7 May 2015 16:03:44 PMAll use subject to JSTOR Terms and Conditions

Deregulation and Firm Size 899
ternatively, an increase in the number of small firms could lead to a decrease in average firm size. An important advantage of having panel data at the firm level is that we can both examine the impact of delicensing on average firm size and analyze changes in the properties of the entire size distribution.
We use firm-level data from the Prowess database,4 a subscription-based data set compiled by the Centre for Monitoring Indian Economy (CMIE) from com-pany balance sheets and income statements. The firms are classified into 62 in-dustries in the manufacturing sector using three-digit National Industrial Classi-fication (NIC3) codes and by incorporation year so that distinctions can be made across firms by age. As a result, the data contain rich detail with which to char-acterize changes in firm-size distributions and differentiate across types of firms, such as incumbents and new entrants. The data allow us to measure increases in competition in several ways—by an increase in dispersion in firm-size distribu-tions, a reduction in concentration ratios, or a decline in average firm size. We can also perform quantile regressions to compare the pre- and postreform distri-butional properties of firm size and profitability.
The firm-size regressions are estimated for both assets and sales. We use a bal-anced panel of incumbent firms with and without fixed effects. The fixed-effects specification controls for unobserved heterogeneity at the firm level. Next, we use an unbalanced panel of firms to allow for new firms to enter the sample and to examine the distributional impact of deregulation. The specifications also include a year trend variable to control for overall economic growth. Standard errors are clustered at the NIC3 level to allow for correlations in residuals across firms in an industry.
Our main findings are as follows. First, average firm size declines significantly in deregulated industries, consistent with greater competition. Second, there are significant changes in firm-size distribution, particularly in the tails of the distri-bution. The left-hand tail thickens when more small firms are in the sample, and in the right-hand tail, the largest incumbent firms get significantly bigger follow-ing delicensing.
Third, quantile regressions show that the U-shaped shift in the distribution of firm size is nonlinear: average firm size increases until around the 15th percen-tile and then gets significantly smaller until the 90th percentile; the largest per-centile (the 95th) gets significantly bigger over the same period. The size of new entrants increases at the lower tails of the distributions, while the size of incum-bents grows at the upper tails.5
Finally, we find that the contribution of resource reallocation to growth in In-dia has increased since deregulation, which suggests that distortions have de-creased over time, with deregulated industries experiencing higher gains. There is, however, substantial cross-time variation in the extent of reallocation. Most of the reallocation gains in the early postreform period are attributed to new en-
4 Centre for Monitoring Indian Economy, Prowess (https://prowess.cmie.com).5 We also control for other economic reforms, such as trade and foreign direct investment (FDI)
liberalization, that could affect firm-size distribution and profitability, independent of any effects of delicensing. Our results are robust to the inclusion of these controls.
This content downloaded from 45.37.104.148 on Thu, 7 May 2015 16:03:44 PMAll use subject to JSTOR Terms and Conditions

900 The Journal of LAW & ECONOMICS
trants in deregulated industries and substantial reallocation gains for the incum-bent firms in the later period.6
Policy concerns about small firms being driven out following the deregulation of entry are not borne out by our estimations. The marginal increase in the num-ber of small firms is consistent with an increase in competition following dereg-ulation, and the reduction in average firm size implies less monopoly power. The Herfindahl index of firm sales also shows a significant decline. The finding that large incumbent firms grew larger is also consistent with the removal of licens-ing-regime restrictions. A license to enter an industry also stipulated firm quotas on output and investment, artificially curtailing firm size independent of produc-tivity. Following deregulation, the most dynamic and efficient incumbent firms could expand unhampered.7
The U-shaped pattern in postderegulation firm-size distribution indicates a large number of small firms and a small number of large firms. While deregu-lation led to an increase in the number of small firms, it may have also created a winner-take-all environment in which the largest firms drive out competition. At the same time, there is a hollowing out of the middle of the size distribution that can be characterized as the shrinking middle in Indian manufacturing and that points to constraints that small and medium-sized firms may continue to face in their attempts to grow.8
The paper is organized as follows. Sections 2 and 3 provide brief overviews of the related literature and deregulation policy measures. Section 4 describes the data. Section 5 presents summary statistics for firm-size distributions and prof-itability before and after deregulation and for incumbents and new entrants. Section 6 presents the empirical methodology, results, and detailed robustness checks. Section 7 concludes.
2. Related Literature
Recent theoretical explanations of the evolution of firm-size distribution and resource reallocation focus on selection mechanisms and survival: inefficient firms are forced to exit, and resources are reallocated to more productive firms
6 Bollard, Klenow, and Sharma (2013), using the Indian Annual Survey of Industries, find evi-dence of a large acceleration in manufacturing-sector productivity growth in the early 1990s, par-ticularly for large incumbents. Sharma (2008) and Chamarbagwalla and Sharma (2008) also present evidence on the importance of large plants in raising labor productivity levels and the demand for skilled workers, respectively.
7 Inputs imported thanks to trade liberalization may also have allowed large incumbents to be-come more efficient and grow.
8 Related to the issue of the shrinking middle are the political economy considerations that enter into the decision to deregulate. As emphasized in Rajan and Zingales (2003a, 2003b), entrenched incumbent firms may have incentives to oppose liberalization. Alfaro and Chari (2010) find that, in the political economy literature, incumbent-firm power measured by industry concentration and state ownership is inversely correlated with the probability of deregulation. Chari and Gupta (2008) focus on FDI liberalization and find that the probability of foreign-entry liberalization is also in-versely related to industry concentration and state-owned firm presence, while Alfaro and Chari (2010) suggest that trade liberalization in India was inversely correlated with industry concentra-tion.
This content downloaded from 45.37.104.148 on Thu, 7 May 2015 16:03:44 PMAll use subject to JSTOR Terms and Conditions

Deregulation and Firm Size 901
(Hopenhayn 1992; Ericson and Pakes 1995; Luttmer 2007; Jovanovic 1982; Melitz 2003). Lower entry costs in models with monopolistic competition and heteroge-neous firms lead to changes in firm composition within industries and improve-ments in aggregate productivity.
In the Indian context, two forces can affect firm revenues and determine the to-tal impact of deregulation on firm size and profitability. First, free entry can lead to a reallocation of factor resources from less efficient domestic firms to more efficient firms, such that revenue and size distributions become left truncated. Second, rapid economic growth can lead to an increase in market size, precipitat-ing a rightward shift in the revenue distribution for the surviving domestic firms. India’s period of deregulation in the early 1990s coincided with rapid economic growth. To analyze the redistributive effects of deregulation on firm size and profitability, we design regression specifications to capture the selection effects induced by free entry and the size effects associated with a growing economy.
This paper is also related to a large literature on the size and productivity dis-tribution of firms in macroeconomics, trade, finance, and industrial organization. In brief, some of this research predicts that deregulation will lead to more firms and less incumbent power (Blanchard and Giavazzi 2003; Alesina et al. 2005), in-creases in average firm size and profits through reductions in capacity restrictions (Blanchard and Giavazzi 2003; Alesina et al. 2005; Campbell and Hopenhayn 2005), increased dispersion in sales, assets, and profits (Campbell and Hopen-hayn 2005; Syverson 2004), and increased turnover and firm-age distributions tilting toward younger firms (Asplund and Nocke 2006).
Most models of deregulation assume that firms are able to efficiently allocate resources within the firm and that factor markets are frictionless.9 Panagariya (2008) notes that remnants of industrial regulation still affect the operation of In-dian firms and may constrain their flexibility in adjusting to new economic con-ditions. Lingering restrictions, for example, can make it difficult for small firms to enter. India’s reforms opened up parts of the economy for competition but left “an alliance of well-connected industrialists and public officials [dubbed ‘the Re-source Raj’] who between them carve up the permissions and licences that have in the past underpinned India’s growth.”10 Note also that as regulation increases, it typically imposes a fixed cost that increases the optimal scale of a firm. Deregu-lation therefore ought to benefit firms whose optimal scale is small.11
Evidence also suggests that despite the extensive industrial deregulation in the early 1990s, rigid labor market regulations may continue to affect the daily oper-ations of Indian firms, potentially precluding them from eliminating unprofit-able product lines. For example, a 1982 all-India amendment (No. 46 of 1982) to the Industrial Disputes Act (No. 14 of 1947, India Code [1993], vol. 13) required
9 The exception is Garciano, LeLarge, and Van Reenen (2012), who find that sharp increases in firing costs have a significant impact on the size distribution of firms (a broken power law) and pro-ductivity and that the costs of the regulation are sizable.
10 Raghuram Rajan, as quoted in Crabtree (2012, p. 19).11 We thank the editor for bringing this point to our attention.
This content downloaded from 45.37.104.148 on Thu, 7 May 2015 16:03:44 PMAll use subject to JSTOR Terms and Conditions

902 The Journal of LAW & ECONOMICS
firms with more than 100 employees to seek government approval to dismiss workers (Kochhar et al. 2006). In addition, liquidation procedures are cumber-some and lengthy. Panagariya (2008, p. 293) notes, “India operates in a world with virtually no exit doors.” According to World Bank (2005), India’s bank-ruptcy rate was four per 10,000 firms, compared with 15 in Thailand and 350 in the United States.
This paper is related to the literature that examines various aspects of the 1991 reforms in India. Most closely related, however, is Aghion et al. (2008), which ex-amines the unequal effects of delicensing across Indian states with different labor market regulations.12 Our analysis focuses on the distributional consequences of deregulation and the nonlinear evolution of the firm-size distribution.
3. The New Industrial Policy of 1991
Following a balance-of-payments crisis in 1991, a new industrial policy abol-ished the system of licensing for all but a few key industries. In addition, pri-vate firms were allowed to enter industries previously reserved for state-owned firms—a policy commonly referred to as dereservation. The broad-based reform package of 1991 also included concurrent reforms that could impact entry, such as tariff reductions that could introduce import competition product markets and foreign direct investment (FDI) liberalization that allowed foreign firms into a subset of industries.13 In this section, we provide a broad overview of the re-forms and refer the reader to in-depth studies about specific measures.
The trend toward delicensing and dereservation began with the 1985 indus-trial policy statements, which outlined many liberalization measures. The pace of these trends accelerated with the measures outlined in the Industrial Policy Reso-lution of 1991 (Government of India 1991).
As a result, compulsory industrial licensing was abolished for all except the 18 industries specified in Section A1.2. Those industries continued to be subject to compulsory licensing for reasons related to “security and strategic concerns, social reasons, problems related to safety and over-riding environmental issues, manufacture of products of hazardous nature and articles of elitist consumption” (Government of India 1991, p. 5). Areas where security and strategic concerns predominate also continued to be reserved for the state-owned sector (see Sec-tion A1.1). The statement also iterated that the exemption from licensing was ex-pected to make the manufacturing sector more competitive and efficient and to be particularly helpful to the many entrepreneurs of dynamic small and medium firms who had been unnecessarily hampered by the licensing system.14
12 Analyzing the liberalization of FDI and the reduction in the tariff rate in India, Sivadasan (2009) finds significant increases in productivity in the FDI- and tariff-liberalized industries (particularly in 1993–94) and declines in output prices and concentration measures in the liberalized sectors.
13 To test for the robustness of our findings, our estimations control for the effects of the concur-rent policy changes.
14 According to Kochhar et al. (2006), the licensing regime that imposed restrictions on entry and capacity resulted in relatively small firms. In 1990, the average manufacturing firm in India was less than one-tenth the size of the average firm in the United States.
This content downloaded from 45.37.104.148 on Thu, 7 May 2015 16:03:44 PMAll use subject to JSTOR Terms and Conditions

Deregulation and Firm Size 903
A natural question that arises in the context of any policy change applied dif-ferentially across industries is why certain industries were deregulated and others were not. It is important to note that the delicensing measures from 1991 were enacted under the auspices of an International Monetary Fund structural pro-gram in response to a balance-of-payments crisis. Since the crisis and reforms were largely unexpected, it is difficult to make a case that certain industries may have anticipated and lobbied either in favor of or against the reforms.15
From the lists of industries in Section A1, it is not obvious that other usual suspects for selection bias, such as optimal industrial structure, were the drivers of deregulation. For instance, the beverages industry was deregulated, while the alcoholic beverages segment was kept restricted because of social concerns.16
The 1991 FDI reforms reduced barriers to foreign entry in a subset of in-dustries. Automatic approval was granted for FDIs of up to 51 percent in 46 of 96 NCI3 categories (for industries listed in Annex III of Government of India [1991]).17 In addition, trade liberalization led to a reduction in the level and dis-persion of tariffs, a removal of quantitative restrictions on imported inputs and capital goods for export production, and elimination of a public-sector monop-oly on imports of almost all items (see Topalova 2007).
4. The Data
We use firm-level data from the Prowess database. Prowess covers both pub-licly listed and unlisted firms from a wide cross section of manufacturing, ser-vices, utilities, and financial industries from 1989–2005. About one-third of the firms in the Prowess data are publicly listed firms. The companies covered ac-count for more than 70 percent of industrial output, 75 percent of corporate taxes, and more than 95 percent of the excise taxes collected by the Government of India .
The advantage of having detailed balance sheet and ownership data at the firm level is the information they provide regarding a number of variables, such as
15 Aghion et al. (2008) advance a similar argument to make the case that the reforms constituted an exogenous shock. Following Aghion et. al. (2008), we ran a cross-sectional regression of the year in which an industry with a three-digit National Industrial Classification (NIC3) code was deregu-lated on sales growth in that industry during 1990–91 (prior to deregulation) to see if the govern-ment deregulated industries according to their perceived growth potential. We found no evidence of a relationship between deregulated industries and prereform sales growth (estimated coefficient of interest, −.0333; SE = .0785). Our t-tests of means also confirm that sales growth was not statisti-cally significantly different across the deregulated and restricted industries in the prereform period. Similar results are found using other measures of prereform industrial performance, such as asset growth and firm profitability growth, during 1988–91. The absence of systematic differences in pre-reform economic performance between industries provides evidence that the deregulation decision was largely exogenous.
16 Similarly, the manufacturing of refrigerators, dishwashers, washing machines, microwave ov-ens, and air conditioners remained restricted, while the manufacture of televisions, radios, and other domestic appliances was deregulated. It appears that the government made an arbitrary distinction.
17 In the remaining 50 industries, the state continued to require that foreign investors obtain ap-proval for entry. Government of India (1991) provides information about the list of manufacturing industries in which the state liberalized foreign entry and a list of industries where domestic entry restrictions continued to be in effect.
This content downloaded from 45.37.104.148 on Thu, 7 May 2015 16:03:44 PMAll use subject to JSTOR Terms and Conditions

904 The Journal of LAW & ECONOMICS
sales, profitability, and assets, for an average of more than 10,800 firms during our sample period (1989–2005). Unlike the Annual Survey of Industries (ASI),18 which has been used in numerous studies focusing on India (for example, Chari [2011] and Hseih and Klenow [2009]), Prowess is a firm-level panel data set.19 The data are therefore particularly well suited for examination of how firms ad-just over time and how their responses may be related to policy changes. Previous attempts to estimate the effect of the licensing regime have been hampered by the fact that the ASI data on factories in India consist of repeated cross sections, which rules out the possibility of observing growth at the firm level (Chari 2011).
Prowess covers firms in the organized sector, which refers to registered compa-nies that submit financial statements. According to the government, “[T]he orga-nized sector comprises enterprises for which the statistics are available from the budget documents or reports, etc. On the other hand the unorganized sector re-fers to those enterprises whose activities or collection of data is not regulated un-der any legal provision or do not maintain any regular accounts” (Government of India, 2000, p. 2). The Companies Act (No. 1 of 1956, India Code [1993]) requires Indian firms to disclose information on capacities, production, and sales in their annual reports. All listed companies are included in the database, regardless of whether financials are available.20
The Indian National Industrial Classification system21 classifies firms in the Prowess data set by industry. The data include information on firms from a wide range of industries, including mining, basic manufacturing, financial and real es-tate services, and energy distribution.
Another advantage of firm-level data is that detailed balance sheet and incor-poration information allows us to analyze how incumbent firms are affected by policy changes like deregulation. In contrast, industry-level databases usually do not provide information about sales, assets, and profits by incorporation year and, hence, firm age.22
The data allow us to examine whether the ownership composition of firms changed by number and size of firms, fraction of sales, or assets and profits by age (incumbent status) and industry. We can also examine changes in firm activity and market dynamics in industries where entry restrictions, both foreign and do-
18 The Annual Survey of Industries (ASI) is an annual census conducted by sampling factories employing 100 or more workers. In larger industries, 20 percent of the factories are sampled every year, so that any given factory is sampled once in 5 years. The data therefore consist of repeated cross sections.
19 The Prowess database has been used in several studies, including Bertrand, Mehta, and Mullain-athan (2002), Khanna and Palepu (1999, 2005), Fisman and Khanna (2004), and Chari and Gupta (2008).
20 Unlisted companies are not required to disclose their financials. The CMIE asks their permis-sion, but if they refuse, it cannot include these companies in Prowess.
21 Government of India, Ministry of Statistics and Programme Implementation, National Indus-trial Classification —1998 (http://mospi.nic.in/Mospi_New/upload/nic_98_9apr08.htm).
22 Since firms are not required to disclose employment in their annual reports, we observe em-ployment data for only a more restricted sample of firms. The financial services industry is the only industry mandated by law to disclose employment information. Since the sample of firms that re-port employment is small, we do not focus on these numbers.
This content downloaded from 45.37.104.148 on Thu, 7 May 2015 16:03:44 PMAll use subject to JSTOR Terms and Conditions

Deregulation and Firm Size 905
mestic, were lifted. Table A2 provides a description of variables used in the data analysis.
One concern about the data may be related to the presence of new entrants versus improvements in the data coverage by the CMIE. However, for all firms that Prowess covers, financial data from 1989 onward—wherever available—are added to the database. We address the issue of improved coverage in the data ver-sus new entry by making use of information about incorporation dates. We begin with a sample of firms with data for 1989 and allow firms to enter the sample only if they enter the sample with data coinciding with their incorporation date. After 1991, a firm is identified as a new entrant only if its data coverage coincides with its incorporation date (which should also be later than 1991).
A point about firm exit is worth noting. The data set contains a code for firms that exited the data via mergers and acquisitions. However, the data do not flag firms that are shut down versus those for whom coverage was discontinued. Therefore, when we no longer observe data for a firm, we assume firm exit. But this may also reflect discontinued coverage by Prowess or the failure of unlisted firms to provide data about their operations. To address this issue, we construct a balanced panel of incumbent firms that we follow over the sample period and an unbalanced panel of incumbent and new-entrant firms into which we allow a new firm to enter only if data availability coincides with the year of incorporation after 1991. We also classify firms that do not report data because of mergers and acquisitions as firms that exit the data because of consolidation.
Note that, unlike the ASI, which is a survey of manufacturing, the Prowess data are a panel of firms. The ASI is a repeated cross section such that only one-fifth of the factories in any given industry in a state are in the sample in any particu-lar year. The sampling design implies that a factory appears in the ASI sample only once every 5 years, so the data are not of a panel nature. Prowess is there-fore particularly well suited to examining how firm characteristics, including firm size and profitability distributions, evolve over time and may respond to policy changes.
While Prowess is not a census of manufacturing firms, a number of papers use the data to exploit its panel nature. For instance, Goldberg et al. (2010) use the Prowess data set to examine how firms adjust their product mix over time. New products introduced into the market by firms not covered by Prowess are also excluded from their study.
5. Statistics
Consistent with the rapid economic growth observed in India after the mid-1980s, firm activity measured by the number of firms grew substantially relative to the beginning of the sample period. The data show the incorporation of large numbers of new firms following the reforms. Entry acceleration after 1991 con-tinued through the rest of the decade, and 4,800 new firms had entered the mar-ket by 2005. The data also show evidence of lingering exit restrictions, however.
This content downloaded from 45.37.104.148 on Thu, 7 May 2015 16:03:44 PMAll use subject to JSTOR Terms and Conditions

906 The Journal of LAW & ECONOMICS
While there is significant evidence of increased firm entry, we observe little firm exit.
To provide evidence of lingering exit restrictions, we tabulate firms making losses over 3, 4, and 5 consecutive years. Between 2000 and 2007, approximately 440, 250, and 130 firms in the sample reported losses for 3, 4, and 5 consecutive years, respectively. Our evidence is consistent with that of Gormley, Gupta, and Jha (2014), who find that the bankruptcy process in India is characterized by in-efficient outcomes and long delays in part because creditors lack the incentives to push firms to repay their loans, come up with a restructuring plan, and recover assets in the context of a weak legal system. For example, it takes India’s bank-ruptcy court an average of 7 years to order a restructuring and 6.5 years for liqui-dations (Kang and Nayar 2004). Panagariya (2008) also provides evidence of lin-gering exit restrictions given that the number of bankruptcies per thousand firms in India is significantly lower than bankruptcy rates elsewhere around the world.
5.1. Summary Statistics
Table 1 shows summary statistics for industry concentration (according to the Herfindahl index),23 firm size, profitability, and dispersion measures (with the co-efficient of variation calculated using assets and sales). Underlying average mar-ket share values are calculated for a given firm across the years in a subperiod, and then the Herfindahl index value is calculated by industry for a given subpe-riod. The Prowess database provides four- and five-digit industry classifications for most firms. However, because the deregulation policies were enacted at the three-digit level, industry concentration is accordingly computed at that level. We present data for the full sample first and then by the year of incorporation and for the deregulated industries. Table A1 presents detailed information on the industries included in the data.
For the full sample, Table 1 shows a reduction in market concentration for the average firm throughout the sample period. The Herfindahl index values suggest increased competition among firms in India. The coefficients of variation (for both sales and assets) also indicate increased dispersion. A picture emerges of the average manufacturing firm in India growing smaller—in terms of assets, sales, and profits—and becoming substantially more heterogeneous over the period.
Table 1 also presents information by year of incorporation (for the periods pre-1947, 1947–85, and 1986–2005). The oldest firm in the sample (Howrah Mills Company Ltd.) was incorporated in 1825, and the sample begins with over 390 manufacturing firms incorporated before independence. Some firms exit the sample through mergers. Many older firms (preindependence), however, remain in operation following the reforms.
23 The Herfindahl index is an indicator of the degree of competition among firms in an industry. It is defined as the square of the market shares of each firm in an industry. The value of the Herfindahl index can range from 0, in perfectly competitive industries, to 1, in single- producer monopolies. All data are first expressed in constant rupees crore.
This content downloaded from 45.37.104.148 on Thu, 7 May 2015 16:03:44 PMAll use subject to JSTOR Terms and Conditions

Deregulation and Firm Size 907
Table 1 also presents data on how firms evolved in the deregulated industries. Relative to the full sample, market concentration seems to have fallen signifi-cantly for the deregulated industries—the Herfindahl index values decline from .28 to .21—which is consistent with declining incumbent monopoly power. The market share, size, and profitability of the average firm in deregulated industries declined significantly 5 years following the policy change. Dispersion in firm size also increased following deregulation.
The corresponding statistics for restricted industries are also shown in Table 1. The values suggest that restricted industries were significantly more concen-trated than the deregulated industries and remained so over the sample period. According to t-tests of the means, these differences are statistically significant. Note that new firms could operate in restricted industries if they were granted a license. Further, in contrast to the pattern of decreases in deregulated industries, average firm size and profitability remain remarkably unchanged over time in the restricted industries.
Total market share in Table 1 refers to the fraction of sales accounted for by in-cumbent and new-entrant firms relative to the total sales in a particular industry. It is interesting to note that, for total sales, the average market share of incumbent firms declined from 99 percent to 84 percent from 1989 to 2005. Mirroring this decline is the increase from 1 percent to 11 percent in the average market share of new entrants incorporated after 1991.24
Table 1 shows market shares, average firm profits, sales, and assets in dereg-ulated industries declining significantly for the average firm following the pol-icy change. However, the average profits of incumbent firms appear to have re-mained stable.
In brief, summary statistics suggest that industry concentration, average mar-ket shares, firm size, and profits all declined in deregulated industries. The coef-ficient of variation in average firm sales and assets increased, which suggests that there is greater dispersion in firm size in deregulated industries.
5.2. Distributional Statistics
Table 2 presents detailed distributional statistics for firm size before and after deregulation. For both assets and sales, the mean and median values suggest that firm size declined over the sample period. The pattern holds for incumbent firms as well. New entrants, on the other hand, experienced an increase in firm size, perhaps not surprisingly.
The average incumbent firm has grown smaller, more profitable (Table 1), and
24 Note that the market shares of incumbents and new entrants do not sum to exactly 100 percent. The measure of total market share for incumbents was constructed by taking the ratio of total in-cumbent sales to total industry sales by NIC3 industry and then taking an average of this ratio across industries. Similarly, the total market share of new entrants was constructed by taking the ratio of total new-entrant sales to total industry sales by NIC3 industry and then averaging this ratio across industries.
This content downloaded from 45.37.104.148 on Thu, 7 May 2015 16:03:44 PMAll use subject to JSTOR Terms and Conditions

Table 1Firm Size, Firm Profits, and Market Concentration
in Manufacturing: Summary Statistics
1989–90 1991–95 1996–2002 2003–5Full sample: NIC3 Herfindahl Index (Sales) .33 .28 .25 .24 Average Firm Profits 10.02 7.96 8.01 11.24 Average Firm Size (Assets) 83.98 69.66 75.71 90.73 Average Firm Size (Sales) 83.97 55.33 59.91 81.07 Coefficient of Variation of Firm Size (Assets) 5.40 6.61 6.61 7.63 Coefficient of Variation of Firm Size (Sales) 5.49 6.66 9.90 11.31 N 3,147 15,741 33,807 19,353Year of incorporation: Before 1947: Assets 86.74 97.44 129.63 151.30 Sales 103.20 97.63 111.95 131.13 PBDIT 10.56 12.54 15.31 21.09 Return on Assets (%) 11.52 12.26 7.26 6.31 1947–85: Assets 87.02 84.71 101.28 129.17 Sales 83.15 66.70 87.33 131.19 PBDITA 10.43 9.79 11.56 17.85 Return on Assets (%) 13.90 13.21 7.60 10.30 1986–2005: Assets 31.64 24.62 38.49 53.95 Sales 18.58 11.43 21.18 37.39 PBDIT 2.33 1.91 2.88 5.00 Return on Assets (%) 10.17 9.10 6.01 4.56Deregulated industries: Herfindahl Index .28 .24 .23 .21 Market Share (Sales) 3.07 1.53 1.29 .86 Firm Profits 8.34 6.16 6.12 7.46 Firm Size (Assets) 61.77 45.36 50.28 55.10 Firm Size (Sales) 62.23 40.41 42.98 51.57 Coefficient of Variation of Firm Size (Assets) 2.90 3.25 3.48 4.05 Coefficient of Variation of Firm Size (Sales) 2.17 2.93 3.51 4.58Restricted industries: Herfindahl Index .37 .31 .30 .27 Market Share (Sales) 4.24 2.26 1.87 1.38 Firm Profits 11.69 9.74 10.05 10.12 Firm Size (Assets) 105.99 93.76 97.83 101.81 Firm Size (Sales) 105.49 70.11 76.49 81.49 Coefficient of Variation of Firm Size (Assets) 5.79 6.74 6.74 6.95 Coefficient of Variation of Firm Size (Sales) 6.03 7.21 9.49 4.58Incumbents: Total Market Share (Sales) .99 .98 .91 .84 Average Firm Profits 10.11 8.82 10.05 15.06 Average Firm Size (Assets) 84.74 76.58 90.98 115.14 Average Firm Size (Sales) 84.64 61.21 74.31 107.33
This content downloaded from 45.37.104.148 on Thu, 7 May 2015 16:03:44 PMAll use subject to JSTOR Terms and Conditions

Deregulation and Firm Size 909
somewhat more heterogeneous in size.25 For the average incumbent firm, disper-sion in firm size measured by the standard deviation and coefficient of variation has increased. While new entrants have also grown significantly in terms of sales and assets, the incumbent firms are considerably bigger than the new entrants. Consistent with international evidence, this suggests that young firms tend to be small. For new entrants, dispersion also increases during the sample period.
The tails of the size distribution in Table 2 reveal two distinct patterns. First, the smallest firms in the left-hand tail of the size distribution have become smaller over time. The firms in the 10th percentile have grown considerably smaller since deregulation. The data also suggest that there are more small firms in the sam-ple following deregulation, and—perhaps not surprisingly—the new entrants are much smaller than the incumbent firms in the lowest percentiles for both assets and sales.
Second, the largest new entrants have grown bigger; for this subsample, the largest firms in the 99th percentile have grown larger over time. These two pat-terns from the distributional data (small firms getting smaller and big firms big-ger) are consistent with an increase in the standard deviation in the size distribu-tion. Consistent with the increase in the standard deviation of firm size and the decrease in the average firm size, firm-size dispersion measured by the coefficient of variation also increases.
With respect to averages, the preliminary findings from the size distribution data are not entirely consistent with the predictions of models with selection that result in a left-truncated distribution and predict that average firm size should rise. For the largest firms, the left-hand tail of the size distribution becomes considerably thicker. In addition, average firm size and average firm profits fall rather than rise. These findings are, at first glance, consistent with Blanchard and Giavazzi (2003) and Alesina et al. (2005), in which incumbent firms are predicted to lose monopoly power following deregulation. The marginal increase in the
25 Note that the measures of average firm profit, sales, and assets were constructed by taking firm averages by year and industry and then averaging these measures across industries and years for a given period. For example, the average firm asset size of 69.15 rupees crore was constructed by taking the average of average firm assets by industry across industries and over the 2-year period 1989–90.
Table 1 (Continued)
1989–90 1991–95 1996–2002 2003–5New entrants: Total Market Share (Sales) .01 .02 .08 .11 Average Firm Profits 2.88 1.00 2.26 4.78 Average Firm Size (Assets) 23.71 13.68 32.83 49.43 Average Firm Size (Sales) 30.63 7.76 19.49 36.48Note. Data are from the Prowess database. Sales are generated by a firm from its main business activity, measured by charges to customers for goods supplied and services rendered. Gross fixed assets of a firm include movable and immovable assets as well as assets that are in the process of being installed. Profits; assets; sales; profit before depreciation, interest, and taxes (PBDIT); and profit before depreciation, interest, taxes, and amortization (PBDITA) are given in constant rupees crore.
This content downloaded from 45.37.104.148 on Thu, 7 May 2015 16:03:44 PMAll use subject to JSTOR Terms and Conditions

Tabl
e 2
Firm
Sal
es a
nd A
sset
s for
the
Full
Sam
ple:
Incu
mbe
nts a
nd N
ew E
ntra
nts
N10
th
Perc
entil
eM
ean
Med
ian
90th
Pe
rcen
tile
Max
Stan
dard
D
evia
tion
Coe
ffici
ent o
f V
aria
tion
Log
sale
s:
Full
sam
ple:
1989
–90
3,11
01.
643.
153.
046.
869.
591.
43.4
5
19
91–9
514
,794
.24
2.43
2.52
6.49
9.91
1.84
.76
1991
–200
563
,524
−.48
2.14
2.33
6.58
10.8
12.
12.9
9
19
91–2
007
73,0
86−.
542.
172.
366.
7111
.13
2.17
1.00
In
cum
bent
s:
19
89–9
03,
071
1.63
3.15
3.04
6.89
9.59
1.44
.46
1991
–95
13,5
77.5
32.
562.
626.
559.
911.
76.6
9
19
91–2
005
55,0
11−.
202.
372.
546.
8211
.13
2.12
.89
N
ew e
ntra
nts:
1991
–95
1,21
7−1
.91
.92
1.17
4.72
5.86
2.04
2.22
1991
–200
518
,075
−1.3
51.
541.
796.
269.
332.
201.
43Lo
g as
sets
:
Full
sam
ple:
1989
–90
3,14
71.
422.
992.
837.
099.
371.
44.4
8
19
91–9
515
,737
.68
2.51
2.40
6.84
9.63
1.61
.64
1991
–200
568
,868
.23
2.29
2.23
7.04
10.1
41.
88.8
2
Incu
mbe
nts:
1989
–90
3,10
81.
423.
002.
837.
099.
371.
44.4
8
19
91–9
514
,007
.86
2.64
2.51
7.01
9.63
1.57
.59
1991
–200
558
,107
.40
2.50
2.43
7.33
10.4
31.
87.7
5
New
ent
rant
s:
19
91–9
51,
730
−.39
1.45
1.48
4.93
7.00
1.53
1.06
1991
–200
521
,937
−.75
1.62
1.71
6.59
8.93
2.10
1.30
Not
e. D
ata
are
from
the
Prow
ess d
atab
ase.
Sal
es a
re g
ener
ated
by
a fir
m fr
om it
s mai
n bu
sines
s act
ivity
, mea
sure
d by
cha
rges
to c
usto
mer
s for
goo
ds su
pplie
d an
d se
rvic
es re
nder
ed. G
ross
fixe
d as
sets
of a
firm
incl
ude
mov
able
and
imm
ovab
le a
sset
s as w
ell a
s ass
ets t
hat a
re in
the
proc
ess o
f bei
ng in
stal
led.
Incu
mbe
nts
are
firm
s inc
orpo
rate
d be
fore
199
0; n
ew e
ntra
nts a
re fi
rms i
ncor
pora
ted
after
199
1.
This content downloaded from 45.37.104.148 on Thu, 7 May 2015 16:03:44 PMAll use subject to JSTOR Terms and Conditions

Deregulation and Firm Size 911
number of small firms is consistent with an increase in competition following deregulation.
The last column of Table 2 shows that the size distribution becomes negatively skewed over time. The pattern is more clearly seen in Figures 1 and 2. The size distribution flattens and shifts in the direction of negative skewness following de-regulation, with the magnitude of skewness increasing over time. The size distri-bution in the early years following deregulation (1991–95) is more skewed than in the period prior to deregulation (1989–90), and the size distribution in the later years (2003–5) is more skewed than in the early years (1991–95) after dereg-ulation. The shift in the pattern of skewness holds for both log assets and log sales as well as for the incumbent firms. We do not conduct the analysis for the new entrants because, by definition, they did not exist before deregulation.
6. Empirical Methodology and Results
This section presents formal estimations of deregulation’s impact on firm size. We begin by considering a balanced panel of incumbent firms that existed before deregulation. Then we present unbalanced panel estimates that allow for compo-sitional effects to occur with new firms in the sample. We also estimate the extent of resource reallocation or the efficiency gains that take place in the postreform period. Finally, we show additional tests to check for the robustness of the results.
6.1. Deregulation and Size: Balanced Panel
To examine the impact of deregulation, a restricted-sample panel of incumbent firms is better suited to analyzing the pre- and postderegulation effects on these firms. By restricting the sample to incumbent firms, we can parse the composi-tional effects that occur with new firms entering the sample. We first look at the impact of deregulation on incumbent firms without firm fixed effects to examine more simply what happens to incumbent firms. Second, we introduce composi-tional controls in the form of firm fixed effects to control for unobserved hetero-geneity at the firm level. Third, we examine an unbalanced panel that allows for compositional effects to occur with new entrants to analyze distributional effects.
We begin with the following benchmark regression specification, for firm i in sector j and year t:
Yijt = ai + Yeart + Delicensejt + εijt, (1)
where Yijt represents different outcome variables, such as sales or profitability, and Delicensejt is a dummy variable that takes a value of one if a firm is an in-dustry that deregulated entry in 1991 (and for all following years) and zero other-wise. We also control for firm fixed effects in different specifications.
To account for the rapid growth in the economy over this period, we incorpo-rate a year trend variable into the specifications. We report estimates with and without the year trend to highlight the impact on the coefficient estimates and their interpretation. Standard errors are robust and clustered at the NIC3 level.
This content downloaded from 45.37.104.148 on Thu, 7 May 2015 16:03:44 PMAll use subject to JSTOR Terms and Conditions

912
Figu
re 1
. Fl
atte
ning
of fi
rm-s
ize
dist
ribut
ion
over
tim
e: fu
ll sa
mpl
e
This content downloaded from 45.37.104.148 on Thu, 7 May 2015 16:03:44 PMAll use subject to JSTOR Terms and Conditions

913
Figu
re 2
. Fl
atte
ning
of fi
rm-s
ize
dist
ribut
ion
over
tim
e: in
cum
bent
s (left
) and
incu
mbe
nts a
nd n
ew e
ntra
nts (
right
)
This content downloaded from 45.37.104.148 on Thu, 7 May 2015 16:03:44 PMAll use subject to JSTOR Terms and Conditions

914 The Journal of LAW & ECONOMICS
Table 3 presents regression estimates for a balanced panel of firms. The depen-dent variable is the logarithm of annual firm sales. Columns 1 and 3 show the im-pact of deregulation on log sales and log assets for incumbent firms with industry fixed effects. The coefficient on Delicense is negative and significant for both firm sales and assets. The coefficient on the year trend, on the other hand, is positive and significant.
The results from the specification in columns 1 and 3 suggest that the im-pact of deregulation on firm size in the context of a growing economy can be decomposed into two effects: a competitive effect and a growth effect. Competi-tion through entry appears to reduce average firm size, but the growing economy benefits all participants, thus increasing average firm size. Incorporating the year trend variable is therefore important not only because it allows us to isolate the impact of deregulation on firm size but also because it suggests that a dynamic model is better suited to examining the effects of deregulation on competition and firm size in a rapidly growing economy.
The negative and significant coefficient on the deregulation dummy (Deli-cense) is consistent with two alternative interpretations. Recall that the dummy is set to one for 1991 and all the following years. The negative coefficient on Deli-cense, along with the positive year trend coefficient, can be interpreted as either a decline in average firm size in deregulated industries or, controlling for the over-all growth of the economy, slower growth in the deregulated industries.
In addition to specifications that incorporate a simple linear trend (columns 1 and 3 in Table 3), the specifications in columns 2 and 4 include year fixed effects to allow for macroeconomic shocks that affected all industries in the same way. The coefficient on Delicense remains negative and significant.
Columns 5 and 6 present regression estimates in specifications using an un-balanced panel of firms. Average firm profitability rose among the deregulated industries. Consistent with an increase in competitiveness and with the summary statistics shown in Table 1, the Herfindahl index value declined significantly in deregulated industries. We also see a pattern of declining Herfindahl index values when we estimate a specification with a balanced panel of incumbent firms, al-though with a slightly smaller magnitude of coefficient estimates, which suggests a decline in the monopoly power of incumbent firms after deregulation (consis-tent with the predictions from Blanchard and Giavazzi [2003]). The Herfindahl index also shows a significant decline if we restrict the sample period to the im-mediate aftermath of the deregulation in 1991–95. The magnitudes are smaller but significant. We do not include a year trend variable in the specifications in columns 5 and 6, as there is no obvious theoretical rationale for why profitability or industry concentration should be systematically affected by economic growth.
6.2. Deregulation and Size: Unbalanced Panel
Unbalanced panels allow for compositional effects to occur with entry. We use quantile regressions to examine the distributional effects of deregulation on firm size. Quantile (including median) regression models are also known as
This content downloaded from 45.37.104.148 on Thu, 7 May 2015 16:03:44 PMAll use subject to JSTOR Terms and Conditions

Tabl
e 3
Der
egul
atio
n an
d Fi
rm S
ize
Sale
sA
sset
s Pr
ofita
bilit
yH
erfin
dahl
Inde
x (S
ales
)(1
)(2
) (3
)(4
) (5
) (6
)D
elic
ense
−.16
40**
−.11
16*
−.13
98**
−.06
87+
2.74
01*
−.12
52**
(.044
)(.0
43)
(.033
)(.0
35)
(1.2
82)
-.037
Year
tren
d.0
666*
*.0
965*
*(.0
07)
(.006
)C
onst
ant
2.40
53**
2.92
34**
2.29
24**
3.01
93**
8.42
50**
.337
8**
(.027
)(.0
27)
(.028
)(.0
22)
(.294
)-.0
07Fi
xed
effec
tsYe
sYe
sYe
sYe
sYe
sN
oYe
ar d
umm
ies
No
Yes
No
Yes
No
No
N16
,648
16,6
4817
,115
17,1
1517
,118
875
R2.9
25.9
26.9
47.9
48.9
46.7
11N
ote.
Reg
ress
ion
estim
ates
are
for a
bal
ance
d pa
nel o
f firm
s for
198
9–95
. Del
icen
se in
dica
tes d
umm
y va
riabl
es th
at ta
ke a
val
ue o
f one
if a
firm
is in
an
indu
stry
that
der
egul
ated
in 1
991.
Clu
ster
ed st
anda
rd e
rror
s are
in p
aren
thes
es.
+ Sig
nific
ant a
t the
10
perc
ent l
evel
.* S
igni
fican
t at t
he 5
per
cent
leve
l.**
Sig
nific
ant a
t the
1 p
erce
nt le
vel.
This content downloaded from 45.37.104.148 on Thu, 7 May 2015 16:03:44 PMAll use subject to JSTOR Terms and Conditions

916 The Journal of LAW & ECONOMICS
least-absolute-value or minimum-absolute-deviation models. In the version of the quantile regression model using median regression estimates, the median of the dependent variable is analyzed conditional on the values of the independent variable. This is similar to least squares regression, which estimates the mean of the dependent variable. Alternatively, quantile regressions find the regression plane that minimizes the sum of the absolute residuals rather than the sum of the squared residuals.
We are interested in characterizing the entire distribution of firm size before and after deregulation. To do this, we use a benchmark specification that esti-mates the regression plane for quantiles ranging from the 5th percentile to the 95th percentile for the outcome variable of interest (size, profits, and so on). Standard errors are bootstrapped.
As described by Koenker and Bassett (1978), letting {xt : t = 1, . . . , T} denote a sequence of (row) K vectors of a known design matrix, suppose that {yt : t = 1, . . . , T} is a random sample on the regression process ut = yt − xtβ having distribution function F. The θth regression quantile, 0 < θ < 1, is defined as any solution to the minimization problem
min .: :†∈ ∈ ≥{ } ∈ <{ }∑ ∑− + −( ) −
R t t y xt t
t t y xt t
t t t t
y x yK
xβ β
θ θββ ββ1 (2)
The estimation is done using the above specification where y is the dependent variable, x is the vector of explanatory variables with k rows, and β is the coeffi-cient vector. The coefficient vector β will vary depending on the particular quan-tile being estimated. For example, θ = 1
2 represents the median. Standard errors are bootstrapped.
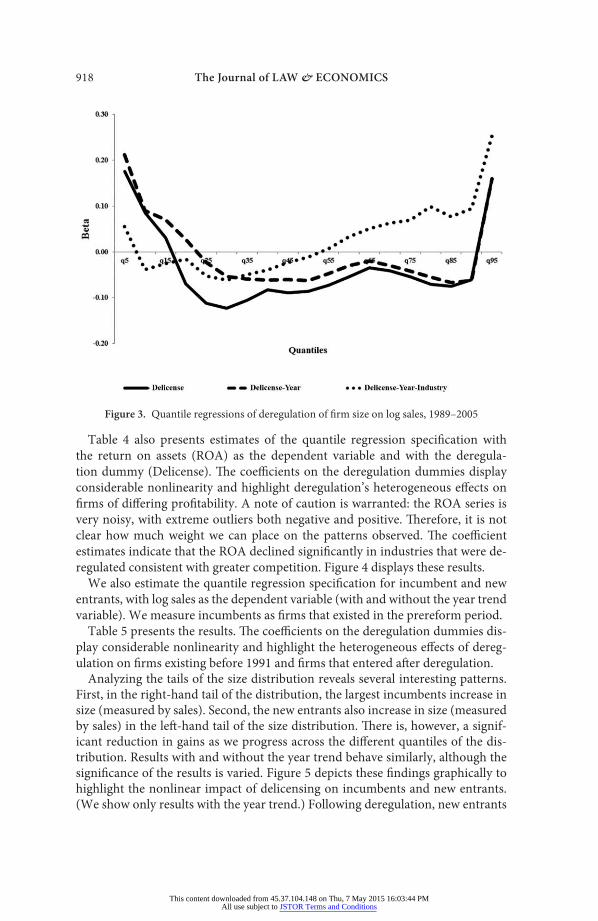
Table 4 estimates the quantile regression specification with log sales as the de-pendent variable and with the deregulation dummy (Delicense). Specification (2) includes the year trend variable. The coefficients on the deregulation dummies display considerable nonlinearity and highlight the heterogeneous effects of de-regulation on firms of different sizes.
The coefficient estimates suggest that the impact of deregulation on log sales for firms across firm-size quantiles is nonlinear. There is an increase in the aver-age firm size for firms in the 5th–15th percentiles, consistent with entry by small firms from the left-hand tail. All quantiles for the 20th–90th percentiles, however, decline significantly. Finally, the coefficient for the 95th percentile is positive and significant, consistent with large incumbents growing bigger. Adding a year trend shifts the quantile regression coefficients curve upward.
Figure 3 depicts these findings graphically to highlight the nonlinear effect of deregulation on firm size across quantiles. It also serves to highlight the vary-ing magnitude of the coefficient estimates across quantiles. Adding a year trend shifts the magnitude of the coefficient estimates on the deregulation measure on firm size. Adding industry fixed effects absorbs the time-invariant heterogeneity across industries along with the year trend variable, which results in a similar pattern.
This content downloaded from 45.37.104.148 on Thu, 7 May 2015 16:03:44 PMAll use subject to JSTOR Terms and Conditions

Table 4Quantile Regressions of Firm Size, as Measured by Log Sales, 1989–2005
Delicense (Log Sales) Delicense (Return on Assets)
(1) (2) (3)
Quantile Delicense Constant Delicense Year Trend Constant Delicense ConstantQ5 .1752**
(.050)−1.7117**
(.036).2123**
(.074)−.2188**(.008)
.7077**(.065)
−3.0519**(.598)
−9.7113**(.269)
Q10 .0850+
(.046)−.4359**(.022)
.0898*(.040)
−.1639**(.005)
1.3393**(.046)
−1.8887**(.266)
−2.5932**(.108)
Q15 .0305(.031)
.2675**(.015)
.0710+
(.037)−.1305**(.003)
1.6406**(.034)
−0.9336**(.138)
.0000**(.000)
Q20 −.0697**(.023)
.7922**(.014)
.0271(.032)
−.1051**(.003)
1.8565**(.025)
−.0951+
(.058).0951+
(.058)Q25 −.1123**
(.022)1.1691**(.012)
−.0235(.028)
−.0863**(.003)
2.0339**(.025)
−.5054**(.160)
2.0856**(.062)
Q30 −.1226**(.021)
1.4856**(.013)
−.0540*(.024)
−.0732**(.002)
2.2076**(.024)
−.5301**(.161)
4.0000**(.065)
Q35 −.1057**(.024)
1.7456**(.010)
−.0589*(.027)
−.0626**(.002)
2.3633**(.024)
−.5553**(.149)
5.6551**(.060)
Q40 −.0824**(.020)
1.9703**(.010)
−.0611*(.026)
−.0539**(.002)
2.5150**(.022)
−.4325**(.121)
7.0524**(.053)
Q45 −.0890**(.019)
2.1959**(.009)
−.0607*(.025)
−.0476**(.002)
2.6687**(.019)
−.2847*(.127)
8.2847**(.059)
Q50 −.0855**(.020)
2.4024**(.009)
−.0625**(.021)
−.0412**(.002)
2.8129**(.018)
−.2707*(.112)
9.4522**(.062)
Q55 −.0729**(.020)
2.6097**(.008)
−.0467*(.020)
−.0354**(.002)
2.9574**(.018)
−.2378**(.090)
10.5575**(.053)
Q60 −.0542**(.015)
2.8096**(.008)
−.0298(.019)
−.0309**(.002)
3.1228**(.021)
−.2215*(.086)
11.6731**(.051)
Q65 −.0343*(.015)
3.0274**(.009)
−.0196(.021)
−.0274**(.002)
3.3021**(.019)
−.2147*(.089)
12.8000**(.053)
Q70 −.0410**(.013)
3.2607**(.008)
−.0303(.022)
−.0234**(.001)
3.4975**(.018)
−.2043*(.098)
13.9928**(.060)
Q75 −.0539**(.011)
3.5259**(.009)
−.0419*(.019)
−.0193**(.002)
3.7190**(.022)
−.2688+
(.138)15.3365**
(.072)Q80 −.0706**
(.017)3.8154**(.011)
−.0544*(.022)
−.0134**(.002)
3.9488**(.025)
−.4312**(.139)
16.9432**(.064)
Q85 −.0745**(.017)
4.1520**(.013)
−.0666*(.030)
−.0101**(.002)
4.2537**(.030)
−.5600**(.143)
18.9560**(.078)
Q90 −.0608*(.025)
4.5857**(.013)
−.0620+
(.035)−.0084**(.002)
4.6727**(.028)
−.7654**(.124)
21.8362**(.081)
Q95 .1567**(.045)
5.2373**(.010)
.1596**(.046)
−.0012(.003)
5.2491**(.031)
−.5784*(.276)
26.8781**(.146)
Note. Quantile regressions for firm size are for an unbalanced panel of firms. Delicense is a dummy variable that takes a value of one if a firm is an industry that delicensed entry in 1991. Bootstrapped standard errors are in parentheses. N = 66,634.
+ Significant at the 10 percent level.* Significant at the 5 percent level.** Significant at the 1 percent level.
This content downloaded from 45.37.104.148 on Thu, 7 May 2015 16:03:44 PMAll use subject to JSTOR Terms and Conditions
918 The Journal of LAW & ECONOMICS
Table 4 also presents estimates of the quantile regression specification with the return on assets (ROA) as the dependent variable and with the deregula-tion dummy (Delicense). The coefficients on the deregulation dummies display considerable nonlinearity and highlight deregulation’s heterogeneous effects on firms of differing profitability. A note of caution is warranted: the ROA series is very noisy, with extreme outliers both negative and positive. Therefore, it is not clear how much weight we can place on the patterns observed. The coefficient estimates indicate that the ROA declined significantly in industries that were de-regulated consistent with greater competition. Figure 4 displays these results.
We also estimate the quantile regression specification for incumbent and new entrants, with log sales as the dependent variable (with and without the year trend variable). We measure incumbents as firms that existed in the prereform period.
Table 5 presents the results. The coefficients on the deregulation dummies dis-play considerable nonlinearity and highlight the heterogeneous effects of dereg-ulation on firms existing before 1991 and firms that entered after deregulation.
Analyzing the tails of the size distribution reveals several interesting patterns. First, in the right-hand tail of the distribution, the largest incumbents increase in size (measured by sales). Second, the new entrants also increase in size (measured by sales) in the left-hand tail of the size distribution. There is, however, a signif-icant reduction in gains as we progress across the different quantiles of the dis-tribution. Results with and without the year trend behave similarly, although the significance of the results is varied. Figure 5 depicts these findings graphically to highlight the nonlinear impact of delicensing on incumbents and new entrants. (We show only results with the year trend.) Following deregulation, new entrants
Figure 3. Quantile regressions of deregulation of firm size on log sales, 1989–2005
This content downloaded from 45.37.104.148 on Thu, 7 May 2015 16:03:44 PMAll use subject to JSTOR Terms and Conditions

Deregulation and Firm Size 919
expand at the lower levels of the distributions, while incumbents grow at the upper tails of the distribution. We obtain similar results using incumbents de-fined as firms existing before 1985 (results are available upon request). However, shrinking firm sizes in the middle quantiles is consistent with concerns about the missing middle in Indian manufacturing, which indicates that small firms may be constrained in their ability to grow.
6.3. Deregulation and Misallocation
Recent research has shown that policy and institutional distortions can signifi-cantly impact resource allocation across productive uses. The deregulation poli-cies implemented in India had the potential to have important effects on the re-allocation of resources. In this section, we examine the effects of deregulation on the allocation of resources across firms. Our methodology follows Alfaro et al. (2009), who draw on the work of Restuccia and Rogerson (2008) and Hsieh and Klenow (2009). We use a monopolistic competition model to analyze the impli-cations of deregulation for allocative efficiency in the postreform period. Given the similarities of our research with previous work, we briefly outline the model and methodology.
Final output is produced by a standard constant-elasticity-of-substitution ag-gregate of a continuum of differentiated goods. In this economy, there exists a continuum of production units that share the same Cobb-Douglas functional form but might differ in their productivity factors, which are indexed by φ:
y AA k lϕ ϕ ϕαϕα= −1 , (3)
where A is the economy-wide productivity factor; Aφ is the plant-specific produc-
Figure 4. Quantile regressions of the impact of delicensing on return on assets, 1989–2005
This content downloaded from 45.37.104.148 on Thu, 7 May 2015 16:03:44 PMAll use subject to JSTOR Terms and Conditions

Table 5Quantile Regressions of Firm Size of Incumbents and New Entrants,
as Measured by Log Sales, 1989–2005
Incumbents (Log Sales) New Entrants (Log Sales)
Delicense Year Trend Constant Delicense Year Trend ConstantQ5 .0832
(.069)−.2233**(.008)
1.0791**(.068)
.3182**(.111)
−.0236(.016)
−2.3431**(.221)
Q10 −.0166(.047)
−.1581**(.004)
1.5608**(.040)
.3837**(.086)
.0084(.013)
−1.5836**(.146)
Q15 −.0153(.033)
−.1223**(.003)
1.8077**(.024)
.4053**(.056)
.0280*(.012)
−1.0918**(.135)
Q20 −.0639*(.027)
−.0920**(.003)
1.9684**(.023)
.3651**(.036)
.0400**(.008)
−.7360**(.095)
Q25 −.0997**(.027)
−.0770**(.002)
2.1549**(.024)
.2934**(.041)
.0467**(.009)
−.3953**(.105)
Q30 −.0988**(.021)
−.0654**(.002)
2.3169**(.021)
.2545**(.037)
.0616**
.006−.2103**(.067)
Q35 −.0748**(.022)
−.0549**(.002)
2.4604**(.025)
.1760**(.033)
.0653**
.007.068
(.085)Q40 −.0761**
(.023)−.0460**(.002)
2.6057**(.021)
.1211**(.032)
.0690**
.005.3276**
(.073)Q45 −.0710**
(.021)−.0387**(.002)
2.7421**(.018)
.0744*(.030)
.0702**
.005.5694**
(.071)Q50 −.0619**
(.020)−.0317**(.002)
2.8749**(.021)
.0479(.032)
.0722**
.005.7718**
(.068)Q55 −.0459+
(.024)−.0261**(.002)
3.0198**(.021)
.0011(.042)
.0695**
.0061.0248**(.081)
Q60 −.0471*(.021)
−.0221**(.002)
3.1906**(.022)
−.022(.045)
.0712**
.0051.2394**(.065)
Q65 −.0435*(.021)
−.0193**(.002)
3.3793**(.022)
.0007(.039)
.0780**
.0051.3554**(.072)
Q70 −.0466*(.021)
−.0138**(.002)
3.5601**(.024)
.0043(.036)
.0830**
.0051.5134**(.068)
Q75 −.0652**(.023)
−.0068*(.003)
3.7561**(.023)
.0461(.048)
.0790**
.0061.8139**(.091)
Q80 −.0721**(.026)
−.0039(.003)
4.0092**(.028)
.0207(.040)
.0768**
.0052.1186**(.077)
Q85 −.0886**(.027)
−.0018(.003)
4.3176**(.038)
.0103(.051)
.0756**
.0062.4577**(.085)
Q90 −.0508(.038)
.0007(.003)
4.7232**(.029)
−.0037(.059)
.0832**
.0072.7755**(.094)
Q95 .2184**(.040)
.0069*(.004)
5.2993**(.040)
−.0297(.089)
.0913**
.0083.3536**(.108)
Note. Quantile regressions are for an unbalanced panel of firms. The dependent variable is the logarithm of annual firm sales. Delicense is a dummy variable that takes a value of one if a firm is an industry that delicensed entry in 1991. Bootstrapped standard errors are in parentheses. N = 51,922.
+ Significant at the 10 percent level.* Significant at the 5 percent level.** Significant at the 1 percent level.
This content downloaded from 45.37.104.148 on Thu, 7 May 2015 16:03:44 PMAll use subject to JSTOR Terms and Conditions

Deregulation and Firm Size 921
tivity factor; kφ and lφ are, respectively, the capital rented and labor hired by the firm; and α is the capital share parameter. Conditional on remaining in operation, the incumbent firm maximizes its period profit, which is given by
π τϕ ϕ ϕ ϕ ϕ ϕ= − − −( ) ,1 p y rk wl (4)
where τi denotes a firm-specific distortion and r and w denote the rental rates of capital and labor, respectively. Firm-specific distortions in this framework are akin to firm-specific output taxes (or subsidies)26 that alter the profit maximiza-tion decision across firms. As a result, these idiosyncratic distortions introduce a dimension along which firms in an industry can be heterogeneous and can lead to a reallocation of resources across firms. In our setting, distortions introduced by the licensing requirements and output caps, for example, can affect firm-size distributions as a function of firm productivity.
We assume a large (unbounded) pool of prospective firms that could enter an industry. Entry is costly, however, and prospective entrants must make the entry decision (or expansion decisions) in light of a distribution of potential draws for firm productivity (Aφ) and the firm-specific tax (τφ). Although productivity and
26 In Restuccia and Rogerson (2008), the focus is on policies that create idiosyncratic distortions to plant-level decisions and hence cause a reallocation of resources across plants. While many differ-ent types of policies may generate such effects, the approach that they take is to analyze a generic set of distortions. Specifically, they assume that each plant faces its own output tax or subsidy.
Figure 5. Quantile regressions of the nonlinear impact of delicensing on incumbents and new entrants, 1989–2005.
This content downloaded from 45.37.104.148 on Thu, 7 May 2015 16:03:44 PMAll use subject to JSTOR Terms and Conditions

922 The Journal of LAW & ECONOMICS
the tax remain constant over time for any given firm, each firm also faces a con-stant probability of exit (death) in any given period.27
In steady-state equilibrium, the consumer problem determines the rental rate of capital, which is a function of the time discount factor and capital depreciation rate. Given the rental rate of capital, the zero-profit condition for firm entry de-termines the steady-state wage rate. Since labor supply is inelastic in equilibrium, total labor demand must equal 1.
Rearranging terms gives
Y AA M d
A M=
−
−
∞ − −−
∞ − −
∫∫
0
1 11
0
1 1
1
1
( )
( )
/( )
τ µ ϕ
τ µ
ϕσ
ϕσ
ϕ
σ σ
ϕσ
ϕσ
ϕddK L
ϕ
α α1− .
The equation can be rewritten as Y = ADK αL1−α, where
D A M d A M d/
= −
−− −
∞ −
−∞
∫ ∫( ) ( )( )
1 11 1
0
1
1
0
τ ϕ τ ϕϕ ϕ ϕ ϕ ϕ ϕσ σ
σ σ
σ σµ µ
is the misallocation factor. Note that in the equation, the A is the multiplicative factor and D measures the extent of aggregate misallocation due to distortions in firm-size distribution. Also note that D, the misallocation term, is independent of A, which enters as an exogenous scaling factor. The term D captures the poten-tial reduction in misallocation or the potential efficiency gains through resource allocation when firm-level distortions are removed. The aggregate productivity parameter (A) is exogenous. We also assume that firm productivity is not cor-related with firm-level distortion, which in turn translates at the aggregate level to aggregate productivity being independent of aggregate misallocation. So we can think of the aggregate productivity parameter in our calibration exercise as an independent scaling factor.
To summarize, we assume that if firm productivities (Aφ) are not correlated with firm distortions (τφ)—which implies that at the aggregate level A is not cor-related with the aggregate misallocation term D—adjusting the multiplicative factor A does not alter the efficiency gains from misallocation. This is the same as the results in Restuccia and Rogerson (2008) and Hseih and Klenow (2009).28
The calibration exercise involves matching India’s firm profitability and sales
27 This is similar to the approach of Restuccia and Rogerson (2008), who assume that in any given period after production takes place, each plant faces a constant probability of death. They argue that it would be easy to allow this value to depend on the plant-level productivity parameter.
28 In contrast, richer models of firm dynamics, such as that developed by Ericson and Pakes (1995), consider firms’ development to be associated with active learning. In such models, a firm’s productivity (Aφ) tends to be correlated to the distortion it faces (τφ). That is, distortions might lead a firm to invest more or less in research and development, which, in turn, determines its produc-tivity. As a consequence, the effects of misallocation may differ from those obtained through our exercise.
This content downloaded from 45.37.104.148 on Thu, 7 May 2015 16:03:44 PMAll use subject to JSTOR Terms and Conditions

Deregulation and Firm Size 923
distribution to the observed distribution in the United States, which we take as the benchmark economy. We find the distribution of firm-specific distortions needed to match the observed distribution of firm profitability and sales (histo-gram) in India, assuming that India faces the same productivity distribution as the United States. This enables us to estimate how much aggregate output is lost because of economic distortions that lead to a misallocation of resources across firms in an industry.
For the U.S. data, we use Dun and Bradstreet’s WorldBase database and capi-tal stock and other data from Penn World Table Version 6.1 (Heston, Summers, and Aten 2002). We borrow the technology parameters from the literature—we assume a capital share, α = 1
3 . We set the elasticity of substitution, σ = 6, con-sistent with a 20 percent markup in price over marginal cost (Rotemberg and Woodford 1992). The output and capital stock (Y and K ) are from Heston, Summers, and Aten (2002). Capital is calculated using the perpetual inventory method, with the depreciation rate equal to 6 percent and the initial capital stock determined by the initial investment rate and its geometric growth over the pe-riod. Using the revenue data and assuming that the U.S. economy represents the undistorted benchmark, we recover the impact of distortions on growth.
Figure 6 decomposes the contributions of various factors to growth in the mis-allocation model using the aggregated gross domestic product per worker, Y/L = AD(K/L)θH(1 – θ). We measure the contributions attributable to technology and productivity (A), capital per worker (K/L), and the misallocation factor (D). As Figure 6 shows, over the period studied (1989–2005), improved efficiency via re-allocation averaged a positive contribution on growth. In other words, the cali-bration exercise suggests that distortions decreased over the period 1989–2005, although the figure shows substantial variance across the years.
During the sample period, the average growth in gross domestic product per worker was 4.4 percent per year. In the standard model (with no misallocation), productivity differences were responsible for 3.1 percent of this growth (capi-tal accumulation accounts for the remaining 1.3 percent). In the misallocation model, the pure-productivity effect accounts for 2.0 percent of the growth and misallocation for 1.1 percent growth per year. That is, incorporating a role for re-allocation, the misallocation model reduces the importance of pure productivity when accounting for the observed growth over the sample period.
Figure 7 compares the gains due to reallocation of resources in the restricted and deregulated industries. Consistent with our priors that deregulation leads to a removal of distortions, the observed gains from reallocation are higher in the deregulated industries. Between 1991 and 2005, the average change in allo-cation efficiency gains was 1.4 percent in deregulated sectors and 1.3 percent in restricted sectors. Figure 7 depicts considerable variability throughout the sample period. In the first period immediately following establishment of delicensing re-strictions, the gains due to reallocation in the deregulated industries were close to 3 percent per year for 1991–95, .5 percent for 1996–2000, and 1.75 percent for 2001–5.
This content downloaded from 45.37.104.148 on Thu, 7 May 2015 16:03:44 PMAll use subject to JSTOR Terms and Conditions
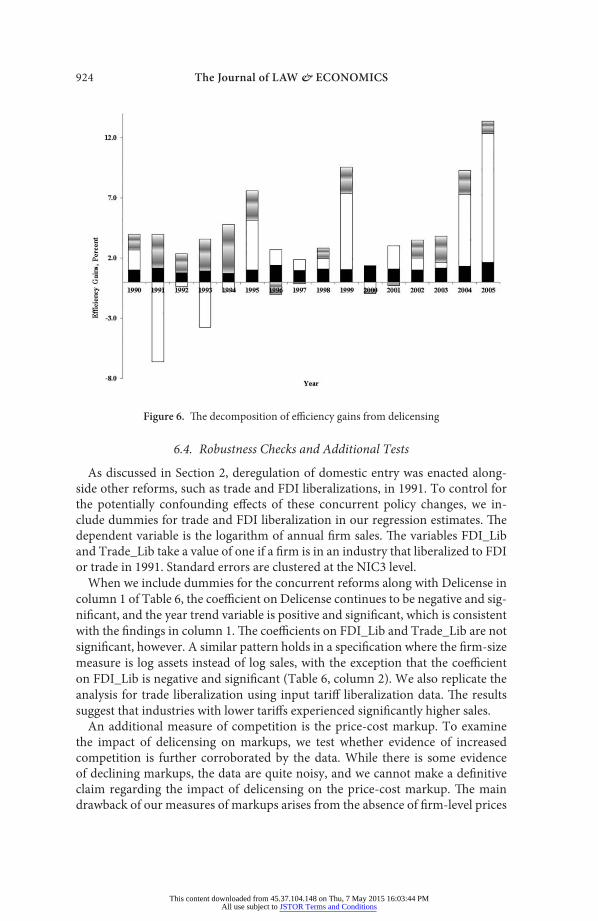
924 The Journal of LAW & ECONOMICS
6.4. Robustness Checks and Additional Tests
As discussed in Section 2, deregulation of domestic entry was enacted along-side other reforms, such as trade and FDI liberalizations, in 1991. To control for the potentially confounding effects of these concurrent policy changes, we in-clude dummies for trade and FDI liberalization in our regression estimates. The dependent variable is the logarithm of annual firm sales. The variables FDI_Lib and Trade_Lib take a value of one if a firm is in an industry that liberalized to FDI or trade in 1991. Standard errors are clustered at the NIC3 level.
When we include dummies for the concurrent reforms along with Delicense in column 1 of Table 6, the coefficient on Delicense continues to be negative and sig-nificant, and the year trend variable is positive and significant, which is consistent with the findings in column 1. The coefficients on FDI_Lib and Trade_Lib are not significant, however. A similar pattern holds in a specification where the firm-size measure is log assets instead of log sales, with the exception that the coefficient on FDI_Lib is negative and significant (Table 6, column 2). We also replicate the analysis for trade liberalization using input tariff liberalization data. The results suggest that industries with lower tariffs experienced significantly higher sales.
An additional measure of competition is the price-cost markup. To examine the impact of delicensing on markups, we test whether evidence of increased competition is further corroborated by the data. While there is some evidence of declining markups, the data are quite noisy, and we cannot make a definitive claim regarding the impact of delicensing on the price-cost markup. The main drawback of our measures of markups arises from the absence of firm-level prices
Figure 6. The decomposition of efficiency gains from delicensing
This content downloaded from 45.37.104.148 on Thu, 7 May 2015 16:03:44 PMAll use subject to JSTOR Terms and Conditions

Deregulation and Firm Size 925
in the Prowess data, and therefore the markup has to be imputed from measures of sales and profits rather than from unit-level prices and costs.
First, relying on data from Topalova and Khandelwal (2011), we examine the impact of delicensing using two measures of markups: the total cost of produc-tion and the different components of cost, such as wages, depreciation, and so on. While the impact of delicensing on markups is not significant using the first measure (not shown), it is negative and significant using the second measure (Table 6, columns 5–7). We also estimate specifications using the ratio of earn-ings before interest, taxes, depreciation, and amortization to sales and two addi-tional measures of profitability (total sales minus the value of production and to-tal sales minus the total cost of production). However, these additional measures do not reveal a statistically significant impact of delicensing on markups.
While there is a general consensus that the systemic reforms instituted in the 1990s and 2000s were essential to bringing about changes in Indian manufactur-ing, Panagariya (2008) argues that piecemeal external liberalization, along with small spurts of domestic deregulation on a variety of margins and expansionary policies, combined to produce a small shift in the growth rate in Indian industry in the 1980s. This is similar to the view that pro-business reforms instituted in the mid-1980s had an impact on the competitive environment in Indian industry. To account for the possibility that market entrants between 1985 and 1990 may have been new firms rather than incumbents, we reestimated all our regression specifications, defining incumbents as firms that incorporated through 1985 and
Figure 7. Efficiency gains in delicensed versus restricted sectors
This content downloaded from 45.37.104.148 on Thu, 7 May 2015 16:03:44 PMAll use subject to JSTOR Terms and Conditions

Tabl
e 6
Rob
ustn
ess C
heck
s and
Add
itio
nal T
ests
Sal
esA
sset
sPr
ofita
bilit
yM
arku
p
(1)
(2)
(3)
(4)
(5)
(6)
(7)
Del
icen
se−.
1321
**−5
.789
6+−.
0962
**1.
3103
−.03
27*
−.02
84*
−.02
73*
(.045
)(2
.966
)(.0
29)
(1.6
05)
(.015
)(.0
12)
(.013
)Ye
ar tr
end
.076
3**
.112
3**
.002
7(.0
08)
(.008
)(.0
02)
FDI_
Lib
−.04
452.
2195
−.10
07**
1.19
42(.0
37)
(1.7
57)
(.030
)(1
.340
)Tr
ade_
Lib
−.05
18−.
05.9
827
(.038
)(.0
34)
(1.8
58)
Tariff
−31.
4757
**(7
.200
)C
onst
ant
2.41
20**
108.
4433
**2.
3043
**7.
4084
**.0
928*
*.0
782*
*.0
994*
*(.0
28)
(6.7
53)
(.023
)(.3
85)
(.007
)(.0
10)
(.008
)
Year
dum
mie
sN
oN
oN
oN
oN
oN
oYe
sN
16,6
488,
690
17,1
1517
,118
8,89
48,
894
8,89
4R2
.925
.982
.948
.946
.702
.702
.703
Not
e. R
egre
ssio
n es
timat
es a
re fo
r a b
alan
ced
pane
l of fi
rms f
rom
198
9 to
199
5. M
arku
p is
sale
s min
us th
e va
lue
of o
utpu
t cos
t ove
r the
val
ue o
f out
put c
ost.
Del
icen
se,
FDI_
Lib,
and
Trad
e_Li
b ar
e dum
my
varia
bles
that
hav
e a v
alue
of o
ne if
a fir
m is
in an
indu
stry
that
der
egul
ated
, lib
eral
ized
to fo
reig
n di
rect
inve
stm
ent,
or li
bera
lized
to
trad
e, re
spec
tivel
y, in
199
1. T
ariff
is th
e va
riatio
n in
tariff
leve
ls in
199
1. C
lust
ered
stan
dard
err
ors a
re in
par
enth
eses
. All
regr
essio
ns in
clud
e fix
ed e
ffect
s.+ S
igni
fican
t at t
he 1
0 pe
rcen
t lev
el.
* Sig
nific
ant a
t the
5 p
erce
nt le
vel.
** S
igni
fican
t at t
he 1
per
cent
leve
l.
This content downloaded from 45.37.104.148 on Thu, 7 May 2015 16:03:44 PMAll use subject to JSTOR Terms and Conditions
Deregulation and Firm Size 927
classifying all firms that incorporated after 1985 as new entrants. Our findings are robust to the change in the year demarcating incumbent status. This is largely due to the fact that while some new firms were incorporated between 1985 and 1990, these numbers are dwarfed by the pace in the birth of new firms following the 1991 reforms.
Another feature of the data related to classification as an incumbent is that, following deregulation, some incumbents—particularly business groups—ex-panded into newly deregulated industries. It can be argued that these firms are not new entrants in the traditional sense because they were in operation prior to deregulation, albeit in different industries. To address this issue, we restrict new entrants to the subset of firms that are new in the true sense of the word and are not affiliated with firms that existed prior to deregulation. Once again, since the number of occurrences is relatively small, our pattern of findings remains robust.
We also conduct estimations by dropping public-sector and foreign firms from the sample and therefore restricting the sample to private firms. The results are robust to the exclusion. Table A3 shows these results.
As to the evolution of total factor productivity (TFP), quantile regressions show that TFP distribution shifts right across quantiles given the positive and significant coefficient on the year trend variable (Table 7). With regard to the impact of delicensing, the quantile estimates suggest that dispersion in TFP dis-tribution increases in industries that deregulate entry. The coefficient estimates for the 5th–60th quantiles are negative and significant, which suggests that pro-ductivity falls further in the least productive firms in the face of entry deregula-tion. The coefficient estimates for the 70th–95th quantiles, on the other hand, are positive and significant. This suggests that productivity rises for the firms with the highest TFP following deregulation. The distributional results therefore con-firm that while average TFP rises in the years following the reforms, dispersion in TFP distribution also increases following the deregulation of firm entry in the delicensed industries.
7. Conclusion
Deregulation of entry can reduce and redistribute rents, leading to new distri-butions of firms within industries over time and improving resource allocation. Industries can go through a shakeout phase during which the number of produc-ers decline in the industry, as incumbents and new entrants replace the firms that exit (see Caballero and Hammour 1996).
The deregulation policies in India in 1991 were extensive, and the end of the license raj and implementation of pro-market reforms have far-reaching implica-tions for the competitive environment in the Indian economy. Significant sectors of the economy, previously reserved for the state-owned sector, were opened up for private participation.
We use firm-level data from the CMIE’s Prowess database to examine the effect on efficiency of dismantling the compulsory industrial licensing regime that reg-ulated firm entry and imposed capacity constraints on firm output before 1991.
This content downloaded from 45.37.104.148 on Thu, 7 May 2015 16:03:44 PMAll use subject to JSTOR Terms and Conditions

928 The Journal of LAW & ECONOMICS
The evidence suggests several interesting patterns. Average firm size declined sig-nificantly in the deregulated industries. Small firms enter the sample from the left-hand tail of the size distribution, while incumbent firms get significantly big-ger following deregulation.
Table 7Quantile Regressions of Total Factor Productivity, 1989–96
(1) (2)
Quantile Delicense Constant Delicense Year Trend ConstantQ5 −.1970**
(.015)1.0642**(.025)
−.1957**(.018)
.0005(.002)
1.0587**(.034)
Q10 −.1687**(.010)
1.0380**(.018)
−.1678**(.010)
.0063**(.002)
1.0055**(.023)
Q15 −.1284**(.012)
.9945**(.018)
−.1300**(.012)
.0084**(.002)
.9531**(.021)
Q20 −.0970**(.009)
.9829**(.016)
−.0993**(.010)
.0086**(.002)
.9456**(.018)
Q25 −.0794**(.008)
.9888**(.016)
−.0786**(.011)
.0109**(.001)
.9381**(.018)
Q30 −.0686**(.009)
1.0061**(.018)
−.0672**(.010)
.0105**(.001)
.9582**(.019)
Q35 −.0591**(.009)
1.0458**(.020)
−.0554**(.010)
.0110**(.001)
.9903**(.019)
Q40 −.0551**(.011)
1.1091**(.022)
−.0519**(.010)
.0115**(.002)
1.0523**(.017)
Q45 −.0426**(.011)
1.1829**(.028)
−.0417**(.011)
.0130**(.001)
1.1202**(.023)
Q50 −.0377**(.012)
1.2744**(.030)
−.0333**(.009)
.0140**(.001)
1.2032**(.027)
Q55 −.0256*(.012)
1.3658**(.027)
−.0224*(.010)
.0141**(.001)
1.2961**(.026)
Q60 −.0110(.013)
1.4535**(.026)
−.0104(.012)
.0152**(.002)
1.3852**(.028)
Q65 −.0004(.012)
1.5367**(.023)
.0029(.011)
.0155**(.002)
1.4626**(.025)
Q70 .0166(.014)
1.6195**(.021)
.0230+
(.013).0151**
(.002)1.5468**(.021)
Q75 .0268*(.014)
1.7064**(.018)
.0307*(.013)
.0155**(.002)
1.6240**(.017)
Q80 .0373**(.012)
1.7952**(.015)
.0400**(.014)
.0146**(.004)
1.7120**(.025)
Q85 .0434**(.016)
1.8790**(.017)
.0421**(.014)
.0125**(.003)
1.8166**(.021)
Q90 .0723**(.018)
1.9977**(.016)
.0725**(.016)
.0115**(.004)
1.9423**(.025)
Q95 .1061**(.027)
2.1752**(.017)
.1052**(.019)
.0099*(.004)
2.1281**(.029)
Note. Quantile regressions for total factor productivity are for an unbalanced panel of firms. The dependent variable is Delicense (All Firms). Delicense is a dummy variable that has a value of one if a firm is an industry that delicensed entry in 1991. Bootstrapped standard errors are in parentheses.
+ Significant at the 10 percent level.* Significant at the 5 percent level.** Significant at the 1 percent level.
This content downloaded from 45.37.104.148 on Thu, 7 May 2015 16:03:44 PMAll use subject to JSTOR Terms and Conditions

Deregulation and Firm Size 929
Quantile regressions to examine the distributional impact of deregulation show that the shift in the firm-size distribution is nonlinear: average firm size increases up to around the 15th percentile and then gets significantly smaller until the 90th percentile, while the largest percentile (95th percentile) gets significantly bigger over the same period. We also find that the contribution of resource reallocation to growth in India increased in the years following deregulation, which suggests that distortions have decreased over time, with higher gains noted for deregu-lated industries.
The distributional changes in firm size and profitability reveal a more heteroge-neous impact of deregulation. Although the data do not bear out policy concerns that small firms would be forced out, and although we document improvements in the allocation of resources over time (particularly in deregulated industries), the dominance of large incumbents in India’s manufacturing sector remains un-challenged. The shrinking middle in the firm-size distribution suggests that small and medium-sized firms may continue to face distortions that constrain their ability to grow.
Appendix
Regulations and Data Definitions
A1. Statement on Industrial Policy
In 1991, India’s Ministry of Industry released Statement on Industrial Policy (Government of India 1991). The statement specified industries to be reserved for the public sector and industries for which industrial licensing would be compul-sory (pp. 12–13).
A1.1. Annex I: Proposed List of Industries to Be Reserved for the Public Sector
1. Arms and ammunition and allied items of defence equipment, Defence air-craft and warships.
2. Atomic Energy.3. Coal and lignite.4. Mineral oils.5. Mining if iron ore, manganese ore, chrome ore, gypsum, sulphur, gold and
diamond.6. Mining of copper, lead, zinc, tin, molybdenum and wolfram.7. Minerals specified in the Schedule to the Atomic Energy (Control of Produc-
tion and Use) Order, 1953.8. Railway transport.
A1.2. Annex II. List of Industries in Respect of Which Industrial Licensing Will Be Compulsory
1. Coal and Lignite.2. Petroleum (other than crude) and its distillation products.
This content downloaded from 45.37.104.148 on Thu, 7 May 2015 16:03:44 PMAll use subject to JSTOR Terms and Conditions

930 The Journal of LAW & ECONOMICS
3. Distillation and brewing of alcoholic drinks.4. Sugar.5. Animal fats and oils.6. Cigars and cigarettes of tobacco and manufactured tobacco substitutes.7. Asbestos and asbestos-based products.8. Plywood, decorative veneers, and other wood based products such as particle
board, medium density fibre board, block board.9. Raw hides and skins, leather, chamois leather and patent leather.10. Tanned or dressed furskins.11. Motor cars.12. Paper and Newsprint except bagasse-based units.13. Electronic aerospace and defence equipment; All types.14. Industrial explosives, including detonating fuse, safety fuse, gun powder, ni-
trocellulose and matches.15. Hazardous chemicals.16. Drugs and Pharmaceuticals (according to Drug Policy).17. Entertainment electronics (VCRs, colour TVs, C.D. players, Tape Record-
ers).18. White Goods (Domestic Refrigerators, Domestic Dishwashing machines,
Programmable Domestic Washing Machines, Microwave ovens, Aircondi-tioners).
A2. Data Appendix
Table A1Industries by Three-Digit National Industrial Classification
Class Economic Activity Firms151 Production, processing, and preservation of meat, fish, fruit vegetables, oils, and
fats452
152 Manufacture of dairy products 67153 Manufacture of grain mill products, starches and starch products, and prepared
animal feeds126
154 Manufacture of other food products 459155 Manufacture of beverages 176160 Manufacture of tobacco products 23171 Spinning, weaving, and finishing of textiles 881172 Manufacture of other textiles 103173 Manufacture of knitted and crocheted fabrics and articles 49181 Manufacture of wearing apparel, except fur apparel 197191 Tanning and dressing of leather; manufacture of luggage handbags, saddler, and
harness61
192 Manufacture of footwear 68201 Saw milling and planing of wood 2202 Manufacture of products of wood, cork, straw, and plaiting materials 50210 Manufacture of paper and paper products 266221 Publishing 71222 Printing and service activities related to printing 51223 Reproduction of recorded media 3
This content downloaded from 45.37.104.148 on Thu, 7 May 2015 16:03:44 PMAll use subject to JSTOR Terms and Conditions
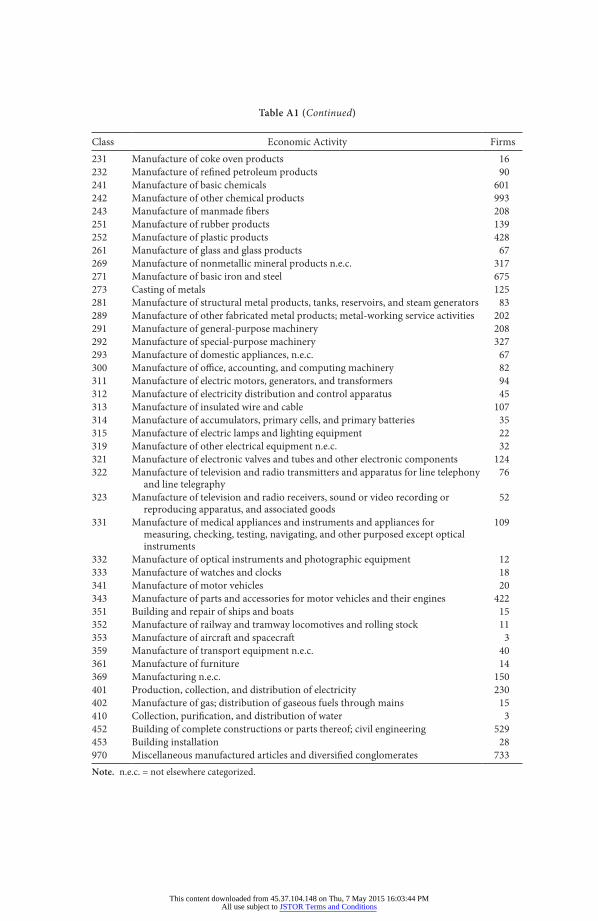
Table A1 (Continued)
Class Economic Activity Firms231 Manufacture of coke oven products 16232 Manufacture of refined petroleum products 90241 Manufacture of basic chemicals 601242 Manufacture of other chemical products 993243 Manufacture of manmade fibers 208251 Manufacture of rubber products 139252 Manufacture of plastic products 428261 Manufacture of glass and glass products 67269 Manufacture of nonmetallic mineral products n.e.c. 317271 Manufacture of basic iron and steel 675273 Casting of metals 125281 Manufacture of structural metal products, tanks, reservoirs, and steam generators 83289 Manufacture of other fabricated metal products; metal-working service activities 202291 Manufacture of general-purpose machinery 208292 Manufacture of special-purpose machinery 327293 Manufacture of domestic appliances, n.e.c. 67300 Manufacture of office, accounting, and computing machinery 82311 Manufacture of electric motors, generators, and transformers 94312 Manufacture of electricity distribution and control apparatus 45313 Manufacture of insulated wire and cable 107314 Manufacture of accumulators, primary cells, and primary batteries 35315 Manufacture of electric lamps and lighting equipment 22319 Manufacture of other electrical equipment n.e.c. 32321 Manufacture of electronic valves and tubes and other electronic components 124322 Manufacture of television and radio transmitters and apparatus for line telephony
and line telegraphy76
323 Manufacture of television and radio receivers, sound or video recording or reproducing apparatus, and associated goods
52
331 Manufacture of medical appliances and instruments and appliances for measuring, checking, testing, navigating, and other purposed except optical instruments
109
332 Manufacture of optical instruments and photographic equipment 12333 Manufacture of watches and clocks 18341 Manufacture of motor vehicles 20343 Manufacture of parts and accessories for motor vehicles and their engines 422351 Building and repair of ships and boats 15352 Manufacture of railway and tramway locomotives and rolling stock 11353 Manufacture of aircraft and spacecraft 3359 Manufacture of transport equipment n.e.c. 40361 Manufacture of furniture 14369 Manufacturing n.e.c. 150401 Production, collection, and distribution of electricity 230402 Manufacture of gas; distribution of gaseous fuels through mains 15410 Collection, purification, and distribution of water 3452 Building of complete constructions or parts thereof; civil engineering 529453 Building installation 28970 Miscellaneous manufactured articles and diversified conglomerates 733Note. n.e.c. = not elsewhere categorized.
This content downloaded from 45.37.104.148 on Thu, 7 May 2015 16:03:44 PMAll use subject to JSTOR Terms and Conditions

932
Table A2Description of Variables
Variable DefinitionSales Sales generated by a firm from its main business activity, measured
by charges to customers for goods supplied and services rendered; excludes income from activities not related to the main business, such as dividends, interest, and rents, in the case of industrial firms, and nonrecurring income
Assets Gross fixed assets of a firm, including movable and immovable assets and assets that are in the process of being installed
Firm Size (Assets and Sales)
Average firm assets and sales in an industry; for the full sample, the industry-level averages are averaged across industries
Market Share Ratio of sales to industry sales for a firm and ratio of assets to industry assets for a firm
Herfindahl Index Sum of the squares of the market share of all firms in an industry in each NIC3 industrial category
Incumbent Firm incorporated before 1990New Entrant Firm incorporated after 1991Incumbent Share The ratio of total sales, assets, and profits produced by incumbent firms
(incorporated before 1990) in an industry to industry sales, industry assets, and industry profits in that industry
New Entrant Share The ratio of total sales, assets, and profits produced by new entrant firms (incorporated after 1991) in an industry to the industry sales, industry assets, and industry profits in that industry
Industry Sales Sum of sales across all firms in an industryIndustry Assets Sum of assets across all firms in an industryPBITDA Excess of income over all expenditures except tax, depreciation, interest
payments, and rents in a firmReturn on Assets Ratio of PBITDA to assets in a firm, averaged across firms in that industrySales Growth (Industry sales − lagged industry sales)/lagged industry sales in that
industryCoefficient of Variation Ratio of standard deviation to mean of assets, sales, and return on assets at
the industry levelNIC3 Code Three-digit industry code, includes manufacturing, financial, and service
sectors
This content downloaded from 45.37.104.148 on Thu, 7 May 2015 16:03:44 PMAll use subject to JSTOR Terms and Conditions

933
Tabl
e A
3D
ereg
ulat
ion
and
Firm
Siz
e of
Pri
vate
Indi
an F
irm
s
Sale
sA
sset
sPr
ofita
bilit
ySa
les
Ass
ets
Profi
tabi
lity
(1)
(2)
(3)
(4)
(5)
(6)
(7)
(8)
Del
icen
se−.
1799
**−.
1089
**−.
1495
**−.
0648
+2.
7304
*−.
1403
**−.
1051
**1.
4873
(.047
)(.0
47)
(.035
)(.0
36)
(1.0
72)
(.051
)(.0
30)
(1.2
80)
Year
tren
d.0
703*
*.1
048*
*.0
834*
*.1
217*
*(.0
08)
(.007
)(.0
09)
(.008
)FD
I_Li
b−.
0732
+−.
1139
**1.
2627
(.039
)(.0
32)
(.979
)Tr
ade_
Lib
−.05
72−.
0505
.725
3(.0
42)
(.033
)(1
.372
)C
onst
ant
2.24
09**
2.78
95**
2.10
12**
2.88
92**
5.02
26**
2.25
17**
2.11
61**
4.07
03**
(.030
)(.0
29)
(.031
)(.0
24)
(.254
)(.0
31)
(.025
)(.3
30)
Year
dum
mie
sN
oYe
sN
oYe
sN
oN
oN
oN
oN
14,3
1114
,311
14,7
4114
,741
14,7
4414
,311
14,7
4114
,744
R2.9
15.9
16.9
37.9
39.8
77.9
15.9
38.8
77N
ote.
Reg
ress
ion
estim
ates
are
for a
bal
ance
d pa
nel o
f firm
s fro
m 1
989
to 1
995.
Del
icen
se, F
DI_
Lib,
and
Tra
de_L
ib a
re d
umm
y va
riabl
es th
at ta
ke a
val
ue o
f one
if a
firm
is in
an
indu
stry
that
der
egul
ated
, lib
eral
ized
to fo
reig
n di
rect
inve
stm
ent,
or li
bera
lized
to tr
ade
in 1
991,
resp
ectiv
ely.
Clu
ster
ed st
anda
rd e
rror
s are
in p
aren
thes
es. A
ll re
gres
sions
in
clud
e fix
ed e
ffect
s.+ S
igni
fican
t at t
he 1
0 pe
rcen
t lev
el.
* Sig
nific
ant a
t the
5 p
erce
nt le
vel.
** S
igni
fican
t at t
he 1
per
cent
leve
l.
This content downloaded from 45.37.104.148 on Thu, 7 May 2015 16:03:44 PMAll use subject to JSTOR Terms and Conditions

934 The Journal of LAW & ECONOMICS
References
Aghion, Phillipe, Robin Burgess, Stephen Redding and Fabrizio Zilibotti. 2008. The Un-equal Effects of Liberalization: Evidence from Dismantling the License Raj in India. American Economic Review 98:1397–1412.
Alesina, Alberto, Silvia Ardagna, Giuseppe Nicoletti, and Fabio Schiantarelli. 2005. Regu-lation and Investment. Journal of the European Economic Association 3:791–825.
Alfaro, Laura, and Anusha Chari. 2010. India Transformed? Insights from the Firm Level 1988–2005. Pp. 155–228 in India Policy Forum, edited by Arvind Panagariya, Barry Bos worth, and Suman K. Bery. New Delhi: Sage.
Alfaro, Laura, Alfaro Charlton, and Fabio Kanczuk. 2009. Plant-Size Distribution and Cross-Country Income Differences. Pp. 243–72 in NBER International Seminar on Macroeconomics 2008, edited by Jeffrey A. Frankel and Christopher Pissarides. Chicago: University of Chicago Press.
Ardagna, Silvia, and Annamaria Lusardi. 2009. Where Does Regulation Hurt? Evidence from New Businesses across Countries. NBER Working Paper No. 14747. National Bu-reau of Economic Research, Cambridge, Mass.
———. 2010. Explaining International Differences in Entrepreneurship: The Role of In-dividual Characteristics and Regulatory Constraints. Pp. 17–62 in International Dif-ferences in Entrepreneurship, edited by Joshua Lerner and Antoinette Schoar. Chicago: University of Chicago Press.
Asplund, Marcus, and Volcker Nocke. 2006. Firm Turnover in Imperfectly Competitive Markets. Review of Economic Studies 73:295–327.
Bertrand, Marianne, Paras Mehta, and Sendhil Mullainathan. 2002. Ferreting out Tun-neling: An Application to Indian Business Groups. Quarterly Journal of Economics 117:121–48.
Blanchard, Olivier J., and Francesco Giavazzi. 2003. Macroeconomic Effects of Regula-tion and Deregulation in Goods and Labor Markets. Quarterly Journal of Economics 118:879–908.
Bollard, Albert, Peter Klenow, and Gunjan Sharma. 2013. India’s Mysterious Manufactur-ing Miracle. Review of Economics Dynamics 16:59–85.
Caballero, Ricardo, and Mohamad Hammour. 1996. On the Timing and Efficiency of Cre-ative Destruction. Quarterly Journal of Economics 446:805–52.
Campbell, Jeffrey R., and Hugo A. Hopenhayn. 2005. Market Size Matters. Journal of In-dustrial Economics 53:1–25.
Chamarbagwalla, Rubiana, and Gunjan Sharma. 2008. Industrial Deregulation, Trade Lib-eralization, and Skill Upgrading in India. Working Paper No. 2008-002. Centre for Ab-original Economic Policy Research, Canberra.
Chari, A. V. 2011. Identifying the Aggregate Productivity Effects of Entry and Size Restric-tions: An Empirical Analysis of License Reform in India. American Economic Journal: Economic Policy 3:66–96.
Chari, Anusha, and Nandini Gupta. 2008. Incumbents and Protectionism: The Political Economy of Foreign Entry Liberalization. Journal of Financial Economics 88:633–56.
Crabtree, James. 2012. India’s Growth Is at Risk While “Resource Raj” Continues. Finan-cial Times, May 16.
Ericson, Richard, and Ariel Pakes. 1995. Markov Perfect Industry Dynamics: A Frame-work for Empirical Work. Review of Economic Studies 62:53–82.
Fisman, Raymon, and Tarun Khanna. 2004. Facilitating Development: The Role of Busi-ness Groups. World Development 32:609–28.
This content downloaded from 45.37.104.148 on Thu, 7 May 2015 16:03:44 PMAll use subject to JSTOR Terms and Conditions

Deregulation and Firm Size 935
Garciano, Luis, Clare LeLarge, and John Van Reenen. 2012. Firm Size Distortions and the Productivity Distribution: Evidence from France. Discussion Paper No. 1128. Centre for Economic Performance, London.
Goldberg, Pinelopi, Amit Khandelwal, Nina Pavcnik, and Petia Topalova. 2010. Imported Intermediate Inputs and Domestic Product Growth: Evidence from India. Quarterly Journal of Economics 125:1727–67.
Gormley, Todd, Nandini Gupta, and Anand Jha. 2014. Corporate Bankruptcy and Bank Competition. Working paper. Indiana University, Kelley School of Business, Bloom-ington.
Government of India. Ministry of Industry. 1991. Statement on Industrial Policy. New Delhi, July 24. http://dipp.nic.in/English/Policies/Industrial_policy_statement.pdf.
———. Ministry of Labour and Employment. 2000. Informal Sector in India: Approaches for Social Security. New Delhi: Government of India.
Heston, Alan, Robert Summers, and Bettina Aten. 2002. Penn World Table Version 6.1. Philadelphia: University of Pennsylvania, Center for International Comparisons.
Hopenhayn, Hugo A. 1992. Entry, Exit, and Firm Dynamics in Long Run Equilibrium. Econometrica 60:1127–50.
Hsieh, Chang-Tai, and Peter Klenow. 2009. Misallocation and Manufacturing TFP in China and India. Quarterly Journal of Economics 124:1403–48.
Jovanovic, Boyan. 1982. Selection and the Evolution of Industry. Econometrica 50:649–70.Kang, Nimrit, and Nitin Nayar. 2004. The Evolution of Corporate Bankruptcy Law in In-
dia. ICRA Bulletin: Money and Finance, October 03–March 04, pp. 37–58.Khanna, Tarun, and Krishna Palepu. 1999. Policy Shocks, Market Intermediaries and Cor-
porate Strategy: The Evolution of Business Groups in Chile and India. Journal of Eco-nomics and Management Strategy 8:271–310.
———. 2005. The Evolution of Concentrated Ownership in India: Broad Patterns and a History of the Indian Software Industry. Pp. 283–323 in A History of Corporate Gover-nance around the World: Family Business Groups to Professional Managers, edited by Randall Morck. Chicago: University of Chicago Press.
Kochhar, Kalpana, Utsav Kumar, Raghuram Rajan, Arvind Subramanian, and Ioannis To-katlidis. 2006. India’s Pattern of Development: What Happened, What Follows. Journal of Monetary Economics 53:981–1019.
Koenker, Roger, and Gilbert Bassett. 1978. Regression Quantiles. Econometrica 46:33–50.Luttmer, Erzo. 2007. Selection, Growth, and the Size Distribution of Firms. Quarterly
Journal of Economics 122:1103–44.Melitz, Marc. 2003. The Impact of Trade on Intra-industry Reallocations and Aggregate
Industry Productivity. Econometrica 71:1695–1725.Panagariya, Arvind. 2008. India, the Emerging Giant. New York: Oxford University Press.Rajan, Raghuram, and Luigi Zingales. 2003a. Saving Capitalism from Capitalists. New
York: Random House:.———. 2003b. The Great Reversals: The Politics of Financial Development in the Twenti-
eth Century. Journal of Financial Economics 69:5–50.Restuccia, Diego, and Roger Rogerson. 2008. Policy Distortions and Aggregate Productiv-
ity with Heterogeneous Plants. Review of Economic Dynamics 11:707–20.Rotemberg, Julio, and Michael Woodford. 1992. Oligopolistic Pricing and the Effects of
Aggregate Demand on Economic Activity. Journal of Political Economy 100:1153–1207.Sharma, Gunjan. 2008. Competing or Collaborating Siblings? Industrial and Trade Poli-
cies in India. University of Missouri–Columbia Working Paper No. 06-10. University of Missouri, Department of Economics, Columbia.
This content downloaded from 45.37.104.148 on Thu, 7 May 2015 16:03:44 PMAll use subject to JSTOR Terms and Conditions

936 The Journal of LAW & ECONOMICS
Sivadasan, Jagadeesh 2009. Barriers to Competition and Productivity: Evidence from In-dia. B.E. Journal of Economic Analysis and Policy 9, art. 42, pp. 1–66.
Syverson, Chad. 2004. Market Structure and Productivity: A Concrete Example. Journal of Political Economy 112:1181–1222.
Topalova, Petia. 2007. Trade Liberalization and Firm Productivity: The Case of India. IMF Working Paper 04/28. International Monetary Fund, Washington, D.C.
Topalova, Petia, and Amit Khandelwal. 2011. Trade Liberalization and Firm Productivity: The Case of India. Review of Economics and Statistics 93:995–1009.
World Bank. 2005. Improving the Investment Climate in India. Washington, D.C.: World Bank.
This content downloaded from 45.37.104.148 on Thu, 7 May 2015 16:03:44 PMAll use subject to JSTOR Terms and Conditions