Embed Size (px)
Citation preview
A Review of Bank Funding Cost Differentials*
Randall S. Kroszner
Booth School of Business
University of Chicago
November 16, 2013
[*] Financial support for this study was provided by The Clearing House. The views expressed here are solely those of the author and do not necessarily reflect those of The Clearing House, its staff, or its members. Oliver Wyman provided support for data collection and analysis. Comments welcome: [email protected]

I. Introduction
The debate over the existence and extent of funding cost differentials between
large and small banks is central to ongoing important discussions of financial regulatory
reform related to perceptions of “too big to fail” government support. A substantial
research literature exists that tries to address this issue empirically, and the results vary
depending upon the time period, the sample, and the method. This paper attempts to
provide an overview and analysis of different approaches that have been taken and to
provide some suggestions for the most promising research designs going forward in
order to clarify and advance our understanding of funding cost differentials.
Rather than attempt the impossible task of summarizing and assessing the dozens of
papers in the literature individually, in the next section I provide a simple taxonomy of
five basic approaches into which the existing literature can be categorized. While this
does not do justice to the nuances of each paper, it will provide a tractable way to
provide an overview of what has been done. In the following section, I then provide an
analysis of general challenges that all of the approaches face, namely, the
interpretation of funding costs differences between large and small banks, the choice
of the relevant time period, the choice of the sample, and the significant differences in
the funding structures of large and small banks. After that, in section IV, I focus on more
specific challenges that three of the main approaches face and provide suggestions
for the most promising methods for measuring funding cost differentials. I then provide
a summary and conclusion in section V.
1

II. Overview and Taxonomy of Existing Approaches to Estimating Funding Cost
Differentials
The many studies that have been undertaken on funding cost differentials for large
versus small banks can be placed into five categories, focused on the data and
methods they use. Of course, some studies are more comprehensive than others and
may fall into more than one category. The main categories of existing studies are those
focusing on: 1) Bond pricing and credit default swap (CDS) spreads; 2) Credit ratings;
3) Deposits; 4) Equity prices; and 5) Other. Figure 1 provides a brief summary.
[Insert Figure 1 here]
III. General Challenges for Empirical Studies of Funding Cost Differentials
In this section, I consider some general issues that all empirical studies trying to
measure perceptions of government support must grapple with. This could be
considered a “check list” in evaluating existing studies and in formulating the most
effective methods going forward.
(1) Are differences between large and small banks due to perceptions of
government support or due, at least in part, to size-related factors independent
of perceptions of government support?
Generally, the funding cost studies attribute the differences between large and
small banks to perceptions of government support for the large banks. The key issue in
the empirical design is what economists call the “identification strategy,” that is,
formulating an approach that makes a convincing case that the measured difference
between large and small banks is primarily due to perceptions of government support
2

and not due to other factors that might be associated with size but are unrelated to
perceptions of government support.
It is, for example, important to check to see whether some of the measured
differences for large banks may also arise in other industries without perceptions of
government support for large firms. It is possible that there may be funding advantages
that are simply associated with size, due to greater diversification, greater liquidity of
debt issues, greater access to capital markets in times of stress, and more frequent
issuance.1 If this general size advantage is empirically relevant, the data would show
funding cost advantages for the largest firms in many industries, not simply in banking. If
so, it will be important to adjust for the general size advantage across many industries
when estimating the funding cost differentials in banking in order to isolate and
estimate the impact of perceptions of government support.
As a rough first pass to determine whether this issue merits further empirical
investigation, we can compare the yields paid by large firms versus small firms in a
variety of industries including banking. More specifically, we can compare the
weighted average cost (WAC) of debt for the top ten firms by assets and the rest of the
firms in a number of industries using industry categories and WAC data from Bloomberg.
The difference between large and small firms ranges from 84 basis points for energy
firms to 5 basis points for utilities. Banks are in the middle at 35 basis points. The average
differential across these industries is 36 basis points.2 These comparisons suggest that
1 More historical data and greater market familiarity can lower the cost of, and the uncertainty involved in, modeling and monitoring the risks of the issuer. In other words, the willingness of analysts to invest in understanding a firm may be related to the frequency and size of its issues. 2 The data are for the 3000 largest firms by market capitalization with the debt/equity ratios above the 10th percentile (to eliminate outliers). The WAC is calculated from the first quarter of 2007 to the second quarter of 2013. The top ten institutions are identified based on assets as of
3
funding cost differentials appear to exist generally between large and small firms in
many industries, not simply in banking. In addition, since the magnitude of the
differential in banking is at the center of the range found across the other industries,
banking does not seem to be an outlier.3
Obviously, the next step would be to introduce controls for risk and other factors
to determine whether this general size advantage remains. Araten and Turner (2013),
for example, have introduced controls for risk in analyzing differences in Credit Default
Swap (CDS) spreads between large and small firms in a variety of industries. They find
that large firms generally do enjoy lower risk-adjusted CDS spreads than smaller firms in
the same industry. In addition, they find that the size advantage tends to be lower in
banking than in most other industries.4 (For more on controlling for liquidity and other
differences, see below section IV.3.)
Measuring and understanding the general size advantage that appears to exist
across industries, independent of whether there may be perceptions of government
support for large firms in that industry, has important implications for interpreting funding
The data are for the 3000 largest firms by market capitalization with the debt/equity ratios above the 10th percentile (to eliminate outliers). The WAC is calculated from the first quarter of 2007 to the second quarter of 2013. The top ten institutions are identified based on assets as of the end of the 2012. For ten broad industry categories in Bloomberg, the WAC differential in basis points between the top ten and other firms are: energy 84, consumer non-cyclicals 53, industrials 40, consumer cyclicals 39, banks 35, communications 30, non-bank financials 28, basic 28, technology 16, and utilities 5. 3 Strongin et al (2013) examined the top ten firms by revenue across 17 industries and found similar results. 4 Araten and Turner (2013) examine the same ten industries described in footnote two from the first quarter of 2002 to the first quarter of 2011. The “large” banks in their study (defined as Global Systemically Important Financial Institutions -- see section III.3 below) constitute approximately 60 percent of the market capitalization of all banks for which 5 Year CDS spreads are available. They use the same 60 percent share of market capitalization criterion to define large firms in other industries. They find a positive and statistically significant large-small difference in all of the industries except utilities. The estimated size advantage in each of the industries, except utilities, is greater than their estimate in banking (although they don’t perform formal “difference in difference” statistical tests, discussed below).
4

cost differences in banking. To the extent that such differentials are a general
phenomenon across many industries, one cannot simply conclude that a funding cost
difference in banking is due to perceptions of government support. Some type of
adjustment for the general size advantage would then be necessary to identify
differentials attributable to perceptions of government support.
A “difference in difference” approach could provide a research design to address
this issue. This approach would involve two steps: First, estimating large versus small firm
cost differentials in many industries, including banking, and using controls for firm and
market risks, liquidity, etc. and then, second, formally testing whether the differentials in
banking are greater than the large-small difference in other industries. To the extent
that such a differential is greater in banking than in other industries, then that additional
amount could be attributed to perceptions of government support in banking. In other
words, the estimate of the large-small difference in banking, relative to the large-small
difference in industries without a perception of government support of large firms,
would provide a measure of the advantage large banks would have from perceptions
of government support. Much more work needs to be done studying this apparent
general size advantage and adjusting for it when estimating the magnitude of funding
cost reductions due to perceptions of government support. A difference in difference
research design, thus, can provide an effective “identification strategy,” and so is a
fruitful direction for future research.
In addition, recent research suggests that there may be economies of scale in
banking. Studies analyzing data from before the full implementation of intra-state and
inter-state branching deregulation in the 1980s and 1990s had found little evidence of
5
scale economies beyond a relatively small bank size, but newer studies suggest
otherwise.5 Using data from the 2003, 2007, and 2010 and a technique that takes into
account banks’ risk choices and diversification, for example, Hughes and Mester
(forthcoming) find positive scale economies for even the largest institutions. They also
undertake robustness checks to see if perceptions of government support could
account for the results for the biggest banks and do not find support for that
hypothesis.6 Thus, it is also valuable to check that results from funding cost differential
studies are not due to potential scale economies in banking in order to identify the
impact of perceptions of government support.
(2) What is the appropriate time period to examine?
Perceptions about government support in banking have varied considerably
over time. Following the government support for Continental Illinois Bank in 1984 and
the Comptroller of the Currency naming 11 large banks that would receive similar
treatment if they were to experience distress, a number of studies found increases in
funding cost differentials for the largest banks (e.g., O’Hara and Shaw 1990). As the
regulators stepped back from such open-ended commitment in the following years
and with the passage of the FDIC Improvement Act of 1991, however, these
5 See Hughes, Lang, Mester, and Moon (1996 and 2000), Feng and Serletis (2010), and Wheelock and Wilson (2012). For a description and analysis of the impact of branching deregulation, see Kroszner and Strahan (1999). A variety of technological and financial innovations, such as the development of credit scoring techniques, also may have increased scale economies in banking (see Strahan forthcoming for an overview). Anderson and Joeveer (2012) use a different approach that relaxes the assumption of a competitive labor market for key bank employees and also find significant scale economies for the largest banks that they argue are not due to perceptions of government support. 6 For example, Hughes and Mester (forthcoming) apply the funding costs that small banks face to the cost functions for the largest banks, and they still find significant scale economies for the largest banks. This would suggest that funding cost differentials are not driving their finding of scale economies for large banks.
6
differentials appeared largely to disappear (Flannery and Sorescu 1996). Morgan and
Stiroh (2005) found a revival of these differentials in the 1990s. Recent studies looking at
both deposit and bond data (e.g. Acharya et al 2013 and Jacewitz and Pogach 2013),
find little difference in the years leading up to the financial crisis, and then larger
differentials during and immediately after the crisis.7
Changes in Credit Default Swap (CDS) spreads since the mid-2000s provide a
rough way to gauge markets’ overall assessment of large bank risk. The CDS spreads
will reflect both the likelihood that an individual bank might experience extreme
financial distress and the probability that the institution would receive support in such a
stress situation. If individual banks and the system overall are perceived as very low risk,
then the CDS spread would be low, regardless of probability of government crisis
support since the bank would be perceived as so unlikely to be in a position to require
such support. As Figure 2 shows, the CDS spreads for the six largest US bank holding
companies were very low, stable, and nearly identical prior to the second quarter of
2007. A perception of low risk for individual institutions and the system as a whole could
account for this pattern.8
The CDS spreads for these institutions blow out during the crisis and vary
significantly across the large banks. After the crisis, the CDS spreads fall from their 2008
and 2009 peaks but continue to be substantially higher and more differentiated than in
7 See Strahan (forthcoming) for an overview of how perceptions of government support appear to have changed over time. 8 Alternatively, a high probability of government support could also explain the low and undifferentiated CDS spreads for the largest banks in this period. One very rough way to examine this alternative would be to examine the CDS spreads for smaller banks relative to those of large banks. In this period, however, the CDS market is not very liquid beyond the largest firms so it may be challenging undertake a detailed empirical examination of alternative explanations of the pre-crisis period.
7
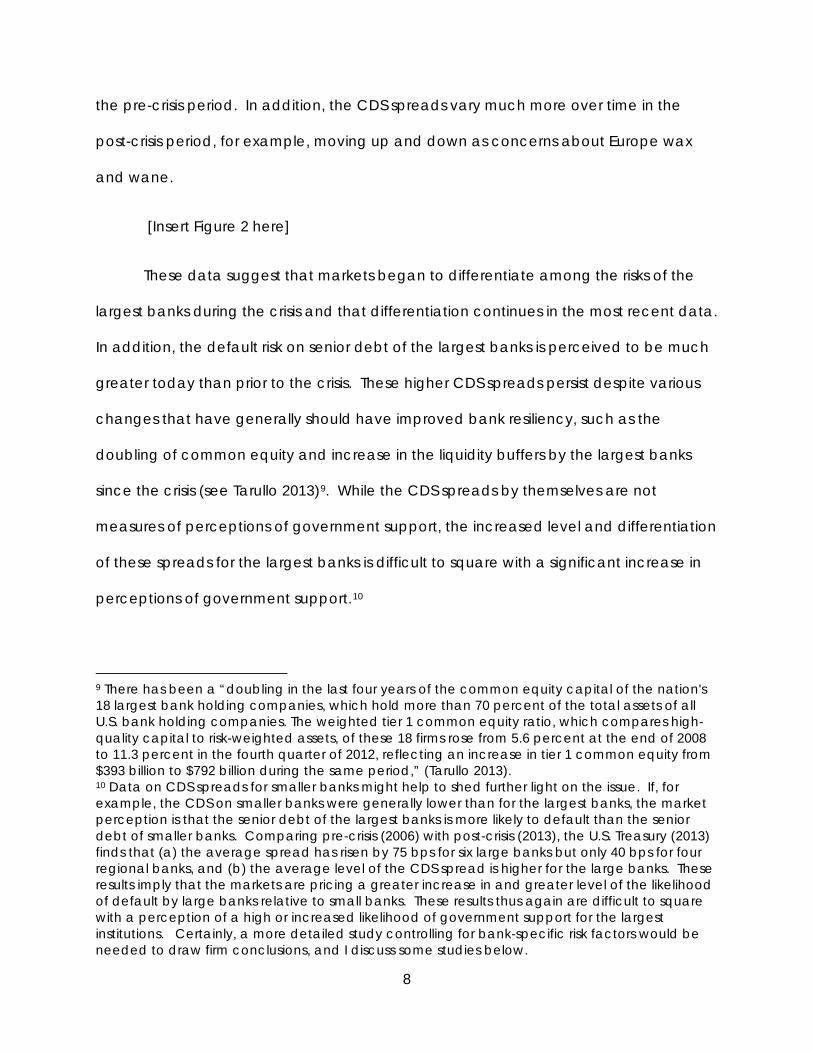
the pre-crisis period. In addition, the CDS spreads vary much more over time in the
post-crisis period, for example, moving up and down as concerns about Europe wax
and wane.
[Insert Figure 2 here]
These data suggest that markets began to differentiate among the risks of the
largest banks during the crisis and that differentiation continues in the most recent data.
In addition, the default risk on senior debt of the largest banks is perceived to be much
greater today than prior to the crisis. These higher CDS spreads persist despite various
changes that have generally should have improved bank resiliency, such as the
doubling of common equity and increase in the liquidity buffers by the largest banks
since the crisis (see Tarullo 2013)9. While the CDS spreads by themselves are not
measures of perceptions of government support, the increased level and differentiation
of these spreads for the largest banks is difficult to square with a significant increase in
perceptions of government support.10
9 There has been a “doubling in the last four years of the common equity capital of the nation's 18 largest bank holding companies, which hold more than 70 percent of the total assets of all U.S. bank holding companies. The weighted tier 1 common equity ratio, which compares high-quality capital to risk-weighted assets, of these 18 firms rose from 5.6 percent at the end of 2008 to 11.3 percent in the fourth quarter of 2012, reflecting an increase in tier 1 common equity from $393 billion to $792 billion during the same period,” (Tarullo 2013). 10 Data on CDS spreads for smaller banks might help to shed further light on the issue. If, for example, the CDS on smaller banks were generally lower than for the largest banks, the market perception is that the senior debt of the largest banks is more likely to default than the senior debt of smaller banks. Comparing pre-crisis (2006) with post-crisis (2013), the U.S. Treasury (2013) finds that (a) the average spread has risen by 75 bps for six large banks but only 40 bps for four regional banks, and (b) the average level of the CDS spread is higher for the large banks. These results imply that the markets are pricing a greater increase in and greater level of the likelihood of default by large banks relative to small banks. These results thus again are difficult to square with a perception of a high or increased likelihood of government support for the largest institutions. Certainly, a more detailed study controlling for bank-specific risk factors would be needed to draw firm conclusions, and I discuss some studies below.
8

Given the actions during the crisis and the changes following the crisis, a key
question in public policy debates about financial regulatory reform concerns the
perceptions of the likelihood of government support in the current environment and in
the future. Capital requirements for banks are now significantly higher than pre-crisis
and, as noted above, actual equity capital of large US banks has doubled since 2007.
Many other changes, both in terms of regulation and market practice, have occurred
since the crisis. The Dodd-Frank Act of 201011, for example, has set in motion of number
of regulatory reforms that have the potential to change market perceptions of
government support, even if much work still needs to be done before conclusions can
be drawn.12
Thus, studies focusing on crisis and pre-crisis data may be less relevant to
assessing the magnitude of funding cost differentials today, either due to overall
changes in market perception or expectations about how regulatory changes may
affect the probability and extent of government support going forward. Estimates from
historical data suggest that differences in funding cost differentials vary over time and
that these estimates may vary with the perceptions of risk and changes in regulatory
regime. The simple CDS data suggest that markets perceive significantly higher and
11 Schaefer et al. (2013), for example, undertake an event study of events related to the passage of Dodd-Frank that were sufficiently notable to receive front page coverage in the Financial Times. On a number of these events, they find negative market reactions for large bank stock prices and widening of CDS spreads for large banks. 12 See below section IV.1 on warnings from S&P and Fitch that they are (negatively) re-evaluating the likelihood of government support in light of the implementation of Dodd-Frank and the recent action by Moody’s to eliminate the “uplift” for government support on BHC debt. In particular, the agencies cite developments of provisions related to “orderly liquidation authority” are reducing the likelihood of government support for BHC debt. See also proposals for more “bail in” debt at the holding company level, e.g., http://www.ft.com/intl/cms/s/0/f5b56a22-13e8-11e3-9289-00144feabdc0.html?siteedition=intl#axzz2dhz5QpbS
9

more differentiated risks for the largest banks post-crisis than pre-crisis. Data from the
post-crisis period, thus, would be most relevant for determining the impact of the
perceptions government support in the current environment. Using data from the
recent period thus would seem to be the most relevant in analyses of funding cost
differentials for addressing current policy debates about perceptions of “too big to fail”
government support.
(3) What is the appropriate sample and comparison group?
There is no theoretically “correct” definition of what constitutes a “large” bank since
there are no direct measures of which banks are perceived as most likely to receive
support in a crisis. Different studies take a variety of approaches -- some based on size
and others based on other indicators of potential support. A simple asset-size cut-off is
used frequently. Common choices have been $500 billion, which would include six
banks in the post-crisis period; $100 billion, which would include roughly 18 banks, and
$50 billion, which would include roughly 36 banks and is the cut-off in the Dodd-Frank
Act for enhanced supervision and regulation by the Fed. Some studies also have used
the top ten banks or the top tenth percentile of banks.
Alternatively, many studies have used regulatory treatment to define “large.” A
common definition is to use the eight US banks designated as Global Systemically
Important Banks (G-SIBs) by the Bank for International Settlements and G-20 and subject
to stricter capital requirements and supervision. These include the six institutions over
$500 billion in assets plus two banks heavily involved in custodial services, Bank of New
York Mellon and State Street (see Figure 3). Others have defined large as the roughly 18
banks that have been included in the Fed’s “stress tests,” which are known more
10
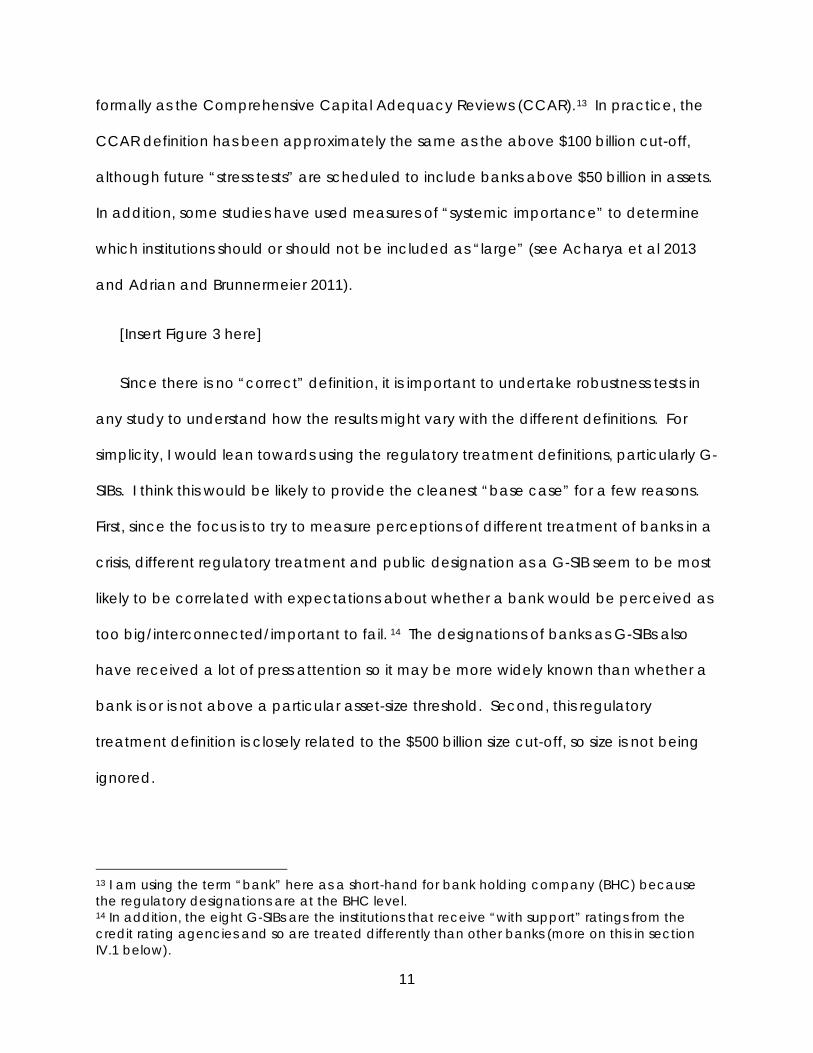
formally as the Comprehensive Capital Adequacy Reviews (CCAR).13 In practice, the
CCAR definition has been approximately the same as the above $100 billion cut-off,
although future “stress tests” are scheduled to include banks above $50 billion in assets.
In addition, some studies have used measures of “systemic importance” to determine
which institutions should or should not be included as “large” (see Acharya et al 2013
and Adrian and Brunnermeier 2011).
[Insert Figure 3 here]
Since there is no “correct” definition, it is important to undertake robustness tests in
any study to understand how the results might vary with the different definitions. For
simplicity, I would lean towards using the regulatory treatment definitions, particularly G-
SIBs. I think this would be likely to provide the cleanest “base case” for a few reasons.
First, since the focus is to try to measure perceptions of different treatment of banks in a
crisis, different regulatory treatment and public designation as a G-SIB seem to be most
likely to be correlated with expectations about whether a bank would be perceived as
too big/interconnected/important to fail. 14 The designations of banks as G-SIBs also
have received a lot of press attention so it may be more widely known than whether a
bank is or is not above a particular asset-size threshold. Second, this regulatory
treatment definition is closely related to the $500 billion size cut-off, so size is not being
ignored.
13 I am using the term “bank” here as a short-hand for bank holding company (BHC) because the regulatory designations are at the BHC level. 14 In addition, the eight G-SIBs are the institutions that receive “with support” ratings from the credit rating agencies and so are treated differently than other banks (more on this in section IV.1 below).
11

Of course, this relatively clean sample involves a relatively small number of firms so
there is a trade-off with the number of observations. Using a cut-off of $100 billion in
assets, which would then roughly include the banks in the original CCAR “stress tests,”
would increase the number of banks and provide a useful robustness check on the G-
SIB definition of “large” banks.
Two more questions about the appropriate sample arise: Should non-US institutions
be included? Should non-bank financials be included?15 Certainly, including non-US
institutions and non-bank financials can increase the sample size, but they introduce
important sources of heterogeneity that can complicate comparisons. The decision of
whether to expand the sample depends on judgments about the trade-off between
larger samples and greater heterogeneity.
Including non-US institutions, I would argue, involves an “apples to oranges”
comparison since the rules and expectations concerning the potential for government
support vary considerably across the globe. In the context of US policy debates, it
seems best to focus on US institutions in order to measure the perceptions of US
government support, which might be very different from perceptions of government
support in other countries. In addition, unless there is reason to believe that including
non-bank financials introduces very little heterogeneity, it seems cleaner to focus on
banks. Otherwise, the interpretation of a cost differential becomes more difficult, since
non-bank financials typically have very different funding structures and are subject to
15 A third question also arises: In the US, should the focus be on banks or bank holding companies (BHCs)? Given that the G-SIB designation is at the BHC level, that some data are more readily available on BHCs, and that much of the policy debate has been related to resolution regime for BHCs, the holding company level would seem to be the appropriate empirical focus.
12

different regulatory regimes and, hence, to different perceptions of government
support than are banks.
(4) How should funding cost differentials be used in calculating the total dollar
value of benefits?
Many studies of funding cost differentials use the measured spread between large
and small banks to calculate a total dollar value of benefits to large banks. In doing so,
it is important to take into account the heterogeneity in how large and small banks fund
themselves and to apply the measured differences to the appropriate sources of funds.
Perhaps the most basic difference is that small banks rely much more heavily on
deposits as a source of funds than large banks do. For the most recent four quarters, for
example, domestic interest-bearing deposits are 65 percent of the total liabilities of
small banks but are only 30 percent of the liabilities of large banks, defined as the G-SIBs
(see Figure 4).16 In contrast, large banks have greater access to the capital markets
and rely much more heavily on both senior and subordinated debt as well as
repurchase agreements and borrowing in the federal funds market: 37 percent of the
funding for the G-SIBIs come from these sources whereas they constitute only 15
percent of the funding for smaller banks (see Figure 4).
[Insert Figure 4 here]
16 If the $100 billion cut-off for large banks is used, the contrast is similar: 67 percent for smaller banks and 36 percent for large banks.
13

The different sources of funds have very different costs associated with them.
Deposits tend to have substantially lower interest costs than other liabilities.17 As Figure 4
shows, the average cost of senior debt is roughly five times greater than deposits costs
for the small banks and roughly nine times greater for large banks. These cost and
funding mix differences have a substantial impact on average overall funding costs for
large versus small banks.18 Given that small banks rely much more on the relatively low-
interest-cost deposits as a source of funding, the overall average funding costs of large
and small banks turns out to be quite similar. As Figure 5 illustrates, since 2007, the
overall average funding cost difference has varied within a narrow range and has
been virtually zero in the most recent quarters. The data in Figures 4 and 5 underscore
the importance of taking account of the very different liability structures of large and
small banks when applying estimates of funding cost differentials to calculate the total
value of benefits of perceptions of government support.
[Insert Figure 5 here]
IV. Challenges for Specific Approaches to Estimating Funding Cost Differentials
and Promising Directions for Future Research
In this section, I turn to considerations related to important issues that the specific
approaches (outlined in section II) must grapple with.
1) Credit Ratings
17 Certainly, there may be “brick and mortar” as well as personnel costs associated with deposit gathering, although some internet banks have been successful in attracting deposits. 18 Government deposit insurance plays a role in lowering the interest costs on insured deposits. To the extent that deposit insurance is underpriced, banks relying more upon this source of funds enjoy greater benefits from the safety net on their funding costs.
14

One approach to assessing potential funding costs differentials for large versus small
banks focuses on credit ratings. In particular, the major credit ratings agencies
(Moody’s, S&P, and Fitch) provide two types of credit ratings for bank holding
companies (BHCs). The first rating is the traditional corporate credit rating for debt
issued by the BHC. The agencies use their standard methods to measure the risks,
probability of default, etc. as they would for any private corporation in order to
determine the credit rating. Certainly, the modeling takes into account risks that are
unique to specific industries, but the resulting ratings are an attempt to provide some
degree of comparability across firms. For BHCs, the traditional ratings are called the
“standalone credit profiles” or “bank financial strength ratings.”
For BHCs, the agencies provide a second type of rating that explicitly considers
government support. Whereas the standalone ratings reflect the financial strengths
and risks of each individual institution on its own, the so-called “with support” ratings
take into account the rating agency’s perception of the likelihood and extent of
government intervention that may benefit the BHC’s senior creditors in a crisis.19 The
difference between the “standalone” rating and the “with support” rating is called the
ratings “uplift.” Eight US banks have received an “uplift” from the credit rating
agencies. These eight also happen to be institutions that have been designated as
19 For example, “Fitch’s definition of support excludes elements such as routine access to central bank liquidity, as this is viewed as ‘ordinary’ support offered to banks….Rather Fitch considers measures which go beyond this to be ‘extraordinary’ support and generally involve infusions of capital into what would otherwise be a nonviable institutions to prevent default on senior obligations….[other forms of such support would include] government guaranteed debt issues, blanket deposit guarantees, asset protection schemes, orchestrated M&A, and regulatory forbearance…” (Fitch 2011, p. 3).
15

Global Systemically Important Banks (G-SIBs), as described above in section III.3.20 The
vast majority of rated banks, thus, do not receive a ratings uplift from the agencies.
Several studies use the number of “notches” of this rating uplift as a proxy for funding
cost differentials for large versus small banks associated with perceptions of
government support. In this approach, to convert the uplift into a cost differential, the
studies translate the number of notches of uplift into the number of basis points savings
on bond yields. They do this by estimating how much more a bank would pay on its
debt if it enjoyed the higher “with support” rating rather than the “standalone” rating
and apply this difference to the bank’s liability structure.
To illustrate this method, consider a bank with $10 billion of debt with an A-
standalone rating but an A+ rating with support, a difference of two notches. To
translate this two-notch uplift into a yield spread, the next step would be to calculate
the difference between average yields across A- debt issues and A+ debt issue during
a particular period. Assume that this difference is 40 basis points. If one-quarter of the
bank’s activities are financed with these debt issues, for example, then this approach
would imply a “too big to fail” funding advantage of $10 million for this bank. This
method could then be applied to all large banks and an industry-wide funding cost
advantage could be calculated. Haldane (2010 and 2012), Ueda and Mauro (2011),
and Hoenig (2011) use this type of approach.
This method, however, relies crucially on the assumption that the “with support”
ratings uplift reflects actual savings in debt costs in the marketplace. In the above
20 Bank of America, Bank of New York Mellon, Citigroup, Goldman Sachs, JPMorgan Chase, Morgan Stanley, State Street, and Wells Fargo. Moody’s has recently eliminated the uplift for the debt of these BHCs, as discussed later in this section, Also, Fitch had previously assigned uplifts nine additional institutions but dropped them in 2011 (see Fitch 2011).
16

example, the question would be: Do the markets price the debt of bank in the above
example closer to A+ (with support) or A- (without)? If market participants do not find
the rating agencies’ judgments about government support informative about credit risk
and price the debt closer to the rating without support, then this method would not
provide a reliable or accurate way to determine funding cost differentials. In fact, it
would significantly overstate the advantage.
A simple way to test the validity of this assumption is to compare market-based
measures of risk with the two types of ratings that the banks receive. Using our example
from above, one can calculate the typical CDS spread for a firm with A+ (with support)
and A- (without) ratings and then see whether the actual CDS spread for the bank is
closer to A+ or A-. Figure 6 compares the CDS spreads of the six US banks with assets
greater than $500 billion with the median CDS spread for all firms with the same
“standalone” Moody’s rating and the same “with support” Moody’s rating. During the
second half of 2012, for example, the median CDS spread for these large banks is
roughly the same as the median CDS spread for firms with the same “standalone” rating
and substantially above (by about 60 basis points) the median CDS spread for firms with
the same “with support” rating. In other words, during this period, the CDS markets
were not pricing in any “uplift” in their assessment of the likelihood of default by the
large banks. These data do not support the assumption that a ratings “uplift”
automatically translates into lower borrowing costs, and hence calls into question the
use of the “uplift” as a measure of funding cost differentials.21
21 In the first half of 2012, the markets were pricing a substantially greater probability of default by the large banks than by firms with the same “standalone” ratings (see Figure 6). In June, 2012, Moody’s downgraded the large banks an average of roughly 1.5 ratings notches. The very high
17

[Insert Figure 6 here]
A more systematic analysis can be undertaken to investigate whether actual
market pricing reflects the ratings uplift or not. Araten (2013), for example, investigates
market-based bond spreads as well as CDS spreads and finds that for the largest banks
(>$500 billion) these market based indicators more closely track the standalone rather
than the with support ratings. These results again suggest that the uplifts are not
reflected in the actual market pricing (see also Araten and Turner 2013).
The judgments on which the uplift are based, naturally, involve subjective
assessments about the likelihood and extent of government intervention that are
difficult to model. These assessments depend on the legal, regulatory, and political
environment in which the banks operate. Thus, it is difficult to define the “with support”
rating as precisely and systematically as the traditional credit rating and this may be
part of the reason they are not reflected in market pricing.22
In addition, these judgments are changing over time.23 All three of the agencies, for
example, cite progress on the FDIC’s “orderly liquidation authority” from Dodd-Frank to
explain why they adopted a negative outlook on their “with support” ratings of the
eight banks in the last couple of years. In June 2013, for example, Standard and Poor’s
stated: “we believe it is prudent to reflect in our outlooks on the ratings on the eight
bank CDS spreads relative to CDS spreads for firms with the comparable ratings in the first half of 2012 could be due to the market’s anticipation of the downgrades of the banks. 22 In addition, the older Fitch “with support”-type ratings were not comparable with the regular rating scale, so papers using them, such as Ueda and Mauro (2011), have the additional complication of trying to map the “uplifted” ratings into the regular rating scale. See Noss and Sowerbutts (2012). 23 See section III.2 above on evidence of changing perceptions of government support over time. See also Schich and Byoung-Hwan (2012) which describes changes in ”uplifts” by the credit rating agencies across OECD countries since the crisis.
18
bank holding companies that we classify as SIFIs [Systemically Important Financial
Institutions] the possibility that we may not continue to factor support into the ratings in
the future” (S&P 2013). Fitch states that the changes so far suggest the “propensity for
[government] support is diminishing” (Fitch 2011, p.1).
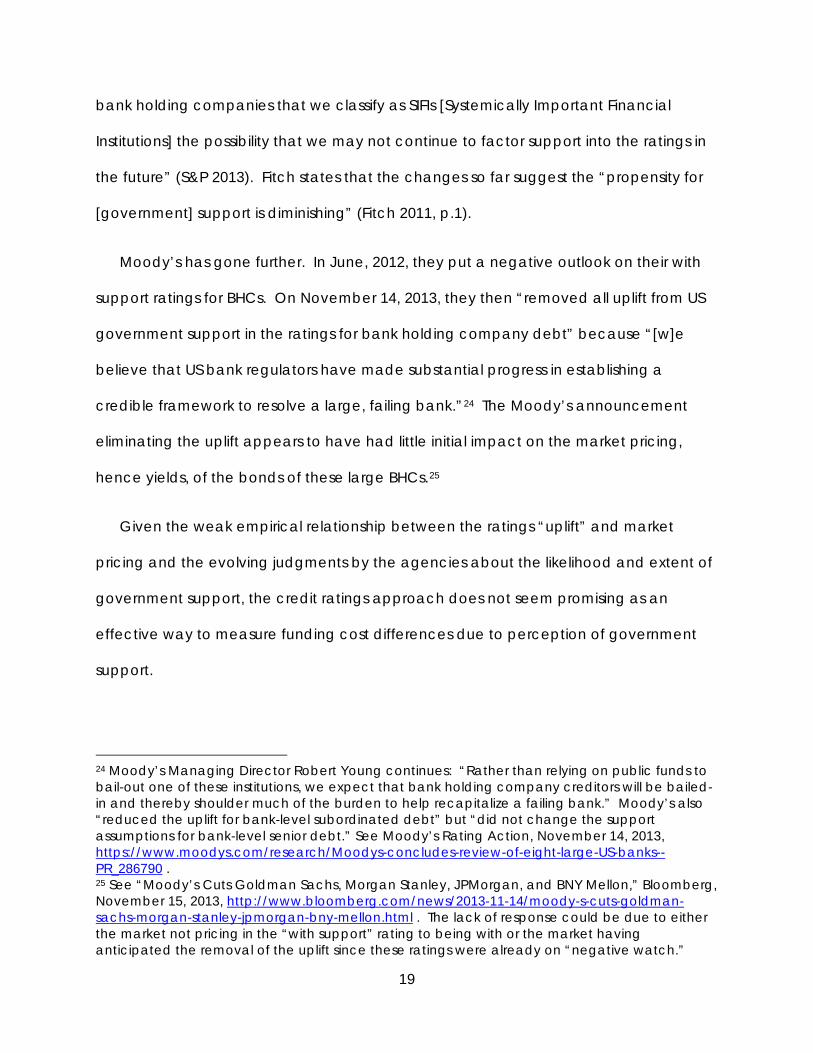
Moody’s has gone further. In June, 2012, they put a negative outlook on their with
support ratings for BHCs. On November 14, 2013, they then “removed all uplift from US
government support in the ratings for bank holding company debt” because “[w]e
believe that US bank regulators have made substantial progress in establishing a
credible framework to resolve a large, failing bank.”24 The Moody’s announcement
eliminating the uplift appears to have had little initial impact on the market pricing,
hence yields, of the bonds of these large BHCs.25
Given the weak empirical relationship between the ratings “uplift” and market
pricing and the evolving judgments by the agencies about the likelihood and extent of
government support, the credit ratings approach does not seem promising as an
effective way to measure funding cost differences due to perception of government
support.
24 Moody’s Managing Director Robert Young continues: “Rather than relying on public funds to bail-out one of these institutions, we expect that bank holding company creditors will be bailed-in and thereby shoulder much of the burden to help recapitalize a failing bank.” Moody’s also “reduced the uplift for bank-level subordinated debt” but “did not change the support assumptions for bank-level senior debt.” See Moody’s Rating Action, November 14, 2013, https://www.moodys.com/research/Moodys-concludes-review-of-eight-large-US-banks--PR_286790 . 25 See “Moody’s Cuts Goldman Sachs, Morgan Stanley, JPMorgan, and BNY Mellon,” Bloomberg, November 15, 2013, http://www.bloomberg.com/news/2013-11-14/moody-s-cuts-goldman-sachs-morgan-stanley-jpmorgan-bny-mellon.html . The lack of response could be due to either the market not pricing in the “with support” rating to being with or the market having anticipated the removal of the uplift since these ratings were already on “negative watch.”
19

2) Deposits
Another approach to assessing potential funding cost differentials for large versus
small banks focuses on deposits. This approach typically looks for differences in interest
rates paid on uninsured deposits across banks of different sizes. If there is a perception
of government intervention to support large banks, large banks would then be able to
offer lower rates to attract uninsured deposits than smaller banks.
The crucial assumption in this approach is that differences in deposit rates are
not attributable to other factors. These other factors include (1) differences in the costs
or availability of services associated with a deposit at a large versus small bank; (2)
differences in the costs or availability of complementary services associated with being
an uninsured depositor, and (3) differences in risk not associated with the potential for
government support in a crisis.26
Large banks, for example, may be able to provide cash management, transfer,
and international services that small banks do not or do only at a higher cost. Both
corporate and individual depositors who value those services more may then choose to
hold their deposits at a larger institution even if they receive a lower interest rate
because they are compensated through the availability and/or lower cost of these
services. Individuals and organizations that have sufficient resources to be able to hold
large uninsured deposits also may be more likely to have more demand for these types
26 The three factors listed here relate to ensuring “apples to apples” comparisons from depositor’s point of view. There also may be differences from the bank’s point of view. A large bank may evaluate a depositor relationship differently than a small bank and follow a different strategy for attracting depositors. Large banks, for example, have greater access to capital markets so the costs of funding alternatives may affect the willingness of a large bank to compete for deposits relative to a small bank. As noted above in section III.4, large banks rely much less on deposits as a source of funding.
20
of these services than small depositors. Unfortunately, few systematic studies of what
criteria (besides distance/convenience) lead depositors to select banks (see Cvsa et al
2002). It would be valuable, even if difficult, to investigate the importance of implicit
and complementary services in order to make “apples to apples” comparisons of
deposit rates between large and small banks.
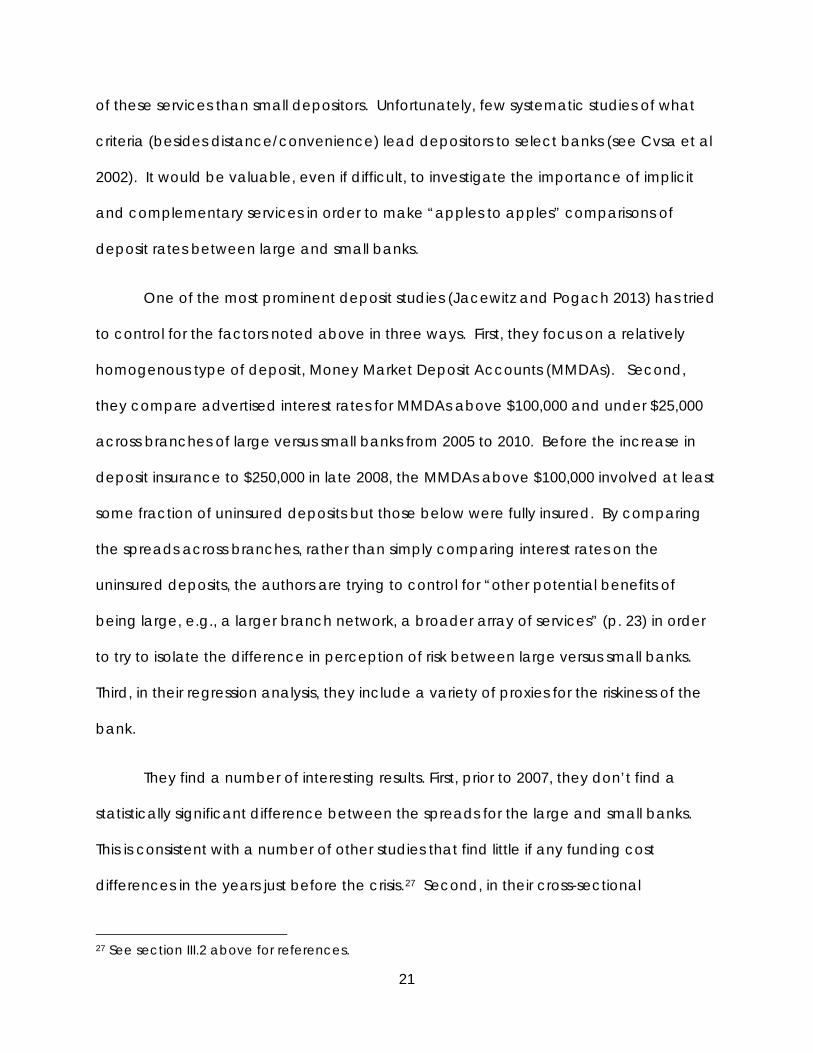
One of the most prominent deposit studies (Jacewitz and Pogach 2013) has tried
to control for the factors noted above in three ways. First, they focus on a relatively
homogenous type of deposit, Money Market Deposit Accounts (MMDAs). Second,
they compare advertised interest rates for MMDAs above $100,000 and under $25,000
across branches of large versus small banks from 2005 to 2010. Before the increase in
deposit insurance to $250,000 in late 2008, the MMDAs above $100,000 involved at least
some fraction of uninsured deposits but those below were fully insured. By comparing
the spreads across branches, rather than simply comparing interest rates on the
uninsured deposits, the authors are trying to control for “other potential benefits of
being large, e.g., a larger branch network, a broader array of services” (p. 23) in order
to try to isolate the difference in perception of risk between large versus small banks.
Third, in their regression analysis, they include a variety of proxies for the riskiness of the
bank.
They find a number of interesting results. First, prior to 2007, they don’t find a
statistically significant difference between the spreads for the large and small banks.
This is consistent with a number of other studies that find little if any funding cost
differences in the years just before the crisis.27 Second, in their cross-sectional
27 See section III.2 above for references.
21
regressions, they find a statistically significant difference (at the 5 percent level) in large
versus small banks spreads for only the first three quarters of 2007, not in Q4 of 2007 or
the first three quarters of 2008, prior to the increase in deposit insurance to $250K.
They then run a panel regression that uses both the variation across banks and
over the time period 2006 Q1 to 2008 Q2 to estimate the spread difference between
large and small banks. Their benchmark large bank threshold is assets above $200
billion in 2005 dollars, and seven banks meet this criterion in their sample prior to the
crisis. They find a 37 basis point difference that is statistically significant, and they
interpret this as due to perceptions of lower risk due to government support.
The valuable robustness checks in this study, however, raise questions about this
interpretation. First, after the increase in deposit insurance to $250K, the difference
between the large versus small bank spread should disappear, under their
interpretation, since both the $100K and $25K MMDAs at all banks would now be FDIC-
insured. When they run this regression for 2008 Q4 to 2010 Q2, however, they find large
the bank spread is still a statistically significant 9 bps less than the small banks. That
suggests that 9 bps of the difference in their baseline 37 bps result may not be
attributable to perceived risk differences, since during this period all of the deposits are
fully insured.
Second, they reduce the threshold for the definition of large bank to be only $10
billion, instead of $200 billion, but still find a statistically significant 21 bps lower spread
for the $10 billion banks. As the authors note, this result “is more problematic to the
interpretation of the estimate as the consequence of implicit government support.
Historical precedent and common perception does [sic] not suggest that banks at this
22

threshold would receive any extraordinary support” (p. 28). The banks smaller than $10
billion, for example, may not provide wealth management services (or only provide
them at a higher cost) that the $10 billion banks provide for large MMDA deposit
customers.28 There may be a variety “preferred” services that large depositors at large
banks receive that large depositors would not receive (or only receive at higher cost) at
small banks. The results of this robustness check suggest that 21 bps of difference in
their baseline 37 bps result may not be attributable to perceived risk differences. The
robustness checks raise broader questions about whether this empirical method, which
does include some important controls, can provide a foundation to draw firm
conclusions about funding cost differences due to perceived government support.
More generally, these issues point to the difficult challenges in trying to isolate
differences in deposit rates attributable to perceived government support.29 A more
promising approach using deposits to address these issues would be to look for
“natural” experiments that arise from recent changes in deposit insurance coverage.
In fall of 2008, for example, the FDIC initiated the Transactions Account
Guarantee (TAG) program that provided unlimited coverage for non-interest bearing
transactions accounts that many businesses, hospitals, universities, charities, and
municipalities use. This unlimited coverage, however, expired at the end of 2012, when
the coverage fell to $250K.30 These accounts typically are used for payroll and
28 In an additional robustness check, the study includes fee income from investment banking and fiduciary investment activities but this may not be a good proxy for the availability or cost of wealth management services for large depositors. 29 As noted above, another issue is that banks may vary the rates they offer on deposits depending upon their demand for funding and the relative costs of other funding sources. The difference in availability and cost alternative sources of funding for large versus small banks may be reflected in systematically different behavior on deposit rates. 30 See http://www.fdic.gov/deposit/deposits/changes.html
23
operating expenses so often involve very large balances, which was part of the original
motivation for granting the unlimited coverage. More than $1 trillion dollars is held in
these types of accounts. In late 2012, numerous concerns were raised that the
expiration of this program would mean that these deposits would flow out of small
banks and into large banks that were perceived to have government support. The
concerns were sufficient that there was discussion in Congress about whether to
postpone the expiration of the program, but no action was taken.
The expiration of the TAG program provides a way to gauge how important
these depositors perceive the risk differences are between large and small banks. If
these depositors perceived the risks to increase for accounts at small banks, then we
would observe substantial flows of non-interest-bearing deposits out of small banks and
into large banks. As Vice Chairman of the FDIC Tom Hoenig noted, despite these types
of concerns being voiced in 2012, the expiration did not lead to substantial flows.31
As Figure 7 demonstrates, there is no evidence of switching from small to large
banks around the time the TAG program ended. In fact, roughly the opposite
occurred: small banks saw these types of deposits grow by roughly six percent from the
quarter before to the quarter after the TAG expiration, whereas the largest banks saw
little change.32 This evidence thus does not support the hypothesis that these depositors
perceived a significant difference in risk between large and small banks during this
31 Joe Adler, “TAG Expiration Had Little Impact: FDIC's Hoenig,” American Banker, March 20, 2013. 32 Since there could have been movement out of non-interest-bearing deposits into other forms of deposits, I also checked the change in total deposits over this period. The G-SIBs and the smallest banks saw nearly identical growth in their total deposits: 3.7 percent for the G-SIBs and 3.8 percent for the smallest banks. The “CCAR minus G-SIBs” group experienced deposit growth of 1.9 percent. These data suggest that the small banks did not lose deposits generally to the large banks when the TAG program expired.
24
period. Looking for other “natural” experiments arising from changes in FDIC
guarantees is a promising direction for future research.
[Insert Figure 7 here]
3) Bond Pricing and CDS Spreads
A third approach to assessing potential funding cost differentials for large versus
small banks focuses on bond pricing. In particular, these studies compare the interest
rates paid on large banks’ bonds versus small banks’ bonds, usually relative to a
comparable Treasury security. This type of approach also can be applied to the CDS
spreads for large versus small banks. A variety of controls are typically included, such as
measures of a bank’s risk and market-wide measures of risk. After including these
controls, differences in the spreads between the large and small banks are interpreted
as a measure of the funding differential that large banks enjoy due to perceptions of
government support.
There are a number of crucial assumptions for this interpretation to hold. First, to
attribute these differences to perceptions of government support, it is important that
the estimated differences are not due to the general size advantage discussed above
(section III.1). In this approach, adjusting for an average or median general size
advantage across industries in which there is no perception of government support
would be needed.33 Careful estimation of and adjustment for the general size
advantage, as through the “difference in difference” approach described in section
III.1 above, would be extremely valuable for the interpretation of funding cost
differentials in banking.
33 Also, controls should be included for economies of scale. See section III.1.
25
A second assumption is that that differences in liquidity have been taken into
account.34 The importance of liquidity in bond pricing has been well established
(corporate bond markets are dramatically less liquid than equity markets), but the best
proxies to adjust for liquidity differences are not as clear (see Chen et al. 2007). The
liquidity differences for the bonds of large and small banks are substantial. For 2010 and
2011, for example, the median number of institutional trades (greater than $1 million)
per month for the most actively traded bonds of the G-SIBs is 89, whereas it falls to only
18 for the banks above roughly $100 billion in assets (excluding the G-SIBs), and to just 1
for smaller US banks with bonds that traded during this period (see Figure 8).35 The G-
SIBs have dramatically more bonds outstanding, and the median size of their bond
issues is significantly greater than for other banks. In addition, even for a large bank, the
liquidity across its bond issues can vary widely. Newer “on the run” issues tend to be
substantially more liquid than older “off the run” issues (see Strongin et al 2013). Careful
adjustment for and estimation of the liquidity differences, while challenging, would be a
promising direction for future research on these questions (see Araten and Turner 2013
for steps in this direction).
[Insert Figure 8 here]
A third assumption is that the relevant risk factors, besides perceptions of support,
have been taken into account. These factors might include (1) firm-specific risk
measures of asset quality, returns, volatility, liquidity, capital, etc.; (2) theoretical
measures of risk such as “distance to default” (Merton 1974), z-scores, KMV measures,
34 Liquidity, of course, could be one aspect of the general size advantage. 35 Using a different dataset and different method, Strongin et al (2013) also finds dramatic differences in trading frequency for bonds of the largest (>$500 billion) banks versus others.
26

etc.; (3) credit ratings; and (4) macro or market risk measures such as VIX, slope of the
yield curve, etc. Acharya et al (2013) and Araten and Turner (2013) find explanatory
power for these types of factors in bond pricing.36 It is important to ensure the
robustness of any result in this approach by carefully considering a wide variety of
controls for different types of risk. Similarly, it is crucial to make sure that the bonds
being compared have similar covenants and embedded options (or are explicitly
adjusted for) to ensure “apples to apples” comparisons.37
As noted above (section III.4), large banks have very different liability structures
than small banks, because small banks rely much more heavily on deposits and large
banks more on external borrowings. It is important to take into account these
differences when calculating a total dollar value of benefits of funding cost differentials
and applying the measured differentials to the appropriate parts of liability structure.
36 Acharya et al (2013) includes both banks and non-bank financials and the estimation ends in 2010. As noted in the section III.3, the heterogeneity of banks and non-banks complicate the interpretation of these results and more recent data would be valuable to assess funding differentials in the current environment. Acharya et al (2013) includes an event study on one date in the Dodd-Frank legislative history and finds no impact on the large financials. They conclude that Dodd-Frank had no broader impact so that it isn’t necessary to look at data post-Dodd-Frank. Schaefer et al. (2013), however, undertake a more extensive analysis of key dates in the Dodd-Frank legislative history and find negative impacts on large bank equity returns and widening of large bank CDS spreads. They interpret their results as suggesting that perceptions of government support decreased with Dodd-Frank. Thus, it would be important to examine post-Dodd Frank data to address current policy debates (see section III.2). In addition, independent of the debate about the initial perception of Dodd-Frank’s impact, the credit rating agencies discussions and actions since the passage of the Act (described in section IV.1) reflect their view that the implementation of the law is having or is likely to have a material impact on perceptions of government support. 37 Perhaps one way to adjust for bank-specific factors might be to compare bonds from the same bank that were and were not issued under the FDIC’s Temporary Liquidity Guarantee Program (TLGP). A key question would be whether there are a sufficient number of comparable bonds with similar liquidity characteristics to be able to do a systematic comparison. Alternatively, comparing the government guaranteed TLGP bonds with similarly-dated Treasuries might provide a measure of liquidity premia.
27

While there are many challenges to making “apples to apples” comparisons and
interpreting funding cost differentials as due to perceptions of government support
rather than a general size advantage, the bond and CDS spread approach holds
promise for making progress on the issue. As described in section III.1, a very promising
empirical approach would be a “difference in difference” analysis that controls for
factors related to size in industries without perceptions of government support for the
largest institutions. Controlling carefully for risks and liquidity differences also will be
crucial, so checking robustness of results to the inclusion of different sets of control
factors will be important in this approach.
V. Summary and Conclusions
An extensive literature exists analyzing funding cost differentials between large
and small banks as a way to measure perceptions of government support for large
banks in a crisis. Rather than attempt to summarize and assess dozens of papers
individually, I have grouped the papers into five categories based on data and
methods: 1) Bond prices and CDS spreads; 2) Credit ratings; 3) Deposits; 4) Equity
prices; and 5) Other. I then discussed four challenges that all of the approaches face,
examined challenges more specific to the first three approaches, and proposed
promising approaches for measuring the differentials.
The challenges that all of the approaches face include:
Identification: First, the “identification” challenge is to ensure that measured
funding cost differences between large and small banks are due to perceptions of
government support and not to other factors that are related to size but are
independent of perceptions of government support. In particular, it appears that
28

funding cost differentials exist between large and small firms in most industries. Thus, it is
important to adjust for this general size advantage in order to isolate the large versus
small funding cost differentials attributable to perceptions of government support in
banking. Given that recent studies suggest that there are scale economies in banking
even for the largest group of banks, it also important to distinguish the effects of
economies of scale from the impact of perceptions of government support.
Time period: The second challenge involves choosing the appropriate time
period to study. Cost differentials and perceptions of government support have varied
considerably over time. The CDS data suggest that, since the crisis, markets perceive
higher and more differentiated risks among the largest banks than prior to the crisis.
Data from the post-crisis period, thus, would be the most relevant to ongoing debates
about the impact of perceptions of government support on funding cost differentials in
the current regulatory and market environment.
Definition of “large” bank: The third challenge concerns determining the
appropriate definition of “large” and the appropriate comparison group. The eight
banks designed as the Global Systemically Important Banks (G-SIBs) would seem to be
a natural definition of “large” since they receive special regulatory treatment and are
roughly the largest institutions by assets. The approximately 18 banks above $100 billion
could be used as a robustness check. Although introducing non-financials and non-US
institutions into the large bank or comparison group would increase the sample size,
they introduce substantial heterogeneity, making the interpretation of the funding cost
differentials more difficult.
29

Funding Mix: The fourth challenge is that large and small banks fund themselves
very differently, with deposits being a much higher fraction of total liabilities for small
banks relative to large banks. As a consequence of this different funding mix, since
deposits are the lowest-interest-cost source of funding, the overall average cost of
funding for large and small banks turns out to be roughly the same. When calculating
the total dollar value of benefits to large banks, thus, it is important to apply the
estimated funding costs differentials to the appropriate instruments in the liability
structure, rather than across the board.
Turning to the challenges for specific approaches:
Credit Ratings: Studies based on credit ratings and the “uplift” given to the G-
SIBs typically assume that the ratings uplift due to perceptions of government support
translates directly into lower actual funding costs. It appears, however, that markets
price large bank debt closer to the “standalone” rating rather than the uplifted “with
support” rating. Thus, the uplifted ratings do not appear to provide a good proxy for
actual funding cost differentials. In addition, all three of the major credit rating
agencies put their uplifted ratings on “negative watch” because regulatory changes,
such as the implementation of orderly resolution authority of Dodd-Frank, are
diminishing their perception of the likelihood of government support for large banks in a
crisis. Moody’s has gone further to remove the uplift on large BHC debt in November
2013. Given the lack of connection of the ratings uplift to actual funding costs and the
“negative watch” or removal of these uplifts, the credit ratings studies, especially those
using past “uplifts,” do not seem to hold promise as an effective approach to
30

measuring funding cost differentials due to perceptions of government support in the
current environment.
Deposits: Studies comparing interest rates on uninsured deposits at large and
small banks rely on the assumption that the interest rate differences are not attributable
to other factors besides perceptions of government support. Large banks, for instance,
may be able to offer a wider variety of services and at lower costs than smaller banks,
resulting in a lower observed interest rate paid by the large banks. Separating out or
“identifying” whether such differences are due to perceptions of government support
or to other services, thus, is quite difficult. Also, large banks have greater access to
capital markets for funding so the costs of these alternative funding sources may affect
interest rates offered by large banks differently than for small banks.
Bond Pricing and CDS Spreads: Comparing differentials in bond pricing and CDS
spreads faces the key “identification” challenge of whether estimated differentials can
be attributed primarily to perceptions of government support. In these approaches, it is
crucial to adjust for the general size advantage that appears common across
industries, not just in banking. Liquidity plays a very important role in bond pricing, but
carefully controlling for it is difficult, particularly given vast differences in the liquidity of
large and small bank bonds. Ensuring “apples to apples” comparisons of bonds, given
the variety of covenants and provisions, also is important in this approach.
While certainly no approach is flawless, I believe that there are specific ways to
improve on the existing literature to provide better estimates of and more insights into
the interpretation of funding cost differentials:
31
Difference in Difference: Since there appears to be a general size advantage
across industries, it would be valuable to use a research design that adjusts in a
statistically rigorous way for this to determine whether the large versus small differential is
greater in banking. A “difference in difference” approach has the potential to do that.
The first step of this procedure involves data from a wide variety of industries to estimate
large versus small funding differences for bonds, for example, and includes sets of
controls for individual firm risks, industry characteristics, market risks, liquidity, scale
economies, time, etc. The second step involves formal statistical tests of the large
versus small pricing differential in banking relative to that estimated for other industries.
This approach thus can improve over existing studies by providing greater confidence
that the funding cost “difference in difference” can be attributable to perceptions of
“too big to fail” government support of large banks, rather than a host of alternative
explanations related to size. This approach is one of the most promising research
designs to answer this important public policy question going forward.
Natural Experiments: In addition, it is worth looking for changes in regulation,
deposit insurance, etc. that can provide a way to interpret and to examine the impact
of changes in perceptions of government support for large banks. As described above,
the recent expiration of the unlimited deposit insurance guarantee on non-interest
bearing transactions accounts (the TAG program) provides an “experiment” to gauge
the importance of the perception of government support. If smaller banks are
perceived to be less likely to receive support, the end of the TAG program would mean
those deposits would be perceived as riskier and, hence, would flow to the large banks.
Since that did not happen, this episode raises questions about how great the
perceptions of government support are for the large banks. Looking for other such
32

“natural experiments” is another promising direction for future research to better
understand perceptions of government support.
To conclude, studying funding cost differentials between large and small banks is
important for ongoing policy debates about banking and financial regulation. Sound
empirical analyses are crucial for policy makers to be able to assess the magnitude of
concerns they might have about perceptions of “too big to fail” government support
and then to be able to weigh the costs and benefits of alternative reform proposals. By
providing an overview of the key challenges for empirical analyses of estimating
funding cost differentials between large and small banks and describing promising
approaches to improve upon the existing literature, I hope that this paper can
contribute to both clarifying debates about and advancing our understanding of key
issues in banking and financial regulatory reform.
33
Bibliography (including papers not directly cited in the text)
Acharya, Viral V., Deniz Anginer, A. Joseph Warburton (2013), “The End of Market Discipline? Investor Expectations of Implicit State Guarantees,” Working paper, March.
Acharya, Viral V., Nirupama Kulkarni, and Matthew Richardson, (2011), “Capital, Contingent Capital, and Liquidity Requirements,” in Regulating Wall Street: The Dodd-Frank Act and the New Architecture of Global Finance, V. Acharya, T. Cooley, M. Richardson, and I. Walter (eds.) (Wiley, Hoboken, NJ), 143-180.
Acharya, Viral V., Lasse H. Pedersen, Thomas Philippon, and Matthew Richardson, (2010), “Measuring Systemic Risk,” Working Paper.
Admati, Anat and Martin Hellwig, (2013), The Banker’s New Clothes, Princeton University Press.
Adrian, Tobias, and Markus K. Brunnermeier, (2011), "CoVaR," Federal Reserve Bank of New York Staff Report 348.
Allen, Linda, Julapa Jagtiani, and James Moser, (2001), "Further Evidence on the Information Content of Bank Examination Ratings: A Study of BHC-to-FHC Conversion Applications," Journal of Financial Services Research 20, 213-232.
Amel, Dean, Colleen Barnes, Fabio Panetta, and Carmelo Salleo, (2004), “Consolidation and Efficiency in the Financial Sector: A Review of the International Evidence,” Journal of Banking and Finance 28, 2493-2519.
Anderson, Ronald and Karin Joeveer, (2012), “Bankers and bank investors: Reconsidering the economies of scale in banking,” Financial Markets Group LSE, Working paper 172, September.
Anginer, Deniz, and Asli Demirguc-Kunt, (2011), “Has the Global Banking System Become More Fragile Over Time?,” Working Paper.
Anginer, Deniz, and A. Joseph Warburton, (2012), “The Chrysler Effect: The Impact of Government Intervention on Borrowing Costs,” Working Paper.
Anginer, Deniz, and Celim Yildizhan, (2010), “Is There a Distress Risk Anomaly? Corporate Bond Spread as a Proxy for Default Risk,” World Bank Policy Research Working Paper No. 5319.
Araten, Michel, (2013) “Credit Ratings as Indicators of Implicit Government Support for Global Systemically Important Banks,” working paper.
34
Araten, Michel and Christopher Turner, (2013), “Understanding the Funding Cost Differences Between Global Systemically Important Banks (G-SIBs) and non-G-SIBs in the United States,” Journal of Risk Management in Financial Institutions, vol. 6, no. 4.
Baker, Dean and Travis MacArthur, (2009), “The Value of the ‘Too Big To Fail’ Big Bank Subsidy,” Center for Economic Policy Research, Issue Brief, September.
Balasubramnian, Bhanu, and Ken B. Cyree, (2011), “Market Discipline of Banks: Why are Yield Spreads on Bank-Issued Subordinated Notes and Debentures Not Sensitive to Bank Risks?,” Journal of Banking & Finance 35, 21-35.
Berger, Allen N., and David B. Humphrey, (1994), “Bank Scale Economies, Mergers, Concentration, and Efficiency: The U.S. Experience,” Board of Governors of the Federal Reserve System, Finance and Economics Discussion Series 94-23.
Berger, Allen N. and Loretta J. Mester, (1997), “Inside the Black Box: What Explains Differences in the Efficiencies of Financial Institutions?,” Journal of Banking and Finance 21, 895-947.
Bliss, Robert R., (2001), “Market Discipline and Subordinated Debt: A Review of Some Salient Issues,” Federal Reserve Bank of Chicago Economic Perspectives 25, 34-45.
Bliss, Robert R., (2004), “Market Discipline: Players, Processes, and Purposes,” in Market Discipline Across Countries and Industries, W. Hunter, G. Kaufman, C. Borio, and K. Tsatsaronis (eds.) (MIT Press, Boston), 37-53.
Borisova, Ginka, Veljko Fotak, Kateryna Holland, and William L Megginson, (2012), “Government Ownership and the Cost of Debt: Evidence from Government Investments in Publicly Traded Firms,” Working Paper.
Boyd, John H., and David E. Runkle, (1993), “Size and Performance of Banking Firms: Testing the Predictions of Theory,” Journal of Monetary Economics 31, 47-67.
Boyd, John H., and Mark Gertler, (1994), “Are Banks Dead? Or Are the Reports Greatly Exaggerated?,” Federal Reserve Bank of Minneapolis Quarterly Review.
Brewer, Elijah, and Julapa Jagtiani, (2011), “How Much Did Banks Pay to Become ‘Too-Big-To-Fail’ and to Become Systemically Important?”, Federal Reserve Bank of Philadelphia, working paper 11-37, September.
Brown, Craig O., and I. Serdar Dinç, (2011), “Too Many to Fail? Evidence of Regulatory Forbearance When the Banking Sector Is Weak,” Review of Financial Studies 24, 1378-1405.
35
Brunnermeier, Markus K., Andrew Crockett, Charles Goodhart, Avinash Persuad, and Hyun Shin, (2009), "The Fundamental Principles of Financial Regulation," Geneva Reports on the World Economy 11.
Campbell, John Y., Jens Hilscher, and Jan Szilagyi, (2008), “In Search of Distress Risk,” Journal of Finance 63, 2899-2939.
Campbell, John Y., and Glen B. Taksler, (2003), "Equity Volatility and Corporate Bond Yields," Journal of Finance 58, 2321-2350.
Chen, Long, David A. Lesmond, and Jason Wei, “Corporate Yield Spreads and Bond Liquidity”, The Journal of Finance, Volume 62, Issue 1, pages 119-149, February 2007.
Cordella, Tito, and Eduardo L. Yeyati, (2003), “Bank Bailouts: Moral Hazard vs. Value Effect,” Journal of Financial Intermediation 12, 300-330.
DeAngelo, Harry and Rene Stulz, (2013), “Why High Leverage is Optimal for Banks,” working paper, June.
Demirguc-Kunt, Asli, and Enrica Detragiache, (2002), "Does Deposit Insurance Increase Banking System Stability? An Empirical Investigation," Journal of Monetary Economics 49, 1373-1406.
Demirguc-Kunt, Asli, and Harry Huizinga, (2011), “Do We Need Big Banks? Evidence on Performance, Strategy and Market Discipline,” World Bank Policy Research Paper Number 5576.
Demirguc-Kunt, Asli, and Harry Huizinga, (2010), “Are Banks Too Big To Fail or Too Big To Save? International Evidence from Equity Prices and CDS Spreads,” World Bank Policy Research Paper Number 5360.
Demsetz, Rebecca S., and Philip E. Strahan, (1997), “Diversification, Size, and Risk at Bank Holding Companies,” Journal of Money, Credit and Banking 29, 300-313.
De Nicoló, Gianni, (2000), “Size, Charter Value and Risk in Banking: An International Perspective,” Board of Governors of the Federal Reserve System International Finance Discussion Paper No. 689.
DeYoung, Robert, Mark J. Flannery, William Lang, and Sorin M. Sorescu, (2001), “The Information Content of Bank Exam Ratings and Subordinated Debt Prices,” Journal of Money, Credit and Banking 33, 900-925.
Duchin, Ran, and Denis Sosyura, (2012), “Safer Ratios, Riskier Portfolios: Banks’ Response to Government Aid,” University of Michigan Ross School of Business Working Paper No. 1165.
36
Federal Reserve Board, (1999), “Using Subordinated Debt as an Instrument of Market Discipline,” Staff Study No. 172.
Feng, G. and Serletis, A., (2010), “Efficiency, technical change, and returns to scale in large US banks: Panel data evidence from an output distance function satisfying theoretical regularity,” Journal of Banking and Finance 34, 127-138.
Financial Stability Forum, (2009a), “Reducing Procyclicality Arising From the Bank Capital Framework’” Joint FSF-BCBS Working Group on Bank Capital Issues.
Financial Stability Forum, (2009b), “Report of the Financial Stability Forum on Addressing Procyclicality in the Financial System,” (April, 2009).
Flannery, Mark J., (1998), “Using Market Information in Prudential Bank Supervision: A Review of the U.S. Empirical Evidence,” Journal of Money, Credit and Banking 30, 273-305.
Flannery, Mark J., and Sorin M. Sorescu, (1996), “Evidence of Bank Market Discipline in Subordinated Debenture Yields: 1983-1991,” Journal of Finance 51, 1347-77.
Freixas, Xavier, (1999), "Optimal Bail-Out, Conditionality and Creative Ambiguity," CEPR Discussion Paper 2238.
Gropp, Reint, Hendrik Hakenes, and Isabel Schnabel, (2010), "Competition, Risk-Shifting, and Public Bail-Out Policies," Review of Financial Studies 24, 2084-2120.
Gropp, Reint, C. Grundl, and A. Guttler, (2010), "The Impact of Public Guarantees on Bank Risk Taking: Evidence from a Natural Experiment," Tilburg University Center for Economic Research Discussion Paper 2010-69S.
Gropp, Reint, and Jukka Vesala, (2004), "Deposit Insurance, Moral Hazard, and Market Monitoring," European Central Banks Working Paper Series 302.
Haldane, Andrew, (2010), “The $100 Billion Question,” Comments at the Institute of Regulation and risk, Hong Kong, March.
Haldane, Andrew, (2012), “On Being the Right Size,” Speech at the Institute of Economic Affairs, 2012 Beasley Lecture, October 25.
Hillegeist, Stephen A., Elizabeth K. Keating, Donald Cram, and Kyle Lundstedt, (2004), "Assessing the Probability of Bankruptcy," Review of Accounting Studies 9, 5-34.
Hoenig, Thomas, (2011), “Financial Reform – Post-Crisis?”, Speech at Women in Housing and Finance Conference, Washington DC, 23 February.
37
Hovakimian, Armen, and Edward J. Kane, (2000), “Effectiveness of Capital Regulation at U.S. Commercial Banks, 1985-1994," Journal of Finance 55, 451-468.
Huang, Xin, Hao Zhou, and Haibin Zhu, (2009), "A Framework for Assessing the Systemic Risk of Major Financial Institutions," Journal of Banking and Finance 33, 2036–2049.
Hughes, Joseph P., and Loretta J. Mester, (forthcoming), “Who Said Large Banks Don’t Experience Scale Economies? Evidence From a Risk-Return-Driven Cost Function,” Journal of Financial Intermediation (Federal Reserve Bank of Philadelphia Working Paper).
Hughes, J.P., Lang, W., Mester, L.J., Moon C.-G., (1996), “Efficient banking under interstate branching,” Journal of Money, Credit, and Banking 28, 1045-1071.
Hughes, J.P., Lang, W., Mester, L.J., Moon C.-G., (2000), “Recovering risky technologies using the almost ideal demand system: an application to U.S. banking,” Journal of Financial Services Research 18, 5-27.
International Monetary Fund, (2010), “A Fair and Substantial Contribution by the Financial Sector,” Final Report for the G-20 (July, 2010).
Jagtiani, Julapa, George Kaufman, and Catharine Lemieux, (2002), "The Effect of Credit Risk on Bank and Bank Holding Company Bond Yields: Evidence from the Post-FDICIA Period," Journal of Financial Research 25, 559-575.
Jagtiani, Julapa, and Catherine Lemieux, (2001), “Market Discipline Prior to Bank Failure," Journal of Economics and Business 53, 313-324.
Jacewitz, Stefan and Jonathan Pogach, (2013), “Deposit Rate Advantages at the Largest Banks,” FDIC working paper, May 31.
Kacperczyk, Marcin, and Philipp Schnabl, (2011), “Implicit Guarantees and Risk Taking: Evidence from Money Market Funds,.” NBER working paper.
Kane, Edward J., (2000), “Incentives for Banking Megamergers: What Motives might Regulators Infer from Event-Study Evidence?,” Journal of Money, Credit and Banking 32, 671-701.
Keeley, Michael, (1990), “Deposit Insurance, Risk, and Market Power in Banking,” American Economic Review 80, 1183-1200.
Kelly, Bryan, Hanno Lustig, and Stijn Van Nieuwerburgh, (2012), “Too-Systemic-To-Fail: What Option Markets Imply About Sector-wide Government Guarantees,” working paper.
38

Kroszner, Randall and Philip Strahan, (1999), "What Drives Deregulation? Economics and Politics of the Relaxation of Bank Branching Restrictions in the United States," Quarterly Journal of Economics, November, 1437-67.
Laeven, Luc, and Ross Levine, (2007), “Is There a Diversification Discount in Financial Conglomerates?,” Journal of Financial Economics 85, 331-367.
Laeven, Luc, and Fabian Valencia, (2010), “Resolution of Banking Crises: the Good, the Bad, and the Ugly,” IMF Working Paper No. 146.
Levonian, Mark, (2000), “Subordinated Debt and Quality of Market Discipline in Banking,” Federal Reserve Bank of San Francisco.
McAllister, Patrick H., and Douglas McManus, (1993), “Resolving the Scale Efficiency Puzzle in Banking,” Journal of Banking and Finance 17, 389-406.
Merton, Robert C., (1974), “On the Pricing of Corporate Debt: The Risk Structure of Interest Rates,” The Journal of Finance 29, 449-470.
Merton, Robert C., (1977), “On the Pricing of Contingent Claims and the Modigliani-Miller Theorem,” Journal of Financial Economics 15, 241-250.
Molyneux, Phil, Klaus Schaeck, and Tim Zhou, (2010), “‘Too-Big-to-Fail’ and its Impact on Safety Net Subsidies and Systemic Risk,” Working Paper, Bangor Business School.
Morgan, Donald P., and Kevin J. Stiroh, (2000), “Bond Market Discipline of Banks," Federal Reserve Bank of Chicago Proceedings, 494-526.
Morgan, Donald P., and Kevin J. Stiroh, (2001), “Market Discipline of Banks: The Asset Test,” Journal of Financial Services Research 20, 195-208.
Morgan, Donald P., and Kevin J. Stiroh, (2005), “Too Big To Fail After All These Years,” Federal Reserve Bank of New York Staff Report No. 220.
Noss, Joseph and Rhiannon Sowerbutts, (2012), “The Implicit Subsidy of Banks,” Bank of England Working paper.
O’Hara, Maureen, and Wayne Shaw, (1990), “Deposit Insurance and Wealth Effects: The Value of Being ‘Too Big To Fail’,” Journal of Finance 45, 1587-600.
Raddatz, Claudio, (2010), "When the Rivers Run Dry: Liquidity and the Use of Wholesale Funds in the Transmission of the U.S. Subprime Crisis," World Bank Policy Research Paper 5203.
39
Rime, Bertrand, (2005), “Do ‘Too Big To Fail’ Expectations Boost Large Banks Issuer Ratings?,” Swiss National Bank.
Roy, Arthur D., (1952), “Safety First and the Holding of Assets,” Econometrica 20, 431-449.
Schaefer, Alexander, Isabel Schnabel, and Beatrice Weder di Mauro, (2013), “Financial Sector Reform After the Crisis: Has Anything Happened?” working paper.
Schweikhard, Frederic and Zoe Tsesmelidakis, (2012), “The Impact of Government Interventions on CDS and Equity Markets,” University of Oxford Working Paper.
Schich, Sebastian and Byoung-Hwan Kim, (2012), “Developments in the Value of Implicit Guarantees for Bank Debt: The Role of Resolution Regimes and Practices,” OECD Journal: Financial Market Trends, no. 2.
Sironi, Andrea, (2003), “Testing for Market Discipline in the European Banking Industry: Evidence from Subordinated Debt Issues,” Journal of Money, Credit and Banking 35, 443-472.
Skeel, David, (2011), The New Financial Deal: Understanding the Dodd-Frank Act and Its (Unintended) Consequences (Hoboken, N.J.: John Wiley).
Soussa, Farouk, (2000), “Too Big to Fail: Moral Hazard and Unfair Competition?,” in Financial Stability and Central Banks: Selected Issues for Financial Safety Nets and Market Discipline (London: Bank of England).
Standard & Poor’s, (2011), “The U.S. Government Says Support for Banks Will Be Different ‘Next Time’ – But Will It?,” (July 12, 2011).
Stern, Gary H., and Ron J. Feldman, (2004), Too Big to Fail: The Hazards of Bank Bailouts (Washington, D.C.: Brookings Institution Press).
Stiroh, Kevin J., (2000), “How Did Bank Holding Companies Prosper in the 1990s?,” Journal of Banking and Finance 24, 1703-45.
Strahan, Philip, (forthcoming), “Too Big To Fail: Causes, Consequences, and Policy Responses,” Annual Review of Financial Economics.
Strongin, Steve, Amanda Hindlian, Sandra Lawson, Jorge Murillo, Koby Sadan, and Balakrishna Subramanian, (2013), “Measuring the TBTF Effect on Bond Pricing,” working paper, May.
Tarullo, Daniel, (2013), “Evaluating Progress in Regulatory Reforms to Promote Financial Stability,” May 3.
40
Tsesmelidakis, Zoe and Robert Merton, (2012), “The Value of Implicit Guarantees,” working paper.
Ueda, Kenichi, and Beatrice Weder di Mauro, (2011), “Quantifying the Value of the Subsidy for Systemically Important Financial Institutions,” Working Paper.
United States Department of Treasury, (2013), “The Financial Crisis Five Years Later: Response, Reform, and Progress,” September.
Veronesi, Peitro, and Luigi Zingales, (2010), “Paulson’s Gift,” Journal of Financial Economics 97, 339-368.
Wheelock, David C., and Paul W. Wilson, (2001), “New Evidence on Returns to Scale and Product Mix among U.S. Commercial Banks,” Journal of Monetary Economics 47, 653–674.
Wheelock, David C., and Paul W. Wilson, (2012), “Do Large Banks have Lower Costs? New Estimates of Returns to Scale for U.S. Banks,” Journal of Money, Credit and Banking 44, 171-199.
41
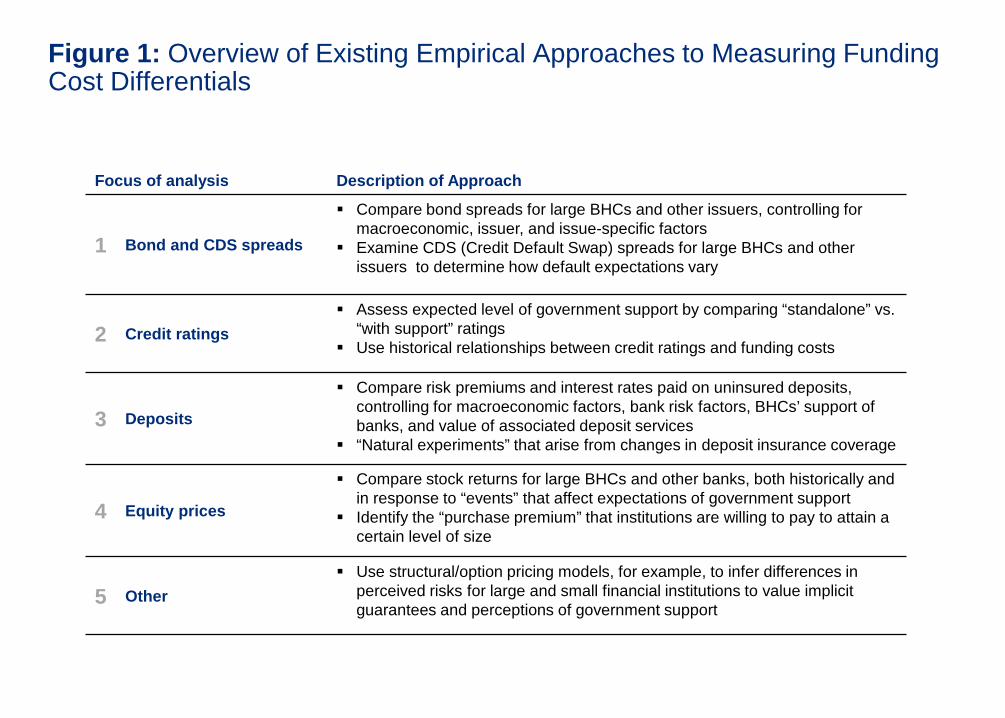
Figure 1: Overview of Existing Empirical Approaches to Measuring Funding Cost Differentials
Focus of analysis Description of Approach
1 Bond and CDS spreads
Compare bond spreads for large BHCs and other issuers, controlling for macroeconomic, issuer, and issue-specific factors
Examine CDS (Credit Default Swap) spreads for large BHCs and other issuers to determine how default expectations vary
2 Credit ratings Assess expected level of government support by comparing “standalone” vs.
“with support” ratings Use historical relationships between credit ratings and funding costs
3 Deposits
Compare risk premiums and interest rates paid on uninsured deposits, controlling for macroeconomic factors, bank risk factors, BHCs’ support of banks, and value of associated deposit services
“Natural experiments” that arise from changes in deposit insurance coverage
4 Equity prices
Compare stock returns for large BHCs and other banks, both historically and in response to “events” that affect expectations of government support
Identify the “purchase premium” that institutions are willing to pay to attain a certain level of size
5 Other Use structural/option pricing models, for example, to infer differences in
perceived risks for large and small financial institutions to value implicit guarantees and perceptions of government support
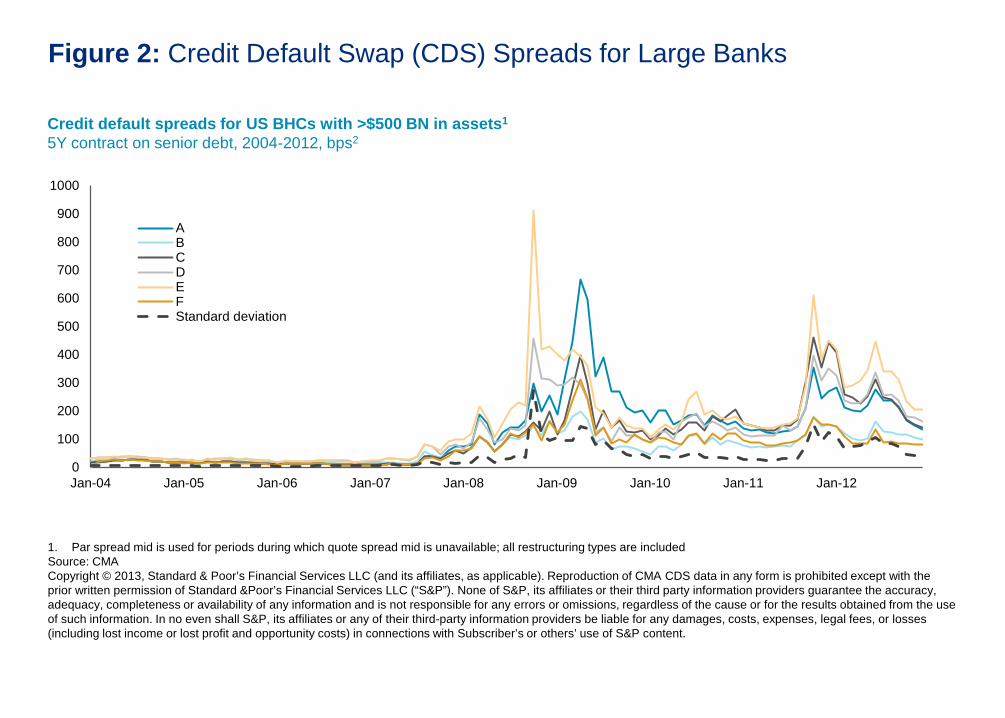
0
100
200
300
400
500
600
700
800
900
1000
Jan-04 Jan-05 Jan-06 Jan-07 Jan-08 Jan-09 Jan-10 Jan-11 Jan-12
ABCDEFStandard deviation
Credit default spreads for US BHCs with >$500 BN in assets1
5Y contract on senior debt, 2004-2012, bps2
1. Par spread mid is used for periods during which quote spread mid is unavailable; all restructuring types are included Source: CMA Copyright © 2013, Standard & Poor’s Financial Services LLC (and its affiliates, as applicable). Reproduction of CMA CDS data in any form is prohibited except with the prior written permission of Standard &Poor’s Financial Services LLC (“S&P”). None of S&P, its affiliates or their third party information providers guarantee the accuracy, adequacy, completeness or availability of any information and is not responsible for any errors or omissions, regardless of the cause or for the results obtained from the use of such information. In no even shall S&P, its affiliates or any of their third-party information providers be liable for any damages, costs, expenses, legal fees, or losses (including lost income or lost profit and opportunity costs) in connections with Subscriber’s or others’ use of S&P content.
Figure 2: Credit Default Swap (CDS) Spreads for Large Banks

>$50 BN in assets
>$100 BN in assets
CCAR participants
GSIBs
1. Based on 2013Q1 assets or current regulatory designation. Excludes foreign owned-banks that surpass the relevant size thresholds: BancWest, BBVA USA, Deutsche Bank Trust, HSBC NA, RBS Citizens, Santandar Holdings, TD Bank, UnionBanCal.
** KeyCorp designated as CCAR participant; however assets are <$100BN as of 2013Q1 Source: Public filings
Figure 3: Largest US Banking and Financial Holding Companies
• Bank of America • Citigroup • JP Morgan Chase • Wells Fargo
• Goldman Sachs
• Morgan Stanley
• Bank of New York Mellon
• State Street
• Ally Financial • American Express • BB&T Corp • Capital One • Fifth Third • KeyCorp** • PNC Financial Services • Regions Financial Corp. • SunTrust Banks • U.S. Bancorp
• Charles Schwab • Principal Financial
Group • United Services
Automobile Association
>$1 TN assets
>$500 BN assets • Comerica Inc. • Discover Financial
Services • Huntington Bancshares • M&T Bank Corp. • Northern Trust • Zions Bancorporation
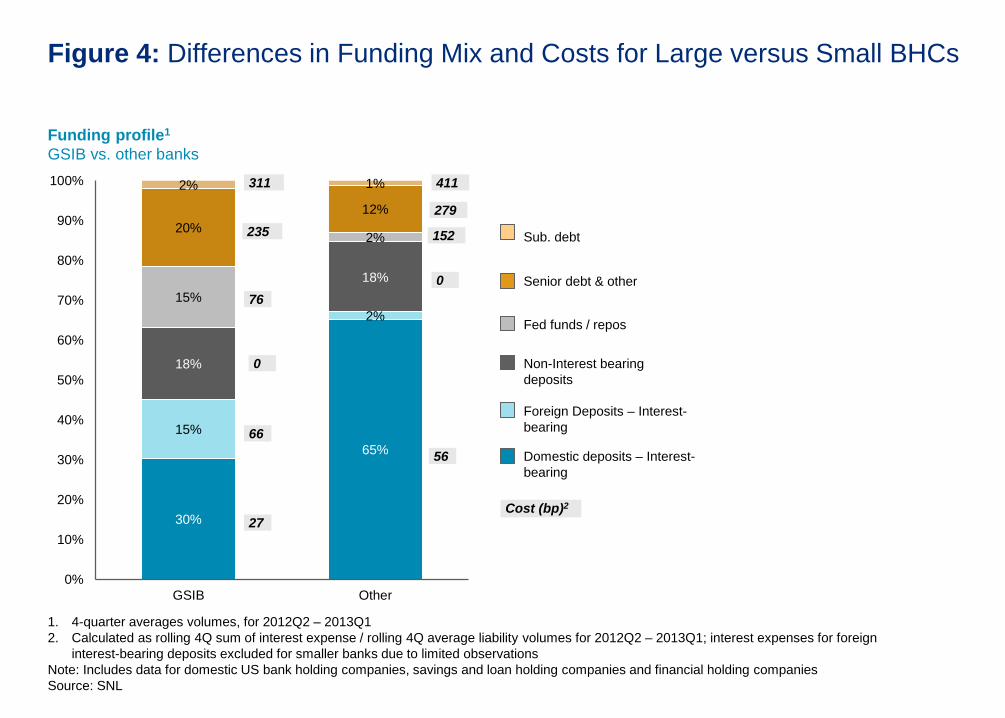
Figure 4: Differences in Funding Mix and Costs for Large versus Small BHCs
30%
65% 15%
2%
18%
18% 15%
2% 20%
12%
2% 1%
0%
10%
20%
30%
40%
50%
60%
70%
80%
90%
100%
GSIB Other
Domestic deposits – Interest-bearing
Foreign Deposits – Interest-bearing
Non-Interest bearing deposits
Fed funds / repos
Senior debt & other
Sub. debt
Funding profile1 GSIB vs. other banks
27
56
76
66
152 235 279
311 411
Cost (bp)2
1. 4-quarter averages volumes, for 2012Q2 – 2013Q1 2. Calculated as rolling 4Q sum of interest expense / rolling 4Q average liability volumes for 2012Q2 – 2013Q1; interest expenses for foreign
interest-bearing deposits excluded for smaller banks due to limited observations Note: Includes data for domestic US bank holding companies, savings and loan holding companies and financial holding companies Source: SNL
0
0
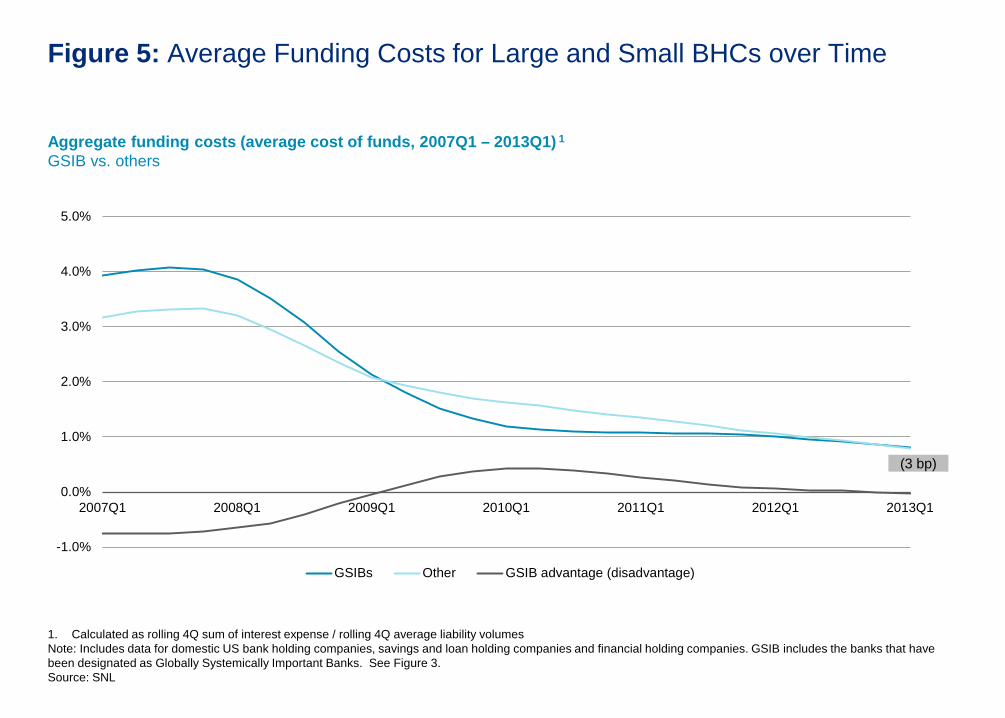
Figure 5: Average Funding Costs for Large and Small BHCs over Time
-1.0%
0.0%
1.0%
2.0%
3.0%
4.0%
5.0%
2007Q1 2008Q1 2009Q1 2010Q1 2011Q1 2012Q1 2013Q1
GSIBs Other GSIB advantage (disadvantage)
Aggregate funding costs (average cost of funds, 2007Q1 – 2013Q1) 1 GSIB vs. others
(3 bp)
1. Calculated as rolling 4Q sum of interest expense / rolling 4Q average liability volumes Note: Includes data for domestic US bank holding companies, savings and loan holding companies and financial holding companies. GSIB includes the banks that have been designated as Globally Systemically Important Banks. See Figure 3. Source: SNL
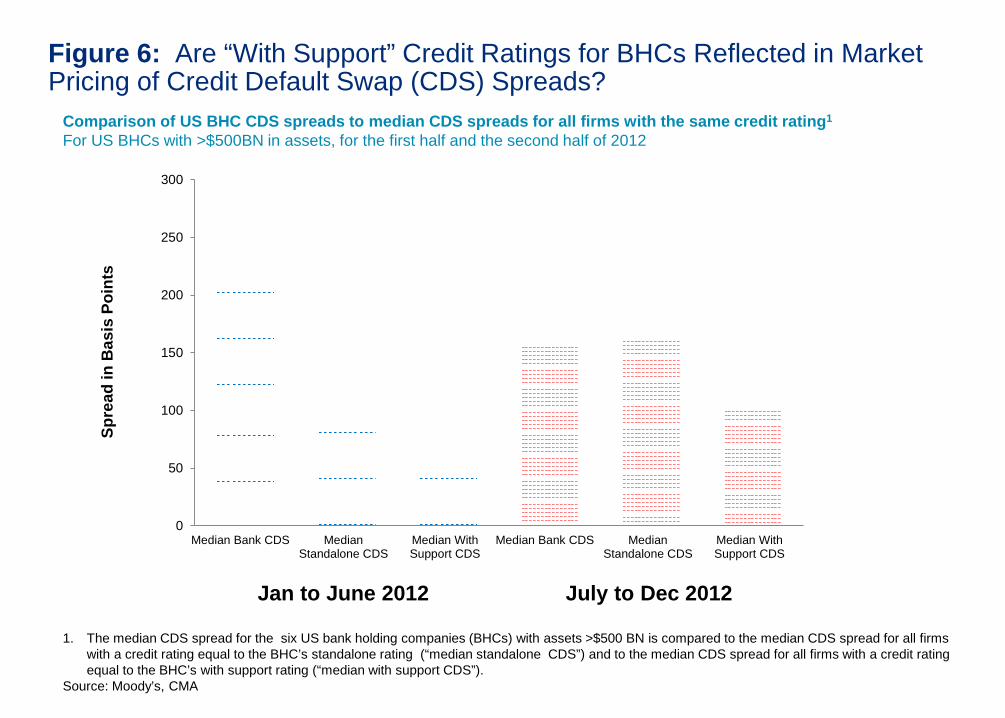
Figure 6: Are “With Support” Credit Ratings for BHCs Reflected in Market Pricing of Credit Default Swap (CDS) Spreads?
Comparison of US BHC CDS spreads to median CDS spreads for all firms with the same credit rating1 For US BHCs with >$500BN in assets, for the first half and the second half of 2012
1. The median CDS spread for the six US bank holding companies (BHCs) with assets >$500 BN is compared to the median CDS spread for all firms with a credit rating equal to the BHC’s standalone rating (“median standalone CDS”) and to the median CDS spread for all firms with a credit rating equal to the BHC’s with support rating (“median with support CDS”).
Source: Moody’s, CMA
Spre
ad in
Bas
is P
oint
s
Jan to June 2012 July to Dec 2012
0
50
100
150
200
250
300
Median Bank CDS MedianStandalone CDS
Median WithSupport CDS
Median Bank CDS MedianStandalone CDS
Median WithSupport CDS
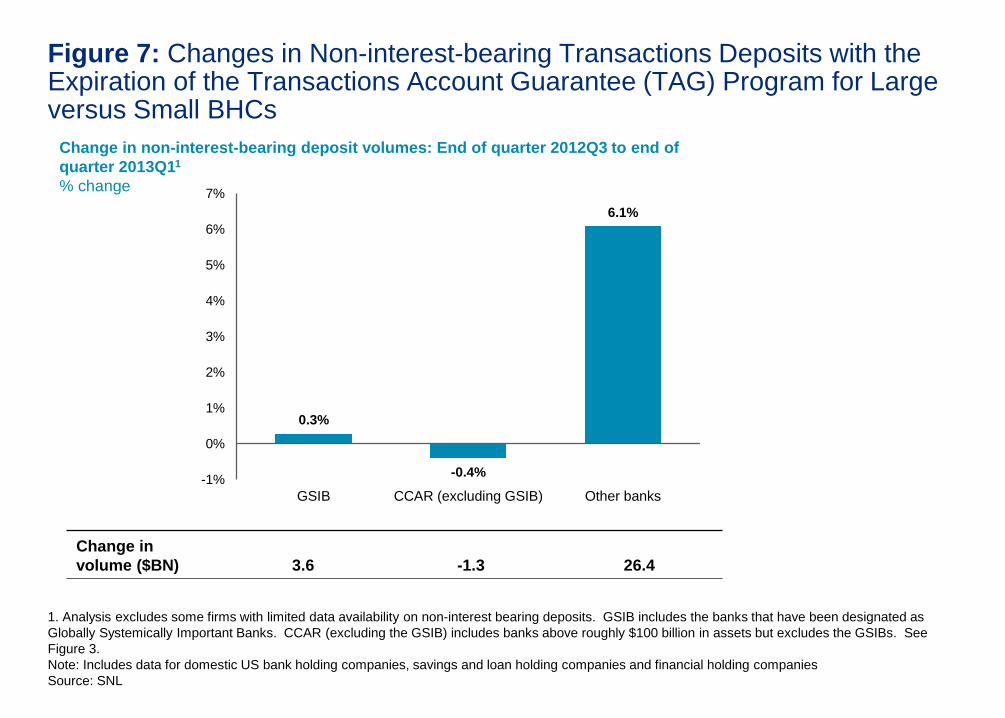
Figure 7: Changes in Non-interest-bearing Transactions Deposits with the Expiration of the Transactions Account Guarantee (TAG) Program for Large versus Small BHCs
Change in non-interest-bearing deposit volumes: End of quarter 2012Q3 to end of quarter 2013Q11 % change
0.3%
-0.4%
6.1%
-1%
0%
1%
2%
3%
4%
5%
6%
7%
GSIB CCAR (excluding GSIB) Other banks
Change in volume ($BN) 3.6 -1.3 26.4
1. Analysis excludes some firms with limited data availability on non-interest bearing deposits. GSIB includes the banks that have been designated as Globally Systemically Important Banks. CCAR (excluding the GSIB) includes banks above roughly $100 billion in assets but excludes the GSIBs. See Figure 3. Note: Includes data for domestic US bank holding companies, savings and loan holding companies and financial holding companies Source: SNL
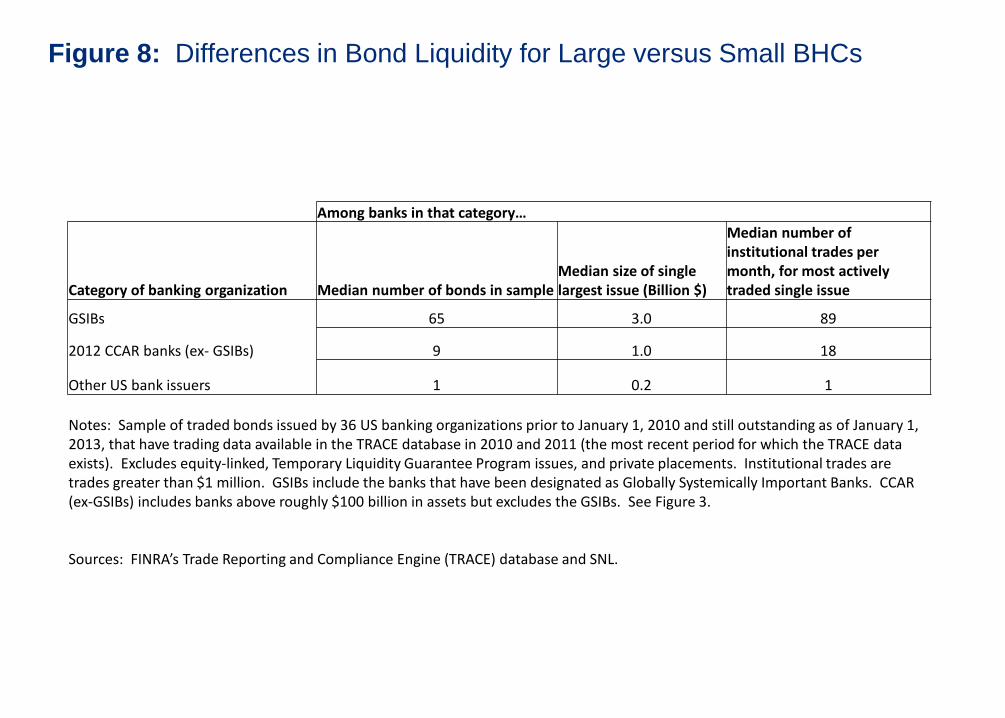
Figure 8: Differences in Bond Liquidity for Large versus Small BHCs
Among banks in that category…
Category of banking organization Median number of bonds in sample Median size of single largest issue (Billion $)
Median number of institutional trades per month, for most actively traded single issue
GSIBs 65 3.0 89
2012 CCAR banks (ex- GSIBs) 9 1.0 18
Other US bank issuers 1 0.2 1
Notes: Sample of traded bonds issued by 36 US banking organizations prior to January 1, 2010 and still outstanding as of January 1, 2013, that have trading data available in the TRACE database in 2010 and 2011 (the most recent period for which the TRACE data exists). Excludes equity-linked, Temporary Liquidity Guarantee Program issues, and private placements. Institutional trades are trades greater than $1 million. GSIBs include the banks that have been designated as Globally Systemically Important Banks. CCAR (ex-GSIBs) includes banks above roughly $100 billion in assets but excludes the GSIBs. See Figure 3. Sources: FINRA’s Trade Reporting and Compliance Engine (TRACE) database and SNL.