Embed Size (px)
Citation preview

The Stevenage Borough Local Plan ScopingReport

3Abbreviations
61 Introduction
122 Approach to the SEA
183 Presenting the SEA scoping information
244 Biodiversity, flora and fauna
365 Population and human health
446 Water and soils
587 Air Quality
628 Climatic factors
689 Material assets
7210 Cultural heritage
7811 Landscape
8812 Social Inclusiveness
10013 Economic Development
10814 Developing SEA/SA Objectives
11415 Next stages
iiAppendix 1
The Stevenage Borough Local Plan Scoping Report
Contents
The Stevenage Borough Local Plan Scoping Report
Contents
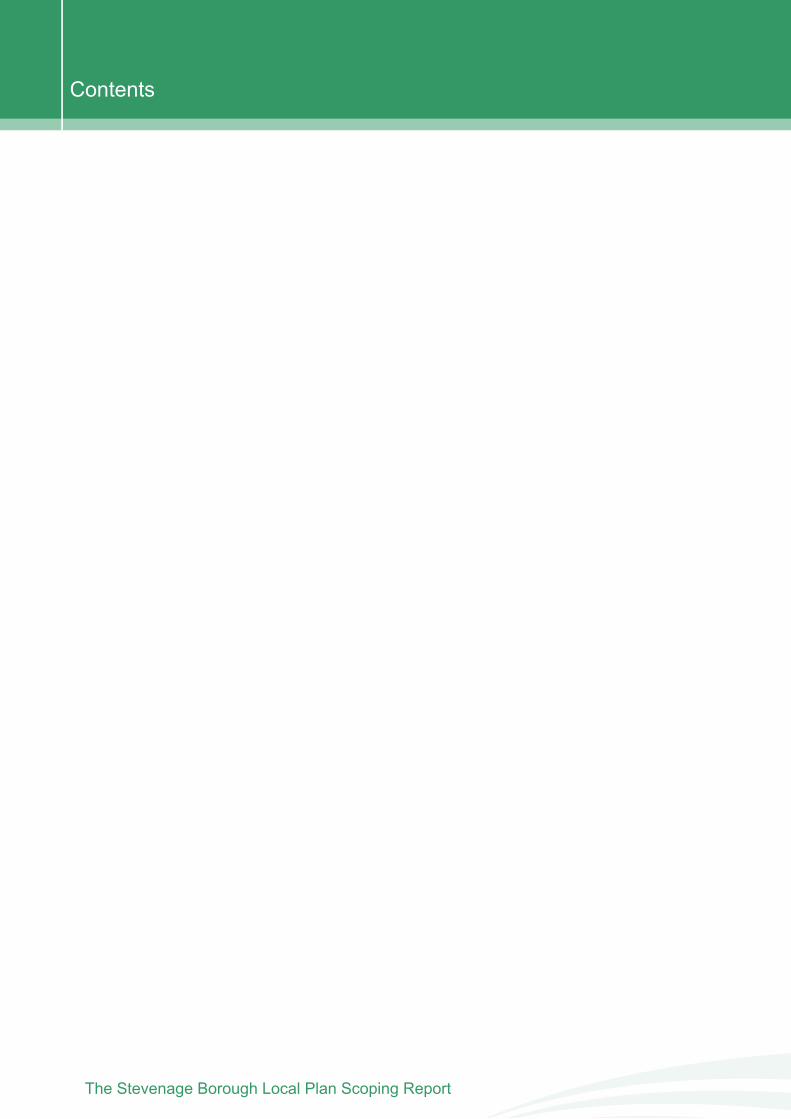
AbbreviationsLocal Development DocumentsLDDArchaeological Alert AreaAAALocal Planning AuthorityLPAAgricultural Land ClassificationALCNational Vocational QualificationNVQArea of Outstanding Natural BeautyAONBOffice for National StatisticsONSBiodiversity Action PlanBAPRegionally Important Geological SiteRIGSCatchment Flood Management PlanCFMPRoyal Society for the Protection of BirdsRSPBCountryside and Rights of WayCROWSustainability AppraisalSADepartment of Energy and Climate
ChangeDECC
Special Area of ConservationSACDepartment for Environment, Food andRural Affairs
DEFRA
Stevenage Borough CouncilSBCDevelopment Plan DocumentsDPDStrategic Environmental AssessmentSEAEnvironment AgencyEASuper Output AreaSOAEuropean UnionEUSpecial Protection AreaSPAGeographic Information SystemGISSite of Special Scientific InterestSSSIHabitat Action PlanHAPSustainable Urban Drainage SystemsSUDsHertfordshire County CouncilHCCThree Valleys WaterTVWHabitats Regulation AssessmentHRA
Index of Multiple DeprivationIMD
3The Stevenage Borough Local Plan Scoping Report
Abbreviations
The Stevenage Borough Local Plan Scoping Report4
Abbreviations

1 . IntroductionThe Stevenage Borough Local Plan Scoping Report
1 IntroductionStrategic Environmental Assessment (SEA)
1.1 Strategic Environmental Assessment (SEA) is a systematic process for evaluating theenvironmental consequences of proposed plans or programmes to ensure environmental issuesare fully integrated and addressed at the earliest appropriate stage of decision making.
1.2 SEAwas introduced to the UK through the EUDirective 2001/42/EC. In England, this Directivehas been transposed via the Environmental Assessment of Plans and Programmes Regulations2004. The Stevenage Local Plan has been screened as a plan that requires an SEA under theDirective.
1.3 This report comprises the first stage of SEA of the emerging local plan.
Sustainability Appraisal (SA)
1.4 Sustainability appraisal (SA) is a process undertaken during the preparation of a plan orstrategy. Its role is to assess whether emerging policies and proposals will achieve the identifiedrelevant environmental, social and economic objectives.
1.5 Under the Planning and Compulsory Purchase Act 2004, SA is mandatory for all DevelopmentPlan Documents (DPD).
1.6 This report comprises the first stage of SA of the emerging local plan.
Combining SEA and SA
1.7 The requirements of undertaking an SEA and SA are distinct. The objectives of an SEAfocus on environmental effects, whereas an SA is concerned with the full range of environmental,social and economic matters.
1.8 It is possible to undertake the two assessments together through a single appraisal process.Government guidance encourages the two appraisals to be undertaken together.
1.9 This scoping report has been written to meet the requirements of the SEA Directive.Government guidance identifies the following key areas to ensure that both SEA and SArequirements are met:
Collecting and presenting baseline information;Predicting the significant effects of the plan and addressing them during its preparation;Identifying reasonable plan options and their effects;Involving the public and authorities with social, environmental and economic responsibilitiesas part of the assessment process;Monitoring the actual effects of the plan during its implementation.
The Stevenage Borough Local Plan Scoping Report6
Introduction
1.10 This scoping report (and the reports that will accompany it) uses an approach that addressesthe requirements of both SEA and SA. It gives consideration to environmental issues whilst alsoaddressing the range of socio-economic concerns.
Habitats Regulation Assessment (HRA)
1.11 Section 102 of the Conservation of Habitats and Species Regulations (2010) requires aHabitats Regulations Appraisal to be undertaken during the preparation of a local plan, if necessary.
1.12 The purpose of HRA is to assess the implications of a land use plan for European sites, inview of the sites' conservation objectives. Such sites are defined in Regulation 10 of the HabitatsRegulations as Special Areas of Conservation (SACs) and Special Protection Areas (SPAs).Ramsar sites are also considered within HRA as a matter of policy. HRA should ascertain whetherthe plan, on its own or in combination with other plans, is likely to adversely affect a site's integrity.If this is the case, or the Council is unable to ascertain that fact, it must examine alternative solutionswhich better respect the integrity of the site.
1.13 Stevenage's Local Plan may affect the Lee Valley SPA.We have identified this SPA becausemost of the sewage from Stevenage is treated near to the site.
1.14 A HRA process is being carried out for the local plan. Whilst the HRA will support thefindings of the SEA, the HRA will be carried out independently of the SEA process and will bereported on separately.
Purpose of this report
1.15 This Scoping Report has been prepared as part of the Strategic Environmental Assessment(SEA) of the Stevenage Local Plan for Stevenage Borough Council. The report has been publishedfor consultation with the consultation bodies(1) as required by Regulation 12 (5) of the UK SEARegulations 2004.
1.16 Scoping is the process of deciding the scope and level of detail of an SEA, including therelevant background and environmental issues, the assessment methods to be used, and thestructure and contents of the Environmental Report. Documenting this process, this report setsout the scope of, and methodology for the SEA of the Stevenage Local Plan and summarises thetasks and outcomes of the first stage of the SEA/SA process.
1.17 This stage of the process falls in line with the pre-production stage of the local plan process.This forms part of the evidence gathering process for the local plan.
The Stevenage Local Plan
1.18 Stevenage Borough Council, as the local planning authority, is currently preparing a newlocal plan for Stevenage. This will replace the Stevenage District Plan 2nd Review, adopted in2004, and the Interim Planning Statement, adopted in 2012.
1 Natural England, English Heritage and the Environment Agency.
7The Stevenage Borough Local Plan Scoping Report
Introduction
1.19 This is a preliminary stage for the local plan and as such it is anticipated that this ScopingReport will outline the current issues within the Borough. Future stages of the SEA/SA processwill determine how the emerging objectives of the local plan will co-relate to the sustainabilityobjectives of emerging SEA/SA objectives.
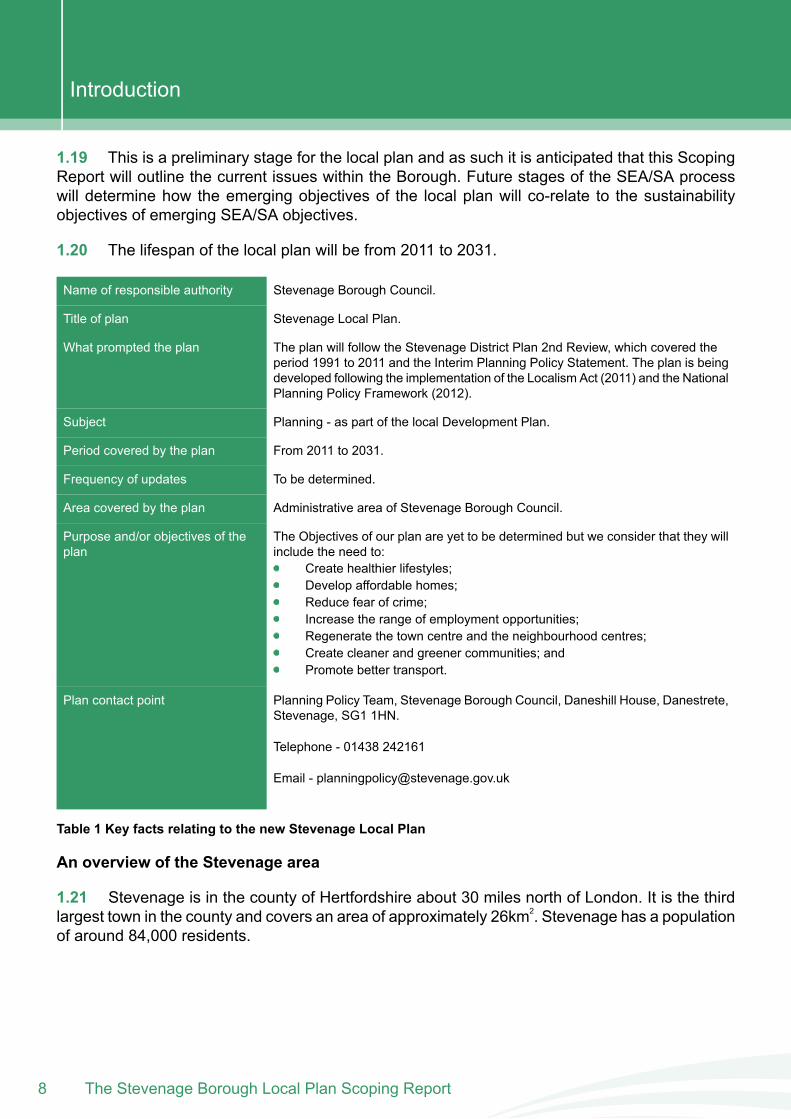
1.20 The lifespan of the local plan will be from 2011 to 2031.
Stevenage Borough Council.Name of responsible authority
Stevenage Local Plan.Title of plan
The plan will follow the Stevenage District Plan 2nd Review, which covered theperiod 1991 to 2011 and the Interim Planning Policy Statement. The plan is being
What prompted the plan
developed following the implementation of the Localism Act (2011) and the NationalPlanning Policy Framework (2012).
Planning - as part of the local Development Plan.Subject
From 2011 to 2031.Period covered by the plan
To be determined.Frequency of updates
Administrative area of Stevenage Borough Council.Area covered by the plan
The Objectives of our plan are yet to be determined but we consider that they willinclude the need to:
Purpose and/or objectives of theplan
Create healthier lifestyles;Develop affordable homes;Reduce fear of crime;Increase the range of employment opportunities;Regenerate the town centre and the neighbourhood centres;Create cleaner and greener communities; andPromote better transport.
Planning Policy Team, Stevenage Borough Council, Daneshill House, Danestrete,Stevenage, SG1 1HN.
Plan contact point
Telephone - 01438 242161
Email - [email protected]
Table 1 Key facts relating to the new Stevenage Local Plan
An overview of the Stevenage area
1.21 Stevenage is in the county of Hertfordshire about 30 miles north of London. It is the thirdlargest town in the county and covers an area of approximately 26km2. Stevenage has a populationof around 84,000 residents.
The Stevenage Borough Local Plan Scoping Report8
Introduction
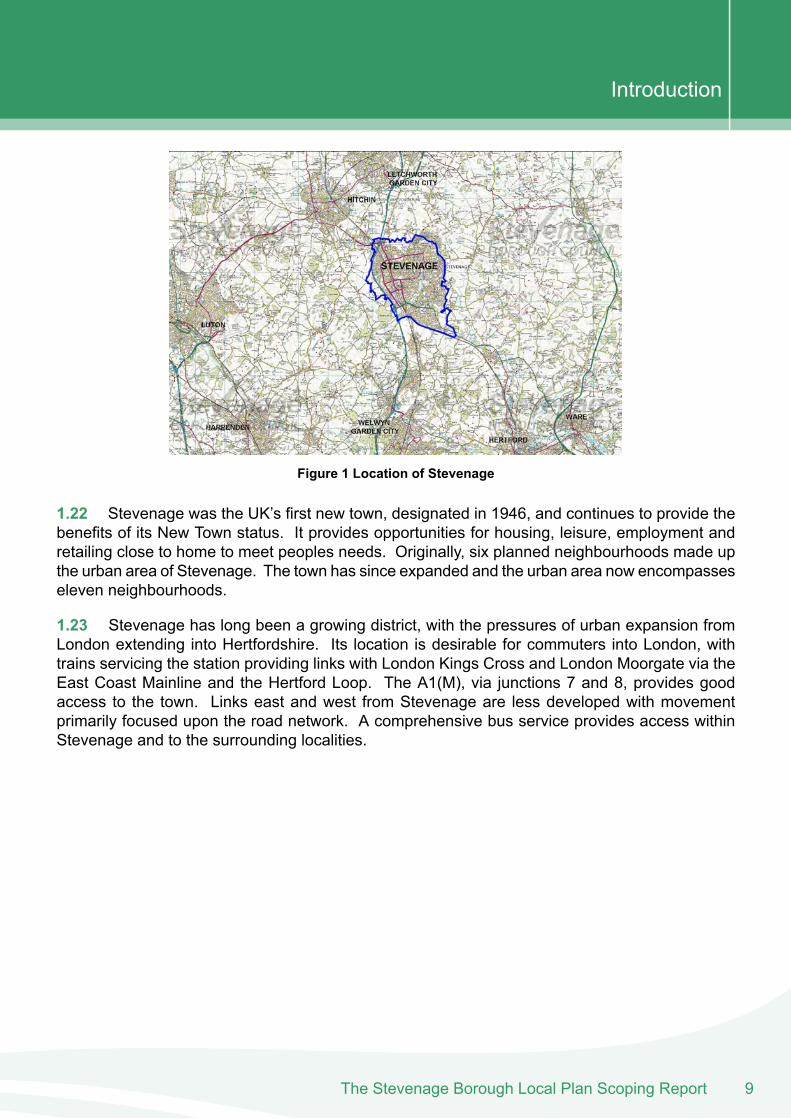
Figure 1 Location of Stevenage
1.22 Stevenage was the UK’s first new town, designated in 1946, and continues to provide thebenefits of its New Town status. It provides opportunities for housing, leisure, employment andretailing close to home to meet peoples needs. Originally, six planned neighbourhoods made upthe urban area of Stevenage. The town has since expanded and the urban area now encompasseseleven neighbourhoods.
1.23 Stevenage has long been a growing district, with the pressures of urban expansion fromLondon extending into Hertfordshire. Its location is desirable for commuters into London, withtrains servicing the station providing links with London Kings Cross and London Moorgate via theEast Coast Mainline and the Hertford Loop. The A1(M), via junctions 7 and 8, provides goodaccess to the town. Links east and west from Stevenage are less developed with movementprimarily focused upon the road network. A comprehensive bus service provides access withinStevenage and to the surrounding localities.
9The Stevenage Borough Local Plan Scoping Report
Introduction
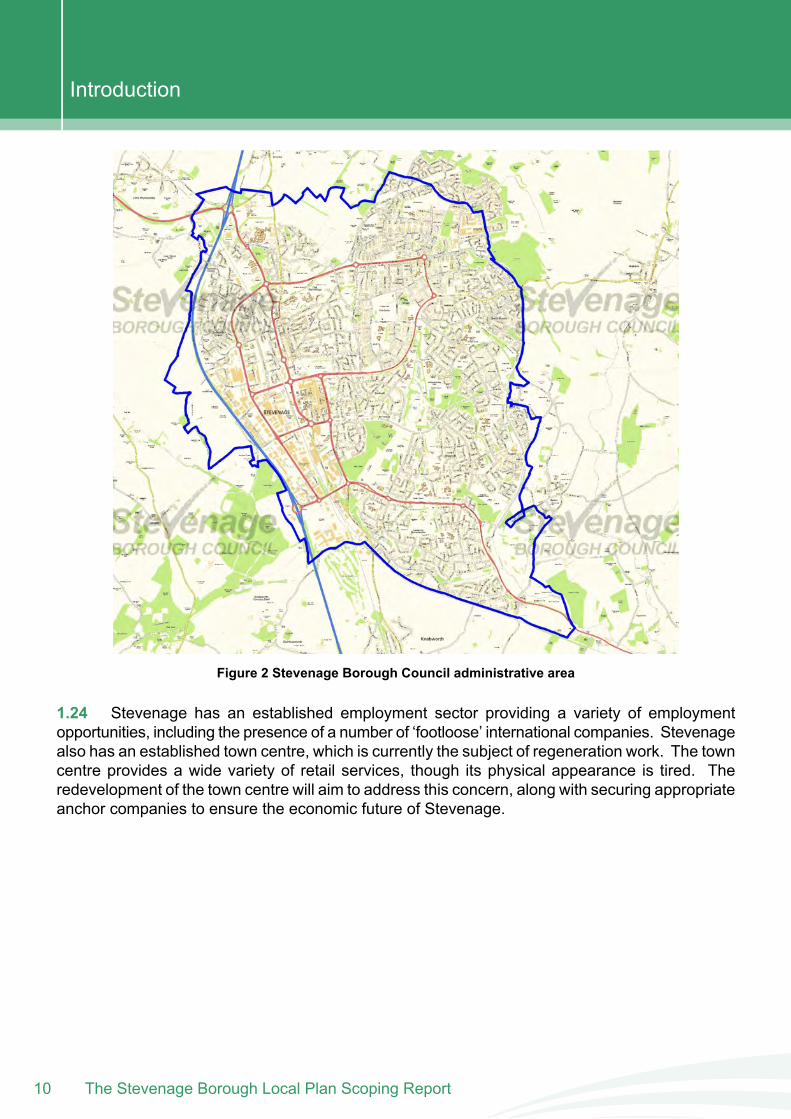
Figure 2 Stevenage Borough Council administrative area
1.24 Stevenage has an established employment sector providing a variety of employmentopportunities, including the presence of a number of ‘footloose’ international companies. Stevenagealso has an established town centre, which is currently the subject of regeneration work. The towncentre provides a wide variety of retail services, though its physical appearance is tired. Theredevelopment of the town centre will aim to address this concern, along with securing appropriateanchor companies to ensure the economic future of Stevenage.
The Stevenage Borough Local Plan Scoping Report10
Introduction

2 . Approach to the SEAThe Stevenage Borough Local Plan Scoping Report
2 Approach to the SEA2.1 The Council, statutory consultees, other environmental bodies will be engaged in the SEAprocess at different times.
2.2 This chapter sets out the broad approach to the SEA process, the stages involved, andhighlights where the relevant information can be found in this scoping report and future reports.
2.3 The approach for carrying out the SEA of the local plan is based on current best practice.Primarily the approach applied to this SEA process draws on guidance from:
Office of the Deputy Prime Minister (2005), A Practical Guide to the SEA Directive.
2.4 In terms of best practice and added value, the following guidance document has alsoinfluenced the approach to SEA/SA for the assessment of the Stevenage Local Plan:
Planning Advisory Service (2009), CLG Plan Making Manual: Sustainability Appraisal.
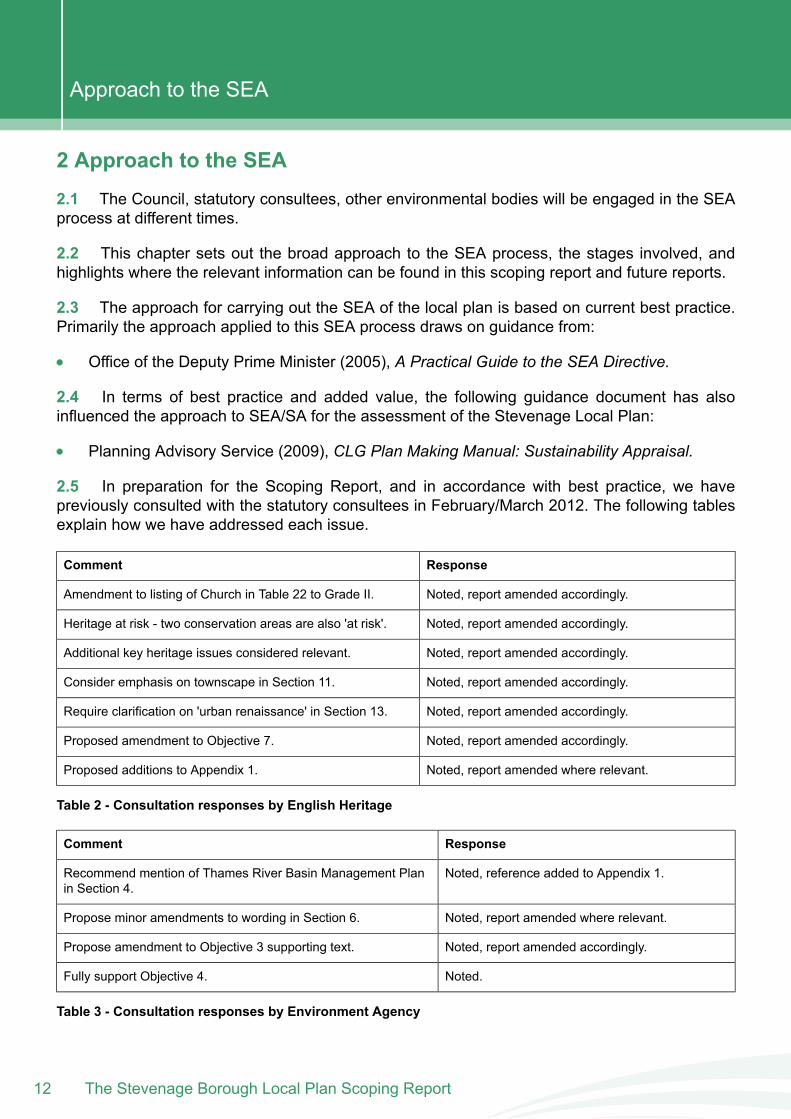
2.5 In preparation for the Scoping Report, and in accordance with best practice, we havepreviously consulted with the statutory consultees in February/March 2012. The following tablesexplain how we have addressed each issue.
ResponseComment
Noted, report amended accordingly.Amendment to listing of Church in Table 22 to Grade II.
Noted, report amended accordingly.Heritage at risk - two conservation areas are also 'at risk'.
Noted, report amended accordingly.Additional key heritage issues considered relevant.
Noted, report amended accordingly.Consider emphasis on townscape in Section 11.
Noted, report amended accordingly.Require clarification on 'urban renaissance' in Section 13.
Noted, report amended accordingly.Proposed amendment to Objective 7.
Noted, report amended where relevant.Proposed additions to Appendix 1.
Table 2 - Consultation responses by English Heritage
ResponseComment
Noted, reference added to Appendix 1.Recommend mention of Thames River Basin Management Planin Section 4.
Noted, report amended where relevant.Propose minor amendments to wording in Section 6.
Noted, report amended accordingly.Propose amendment to Objective 3 supporting text.
Noted.Fully support Objective 4.
Table 3 - Consultation responses by Environment Agency
The Stevenage Borough Local Plan Scoping Report12
Approach to the SEA
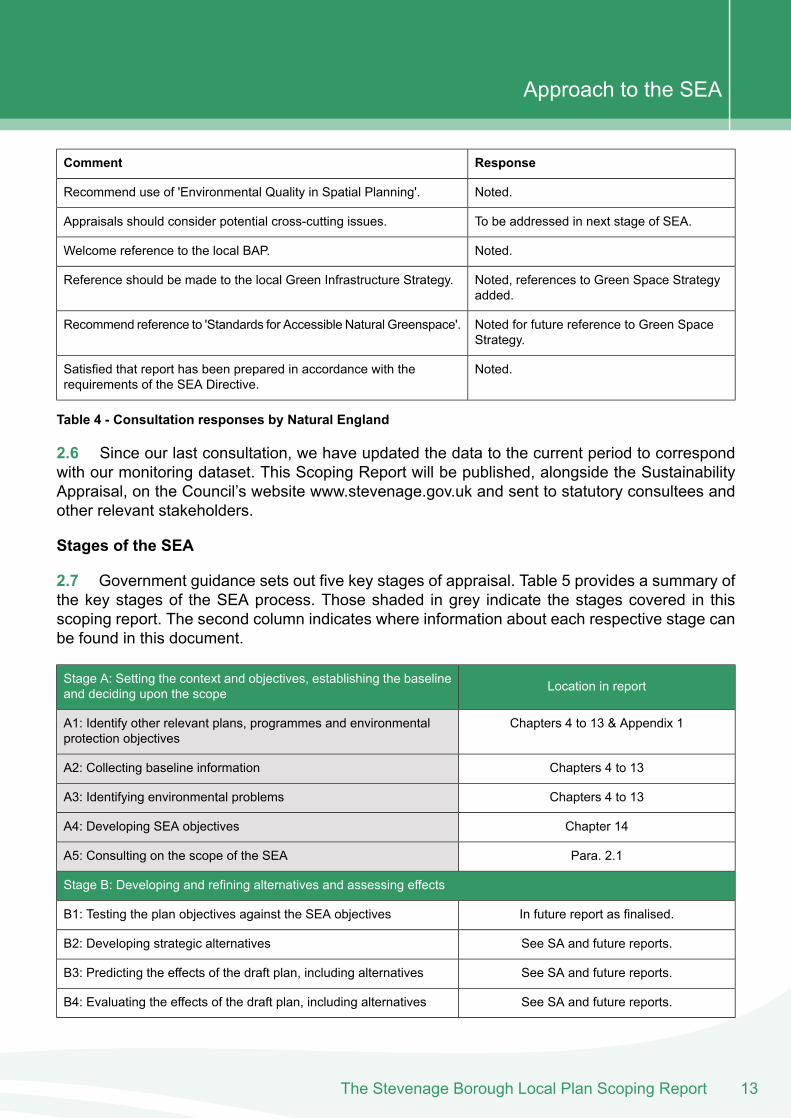
ResponseComment
Noted.Recommend use of 'Environmental Quality in Spatial Planning'.
To be addressed in next stage of SEA.Appraisals should consider potential cross-cutting issues.
Noted.Welcome reference to the local BAP.
Noted, references to Green Space Strategyadded.
Reference should be made to the local Green Infrastructure Strategy.
Noted for future reference to Green SpaceStrategy.
Recommend reference to 'Standards for Accessible Natural Greenspace'.
Noted.Satisfied that report has been prepared in accordance with therequirements of the SEA Directive.
Table 4 - Consultation responses by Natural England
2.6 Since our last consultation, we have updated the data to the current period to correspondwith our monitoring dataset. This Scoping Report will be published, alongside the SustainabilityAppraisal, on the Council’s website www.stevenage.gov.uk and sent to statutory consultees andother relevant stakeholders.
Stages of the SEA
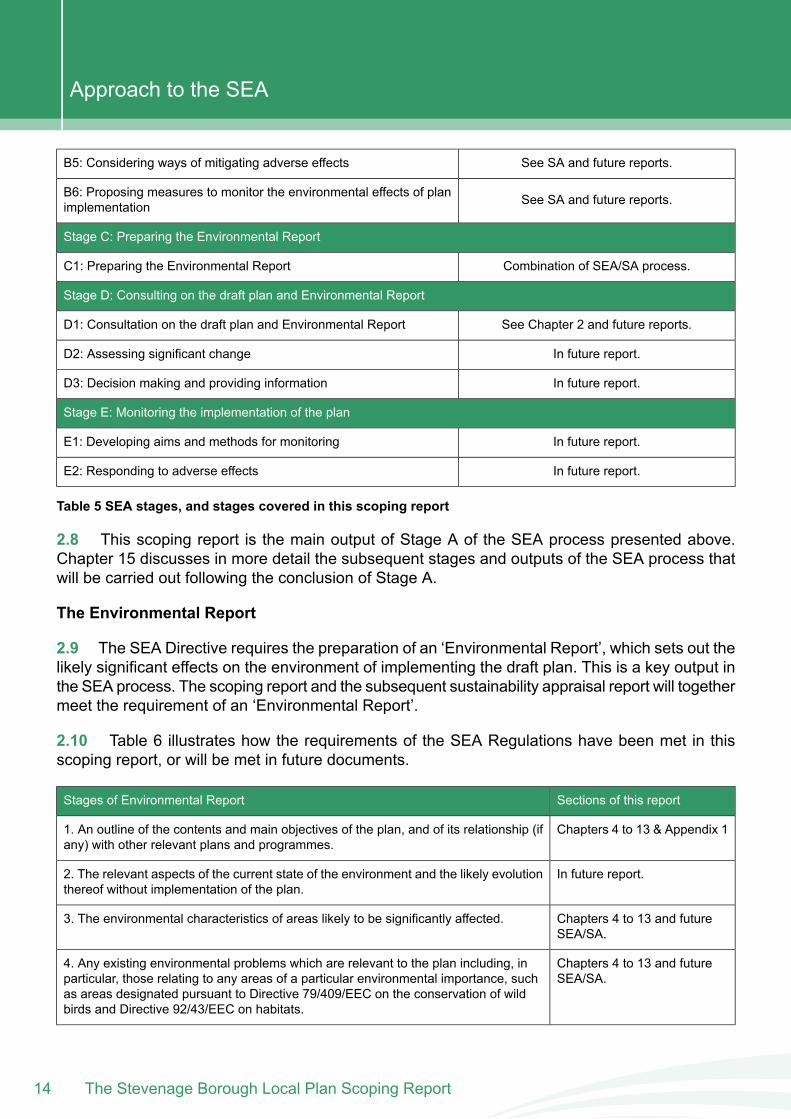
2.7 Government guidance sets out five key stages of appraisal. Table 5 provides a summary ofthe key stages of the SEA process. Those shaded in grey indicate the stages covered in thisscoping report. The second column indicates where information about each respective stage canbe found in this document.
Location in reportStage A: Setting the context and objectives, establishing the baselineand deciding upon the scope
Chapters 4 to 13 & Appendix 1A1: Identify other relevant plans, programmes and environmentalprotection objectives
Chapters 4 to 13A2: Collecting baseline information
Chapters 4 to 13A3: Identifying environmental problems
Chapter 14A4: Developing SEA objectives
Para. 2.1A5: Consulting on the scope of the SEA
Stage B: Developing and refining alternatives and assessing effects
In future report as finalised.B1: Testing the plan objectives against the SEA objectives
See SA and future reports.B2: Developing strategic alternatives
See SA and future reports.B3: Predicting the effects of the draft plan, including alternatives
See SA and future reports.B4: Evaluating the effects of the draft plan, including alternatives
13The Stevenage Borough Local Plan Scoping Report
Approach to the SEA
See SA and future reports.B5: Considering ways of mitigating adverse effects
See SA and future reports.B6: Proposing measures to monitor the environmental effects of planimplementation
Stage C: Preparing the Environmental Report
Combination of SEA/SA process.C1: Preparing the Environmental Report
Stage D: Consulting on the draft plan and Environmental Report
See Chapter 2 and future reports.D1: Consultation on the draft plan and Environmental Report
In future report.D2: Assessing significant change
In future report.D3: Decision making and providing information
Stage E: Monitoring the implementation of the plan
In future report.E1: Developing aims and methods for monitoring
In future report.E2: Responding to adverse effects
Table 5 SEA stages, and stages covered in this scoping report
2.8 This scoping report is the main output of Stage A of the SEA process presented above.Chapter 15 discusses in more detail the subsequent stages and outputs of the SEA process thatwill be carried out following the conclusion of Stage A.
The Environmental Report
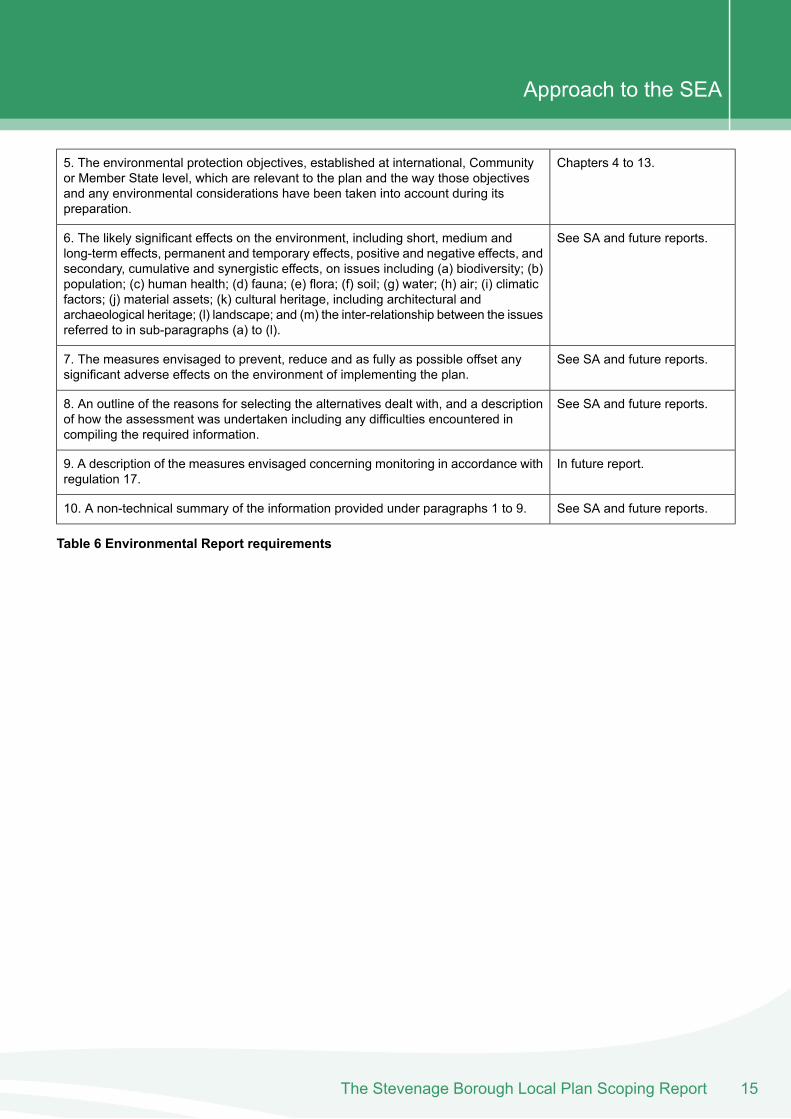
2.9 The SEA Directive requires the preparation of an ‘Environmental Report’, which sets out thelikely significant effects on the environment of implementing the draft plan. This is a key output inthe SEA process. The scoping report and the subsequent sustainability appraisal report will togethermeet the requirement of an ‘Environmental Report’.
2.10 Table 6 illustrates how the requirements of the SEA Regulations have been met in thisscoping report, or will be met in future documents.
Sections of this reportStages of Environmental Report
Chapters 4 to 13 & Appendix 11. An outline of the contents and main objectives of the plan, and of its relationship (ifany) with other relevant plans and programmes.
In future report.2. The relevant aspects of the current state of the environment and the likely evolutionthereof without implementation of the plan.
Chapters 4 to 13 and futureSEA/SA.
3. The environmental characteristics of areas likely to be significantly affected.
Chapters 4 to 13 and futureSEA/SA.
4. Any existing environmental problems which are relevant to the plan including, inparticular, those relating to any areas of a particular environmental importance, suchas areas designated pursuant to Directive 79/409/EEC on the conservation of wildbirds and Directive 92/43/EEC on habitats.
The Stevenage Borough Local Plan Scoping Report14
Approach to the SEA
Chapters 4 to 13.5. The environmental protection objectives, established at international, Communityor Member State level, which are relevant to the plan and the way those objectivesand any environmental considerations have been taken into account during itspreparation.
See SA and future reports.6. The likely significant effects on the environment, including short, medium andlong-term effects, permanent and temporary effects, positive and negative effects, andsecondary, cumulative and synergistic effects, on issues including (a) biodiversity; (b)population; (c) human health; (d) fauna; (e) flora; (f) soil; (g) water; (h) air; (i) climaticfactors; (j) material assets; (k) cultural heritage, including architectural andarchaeological heritage; (l) landscape; and (m) the inter-relationship between the issuesreferred to in sub-paragraphs (a) to (l).
See SA and future reports.7. The measures envisaged to prevent, reduce and as fully as possible offset anysignificant adverse effects on the environment of implementing the plan.
See SA and future reports.8. An outline of the reasons for selecting the alternatives dealt with, and a descriptionof how the assessment was undertaken including any difficulties encountered incompiling the required information.
In future report.9. A description of the measures envisaged concerning monitoring in accordance withregulation 17.
See SA and future reports.10. A non-technical summary of the information provided under paragraphs 1 to 9.
Table 6 Environmental Report requirements
15The Stevenage Borough Local Plan Scoping Report
Approach to the SEA
The Stevenage Borough Local Plan Scoping Report16
Approach to the SEA

3 . Presenting the SEA scoping informationThe Stevenage Borough Local Plan Scoping Report
3 Presenting the SEA scoping informationInformation themes
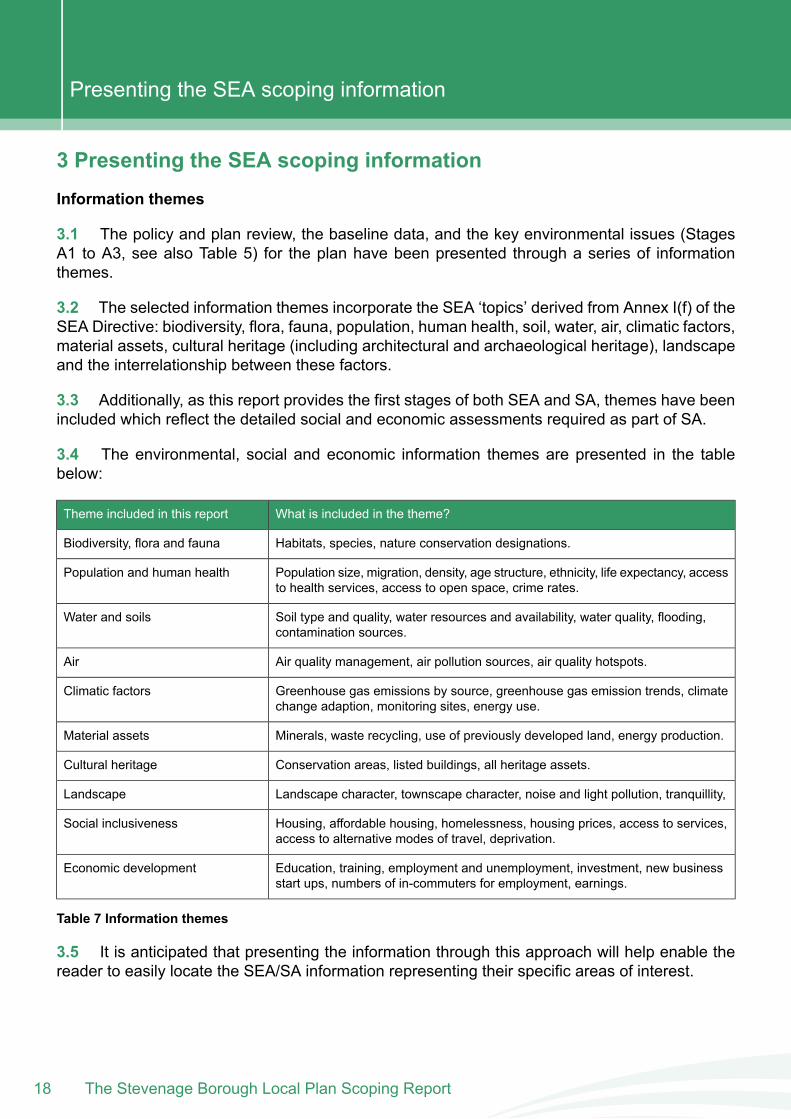
3.1 The policy and plan review, the baseline data, and the key environmental issues (StagesA1 to A3, see also Table 5) for the plan have been presented through a series of informationthemes.
3.2 The selected information themes incorporate the SEA ‘topics’ derived from Annex I(f) of theSEA Directive: biodiversity, flora, fauna, population, human health, soil, water, air, climatic factors,material assets, cultural heritage (including architectural and archaeological heritage), landscapeand the interrelationship between these factors.
3.3 Additionally, as this report provides the first stages of both SEA and SA, themes have beenincluded which reflect the detailed social and economic assessments required as part of SA.
3.4 The environmental, social and economic information themes are presented in the tablebelow:
What is included in the theme?Theme included in this report
Habitats, species, nature conservation designations.Biodiversity, flora and fauna
Population size, migration, density, age structure, ethnicity, life expectancy, accessto health services, access to open space, crime rates.
Population and human health
Soil type and quality, water resources and availability, water quality, flooding,contamination sources.
Water and soils
Air quality management, air pollution sources, air quality hotspots.Air
Greenhouse gas emissions by source, greenhouse gas emission trends, climatechange adaption, monitoring sites, energy use.
Climatic factors
Minerals, waste recycling, use of previously developed land, energy production.Material assets
Conservation areas, listed buildings, all heritage assets.Cultural heritage
Landscape character, townscape character, noise and light pollution, tranquillity,Landscape
Housing, affordable housing, homelessness, housing prices, access to services,access to alternative modes of travel, deprivation.
Social inclusiveness
Education, training, employment and unemployment, investment, new businessstart ups, numbers of in-commuters for employment, earnings.
Economic development
Table 7 Information themes
3.5 It is anticipated that presenting the information through this approach will help enable thereader to easily locate the SEA/SA information representing their specific areas of interest.
The Stevenage Borough Local Plan Scoping Report18
Presenting the SEA scoping information
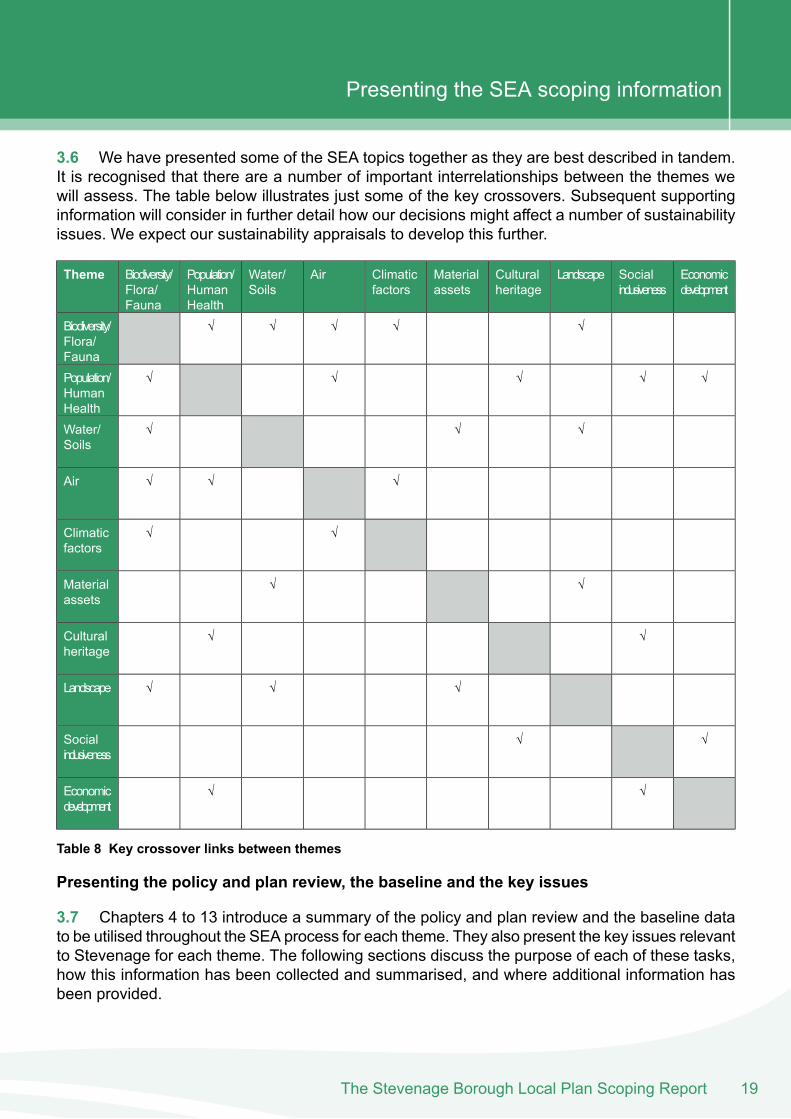
3.6 We have presented some of the SEA topics together as they are best described in tandem.It is recognised that there are a number of important interrelationships between the themes wewill assess. The table below illustrates just some of the key crossovers. Subsequent supportinginformation will consider in further detail how our decisions might affect a number of sustainabilityissues. We expect our sustainability appraisals to develop this further.
Economicdevelopment
Socialinclusiveness
LandscapeCulturalheritage
Materialassets
Climaticfactors
AirWater/Soils
Population/HumanHealth
Biodiversity/Flora/Fauna
Theme
√√√√√Biodiversity/Flora/Fauna
√√√√√Population/HumanHealth
√√√Water/Soils
√√√Air
√√Climaticfactors
√√Materialassets
√√Culturalheritage
√√√Landscape
√√Socialinclusiveness
√√Economicdevelopment
Table 8 Key crossover links between themes
Presenting the policy and plan review, the baseline and the key issues
3.7 Chapters 4 to 13 introduce a summary of the policy and plan review and the baseline datato be utilised throughout the SEA process for each theme. They also present the key issues relevantto Stevenage for each theme. The following sections discuss the purpose of each of these tasks,how this information has been collected and summarised, and where additional information hasbeen provided.
19The Stevenage Borough Local Plan Scoping Report
Presenting the SEA scoping information
Policy and plan review
3.8 A policy, plan or programme may be influenced in various ways by other policies, plans orprogrammes, or by external sustainability objectives such as those laid down in policies orlegislation. The SEA/SA process will take advantage of potential synergies between these andaddress any inconsistencies and constraints.
3.9 The main objectives of the policy documents reviewed were grouped by SEA/SA topic,together with an indication of how the local plan might address these objectives and requirements.The policy review was not exhaustive of all potentially relevant policy documents, but rather 'fit forpurpose' to set out the policy context within which the local plan is being prepared and highlightthe environmental, social and economic objectives that it needs to address.
3.10 The Council will continue to keep this policy framework under review. In particular, it willbe necessary to monitor changes in relevant international and national legislation, policy andplanning guidance, and other policy documents likely to emerge over the plan preparation period.
3.11 Appendix 1 represents a comprehensive, accurate and concise list and evaluation of thekey policies, plans and programmes that are likely to be relevant to the local plan and itsaccompanying SEA/SA assessment process. Where higher level plans have been transposedinto more localised plans, policies and programmes, the lower level plans have been assessed.They have been presented by the themes as discussed and assessed in relation to the mainobjectives and requirements of the policy, plan or programme, and how it affects, or is affected bythe local plan in relation to the environmental, economic and social issues covered by the SEA/SAprocess.
3.12 A summary of the review is presented in the following chapters under each theme. Thesereview summaries should be read alongside the more detailed information presented in Appendix1.
Baseline data collection
3.13 Chapters 4 to 13 present a review of current environmental and socio-economic conditionsaffecting Stevenage by theme. The purpose of the baseline review is to help define the key issuesfor the local plan. This will enable the predicted effects of the plan to be effectively appraised.
3.14 The currency, resolution and presentation of data are crucial to an effective baseline.Information selected seeks to:
inform the situation at the local level;be the most up to date; andbe fit for purpose.
3.15 One of the purposes of consultation on the Scoping Report is to seek views on whetherthe data selected is appropriate. The baseline has been constructed utilising a wide range of datasources, with GIS (Geographic Information System) data proving to be an important informationsource where available. The data has been presented through tables, text and GIS mapping, and
The Stevenage Borough Local Plan Scoping Report20
Presenting the SEA scoping information
all data sources have been referenced as appropriate. Meaningful data for the purposes ofcomparison and to address the themes being assessed as part of this process is not alwaysavailable. Where appropriate, data gaps are therefore identified in the baseline.
3.16 Where relevant, data has been presented specifically at a local level. This enables morespecific information to be included on the communities and areas most affected by possible issuesto help identify areas most in need of change.
Key issues
3.17 In addition to presenting a summary of the policy, plan and programme review and asummary of the baseline data for Stevenage, the end of Chapters 4 to 13 set out a series of keyissues for each theme. The identification of these issues will help the process focus on the keyproblems and opportunities which may be addressed through the local plan.
3.18 The key issues will inform the development of the SEA/SA Framework that will be utilisedto assess the policies and proposals included in the local plan (Chapter 14).
21The Stevenage Borough Local Plan Scoping Report
Presenting the SEA scoping information
The Stevenage Borough Local Plan Scoping Report22
Presenting the SEA scoping information

4 . Biodiversity, flora and faunaThe Stevenage Borough Local Plan Scoping Report
4 Biodiversity, flora and fauna
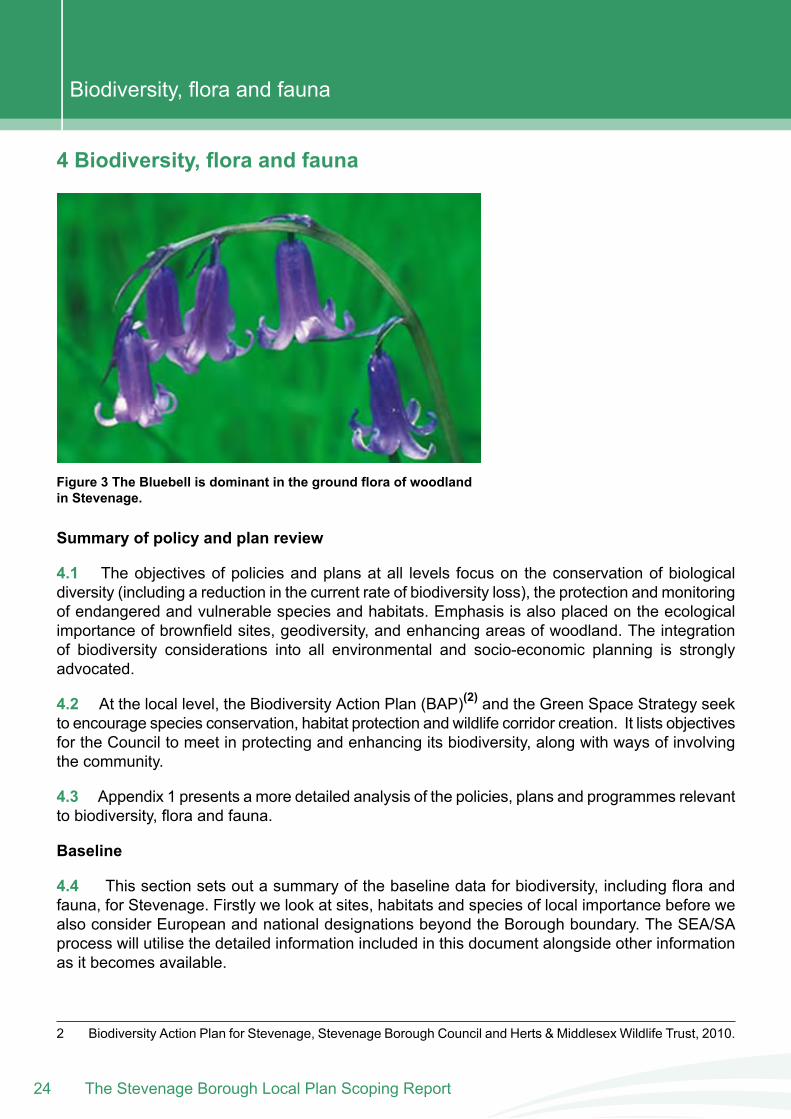
Figure 3 The Bluebell is dominant in the ground flora of woodlandin Stevenage.
Summary of policy and plan review
4.1 The objectives of policies and plans at all levels focus on the conservation of biologicaldiversity (including a reduction in the current rate of biodiversity loss), the protection and monitoringof endangered and vulnerable species and habitats. Emphasis is also placed on the ecologicalimportance of brownfield sites, geodiversity, and enhancing areas of woodland. The integrationof biodiversity considerations into all environmental and socio-economic planning is stronglyadvocated.
4.2 At the local level, the Biodiversity Action Plan (BAP)(2) and the Green Space Strategy seekto encourage species conservation, habitat protection and wildlife corridor creation. It lists objectivesfor the Council to meet in protecting and enhancing its biodiversity, along with ways of involvingthe community.
4.3 Appendix 1 presents a more detailed analysis of the policies, plans and programmes relevantto biodiversity, flora and fauna.
Baseline
4.4 This section sets out a summary of the baseline data for biodiversity, including flora andfauna, for Stevenage. Firstly we look at sites, habitats and species of local importance before wealso consider European and national designations beyond the Borough boundary. The SEA/SAprocess will utilise the detailed information included in this document alongside other informationas it becomes available.
2 Biodiversity Action Plan for Stevenage, Stevenage Borough Council and Herts & Middlesex Wildlife Trust, 2010.
The Stevenage Borough Local Plan Scoping Report24
Biodiversity, flora and fauna
Habitats
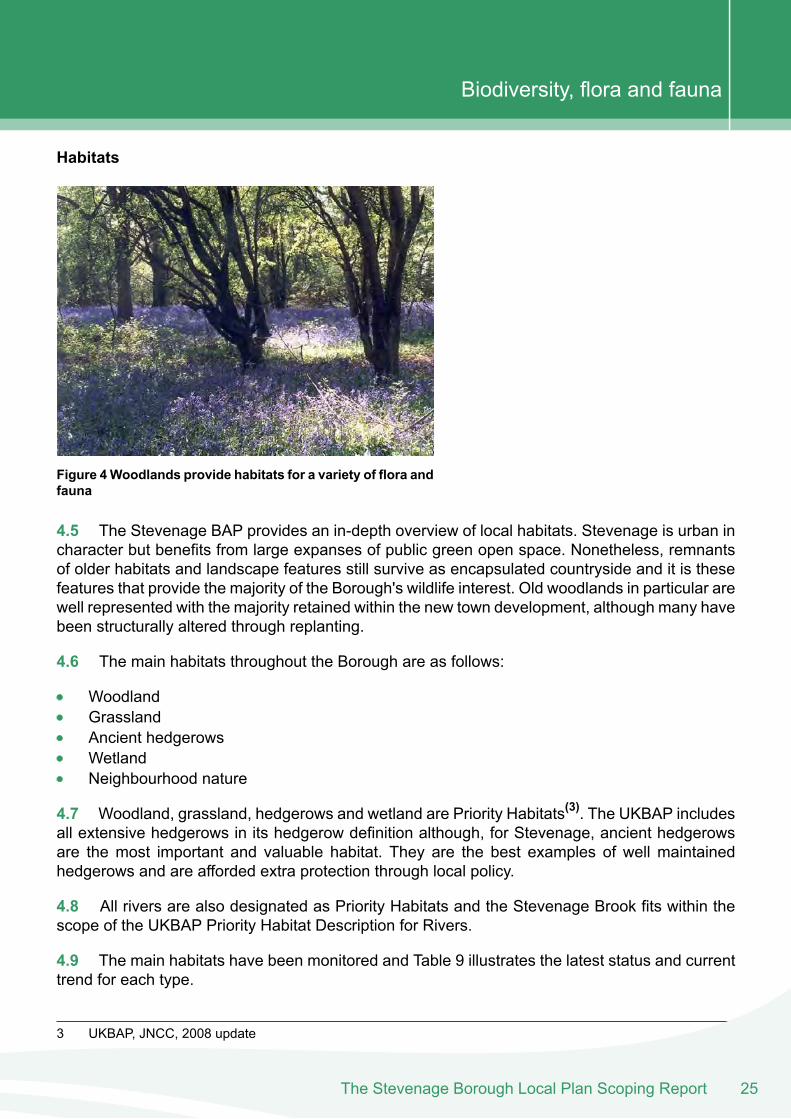
Figure 4Woodlands provide habitats for a variety of flora andfauna
4.5 The Stevenage BAP provides an in-depth overview of local habitats. Stevenage is urban incharacter but benefits from large expanses of public green open space. Nonetheless, remnantsof older habitats and landscape features still survive as encapsulated countryside and it is thesefeatures that provide the majority of the Borough's wildlife interest. Old woodlands in particular arewell represented with the majority retained within the new town development, although many havebeen structurally altered through replanting.
4.6 The main habitats throughout the Borough are as follows:
WoodlandGrasslandAncient hedgerowsWetlandNeighbourhood nature
4.7 Woodland, grassland, hedgerows and wetland are Priority Habitats(3). The UKBAP includesall extensive hedgerows in its hedgerow definition although, for Stevenage, ancient hedgerowsare the most important and valuable habitat. They are the best examples of well maintainedhedgerows and are afforded extra protection through local policy.
4.8 All rivers are also designated as Priority Habitats and the Stevenage Brook fits within thescope of the UKBAP Priority Habitat Description for Rivers.
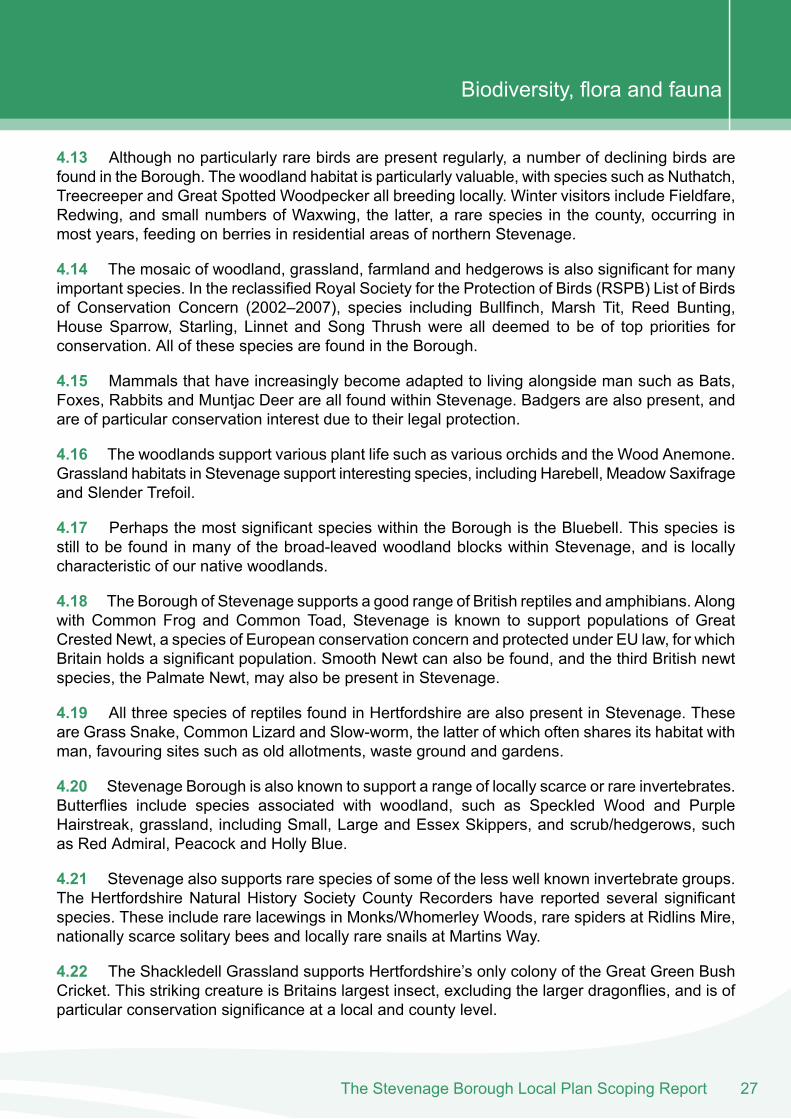
4.9 The main habitats have been monitored and Table 9 illustrates the latest status and currenttrend for each type.
3 UKBAP, JNCC, 2008 update
25The Stevenage Borough Local Plan Scoping Report
Biodiversity, flora and fauna
Latest trendLatest statusHabitat
Stable4.6 km in lengthRivers
Stable131.5 ha and 5.06% of Borough areaWoodland
Stable446.9 ha and 17.20% of Borough areaGrassland
Stable18 identified (1 key site designated as a Wildlife Site)Ancient hedgerows
Stable0.4 ha and 0.02% of Borough areaWetland
Stable39 designatedWildlife sites
Table 9 Habitats monitored for Stevenage (Data source: Stevenage BAP)
4.10 Neighbourhood nature is characterised as urban habitats within the built environment and,although currently not monitored, is now widely recognised to be of particular importance. Thismight include allotments, residential gardens and artificial habitats such as waste ground.
4.11 Habitat Action Plans (HAPs) are designed to provide a framework for action to conserveand enhance Stevenage's biodiversity. Five HAPs have been prepared for the main habitatsthroughout the Borough.
Species
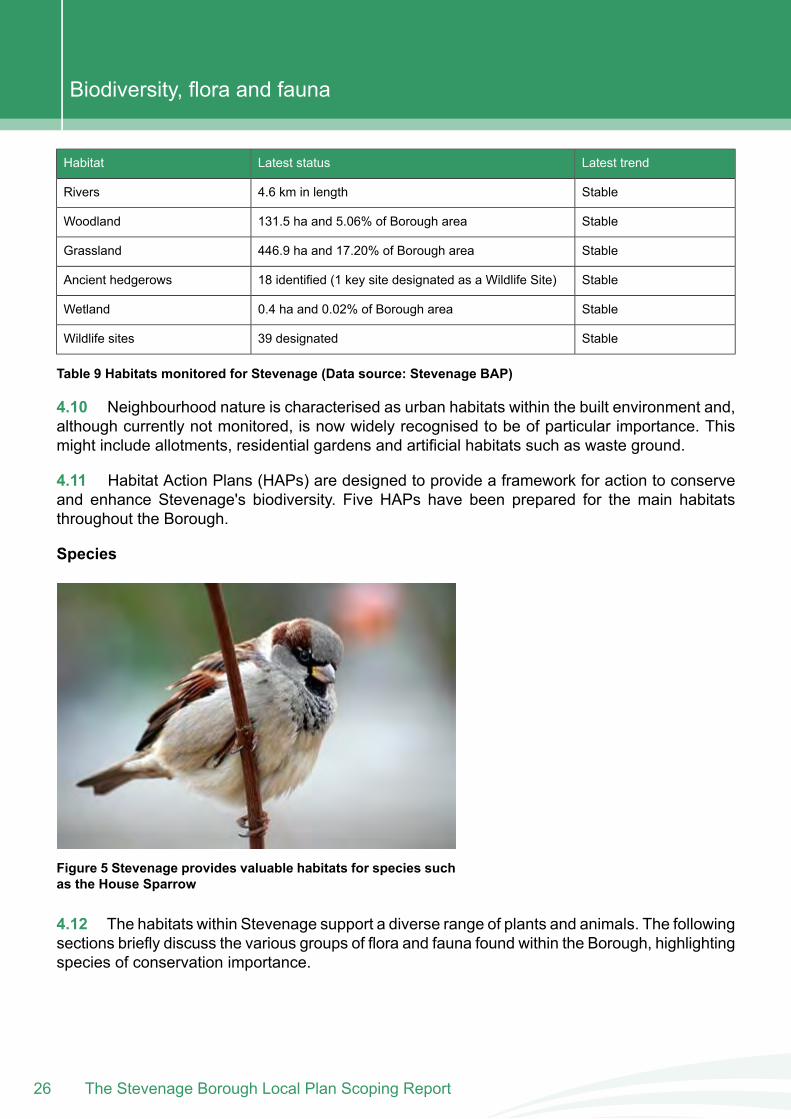
Figure 5 Stevenage provides valuable habitats for species suchas the House Sparrow
4.12 The habitats within Stevenage support a diverse range of plants and animals. The followingsections briefly discuss the various groups of flora and fauna found within the Borough, highlightingspecies of conservation importance.
The Stevenage Borough Local Plan Scoping Report26
Biodiversity, flora and fauna
4.13 Although no particularly rare birds are present regularly, a number of declining birds arefound in the Borough. The woodland habitat is particularly valuable, with species such as Nuthatch,Treecreeper and Great Spotted Woodpecker all breeding locally. Winter visitors include Fieldfare,Redwing, and small numbers of Waxwing, the latter, a rare species in the county, occurring inmost years, feeding on berries in residential areas of northern Stevenage.
4.14 The mosaic of woodland, grassland, farmland and hedgerows is also significant for manyimportant species. In the reclassified Royal Society for the Protection of Birds (RSPB) List of Birdsof Conservation Concern (2002–2007), species including Bullfinch, Marsh Tit, Reed Bunting,House Sparrow, Starling, Linnet and Song Thrush were all deemed to be of top priorities forconservation. All of these species are found in the Borough.
4.15 Mammals that have increasingly become adapted to living alongside man such as Bats,Foxes, Rabbits and Muntjac Deer are all found within Stevenage. Badgers are also present, andare of particular conservation interest due to their legal protection.
4.16 The woodlands support various plant life such as various orchids and the Wood Anemone.Grassland habitats in Stevenage support interesting species, including Harebell, Meadow Saxifrageand Slender Trefoil.
4.17 Perhaps the most significant species within the Borough is the Bluebell. This species isstill to be found in many of the broad-leaved woodland blocks within Stevenage, and is locallycharacteristic of our native woodlands.
4.18 The Borough of Stevenage supports a good range of British reptiles and amphibians. Alongwith Common Frog and Common Toad, Stevenage is known to support populations of GreatCrested Newt, a species of European conservation concern and protected under EU law, for whichBritain holds a significant population. Smooth Newt can also be found, and the third British newtspecies, the Palmate Newt, may also be present in Stevenage.
4.19 All three species of reptiles found in Hertfordshire are also present in Stevenage. Theseare Grass Snake, Common Lizard and Slow-worm, the latter of which often shares its habitat withman, favouring sites such as old allotments, waste ground and gardens.
4.20 Stevenage Borough is also known to support a range of locally scarce or rare invertebrates.Butterflies include species associated with woodland, such as Speckled Wood and PurpleHairstreak, grassland, including Small, Large and Essex Skippers, and scrub/hedgerows, suchas Red Admiral, Peacock and Holly Blue.
4.21 Stevenage also supports rare species of some of the less well known invertebrate groups.The Hertfordshire Natural History Society County Recorders have reported several significantspecies. These include rare lacewings in Monks/Whomerley Woods, rare spiders at Ridlins Mire,nationally scarce solitary bees and locally rare snails at Martins Way.
4.22 The Shackledell Grassland supports Hertfordshire’s only colony of the Great Green BushCricket. This striking creature is Britains largest insect, excluding the larger dragonflies, and is ofparticular conservation significance at a local and county level.
27The Stevenage Borough Local Plan Scoping Report
Biodiversity, flora and fauna
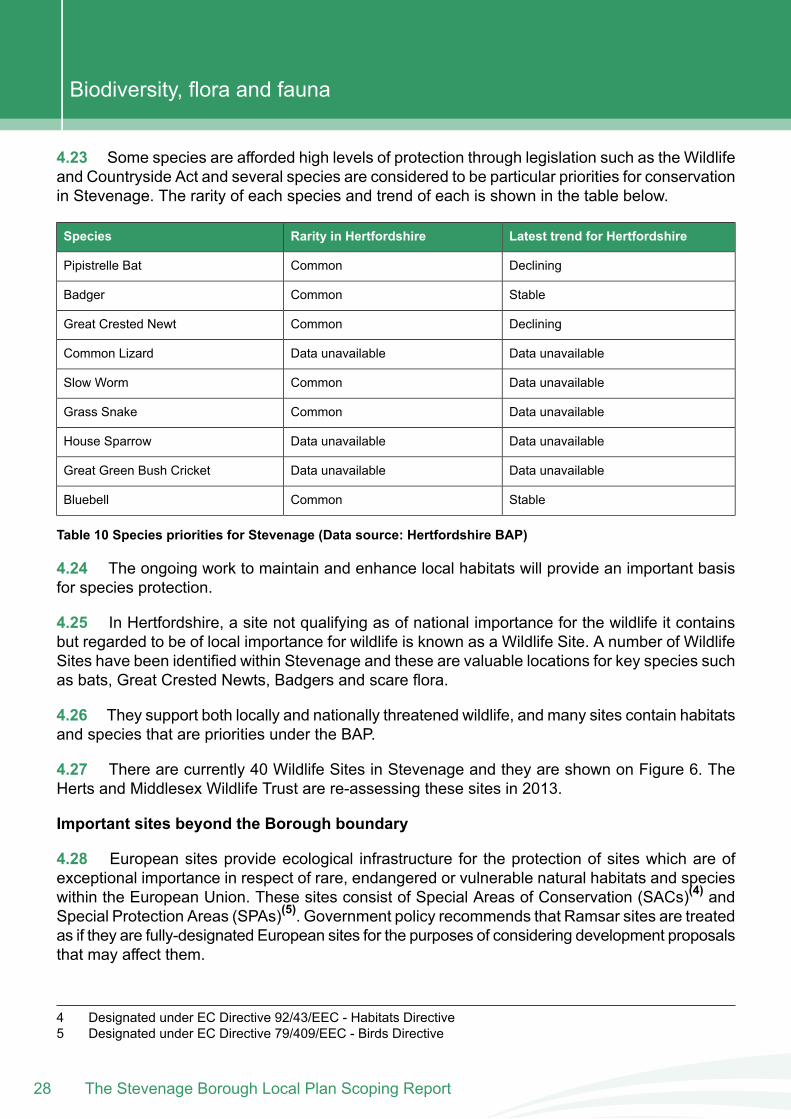
4.23 Some species are afforded high levels of protection through legislation such as the Wildlifeand Countryside Act and several species are considered to be particular priorities for conservationin Stevenage. The rarity of each species and trend of each is shown in the table below.
Latest trend for HertfordshireRarity in HertfordshireSpecies
DecliningCommonPipistrelle Bat
StableCommonBadger
DecliningCommonGreat Crested Newt
Data unavailableData unavailableCommon Lizard
Data unavailableCommonSlow Worm
Data unavailableCommonGrass Snake
Data unavailableData unavailableHouse Sparrow
Data unavailableData unavailableGreat Green Bush Cricket
StableCommonBluebell
Table 10 Species priorities for Stevenage (Data source: Hertfordshire BAP)
4.24 The ongoing work to maintain and enhance local habitats will provide an important basisfor species protection.
4.25 In Hertfordshire, a site not qualifying as of national importance for the wildlife it containsbut regarded to be of local importance for wildlife is known as a Wildlife Site. A number of WildlifeSites have been identified within Stevenage and these are valuable locations for key species suchas bats, Great Crested Newts, Badgers and scare flora.
4.26 They support both locally and nationally threatened wildlife, and many sites contain habitatsand species that are priorities under the BAP.
4.27 There are currently 40 Wildlife Sites in Stevenage and they are shown on Figure 6. TheHerts and Middlesex Wildlife Trust are re-assessing these sites in 2013.
Important sites beyond the Borough boundary
4.28 European sites provide ecological infrastructure for the protection of sites which are ofexceptional importance in respect of rare, endangered or vulnerable natural habitats and specieswithin the European Union. These sites consist of Special Areas of Conservation (SACs)(4) andSpecial Protection Areas (SPAs)(5). Government policy recommends that Ramsar sites are treatedas if they are fully-designated European sites for the purposes of considering development proposalsthat may affect them.
4 Designated under EC Directive 92/43/EEC - Habitats Directive5 Designated under EC Directive 79/409/EEC - Birds Directive
The Stevenage Borough Local Plan Scoping Report28
Biodiversity, flora and fauna
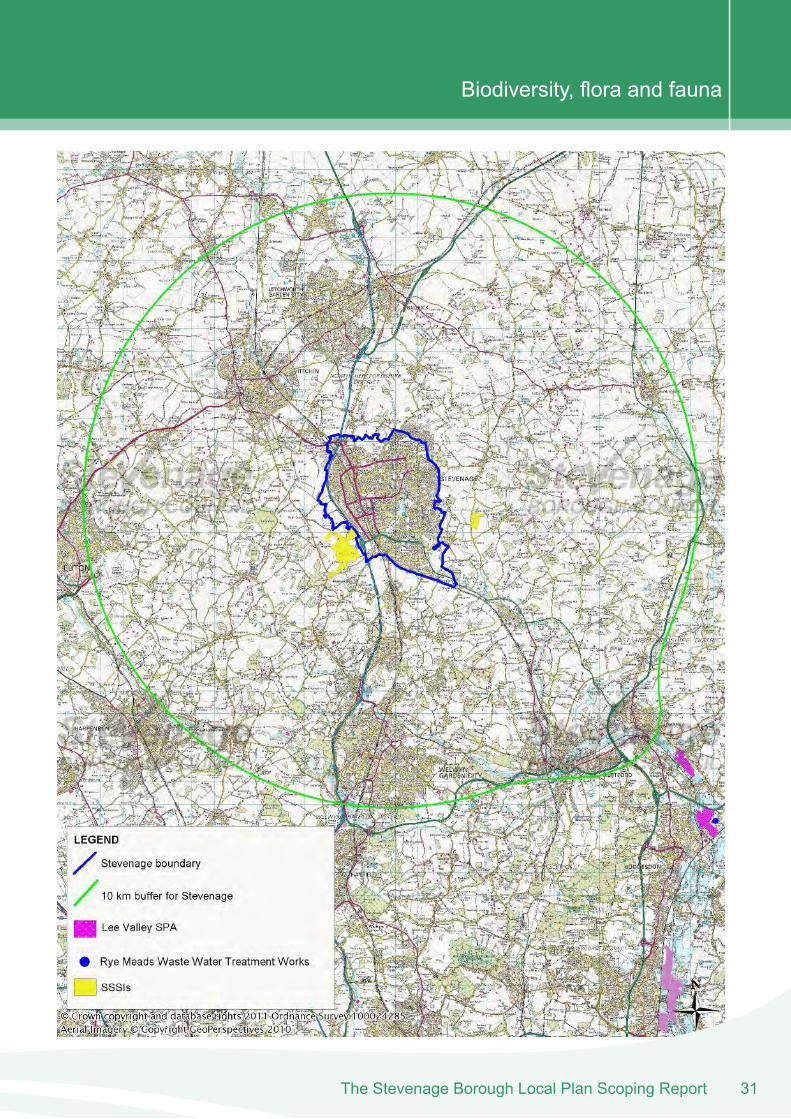
4.29 There are no European sites within the Borough boundary or within 10km of the Borough.However, wastewater from Stevenage is treated at the RyeMeadsWasteWater TreatmentWorks.This plant is located next to the Lee Valley SPA, 12 km from Stevenage.
4.30 The Lee Valley SPA is also designated as a Ramsar site and Site of Special ScientificInterest (SSSI). It covers more than 450 hectares of land, stretching from Great Amwell near Wareto Walthamstow in London. Figure 7 illustrates the location of the SPA. The habitats in the SPAinclude inland water, grassland, deciduous woodland and fens /marshes.
29The Stevenage Borough Local Plan Scoping Report
Biodiversity, flora and fauna
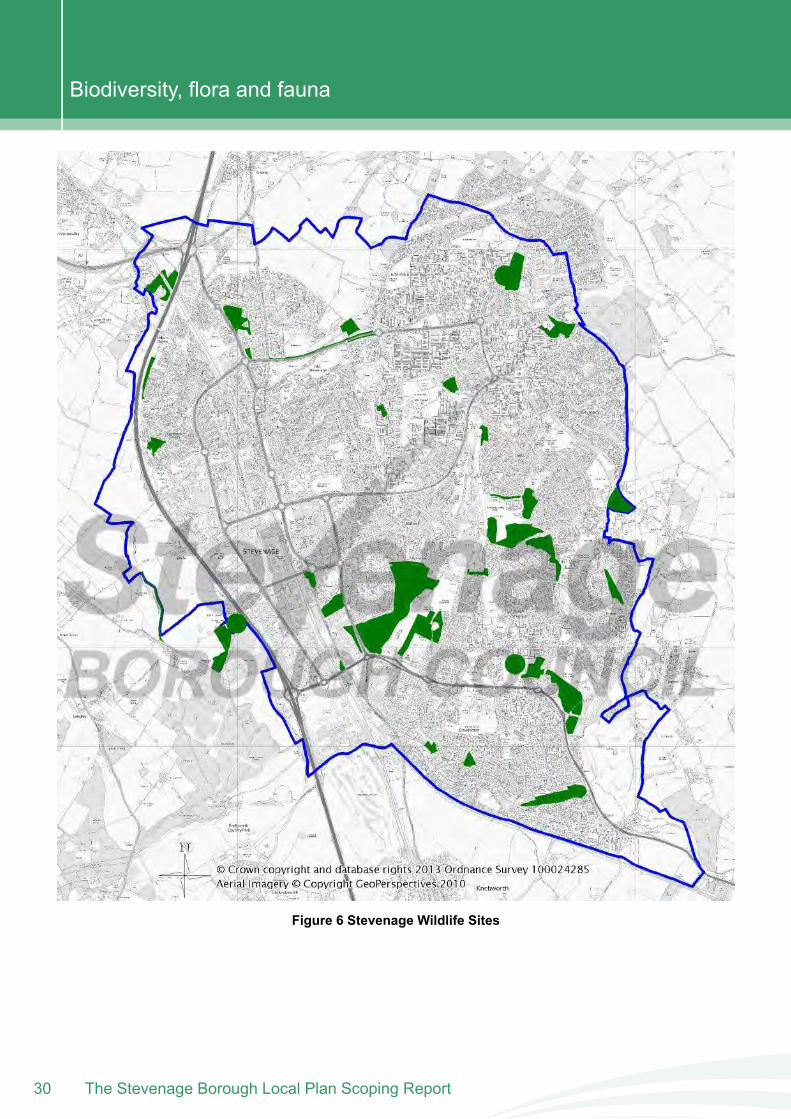
Figure 6 Stevenage Wildlife Sites
The Stevenage Borough Local Plan Scoping Report30
Biodiversity, flora and fauna
31The Stevenage Borough Local Plan Scoping Report
Biodiversity, flora and fauna
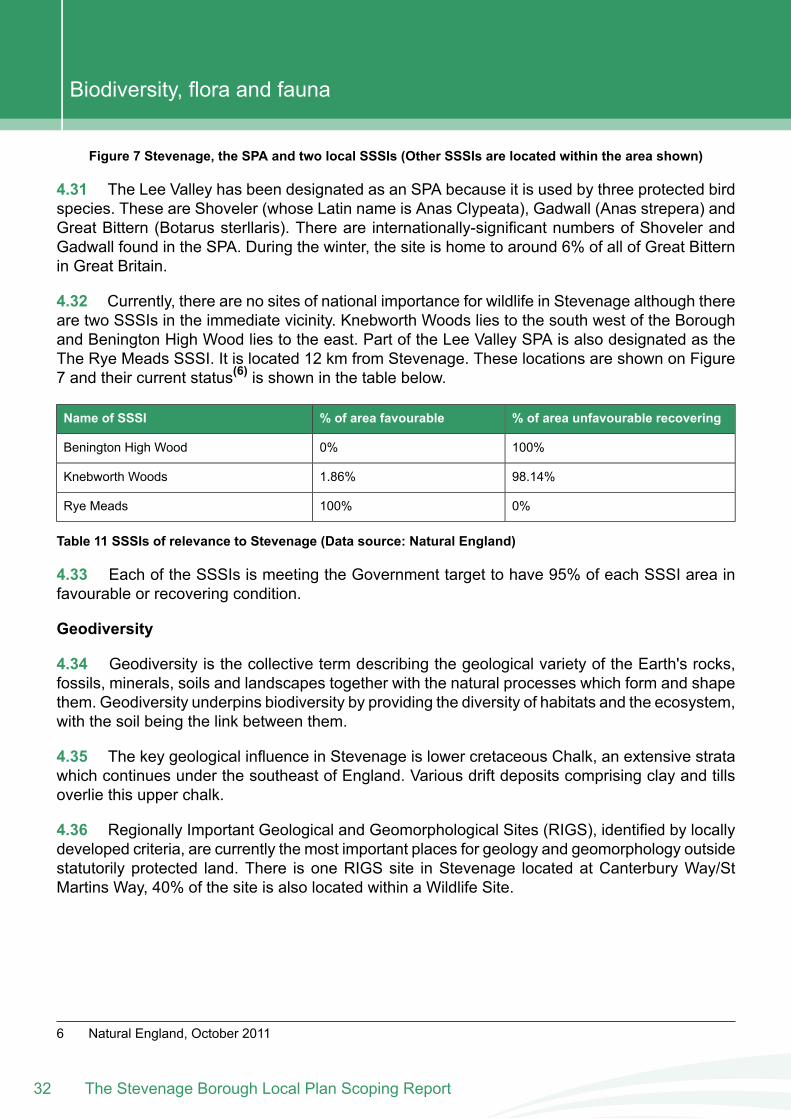
Figure 7 Stevenage, the SPA and two local SSSIs (Other SSSIs are located within the area shown)
4.31 The Lee Valley has been designated as an SPA because it is used by three protected birdspecies. These are Shoveler (whose Latin name is Anas Clypeata), Gadwall (Anas strepera) andGreat Bittern (Botarus sterllaris). There are internationally-significant numbers of Shoveler andGadwall found in the SPA. During the winter, the site is home to around 6% of all of Great Bitternin Great Britain.
4.32 Currently, there are no sites of national importance for wildlife in Stevenage although thereare two SSSIs in the immediate vicinity. Knebworth Woods lies to the south west of the Boroughand Benington High Wood lies to the east. Part of the Lee Valley SPA is also designated as theThe Rye Meads SSSI. It is located 12 km from Stevenage. These locations are shown on Figure7 and their current status(6) is shown in the table below.
% of area unfavourable recovering% of area favourableName of SSSI
100%0%Benington High Wood
98.14%1.86%Knebworth Woods
0%100%Rye Meads
Table 11 SSSIs of relevance to Stevenage (Data source: Natural England)
4.33 Each of the SSSIs is meeting the Government target to have 95% of each SSSI area infavourable or recovering condition.
Geodiversity
4.34 Geodiversity is the collective term describing the geological variety of the Earth's rocks,fossils, minerals, soils and landscapes together with the natural processes which form and shapethem. Geodiversity underpins biodiversity by providing the diversity of habitats and the ecosystem,with the soil being the link between them.
4.35 The key geological influence in Stevenage is lower cretaceous Chalk, an extensive stratawhich continues under the southeast of England. Various drift deposits comprising clay and tillsoverlie this upper chalk.
4.36 Regionally Important Geological and Geomorphological Sites (RIGS), identified by locallydeveloped criteria, are currently the most important places for geology and geomorphology outsidestatutorily protected land. There is one RIGS site in Stevenage located at Canterbury Way/StMartins Way, 40% of the site is also located within a Wildlife Site.
6 Natural England, October 2011
The Stevenage Borough Local Plan Scoping Report32
Biodiversity, flora and fauna
4.37 The chalk in this roadside cutting contains solution pipes (7)filled with typicalWoolwich/Reading Formation sediment, which proves that this formation once extended severalkilometres north of its present main outcrop. The unworn flint nodules around the edges of thepipes were released by dissolution of the adjacent chalk as the pipes formed.
Data gaps
4.38 The following gaps have been identified in the baseline data:
Populations of Priority Species and their underlying trends;Quality of local Wildlife Sites.
Key issues
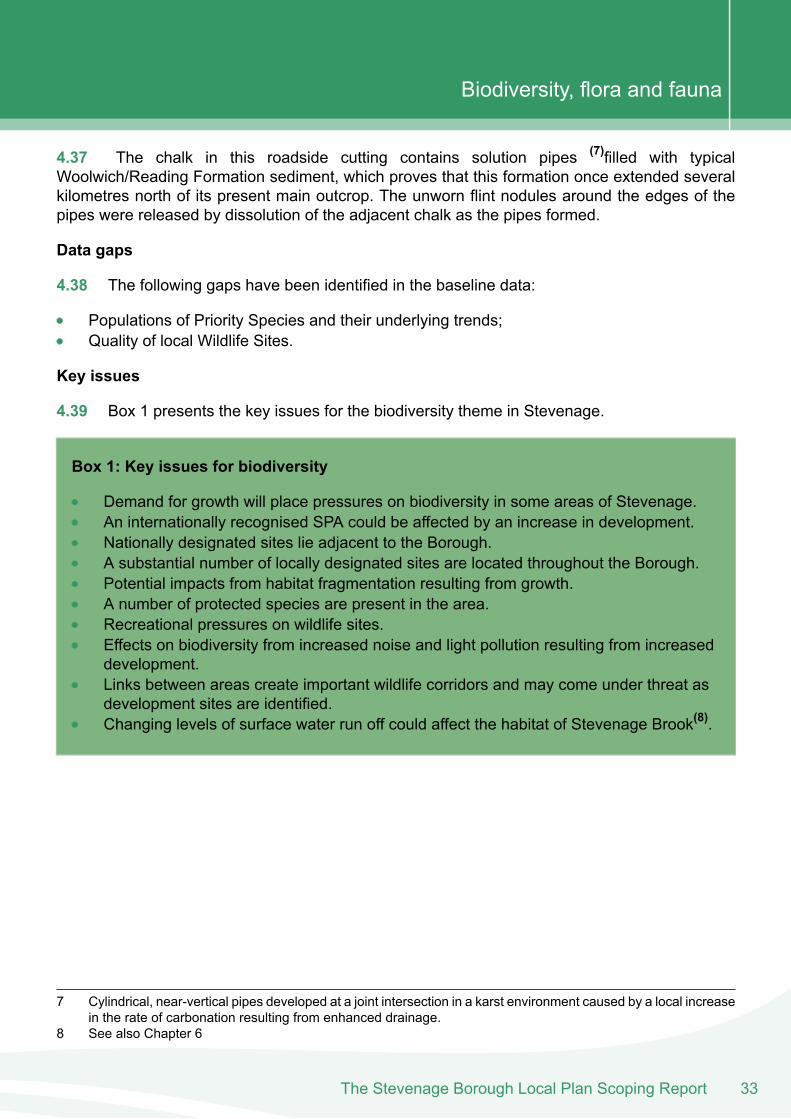
4.39 Box 1 presents the key issues for the biodiversity theme in Stevenage.
Box 1: Key issues for biodiversity
Demand for growth will place pressures on biodiversity in some areas of Stevenage.An internationally recognised SPA could be affected by an increase in development.Nationally designated sites lie adjacent to the Borough.A substantial number of locally designated sites are located throughout the Borough.Potential impacts from habitat fragmentation resulting from growth.A number of protected species are present in the area.Recreational pressures on wildlife sites.Effects on biodiversity from increased noise and light pollution resulting from increaseddevelopment.Links between areas create important wildlife corridors and may come under threat asdevelopment sites are identified.Changing levels of surface water run off could affect the habitat of Stevenage Brook(8).
7 Cylindrical, near-vertical pipes developed at a joint intersection in a karst environment caused by a local increasein the rate of carbonation resulting from enhanced drainage.
8 See also Chapter 6
33The Stevenage Borough Local Plan Scoping Report
Biodiversity, flora and fauna
The Stevenage Borough Local Plan Scoping Report34
Biodiversity, flora and fauna

5 . Population and human healthThe Stevenage Borough Local Plan Scoping Report
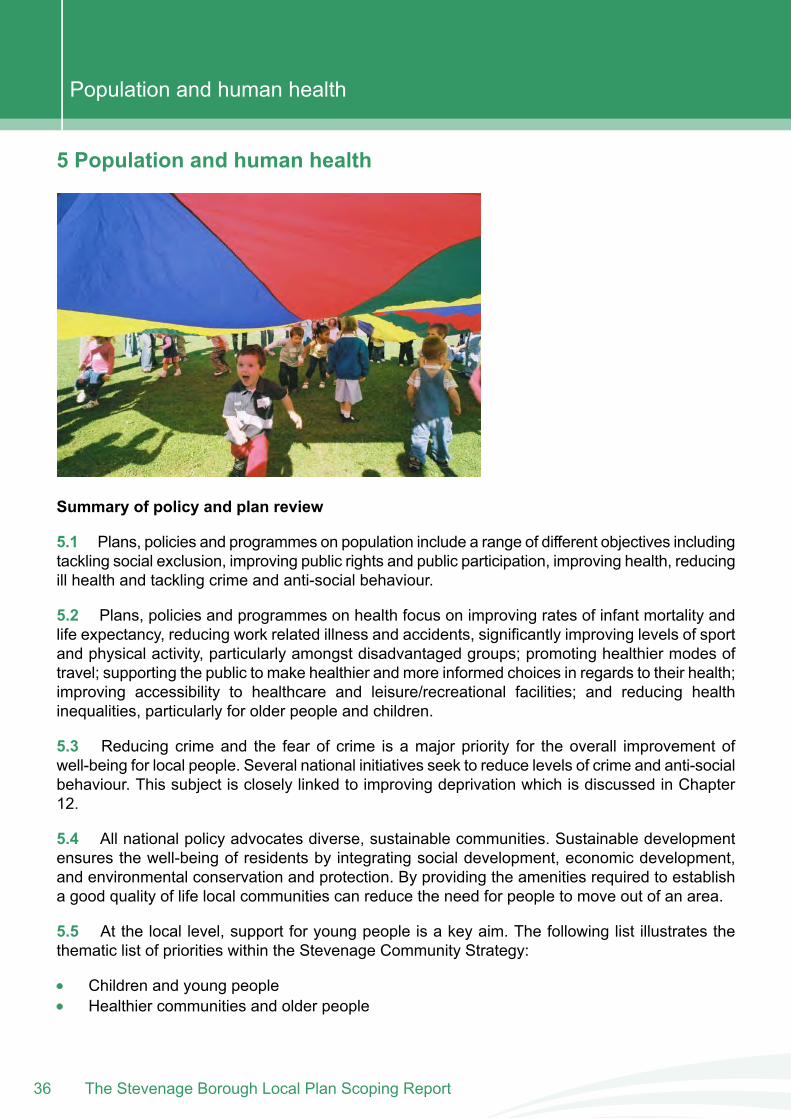
5 Population and human health
Summary of policy and plan review
5.1 Plans, policies and programmes on population include a range of different objectives includingtackling social exclusion, improving public rights and public participation, improving health, reducingill health and tackling crime and anti-social behaviour.
5.2 Plans, policies and programmes on health focus on improving rates of infant mortality andlife expectancy, reducing work related illness and accidents, significantly improving levels of sportand physical activity, particularly amongst disadvantaged groups; promoting healthier modes oftravel; supporting the public to make healthier and more informed choices in regards to their health;improving accessibility to healthcare and leisure/recreational facilities; and reducing healthinequalities, particularly for older people and children.
5.3 Reducing crime and the fear of crime is a major priority for the overall improvement ofwell-being for local people. Several national initiatives seek to reduce levels of crime and anti-socialbehaviour. This subject is closely linked to improving deprivation which is discussed in Chapter12.
5.4 All national policy advocates diverse, sustainable communities. Sustainable developmentensures the well-being of residents by integrating social development, economic development,and environmental conservation and protection. By providing the amenities required to establisha good quality of life local communities can reduce the need for people to move out of an area.
5.5 At the local level, support for young people is a key aim. The following list illustrates thethematic list of priorities within the Stevenage Community Strategy:
Children and young peopleHealthier communities and older people
The Stevenage Borough Local Plan Scoping Report36
Population and human health
Safer stronger communitiesEconomic development and the environment.
Baseline
5.6 This section sets out a summary of the baseline data for population and human health forStevenage. The SEA/SA process will utilise the detailed information included in this documentalongside other information as it becomes available.
Population
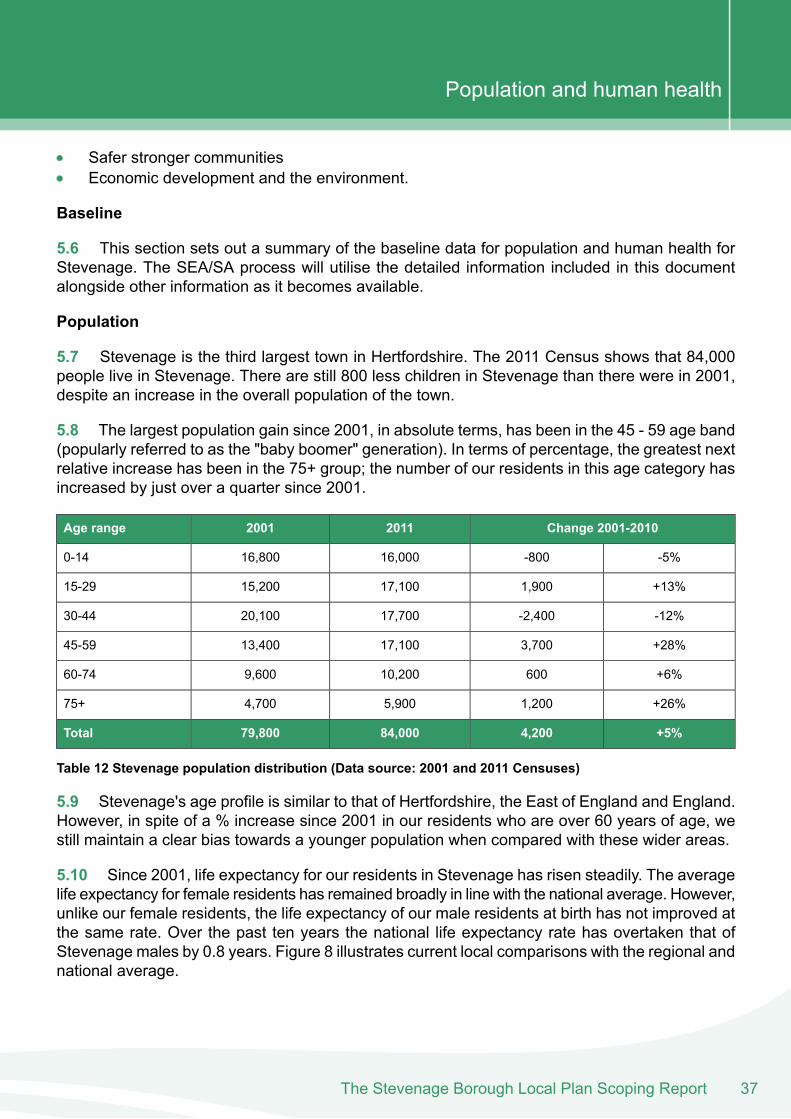
5.7 Stevenage is the third largest town in Hertfordshire. The 2011 Census shows that 84,000people live in Stevenage. There are still 800 less children in Stevenage than there were in 2001,despite an increase in the overall population of the town.
5.8 The largest population gain since 2001, in absolute terms, has been in the 45 - 59 age band(popularly referred to as the "baby boomer" generation). In terms of percentage, the greatest nextrelative increase has been in the 75+ group; the number of our residents in this age category hasincreased by just over a quarter since 2001.
Change 2001-201020112001Age range
-5%-80016,00016,8000-14
+13%1,90017,10015,20015-29
-12%-2,40017,70020,10030-44
+28%3,70017,10013,40045-59
+6%60010,2009,60060-74
+26%1,2005,9004,70075+
+5%4,20084,00079,800Total
Table 12 Stevenage population distribution (Data source: 2001 and 2011 Censuses)
5.9 Stevenage's age profile is similar to that of Hertfordshire, the East of England and England.However, in spite of a % increase since 2001 in our residents who are over 60 years of age, westill maintain a clear bias towards a younger population when compared with these wider areas.
5.10 Since 2001, life expectancy for our residents in Stevenage has risen steadily. The averagelife expectancy for female residents has remained broadly in line with the national average. However,unlike our female residents, the life expectancy of our male residents at birth has not improved atthe same rate. Over the past ten years the national life expectancy rate has overtaken that ofStevenage males by 0.8 years. Figure 8 illustrates current local comparisons with the regional andnational average.
37The Stevenage Borough Local Plan Scoping Report
Population and human health
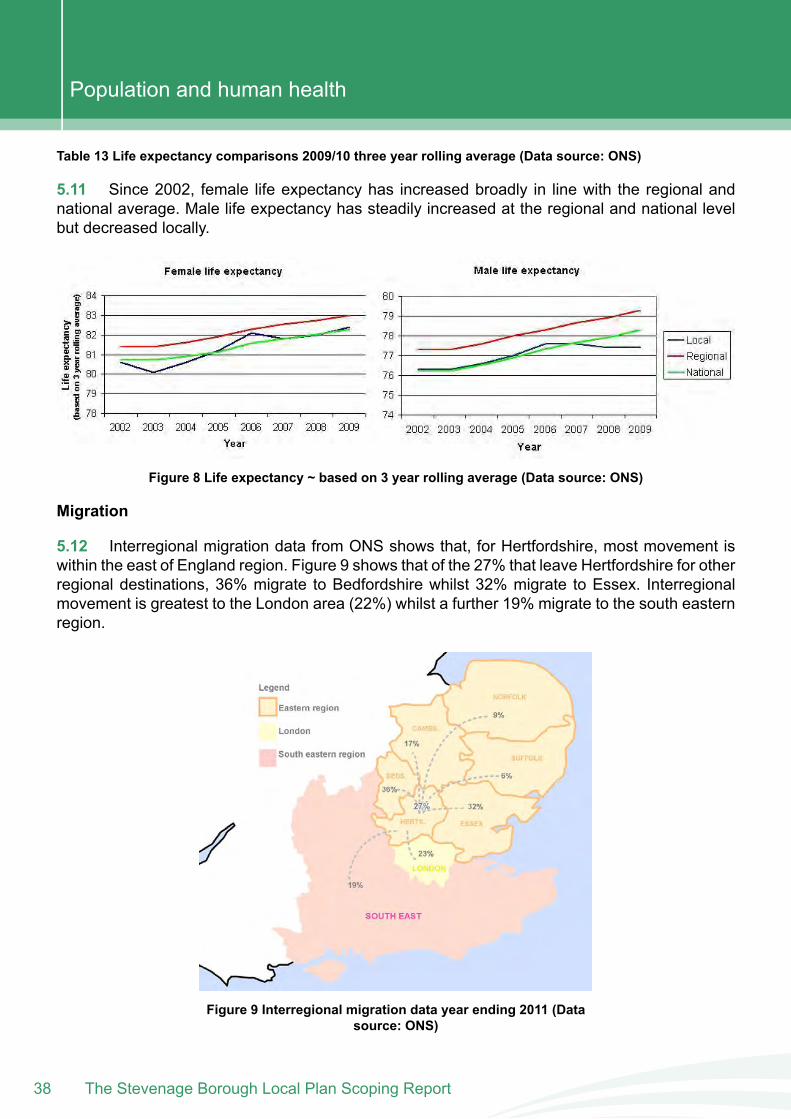
Table 13 Life expectancy comparisons 2009/10 three year rolling average (Data source: ONS)
5.11 Since 2002, female life expectancy has increased broadly in line with the regional andnational average. Male life expectancy has steadily increased at the regional and national levelbut decreased locally.
Figure 8 Life expectancy ~ based on 3 year rolling average (Data source: ONS)
Migration
5.12 Interregional migration data from ONS shows that, for Hertfordshire, most movement iswithin the east of England region. Figure 9 shows that of the 27% that leave Hertfordshire for otherregional destinations, 36% migrate to Bedfordshire whilst 32% migrate to Essex. Interregionalmovement is greatest to the London area (22%) whilst a further 19% migrate to the south easternregion.
Figure 9 Interregional migration data year ending 2011 (Datasource: ONS)
The Stevenage Borough Local Plan Scoping Report38
Population and human health
5.13 The largest migration numbers come from the 25-44 year age group.
5.14 Local level data also shows that for Stevenage, most migrating residents (57%) move withinthe eastern region. Of that total, 39% move to the neighbouring district of North Hertfordshirefollowed by 9% to East Hertfordshire and 7% to Welwyn-Hatfield. Movements outside of the areaare largely to London (12%) and the south eastern region (9%), which is in-line with data for thewhole of Hertfordshire.
Ethnicity and religion
5.15 Stevenage has a relatively low proportion of Black Minority Ethnic communities. There hasbeen an increase in the number of migrants from Africa and the Middle East/Asia. The 2011 Censusshows that just over half of the population state their religion to be Christian, a reduction since the2001 Census. More than 30% state that they have no religion, with 2% listed as Muslim and 1.2%listed as Hindu. Other recorded religions equate to less than 2% of the total population.
Health
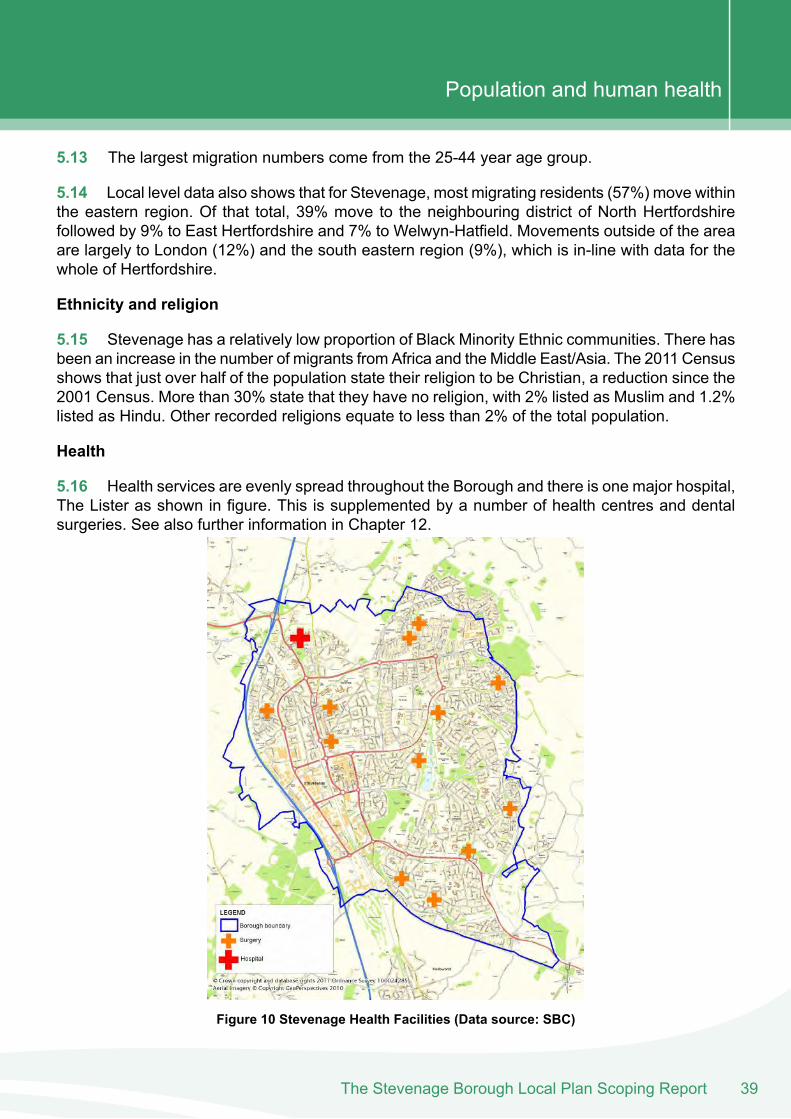
5.16 Health services are evenly spread throughout the Borough and there is one major hospital,The Lister as shown in figure. This is supplemented by a number of health centres and dentalsurgeries. See also further information in Chapter 12.
Figure 10 Stevenage Health Facilities (Data source: SBC)
39The Stevenage Borough Local Plan Scoping Report
Population and human health
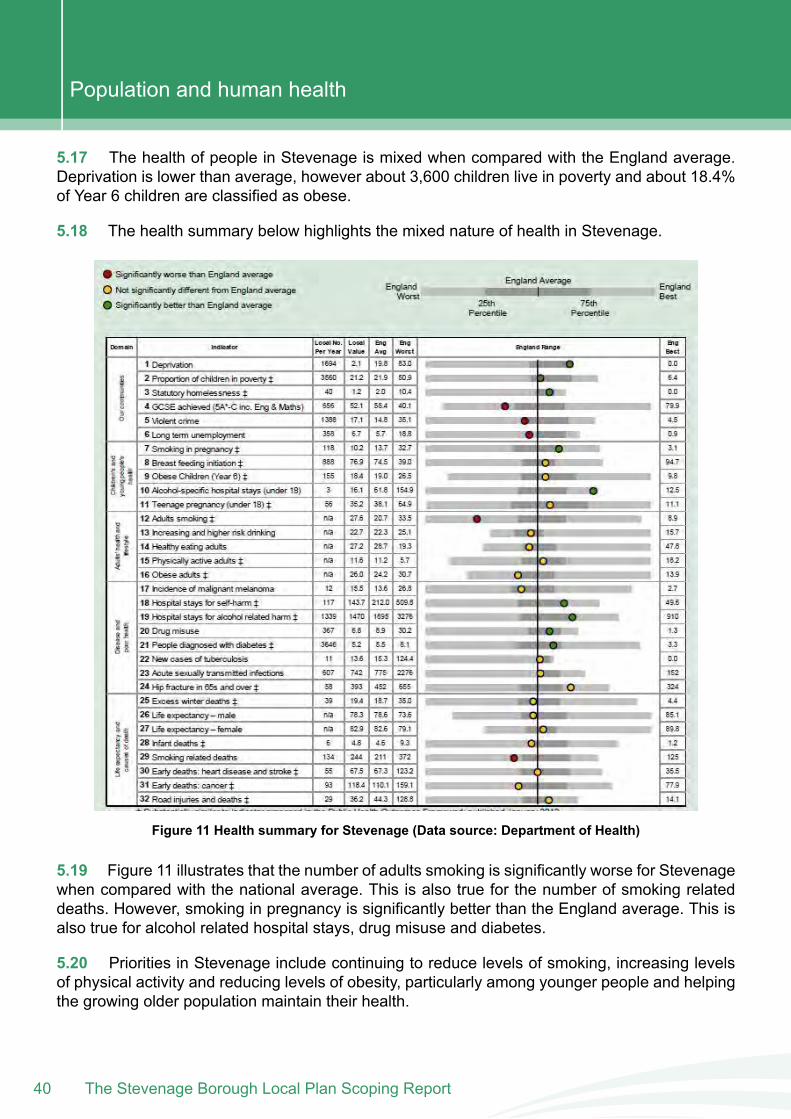
5.17 The health of people in Stevenage is mixed when compared with the England average.Deprivation is lower than average, however about 3,600 children live in poverty and about 18.4%of Year 6 children are classified as obese.
5.18 The health summary below highlights the mixed nature of health in Stevenage.
Figure 11 Health summary for Stevenage (Data source: Department of Health)
5.19 Figure 11 illustrates that the number of adults smoking is significantly worse for Stevenagewhen compared with the national average. This is also true for the number of smoking relateddeaths. However, smoking in pregnancy is significantly better than the England average. This isalso true for alcohol related hospital stays, drug misuse and diabetes.
5.20 Priorities in Stevenage include continuing to reduce levels of smoking, increasing levelsof physical activity and reducing levels of obesity, particularly among younger people and helpingthe growing older population maintain their health.
The Stevenage Borough Local Plan Scoping Report40
Population and human health
5.21 Providing an environment that encourages healthy living and promotes active lifestyles forStevenage residents was a fundamental aim of the original planning of the New Town. Thischaracteristic is still evident today, with a considerable proportion of open space per 1000population. There is for example 0.73ha of parks and gardens per 1,000 population, 1.78ha naturaland semi-natural open space and 1.09ha of amenity greenspace. Further information on this topicis included in Chapter 11.
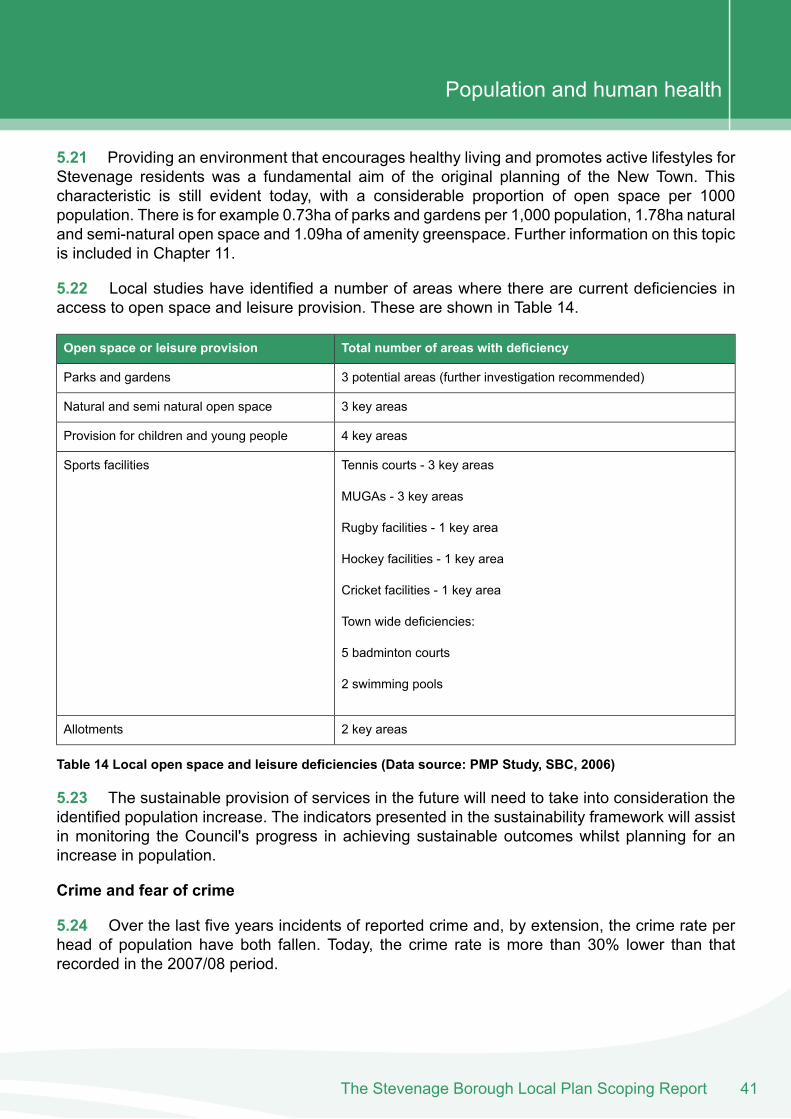
5.22 Local studies have identified a number of areas where there are current deficiencies inaccess to open space and leisure provision. These are shown in Table 14.
Total number of areas with deficiencyOpen space or leisure provision
3 potential areas (further investigation recommended)Parks and gardens
3 key areasNatural and semi natural open space
4 key areasProvision for children and young people
Tennis courts - 3 key areasSports facilities
MUGAs - 3 key areas
Rugby facilities - 1 key area
Hockey facilities - 1 key area
Cricket facilities - 1 key area
Town wide deficiencies:
5 badminton courts
2 swimming pools
2 key areasAllotments
Table 14 Local open space and leisure deficiencies (Data source: PMP Study, SBC, 2006)
5.23 The sustainable provision of services in the future will need to take into consideration theidentified population increase. The indicators presented in the sustainability framework will assistin monitoring the Council's progress in achieving sustainable outcomes whilst planning for anincrease in population.
Crime and fear of crime
5.24 Over the last five years incidents of reported crime and, by extension, the crime rate perhead of population have both fallen. Today, the crime rate is more than 30% lower than thatrecorded in the 2007/08 period.
41The Stevenage Borough Local Plan Scoping Report
Population and human health
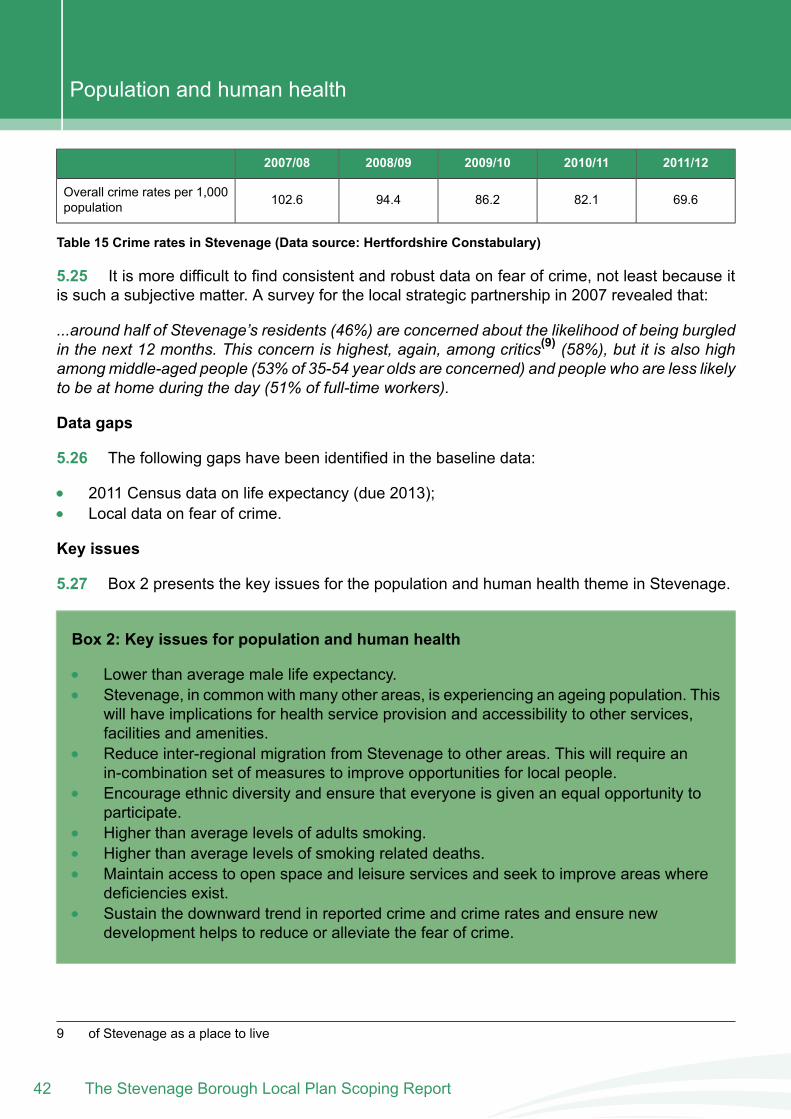
2011/122010/112009/102008/092007/08
69.682.186.294.4102.6Overall crime rates per 1,000population
Table 15 Crime rates in Stevenage (Data source: Hertfordshire Constabulary)
5.25 It is more difficult to find consistent and robust data on fear of crime, not least because itis such a subjective matter. A survey for the local strategic partnership in 2007 revealed that:
...around half of Stevenage’s residents (46%) are concerned about the likelihood of being burgledin the next 12 months. This concern is highest, again, among critics(9) (58%), but it is also highamongmiddle-aged people (53% of 35-54 year olds are concerned) and people who are less likelyto be at home during the day (51% of full-time workers).
Data gaps
5.26 The following gaps have been identified in the baseline data:
2011 Census data on life expectancy (due 2013);Local data on fear of crime.
Key issues
5.27 Box 2 presents the key issues for the population and human health theme in Stevenage.
Box 2: Key issues for population and human health
Lower than average male life expectancy.Stevenage, in common with many other areas, is experiencing an ageing population. Thiswill have implications for health service provision and accessibility to other services,facilities and amenities.Reduce inter-regional migration from Stevenage to other areas. This will require anin-combination set of measures to improve opportunities for local people.Encourage ethnic diversity and ensure that everyone is given an equal opportunity toparticipate.Higher than average levels of adults smoking.Higher than average levels of smoking related deaths.Maintain access to open space and leisure services and seek to improve areas wheredeficiencies exist.Sustain the downward trend in reported crime and crime rates and ensure newdevelopment helps to reduce or alleviate the fear of crime.
9 of Stevenage as a place to live
The Stevenage Borough Local Plan Scoping Report42
Population and human health

6 . Water and soilsThe Stevenage Borough Local Plan Scoping Report
6 Water and soils
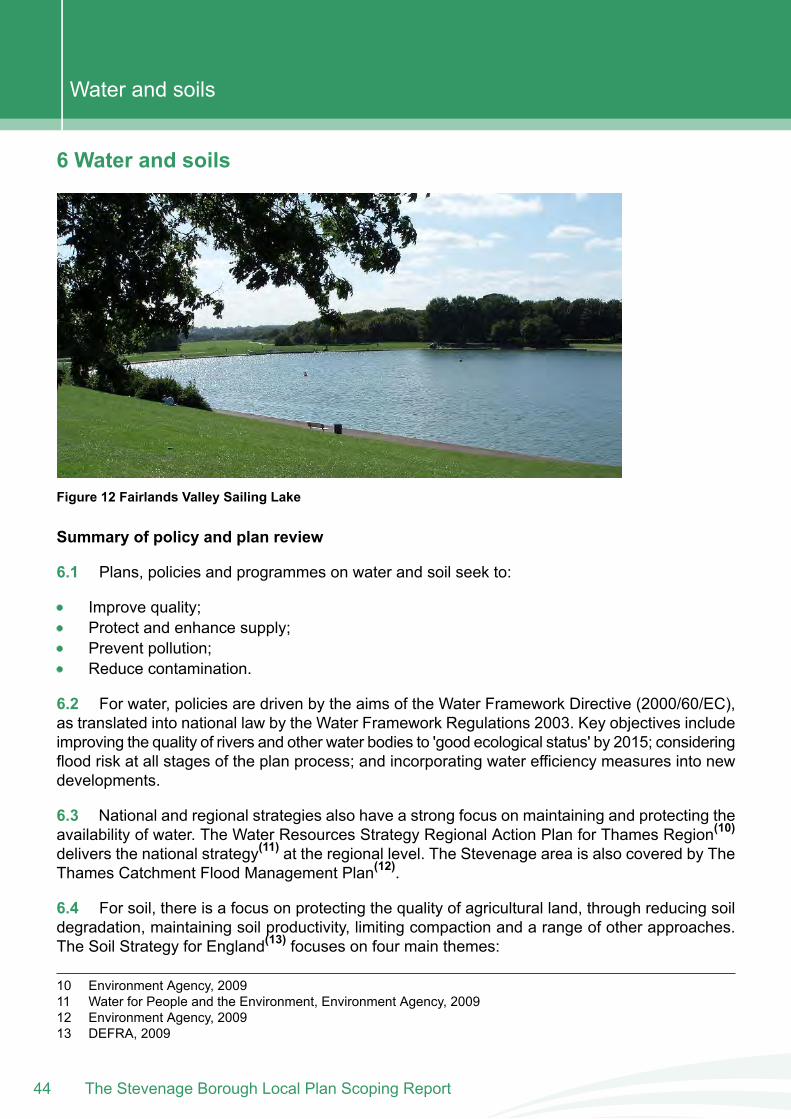
Figure 12 Fairlands Valley Sailing Lake
Summary of policy and plan review
6.1 Plans, policies and programmes on water and soil seek to:
Improve quality;Protect and enhance supply;Prevent pollution;Reduce contamination.
6.2 For water, policies are driven by the aims of the Water Framework Directive (2000/60/EC),as translated into national law by the Water Framework Regulations 2003. Key objectives includeimproving the quality of rivers and other water bodies to 'good ecological status' by 2015; consideringflood risk at all stages of the plan process; and incorporating water efficiency measures into newdevelopments.
6.3 National and regional strategies also have a strong focus on maintaining and protecting theavailability of water. The Water Resources Strategy Regional Action Plan for Thames Region(10)
delivers the national strategy(11) at the regional level. The Stevenage area is also covered by TheThames Catchment Flood Management Plan(12).
6.4 For soil, there is a focus on protecting the quality of agricultural land, through reducing soildegradation, maintaining soil productivity, limiting compaction and a range of other approaches.The Soil Strategy for England(13) focuses on four main themes:
10 Environment Agency, 200911 Water for People and the Environment, Environment Agency, 200912 Environment Agency, 200913 DEFRA, 2009
The Stevenage Borough Local Plan Scoping Report44
Water and soils
the sustainable use of agricultural soils;the role of soils in mitigating and adapting to climate change;protecting soil functions during construction and development; andpreventing pollution and dealing with historic contamination.
Baseline
6.5 This section sets out a summary of the baseline data for water and soils, for Stevenage.Firstly we look at water resources and flooding before we identify key data for soils. The SEA/SAprocess will utilise the detailed information included in this document alongside other informationas it becomes available.
Rivers, streams and waterways
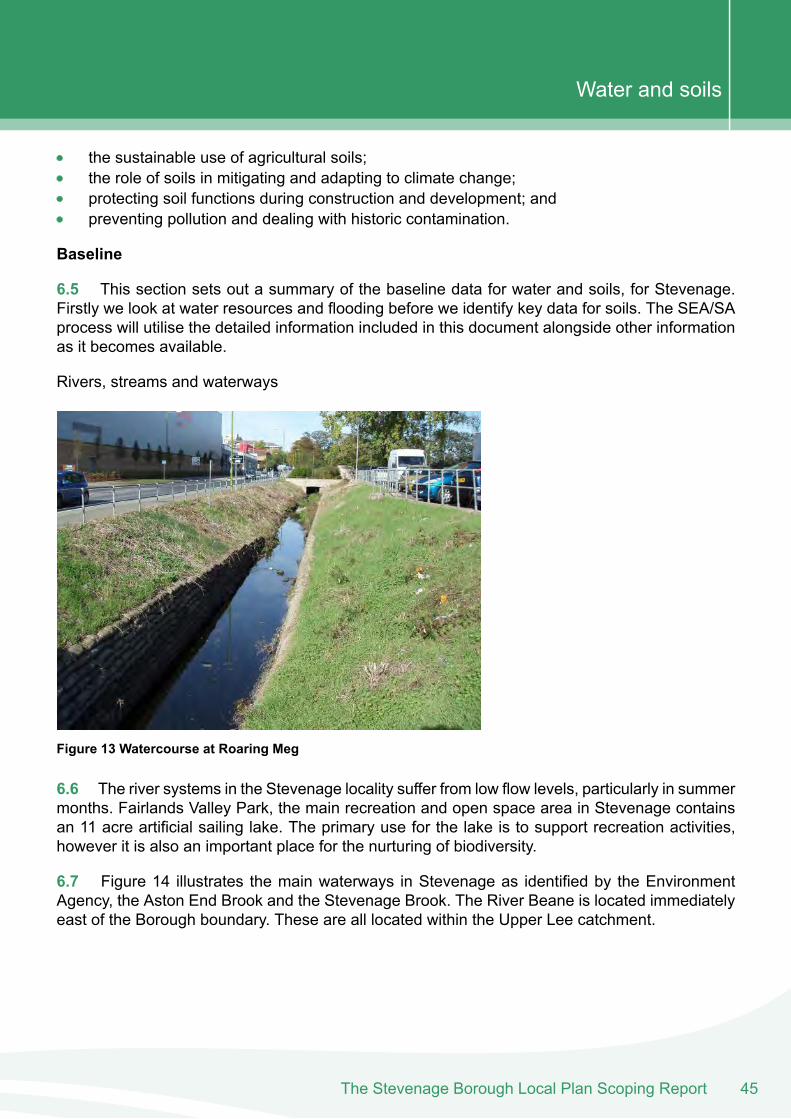
Figure 13 Watercourse at Roaring Meg
6.6 The river systems in the Stevenage locality suffer from low flow levels, particularly in summermonths. Fairlands Valley Park, the main recreation and open space area in Stevenage containsan 11 acre artificial sailing lake. The primary use for the lake is to support recreation activities,however it is also an important place for the nurturing of biodiversity.
6.7 Figure 14 illustrates the main waterways in Stevenage as identified by the EnvironmentAgency, the Aston End Brook and the Stevenage Brook. The River Beane is located immediatelyeast of the Borough boundary. These are all located within the Upper Lee catchment.
45The Stevenage Borough Local Plan Scoping Report
Water and soils
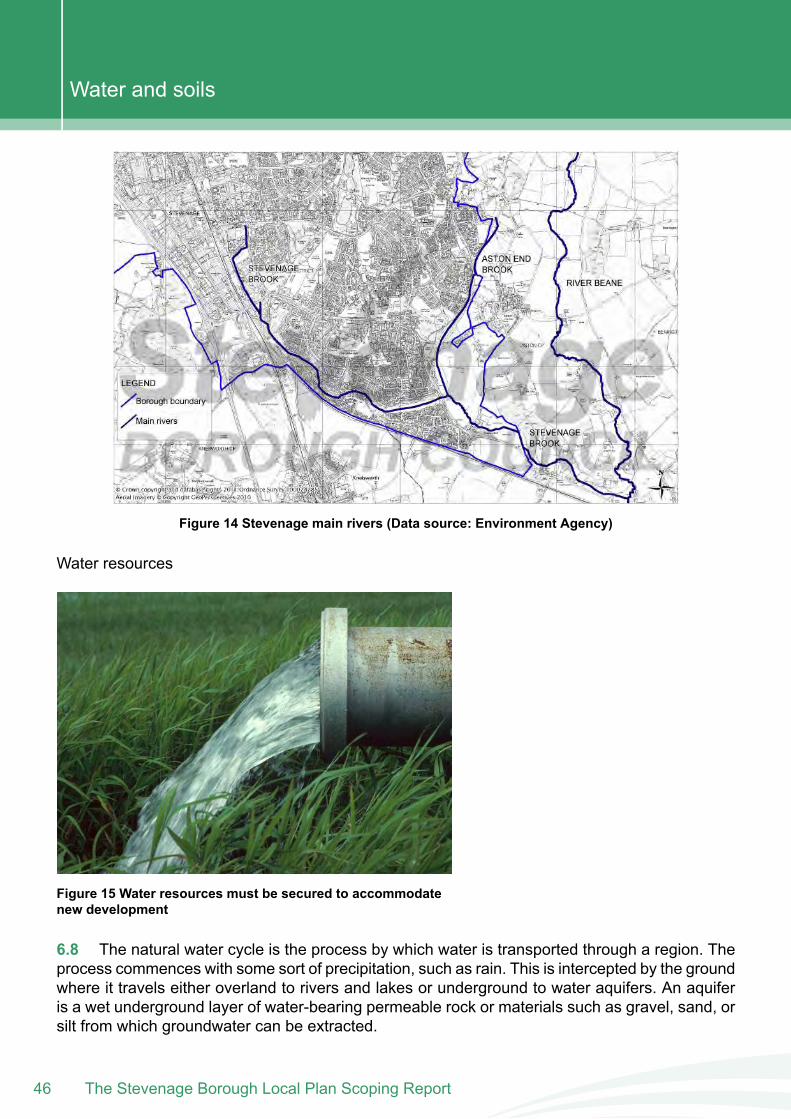
Figure 14 Stevenage main rivers (Data source: Environment Agency)
Water resources
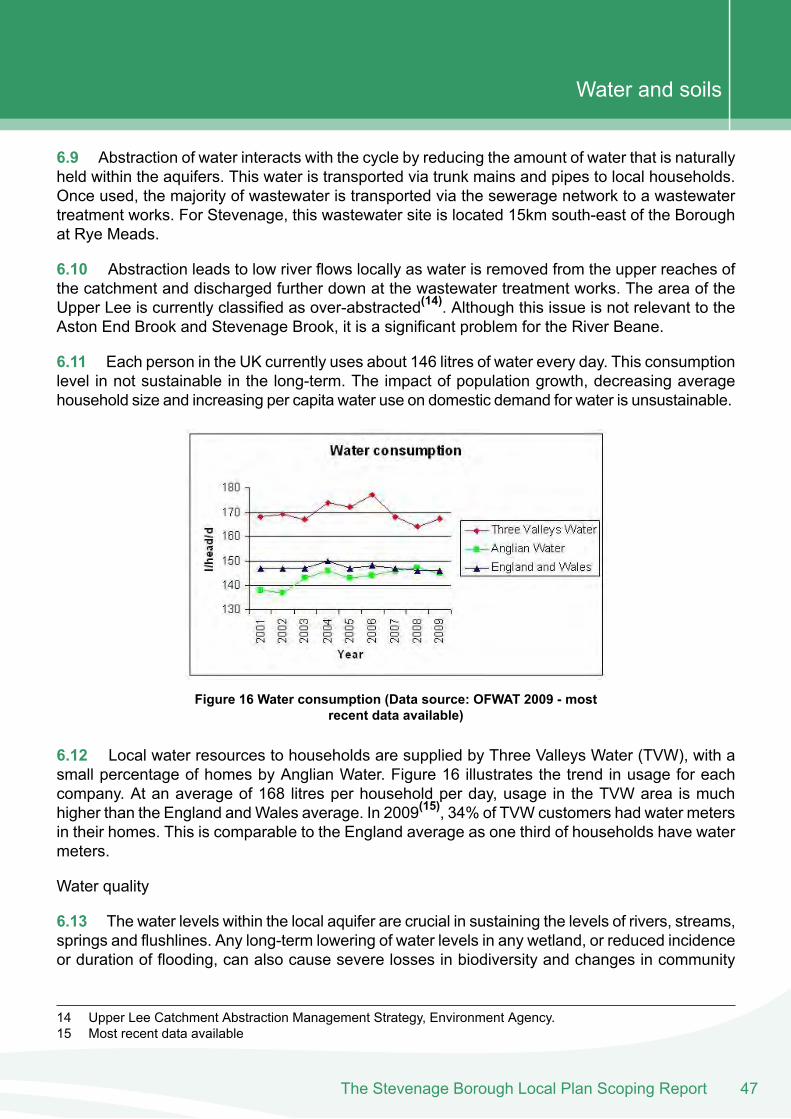
Figure 15 Water resources must be secured to accommodatenew development
6.8 The natural water cycle is the process by which water is transported through a region. Theprocess commences with some sort of precipitation, such as rain. This is intercepted by the groundwhere it travels either overland to rivers and lakes or underground to water aquifers. An aquiferis a wet underground layer of water-bearing permeable rock or materials such as gravel, sand, orsilt from which groundwater can be extracted.
The Stevenage Borough Local Plan Scoping Report46
Water and soils
6.9 Abstraction of water interacts with the cycle by reducing the amount of water that is naturallyheld within the aquifers. This water is transported via trunk mains and pipes to local households.Once used, the majority of wastewater is transported via the sewerage network to a wastewatertreatment works. For Stevenage, this wastewater site is located 15km south-east of the Boroughat Rye Meads.
6.10 Abstraction leads to low river flows locally as water is removed from the upper reaches ofthe catchment and discharged further down at the wastewater treatment works. The area of theUpper Lee is currently classified as over-abstracted(14). Although this issue is not relevant to theAston End Brook and Stevenage Brook, it is a significant problem for the River Beane.
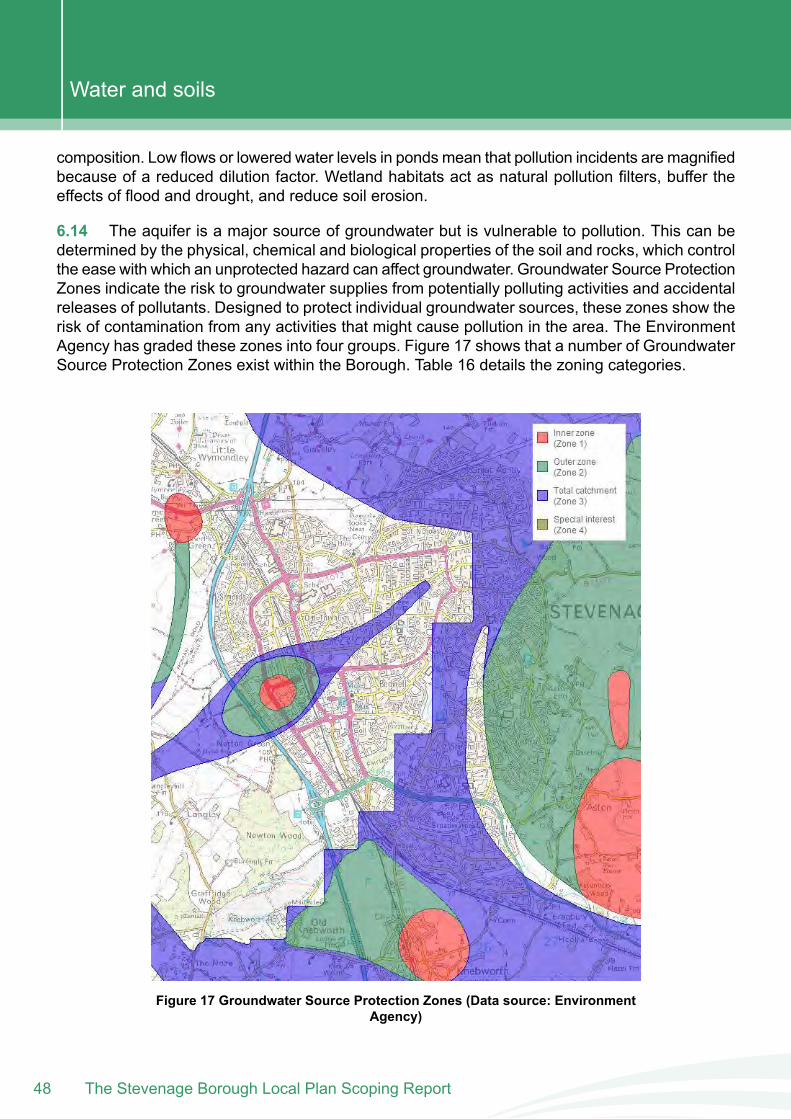
6.11 Each person in the UK currently uses about 146 litres of water every day. This consumptionlevel in not sustainable in the long-term. The impact of population growth, decreasing averagehousehold size and increasing per capita water use on domestic demand for water is unsustainable.
Figure 16 Water consumption (Data source: OFWAT 2009 - mostrecent data available)
6.12 Local water resources to households are supplied by Three Valleys Water (TVW), with asmall percentage of homes by Anglian Water. Figure 16 illustrates the trend in usage for eachcompany. At an average of 168 litres per household per day, usage in the TVW area is muchhigher than the England andWales average. In 2009(15), 34% of TVW customers had water metersin their homes. This is comparable to the England average as one third of households have watermeters.
Water quality
6.13 The water levels within the local aquifer are crucial in sustaining the levels of rivers, streams,springs and flushlines. Any long-term lowering of water levels in any wetland, or reduced incidenceor duration of flooding, can also cause severe losses in biodiversity and changes in community
14 Upper Lee Catchment Abstraction Management Strategy, Environment Agency.15 Most recent data available
47The Stevenage Borough Local Plan Scoping Report
Water and soils
composition. Low flows or lowered water levels in ponds mean that pollution incidents are magnifiedbecause of a reduced dilution factor. Wetland habitats act as natural pollution filters, buffer theeffects of flood and drought, and reduce soil erosion.
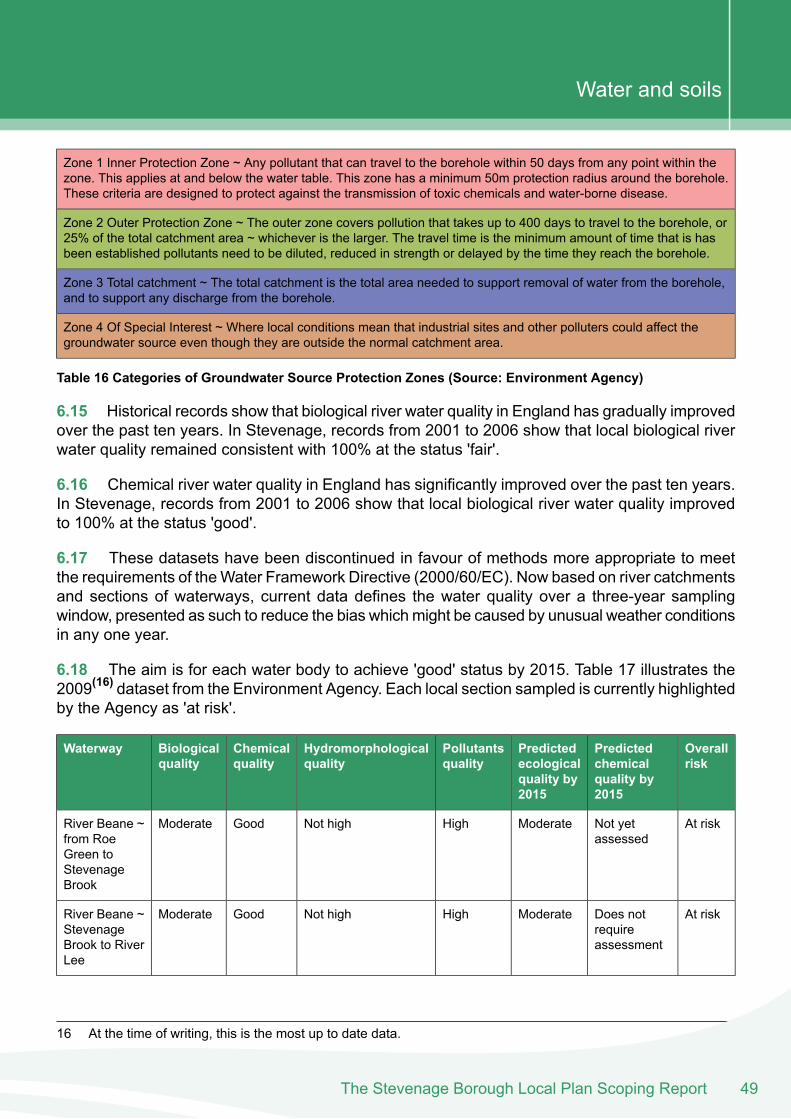
6.14 The aquifer is a major source of groundwater but is vulnerable to pollution. This can bedetermined by the physical, chemical and biological properties of the soil and rocks, which controlthe ease with which an unprotected hazard can affect groundwater. Groundwater Source ProtectionZones indicate the risk to groundwater supplies from potentially polluting activities and accidentalreleases of pollutants. Designed to protect individual groundwater sources, these zones show therisk of contamination from any activities that might cause pollution in the area. The EnvironmentAgency has graded these zones into four groups. Figure 17 shows that a number of GroundwaterSource Protection Zones exist within the Borough. Table 16 details the zoning categories.
Figure 17 Groundwater Source Protection Zones (Data source: EnvironmentAgency)
The Stevenage Borough Local Plan Scoping Report48
Water and soils
Zone 1 Inner Protection Zone ~ Any pollutant that can travel to the borehole within 50 days from any point within thezone. This applies at and below the water table. This zone has a minimum 50m protection radius around the borehole.These criteria are designed to protect against the transmission of toxic chemicals and water-borne disease.
Zone 2 Outer Protection Zone ~ The outer zone covers pollution that takes up to 400 days to travel to the borehole, or25% of the total catchment area ~ whichever is the larger. The travel time is the minimum amount of time that is hasbeen established pollutants need to be diluted, reduced in strength or delayed by the time they reach the borehole.
Zone 3 Total catchment ~ The total catchment is the total area needed to support removal of water from the borehole,and to support any discharge from the borehole.
Zone 4 Of Special Interest ~ Where local conditions mean that industrial sites and other polluters could affect thegroundwater source even though they are outside the normal catchment area.
Table 16 Categories of Groundwater Source Protection Zones (Source: Environment Agency)
6.15 Historical records show that biological river water quality in England has gradually improvedover the past ten years. In Stevenage, records from 2001 to 2006 show that local biological riverwater quality remained consistent with 100% at the status 'fair'.
6.16 Chemical river water quality in England has significantly improved over the past ten years.In Stevenage, records from 2001 to 2006 show that local biological river water quality improvedto 100% at the status 'good'.
6.17 These datasets have been discontinued in favour of methods more appropriate to meetthe requirements of theWater Framework Directive (2000/60/EC). Now based on river catchmentsand sections of waterways, current data defines the water quality over a three-year samplingwindow, presented as such to reduce the bias whichmight be caused by unusual weather conditionsin any one year.
6.18 The aim is for each water body to achieve 'good' status by 2015. Table 17 illustrates the2009(16) dataset from the Environment Agency. Each local section sampled is currently highlightedby the Agency as 'at risk'.
Overallrisk
Predictedchemicalquality by2015
Predictedecologicalquality by2015
Pollutantsquality
Hydromorphologicalquality
Chemicalquality
Biologicalquality
Waterway
At riskNot yetassessed
ModerateHighNot highGoodModerateRiver Beane ~from RoeGreen toStevenageBrook
At riskDoes notrequireassessment
ModerateHighNot highGoodModerateRiver Beane ~StevenageBrook to RiverLee
16 At the time of writing, this is the most up to date data.
49The Stevenage Borough Local Plan Scoping Report
Water and soils
Overallrisk
Predictedchemicalquality by2015
Predictedecologicalquality by2015
Pollutantsquality
Hydromorphologicalquality
Chemicalquality
Biologicalquality
Waterway
At riskDoes notrequireassessment
ModerateHighNot highModerateModerateStevenageBrook
Table 17 Stevenage water quality (Data source: Environment Agency, 2009)
Flooding
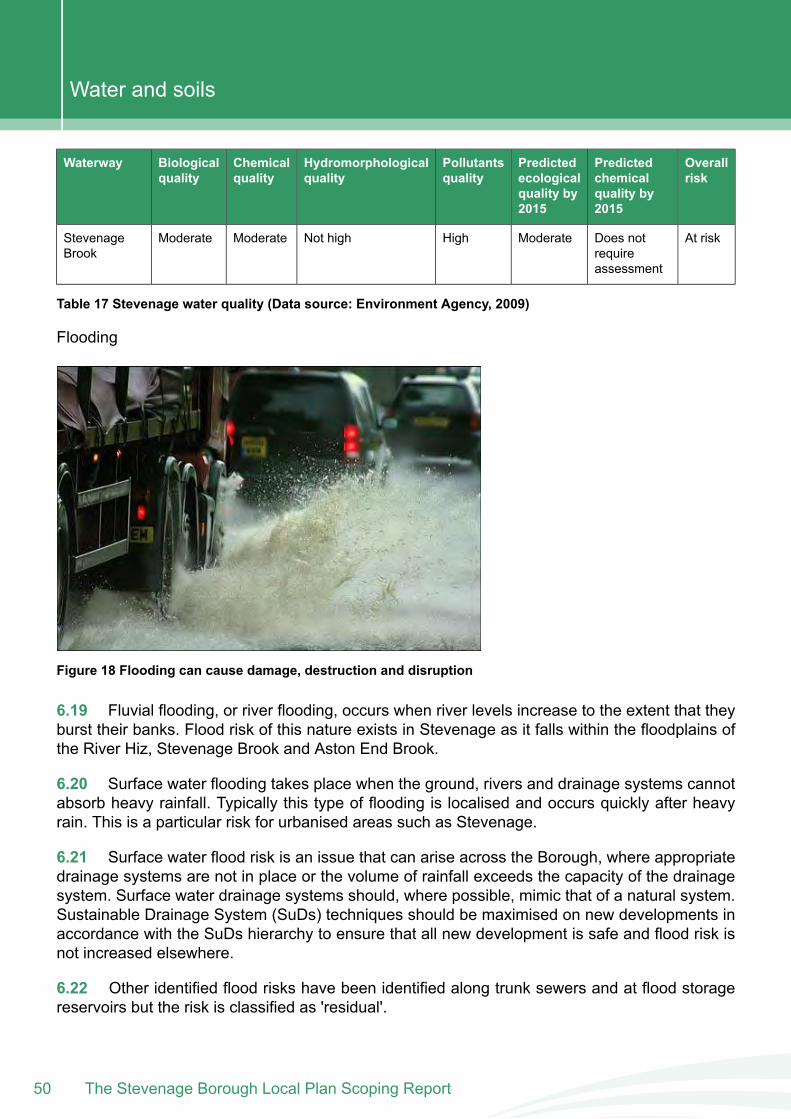
Figure 18 Flooding can cause damage, destruction and disruption
6.19 Fluvial flooding, or river flooding, occurs when river levels increase to the extent that theyburst their banks. Flood risk of this nature exists in Stevenage as it falls within the floodplains ofthe River Hiz, Stevenage Brook and Aston End Brook.
6.20 Surface water flooding takes place when the ground, rivers and drainage systems cannotabsorb heavy rainfall. Typically this type of flooding is localised and occurs quickly after heavyrain. This is a particular risk for urbanised areas such as Stevenage.
6.21 Surface water flood risk is an issue that can arise across the Borough, where appropriatedrainage systems are not in place or the volume of rainfall exceeds the capacity of the drainagesystem. Surface water drainage systems should, where possible, mimic that of a natural system.Sustainable Drainage System (SuDs) techniques should be maximised on new developments inaccordance with the SuDs hierarchy to ensure that all new development is safe and flood risk isnot increased elsewhere.
6.22 Other identified flood risks have been identified along trunk sewers and at flood storagereservoirs but the risk is classified as 'residual'.
The Stevenage Borough Local Plan Scoping Report50
Water and soils
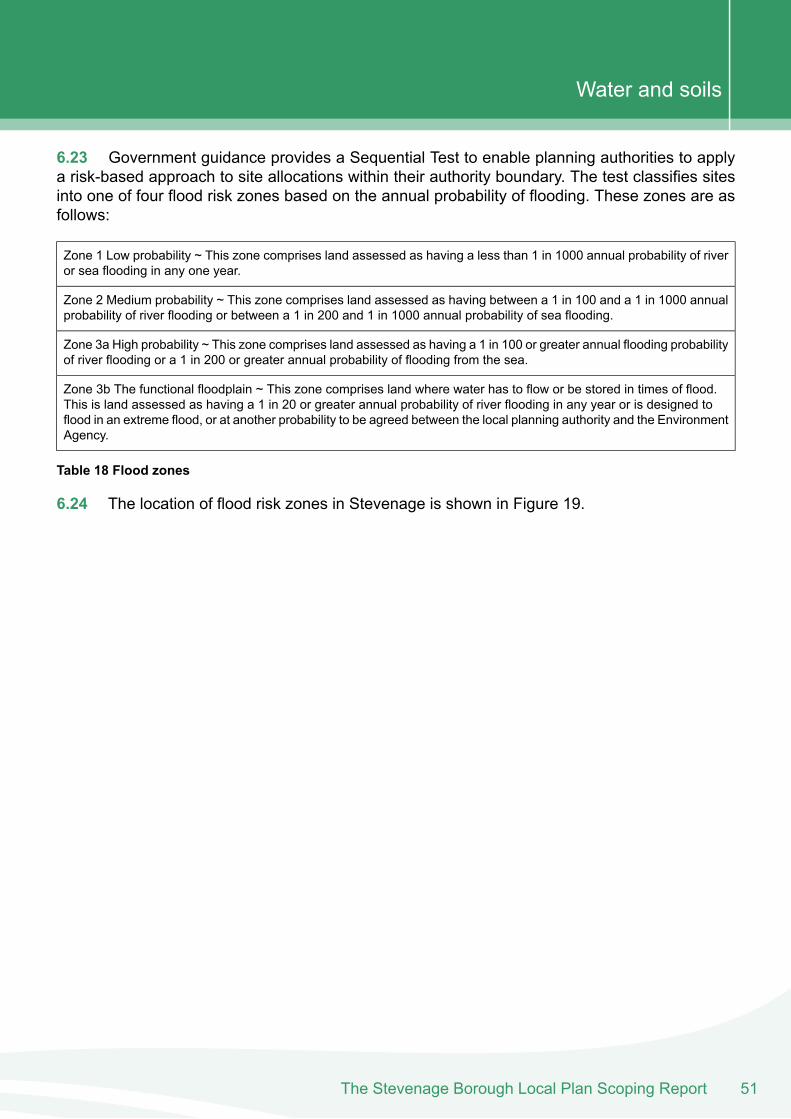
6.23 Government guidance provides a Sequential Test to enable planning authorities to applya risk-based approach to site allocations within their authority boundary. The test classifies sitesinto one of four flood risk zones based on the annual probability of flooding. These zones are asfollows:
Zone 1 Low probability ~ This zone comprises land assessed as having a less than 1 in 1000 annual probability of riveror sea flooding in any one year.
Zone 2 Medium probability ~ This zone comprises land assessed as having between a 1 in 100 and a 1 in 1000 annualprobability of river flooding or between a 1 in 200 and 1 in 1000 annual probability of sea flooding.
Zone 3a High probability ~ This zone comprises land assessed as having a 1 in 100 or greater annual flooding probabilityof river flooding or a 1 in 200 or greater annual probability of flooding from the sea.
Zone 3b The functional floodplain ~ This zone comprises land where water has to flow or be stored in times of flood.This is land assessed as having a 1 in 20 or greater annual probability of river flooding in any year or is designed toflood in an extreme flood, or at another probability to be agreed between the local planning authority and the EnvironmentAgency.
Table 18 Flood zones
6.24 The location of flood risk zones in Stevenage is shown in Figure 19.
51The Stevenage Borough Local Plan Scoping Report
Water and soils
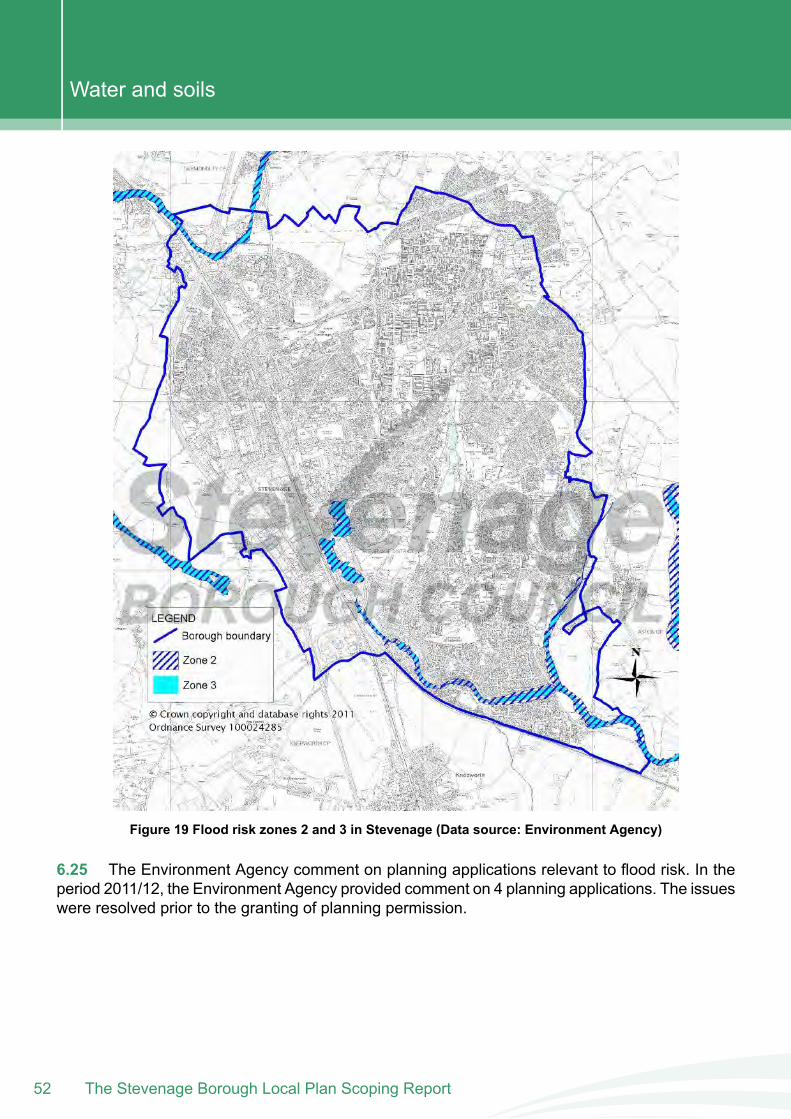
Figure 19 Flood risk zones 2 and 3 in Stevenage (Data source: Environment Agency)
6.25 The Environment Agency comment on planning applications relevant to flood risk. In theperiod 2011/12, the Environment Agency provided comment on 4 planning applications. The issueswere resolved prior to the granting of planning permission.
The Stevenage Borough Local Plan Scoping Report52
Water and soils
Soil
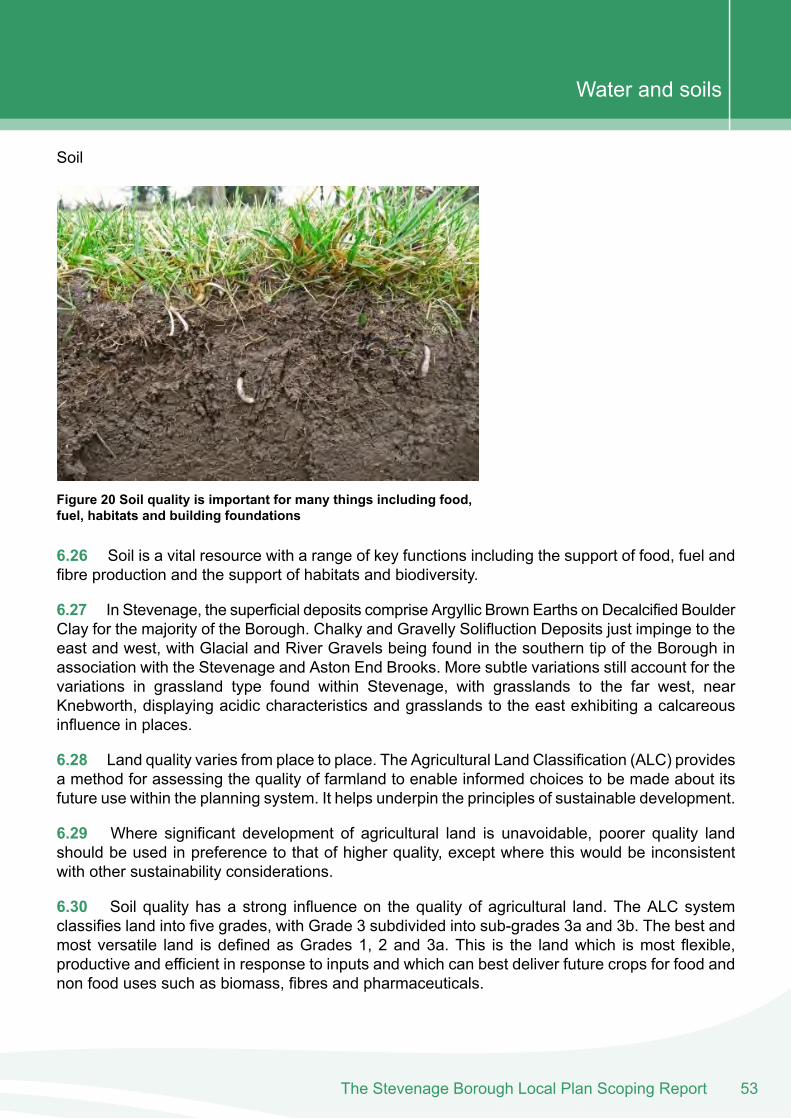
Figure 20 Soil quality is important for many things including food,fuel, habitats and building foundations
6.26 Soil is a vital resource with a range of key functions including the support of food, fuel andfibre production and the support of habitats and biodiversity.
6.27 In Stevenage, the superficial deposits comprise Argyllic Brown Earths on Decalcified BoulderClay for the majority of the Borough. Chalky and Gravelly Solifluction Deposits just impinge to theeast and west, with Glacial and River Gravels being found in the southern tip of the Borough inassociation with the Stevenage and Aston End Brooks. More subtle variations still account for thevariations in grassland type found within Stevenage, with grasslands to the far west, nearKnebworth, displaying acidic characteristics and grasslands to the east exhibiting a calcareousinfluence in places.
6.28 Land quality varies from place to place. The Agricultural Land Classification (ALC) providesa method for assessing the quality of farmland to enable informed choices to be made about itsfuture use within the planning system. It helps underpin the principles of sustainable development.
6.29 Where significant development of agricultural land is unavoidable, poorer quality landshould be used in preference to that of higher quality, except where this would be inconsistentwith other sustainability considerations.
6.30 Soil quality has a strong influence on the quality of agricultural land. The ALC systemclassifies land into five grades, with Grade 3 subdivided into sub-grades 3a and 3b. The best andmost versatile land is defined as Grades 1, 2 and 3a. This is the land which is most flexible,productive and efficient in response to inputs and which can best deliver future crops for food andnon food uses such as biomass, fibres and pharmaceuticals.
53The Stevenage Borough Local Plan Scoping Report
Water and soils
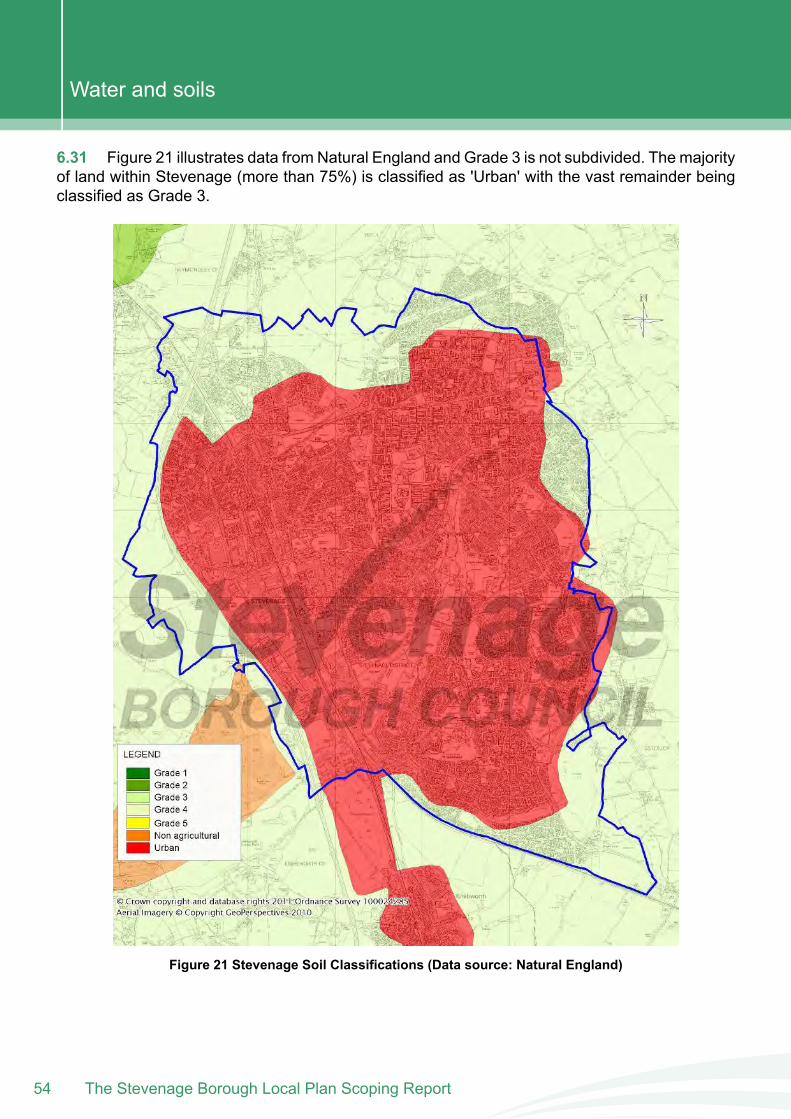
6.31 Figure 21 illustrates data from Natural England and Grade 3 is not subdivided. The majorityof land within Stevenage (more than 75%) is classified as 'Urban' with the vast remainder beingclassified as Grade 3.
Figure 21 Stevenage Soil Classifications (Data source: Natural England)
The Stevenage Borough Local Plan Scoping Report54
Water and soils
Data gaps
6.32 The following gaps have been identified in the baseline data:
Up to date data on water consumption;Localised incidents of surface water flooding;Subdivision of Grade 3 soil quality.
Key issues
6.33 Box 3 presents the key issues for the water and soils theme in Stevenage.
Box 3: Key issues for water and soils
Stevenage Brook falls within scope of UKBAP Priority Habitat Description for Rivers.Low flow levels in local river systems.Local sections of waterways are classified as 'at risk'.Local aquifer is over-abstracted.Higher than average household water consumption.Groundwater vulnerable to pollution.Localised areas susceptible to fluvial flooding.Surface water flooding risk due to urbanised location.Areas susceptible to flooding should be avoided for development where more suitablealternatives exist.Better quality soils should be avoided for development where suitable lower gradealternatives exist.The urban nature of the Borough will provide a number of PDL sites. Land contaminationat sites previously used for industrial purposes must be considered.
55The Stevenage Borough Local Plan Scoping Report
Water and soils
The Stevenage Borough Local Plan Scoping Report56
Water and soils

7 . Air QualityThe Stevenage Borough Local Plan Scoping Report
7 Air Quality
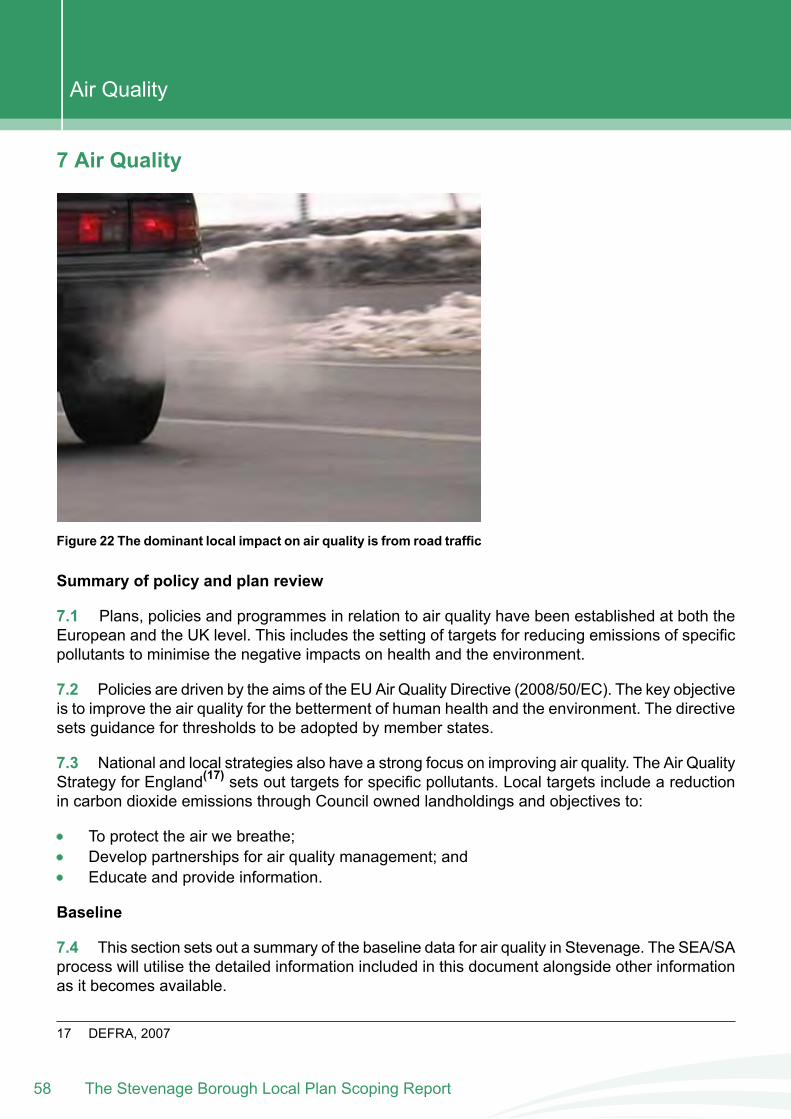
Figure 22 The dominant local impact on air quality is from road traffic
Summary of policy and plan review
7.1 Plans, policies and programmes in relation to air quality have been established at both theEuropean and the UK level. This includes the setting of targets for reducing emissions of specificpollutants to minimise the negative impacts on health and the environment.
7.2 Policies are driven by the aims of the EU Air Quality Directive (2008/50/EC). The key objectiveis to improve the air quality for the betterment of human health and the environment. The directivesets guidance for thresholds to be adopted by member states.
7.3 National and local strategies also have a strong focus on improving air quality. The Air QualityStrategy for England(17) sets out targets for specific pollutants. Local targets include a reductionin carbon dioxide emissions through Council owned landholdings and objectives to:
To protect the air we breathe;Develop partnerships for air quality management; andEducate and provide information.
Baseline
7.4 This section sets out a summary of the baseline data for air quality in Stevenage. The SEA/SAprocess will utilise the detailed information included in this document alongside other informationas it becomes available.
17 DEFRA, 2007
The Stevenage Borough Local Plan Scoping Report58
Air Quality
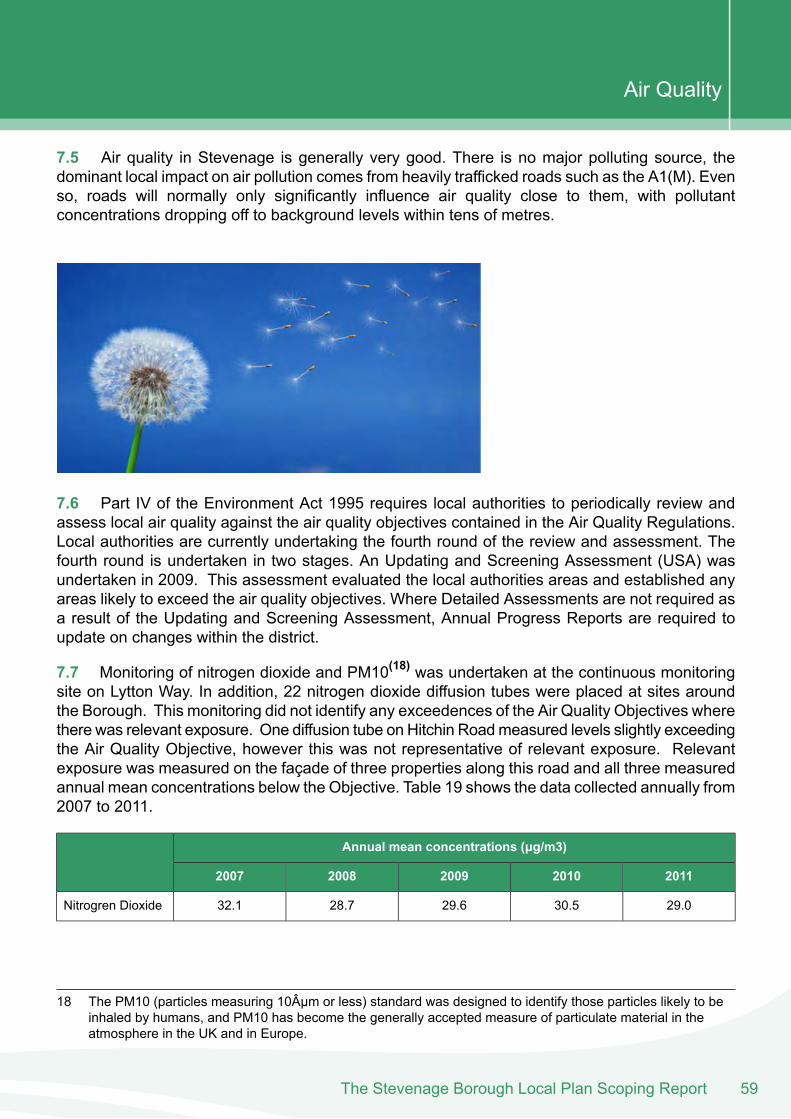
7.5 Air quality in Stevenage is generally very good. There is no major polluting source, thedominant local impact on air pollution comes from heavily trafficked roads such as the A1(M). Evenso, roads will normally only significantly influence air quality close to them, with pollutantconcentrations dropping off to background levels within tens of metres.
7.6 Part IV of the Environment Act 1995 requires local authorities to periodically review andassess local air quality against the air quality objectives contained in the Air Quality Regulations.Local authorities are currently undertaking the fourth round of the review and assessment. Thefourth round is undertaken in two stages. An Updating and Screening Assessment (USA) wasundertaken in 2009. This assessment evaluated the local authorities areas and established anyareas likely to exceed the air quality objectives. Where Detailed Assessments are not required asa result of the Updating and Screening Assessment, Annual Progress Reports are required toupdate on changes within the district.
7.7 Monitoring of nitrogen dioxide and PM10(18) was undertaken at the continuous monitoringsite on Lytton Way. In addition, 22 nitrogen dioxide diffusion tubes were placed at sites aroundthe Borough. This monitoring did not identify any exceedences of the Air Quality Objectives wherethere was relevant exposure. One diffusion tube on Hitchin Roadmeasured levels slightly exceedingthe Air Quality Objective, however this was not representative of relevant exposure. Relevantexposure was measured on the façade of three properties along this road and all three measuredannual mean concentrations below the Objective. Table 19 shows the data collected annually from2007 to 2011.
Annual mean concentrations (μg/m3)
20112010200920082007
29.030.529.628.732.1Nitrogren Dioxide
18 The PM10 (particles measuring 10Âμm or less) standard was designed to identify those particles likely to beinhaled by humans, and PM10 has become the generally accepted measure of particulate material in theatmosphere in the UK and in Europe.
59The Stevenage Borough Local Plan Scoping Report
Air Quality
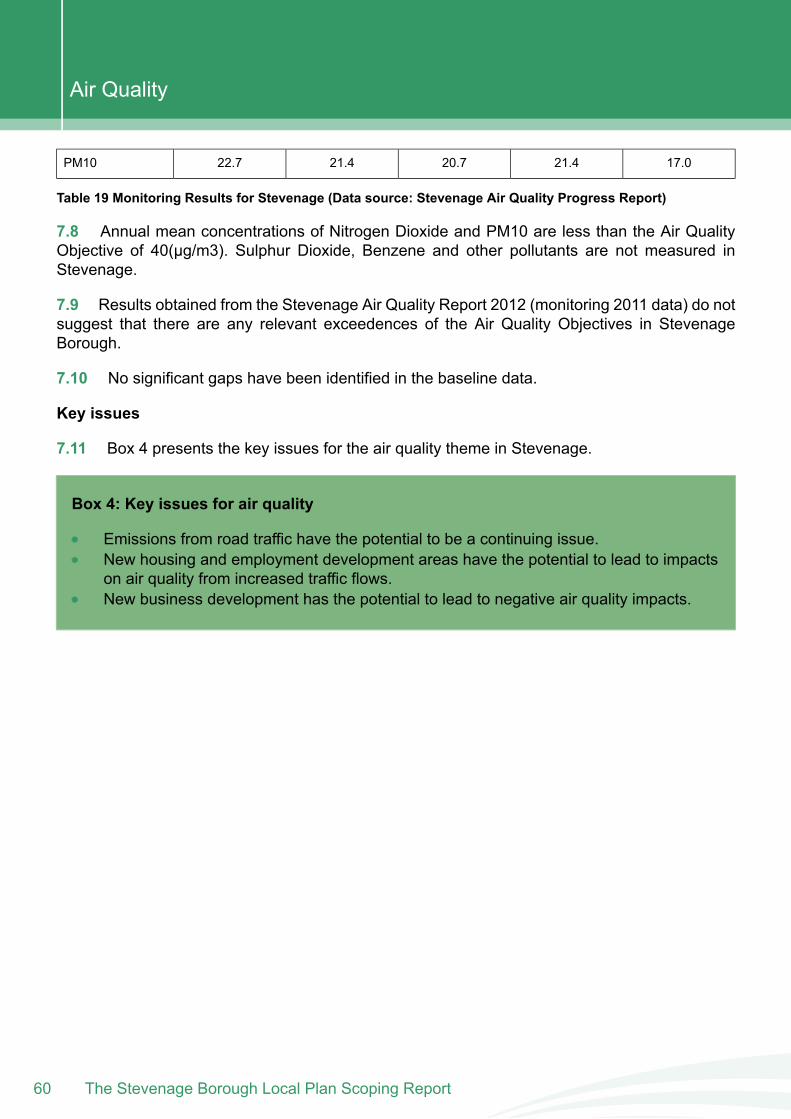
17.021.420.721.422.7PM10
Table 19 Monitoring Results for Stevenage (Data source: Stevenage Air Quality Progress Report)
7.8 Annual mean concentrations of Nitrogen Dioxide and PM10 are less than the Air QualityObjective of 40(μg/m3). Sulphur Dioxide, Benzene and other pollutants are not measured inStevenage.
7.9 Results obtained from the Stevenage Air Quality Report 2012 (monitoring 2011 data) do notsuggest that there are any relevant exceedences of the Air Quality Objectives in StevenageBorough.
7.10 No significant gaps have been identified in the baseline data.
Key issues
7.11 Box 4 presents the key issues for the air quality theme in Stevenage.
Box 4: Key issues for air quality
Emissions from road traffic have the potential to be a continuing issue.New housing and employment development areas have the potential to lead to impactson air quality from increased traffic flows.New business development has the potential to lead to negative air quality impacts.
The Stevenage Borough Local Plan Scoping Report60
Air Quality

8 . Climatic factorsThe Stevenage Borough Local Plan Scoping Report
8 Climatic factors
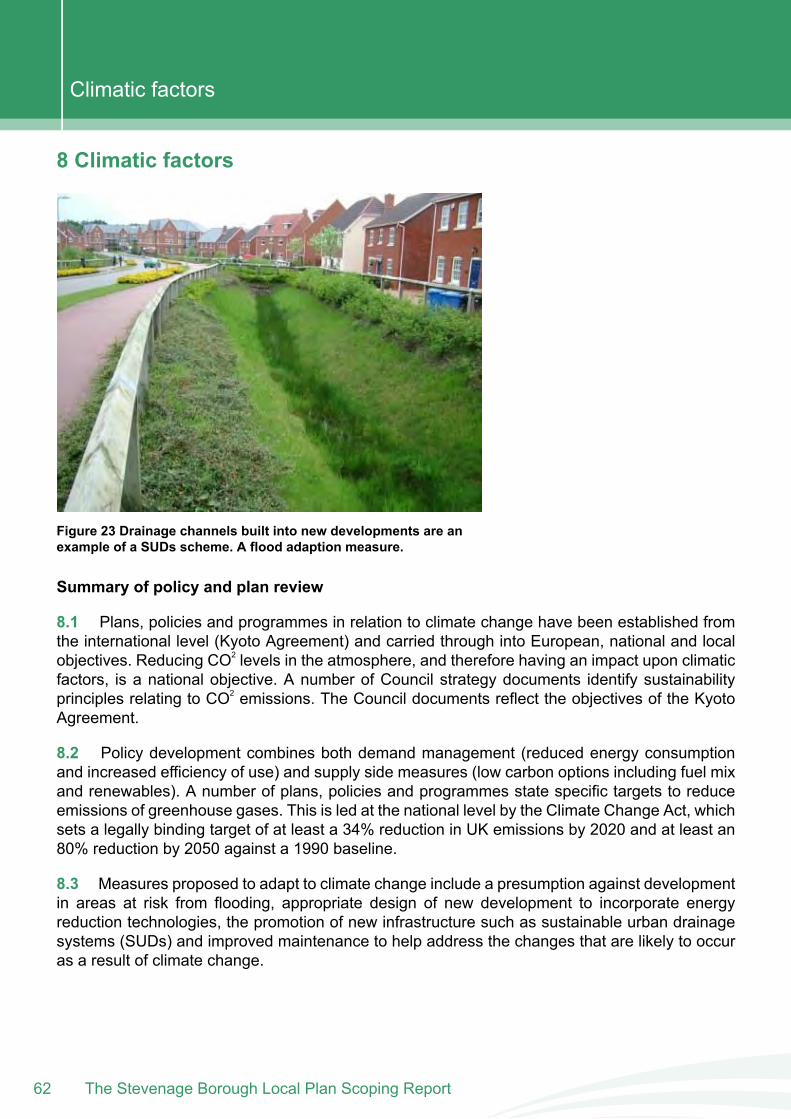
Figure 23 Drainage channels built into new developments are anexample of a SUDs scheme. A flood adaption measure.
Summary of policy and plan review
8.1 Plans, policies and programmes in relation to climate change have been established fromthe international level (Kyoto Agreement) and carried through into European, national and localobjectives. Reducing CO2 levels in the atmosphere, and therefore having an impact upon climaticfactors, is a national objective. A number of Council strategy documents identify sustainabilityprinciples relating to CO2 emissions. The Council documents reflect the objectives of the KyotoAgreement.
8.2 Policy development combines both demand management (reduced energy consumptionand increased efficiency of use) and supply side measures (low carbon options including fuel mixand renewables). A number of plans, policies and programmes state specific targets to reduceemissions of greenhouse gases. This is led at the national level by the Climate Change Act, whichsets a legally binding target of at least a 34% reduction in UK emissions by 2020 and at least an80% reduction by 2050 against a 1990 baseline.
8.3 Measures proposed to adapt to climate change include a presumption against developmentin areas at risk from flooding, appropriate design of new development to incorporate energyreduction technologies, the promotion of new infrastructure such as sustainable urban drainagesystems (SUDs) and improved maintenance to help address the changes that are likely to occuras a result of climate change.
The Stevenage Borough Local Plan Scoping Report62
Climatic factors
8.4 The Stevenage Climate Change Strategy seeks to achieve six key objectives through asupplementary Action Plan. This strategy promotes working partnerships to deliver a reduction inemissions and also a commitment to adapt to climate change. Further details are provided inAppendix 1.
Baseline
8.5 This section sets out a summary of the baseline data for climatic factors in Stevenage. TheSEA/SA process will utilise the detailed information included in this document alongside otherinformation as it becomes available.
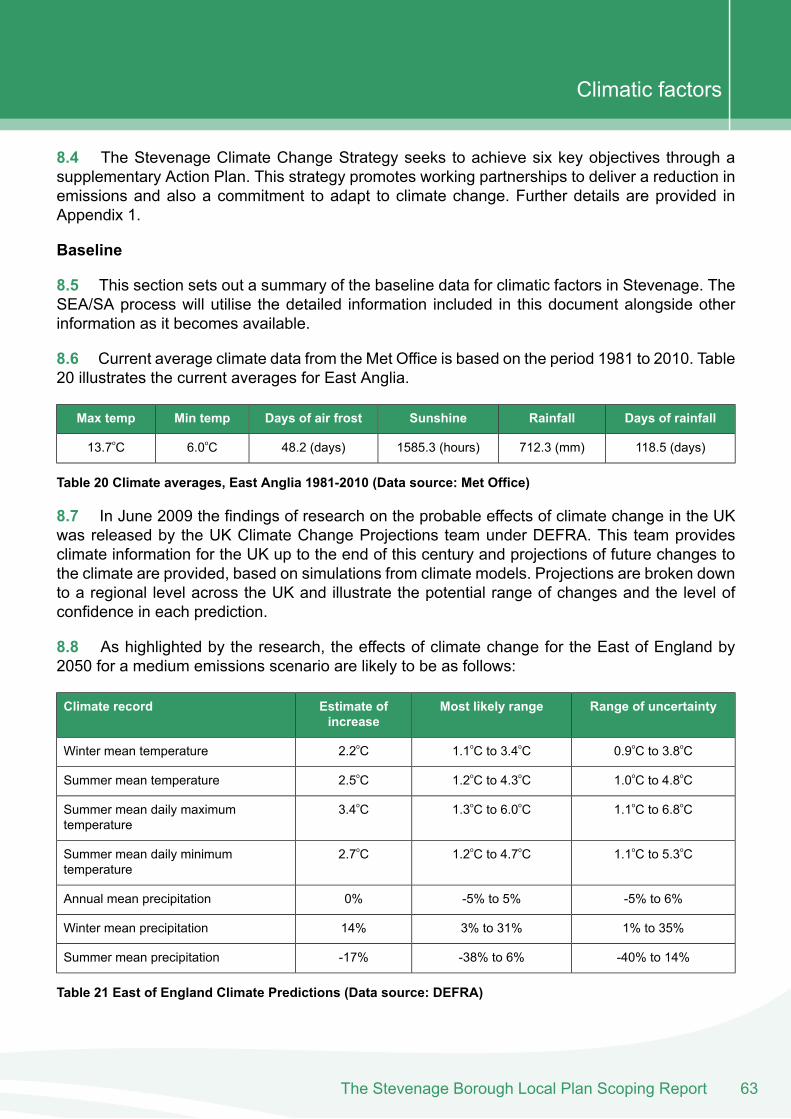
8.6 Current average climate data from the Met Office is based on the period 1981 to 2010. Table20 illustrates the current averages for East Anglia.
Days of rainfallRainfallSunshineDays of air frostMin tempMax temp
118.5 (days)712.3 (mm)1585.3 (hours)48.2 (days)6.0oC13.7oC
Table 20 Climate averages, East Anglia 1981-2010 (Data source: Met Office)
8.7 In June 2009 the findings of research on the probable effects of climate change in the UKwas released by the UK Climate Change Projections team under DEFRA. This team providesclimate information for the UK up to the end of this century and projections of future changes tothe climate are provided, based on simulations from climate models. Projections are broken downto a regional level across the UK and illustrate the potential range of changes and the level ofconfidence in each prediction.
8.8 As highlighted by the research, the effects of climate change for the East of England by2050 for a medium emissions scenario are likely to be as follows:
Range of uncertaintyMost likely rangeEstimate ofincrease
Climate record
0.9oC to 3.8oC1.1oC to 3.4oC2.2oCWinter mean temperature
1.0oC to 4.8oC1.2oC to 4.3oC2.5oCSummer mean temperature
1.1oC to 6.8oC1.3oC to 6.0oC3.4oCSummer mean daily maximumtemperature
1.1oC to 5.3oC1.2oC to 4.7oC2.7oCSummer mean daily minimumtemperature
-5% to 6%-5% to 5%0%Annual mean precipitation
1% to 35%3% to 31%14%Winter mean precipitation
-40% to 14%-38% to 6%-17%Summer mean precipitation
Table 21 East of England Climate Predictions (Data source: DEFRA)
63The Stevenage Borough Local Plan Scoping Report
Climatic factors
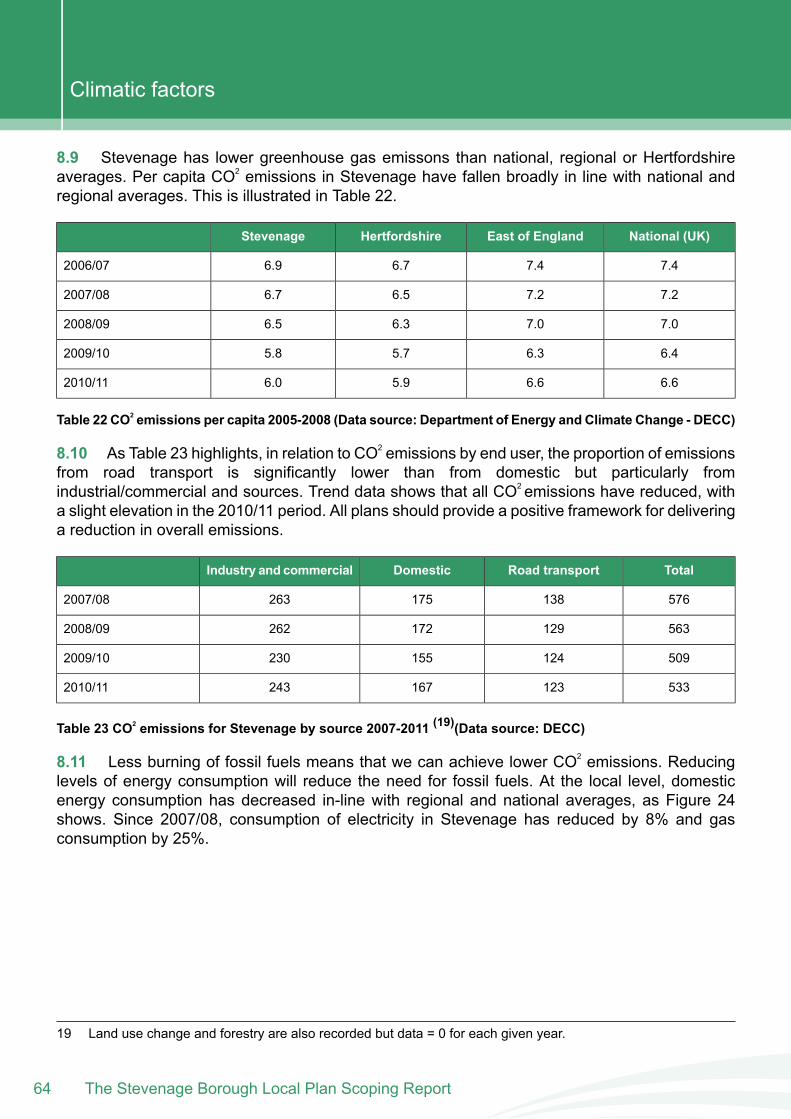
8.9 Stevenage has lower greenhouse gas emissons than national, regional or Hertfordshireaverages. Per capita CO2 emissions in Stevenage have fallen broadly in line with national andregional averages. This is illustrated in Table 22.
National (UK)East of EnglandHertfordshireStevenage
7.47.46.76.92006/07
7.27.26.56.72007/08
7.07.06.36.52008/09
6.46.35.75.82009/10
6.66.65.96.02010/11
Table 22 CO2 emissions per capita 2005-2008 (Data source: Department of Energy and Climate Change - DECC)
8.10 As Table 23 highlights, in relation to CO2 emissions by end user, the proportion of emissionsfrom road transport is significantly lower than from domestic but particularly fromindustrial/commercial and sources. Trend data shows that all CO2 emissions have reduced, witha slight elevation in the 2010/11 period. All plans should provide a positive framework for deliveringa reduction in overall emissions.
TotalRoad transportDomesticIndustry and commercial
5761381752632007/08
5631291722622008/09
5091241552302009/10
5331231672432010/11
Table 23 CO2 emissions for Stevenage by source 2007-2011 (19)(Data source: DECC)
8.11 Less burning of fossil fuels means that we can achieve lower CO2 emissions. Reducinglevels of energy consumption will reduce the need for fossil fuels. At the local level, domesticenergy consumption has decreased in-line with regional and national averages, as Figure 24shows. Since 2007/08, consumption of electricity in Stevenage has reduced by 8% and gasconsumption by 25%.
19 Land use change and forestry are also recorded but data = 0 for each given year.
The Stevenage Borough Local Plan Scoping Report64
Climatic factors
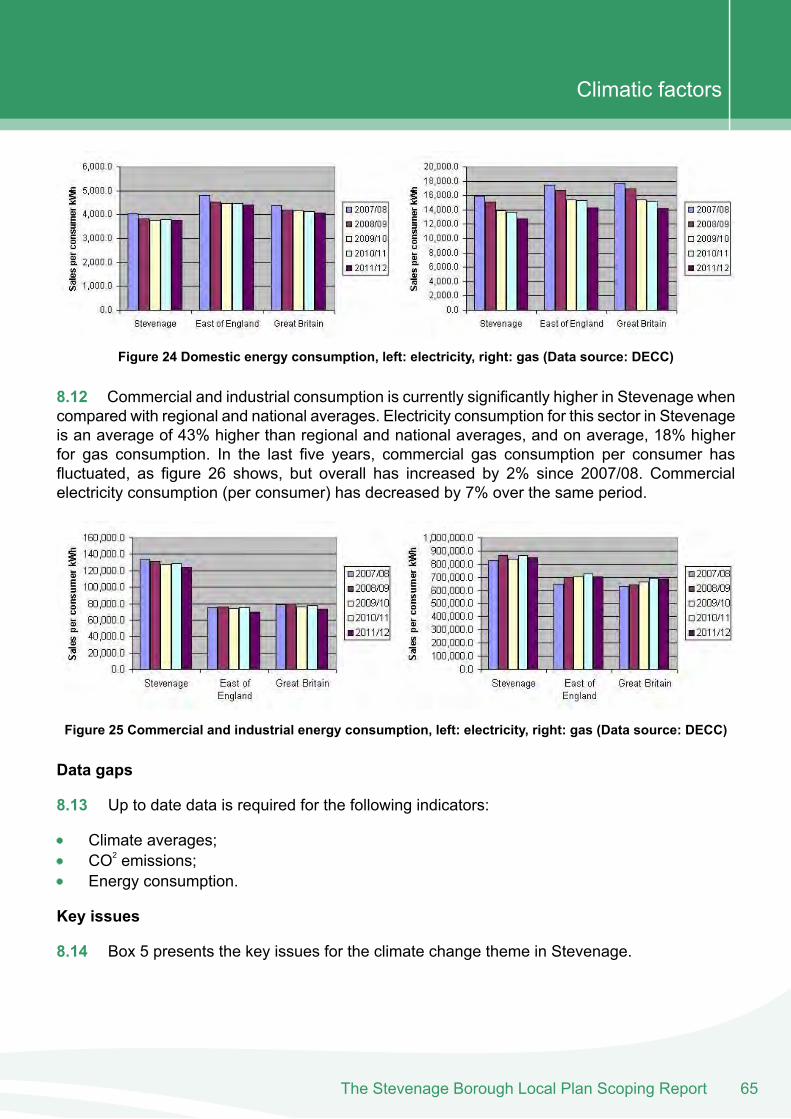
Figure 24 Domestic energy consumption, left: electricity, right: gas (Data source: DECC)
8.12 Commercial and industrial consumption is currently significantly higher in Stevenage whencompared with regional and national averages. Electricity consumption for this sector in Stevenageis an average of 43% higher than regional and national averages, and on average, 18% higherfor gas consumption. In the last five years, commercial gas consumption per consumer hasfluctuated, as figure 26 shows, but overall has increased by 2% since 2007/08. Commercialelectricity consumption (per consumer) has decreased by 7% over the same period.
Figure 25 Commercial and industrial energy consumption, left: electricity, right: gas (Data source: DECC)
Data gaps
8.13 Up to date data is required for the following indicators:
Climate averages;CO2 emissions;Energy consumption.
Key issues
8.14 Box 5 presents the key issues for the climate change theme in Stevenage.
65The Stevenage Borough Local Plan Scoping Report
Climatic factors
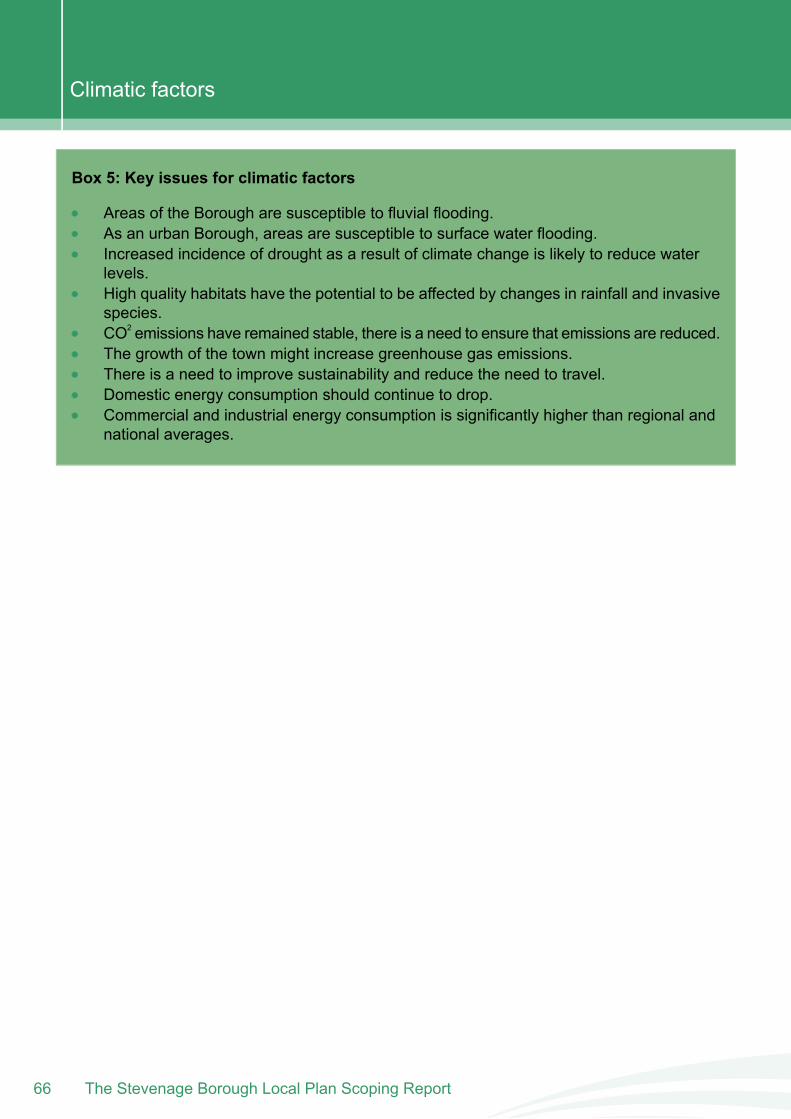
Box 5: Key issues for climatic factors
Areas of the Borough are susceptible to fluvial flooding.As an urban Borough, areas are susceptible to surface water flooding.Increased incidence of drought as a result of climate change is likely to reduce waterlevels.High quality habitats have the potential to be affected by changes in rainfall and invasivespecies.CO2 emissions have remained stable, there is a need to ensure that emissions are reduced.The growth of the town might increase greenhouse gas emissions.There is a need to improve sustainability and reduce the need to travel.Domestic energy consumption should continue to drop.Commercial and industrial energy consumption is significantly higher than regional andnational averages.
The Stevenage Borough Local Plan Scoping Report66
Climatic factors

9 . Material assetsThe Stevenage Borough Local Plan Scoping Report
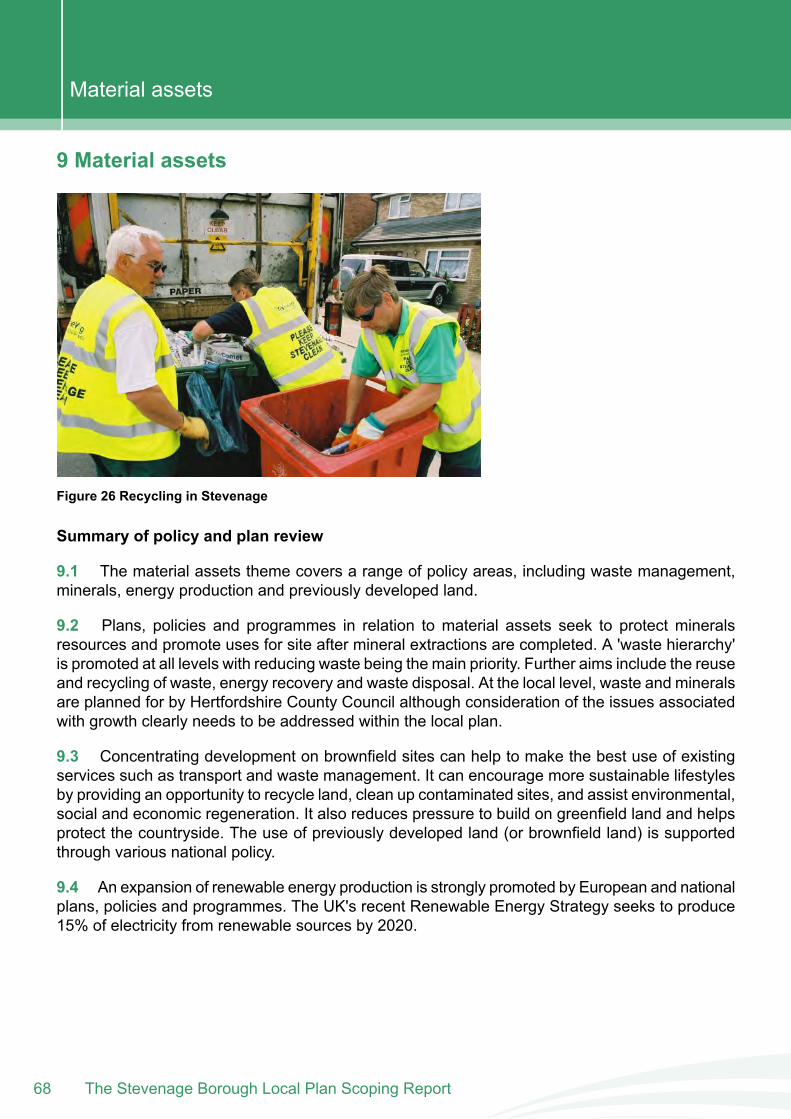
9 Material assets
Figure 26 Recycling in Stevenage
Summary of policy and plan review
9.1 The material assets theme covers a range of policy areas, including waste management,minerals, energy production and previously developed land.
9.2 Plans, policies and programmes in relation to material assets seek to protect mineralsresources and promote uses for site after mineral extractions are completed. A 'waste hierarchy'is promoted at all levels with reducing waste being the main priority. Further aims include the reuseand recycling of waste, energy recovery and waste disposal. At the local level, waste and mineralsare planned for by Hertfordshire County Council although consideration of the issues associatedwith growth clearly needs to be addressed within the local plan.
9.3 Concentrating development on brownfield sites can help to make the best use of existingservices such as transport and waste management. It can encourage more sustainable lifestylesby providing an opportunity to recycle land, clean up contaminated sites, and assist environmental,social and economic regeneration. It also reduces pressure to build on greenfield land and helpsprotect the countryside. The use of previously developed land (or brownfield land) is supportedthrough various national policy.
9.4 An expansion of renewable energy production is strongly promoted by European and nationalplans, policies and programmes. The UK's recent Renewable Energy Strategy seeks to produce15% of electricity from renewable sources by 2020.
The Stevenage Borough Local Plan Scoping Report68
Material assets
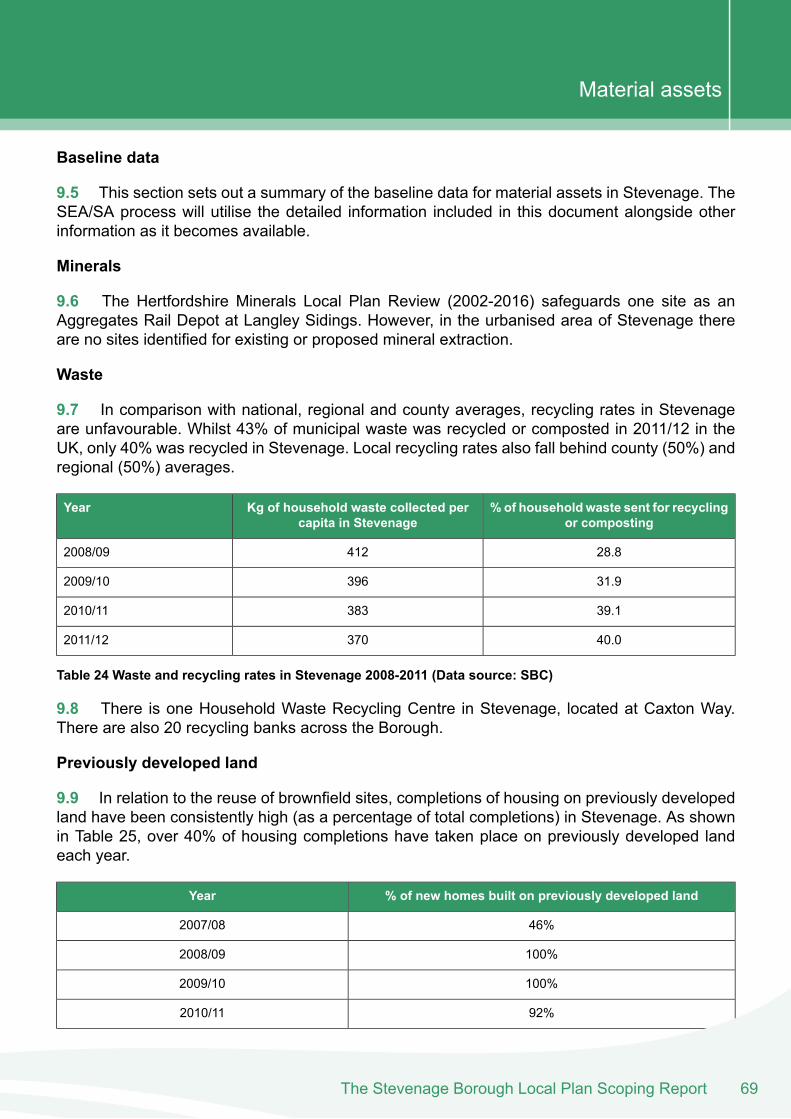
Baseline data
9.5 This section sets out a summary of the baseline data for material assets in Stevenage. TheSEA/SA process will utilise the detailed information included in this document alongside otherinformation as it becomes available.
Minerals
9.6 The Hertfordshire Minerals Local Plan Review (2002-2016) safeguards one site as anAggregates Rail Depot at Langley Sidings. However, in the urbanised area of Stevenage thereare no sites identified for existing or proposed mineral extraction.
Waste
9.7 In comparison with national, regional and county averages, recycling rates in Stevenageare unfavourable. Whilst 43% of municipal waste was recycled or composted in 2011/12 in theUK, only 40% was recycled in Stevenage. Local recycling rates also fall behind county (50%) andregional (50%) averages.
%of household waste sent for recyclingor composting
Kg of household waste collected percapita in Stevenage
Year
28.84122008/09
31.93962009/10
39.13832010/11
40.03702011/12
Table 24 Waste and recycling rates in Stevenage 2008-2011 (Data source: SBC)
9.8 There is one Household Waste Recycling Centre in Stevenage, located at Caxton Way.There are also 20 recycling banks across the Borough.
Previously developed land
9.9 In relation to the reuse of brownfield sites, completions of housing on previously developedland have been consistently high (as a percentage of total completions) in Stevenage. As shownin Table 25, over 40% of housing completions have taken place on previously developed landeach year.
% of new homes built on previously developed landYear
46%2007/08
100%2008/09
100%2009/10
92%2010/11
69The Stevenage Borough Local Plan Scoping Report
Material assets
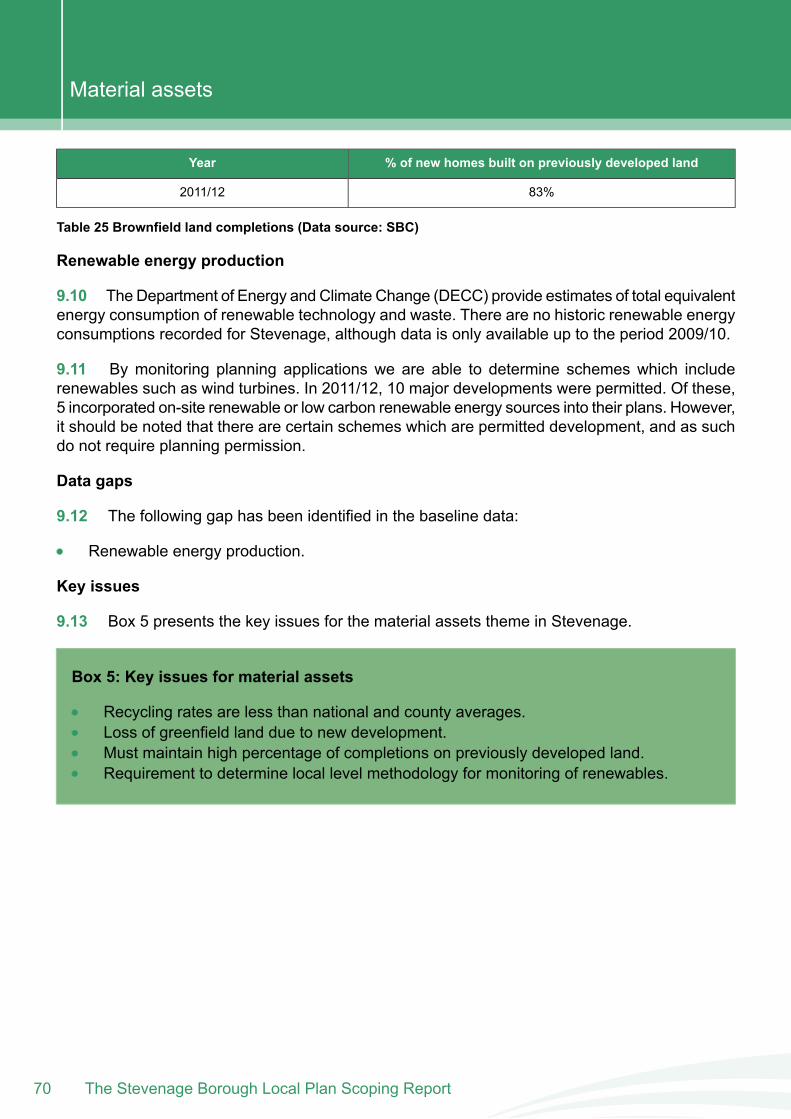
% of new homes built on previously developed landYear
83%2011/12
Table 25 Brownfield land completions (Data source: SBC)
Renewable energy production
9.10 The Department of Energy and Climate Change (DECC) provide estimates of total equivalentenergy consumption of renewable technology and waste. There are no historic renewable energyconsumptions recorded for Stevenage, although data is only available up to the period 2009/10.
9.11 By monitoring planning applications we are able to determine schemes which includerenewables such as wind turbines. In 2011/12, 10 major developments were permitted. Of these,5 incorporated on-site renewable or low carbon renewable energy sources into their plans. However,it should be noted that there are certain schemes which are permitted development, and as suchdo not require planning permission.
Data gaps
9.12 The following gap has been identified in the baseline data:
Renewable energy production.
Key issues
9.13 Box 5 presents the key issues for the material assets theme in Stevenage.
Box 5: Key issues for material assets
Recycling rates are less than national and county averages.Loss of greenfield land due to new development.Must maintain high percentage of completions on previously developed land.Requirement to determine local level methodology for monitoring of renewables.
The Stevenage Borough Local Plan Scoping Report70
Material assets

10 . Cultural heritageThe Stevenage Borough Local Plan Scoping Report
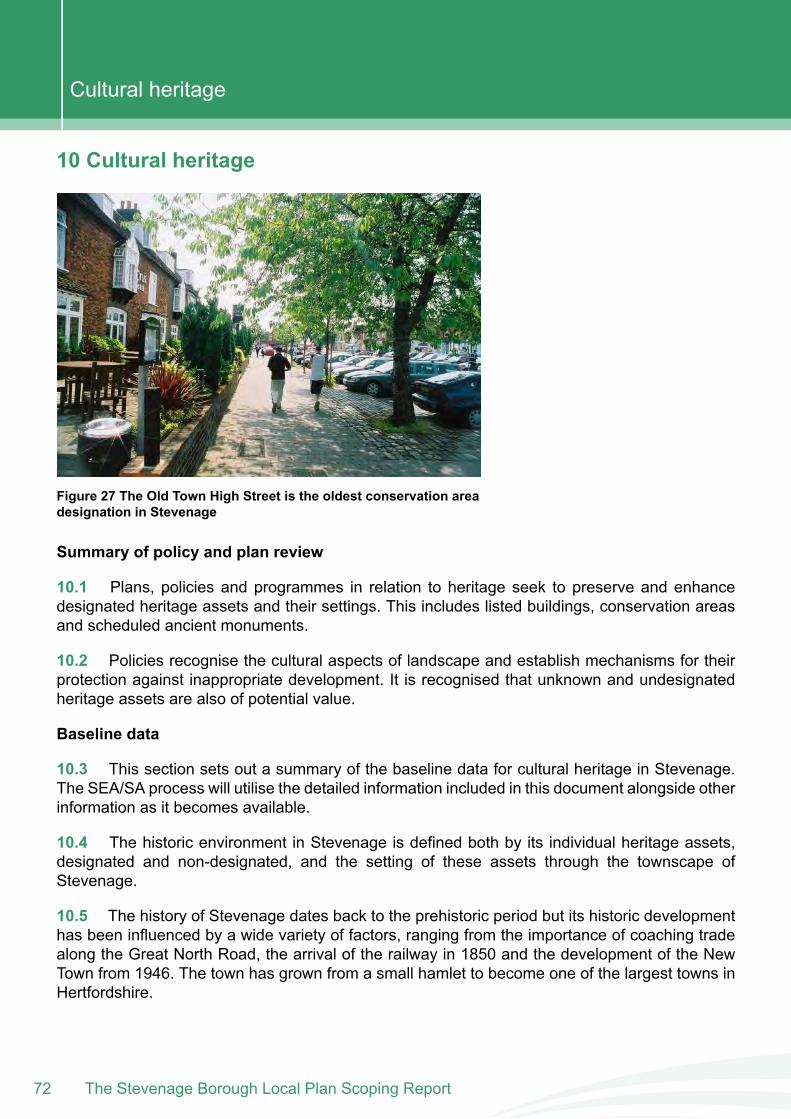
10 Cultural heritage
Figure 27 The Old Town High Street is the oldest conservation areadesignation in Stevenage
Summary of policy and plan review
10.1 Plans, policies and programmes in relation to heritage seek to preserve and enhancedesignated heritage assets and their settings. This includes listed buildings, conservation areasand scheduled ancient monuments.
10.2 Policies recognise the cultural aspects of landscape and establish mechanisms for theirprotection against inappropriate development. It is recognised that unknown and undesignatedheritage assets are also of potential value.
Baseline data
10.3 This section sets out a summary of the baseline data for cultural heritage in Stevenage.The SEA/SA process will utilise the detailed information included in this document alongside otherinformation as it becomes available.
10.4 The historic environment in Stevenage is defined both by its individual heritage assets,designated and non-designated, and the setting of these assets through the townscape ofStevenage.
10.5 The history of Stevenage dates back to the prehistoric period but its historic developmenthas been influenced by a wide variety of factors, ranging from the importance of coaching tradealong the Great North Road, the arrival of the railway in 1850 and the development of the NewTown from 1946. The town has grown from a small hamlet to become one of the largest towns inHertfordshire.
The Stevenage Borough Local Plan Scoping Report72
Cultural heritage
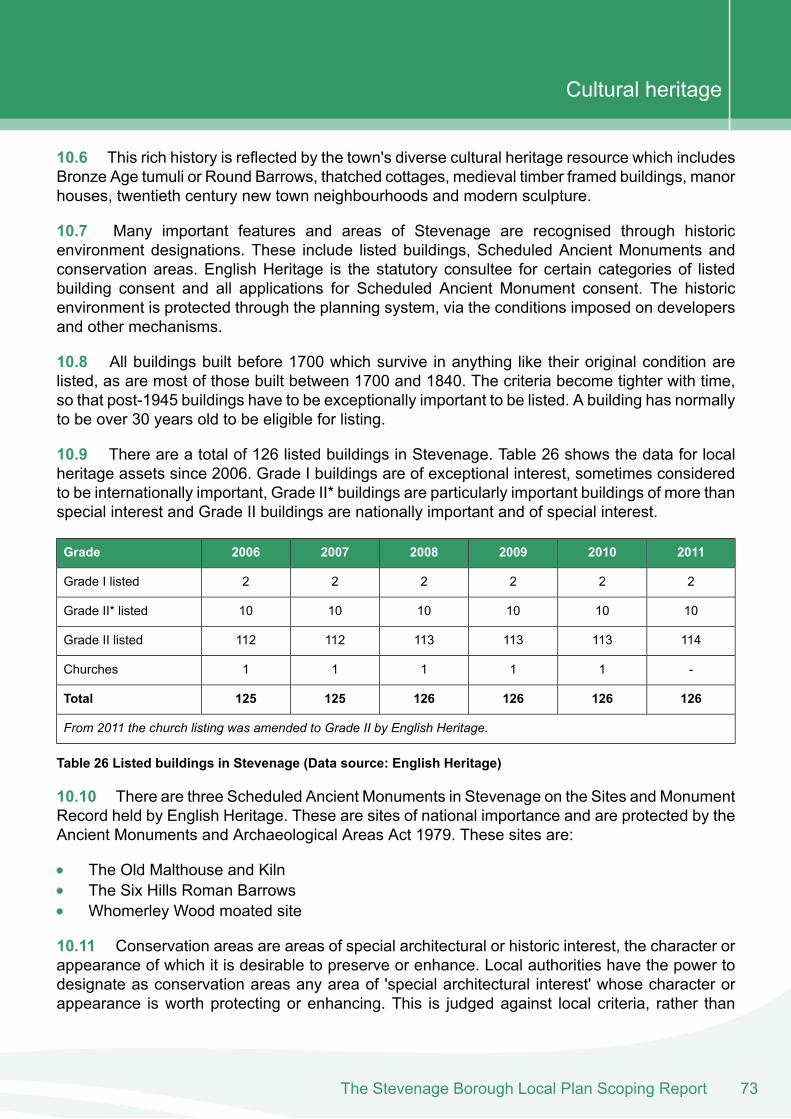
10.6 This rich history is reflected by the town's diverse cultural heritage resource which includesBronze Age tumuli or Round Barrows, thatched cottages, medieval timber framed buildings, manorhouses, twentieth century new town neighbourhoods and modern sculpture.
10.7 Many important features and areas of Stevenage are recognised through historicenvironment designations. These include listed buildings, Scheduled Ancient Monuments andconservation areas. English Heritage is the statutory consultee for certain categories of listedbuilding consent and all applications for Scheduled Ancient Monument consent. The historicenvironment is protected through the planning system, via the conditions imposed on developersand other mechanisms.
10.8 All buildings built before 1700 which survive in anything like their original condition arelisted, as are most of those built between 1700 and 1840. The criteria become tighter with time,so that post-1945 buildings have to be exceptionally important to be listed. A building has normallyto be over 30 years old to be eligible for listing.
10.9 There are a total of 126 listed buildings in Stevenage. Table 26 shows the data for localheritage assets since 2006. Grade I buildings are of exceptional interest, sometimes consideredto be internationally important, Grade II* buildings are particularly important buildings of more thanspecial interest and Grade II buildings are nationally important and of special interest.
201120102009200820072006Grade
222222Grade I listed
101010101010Grade II* listed
114113113113112112Grade II listed
-11111Churches
126126126126125125Total
From 2011 the church listing was amended to Grade II by English Heritage.
Table 26 Listed buildings in Stevenage (Data source: English Heritage)
10.10 There are three Scheduled Ancient Monuments in Stevenage on the Sites and MonumentRecord held by English Heritage. These are sites of national importance and are protected by theAncient Monuments and Archaeological Areas Act 1979. These sites are:
The Old Malthouse and KilnThe Six Hills Roman BarrowsWhomerley Wood moated site
10.11 Conservation areas are areas of special architectural or historic interest, the character orappearance of which it is desirable to preserve or enhance. Local authorities have the power todesignate as conservation areas any area of 'special architectural interest' whose character orappearance is worth protecting or enhancing. This is judged against local criteria, rather than
73The Stevenage Borough Local Plan Scoping Report
Cultural heritage
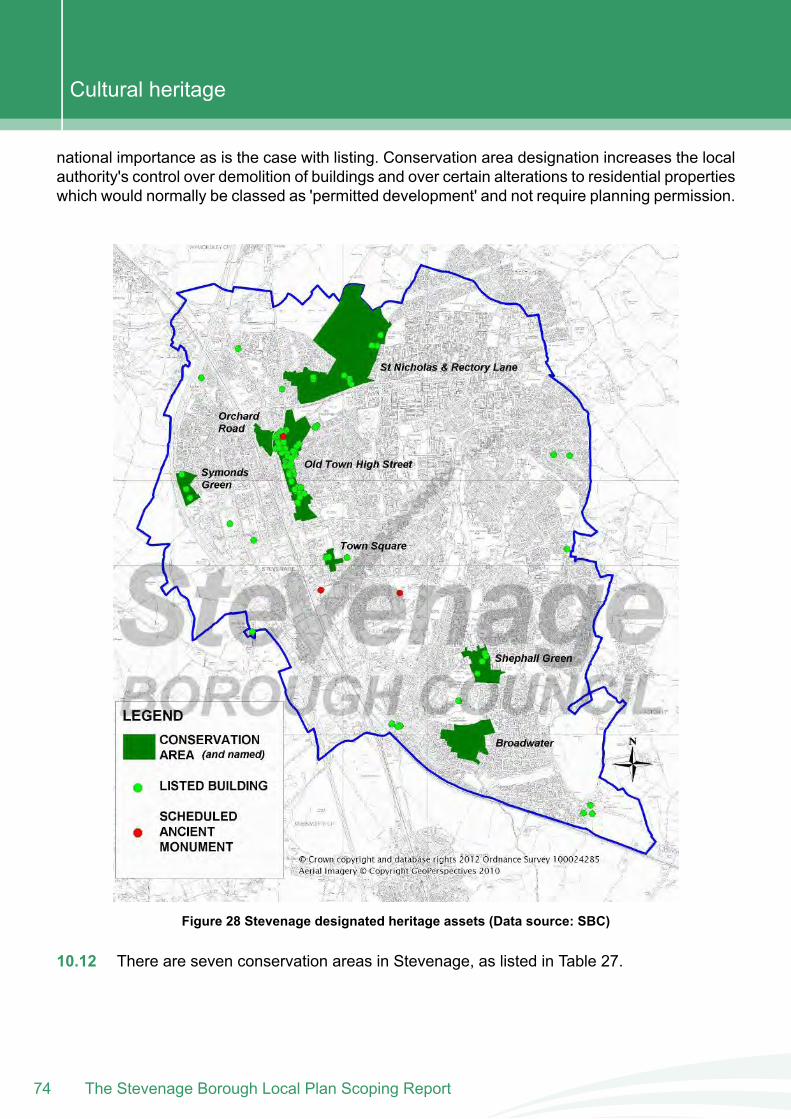
national importance as is the case with listing. Conservation area designation increases the localauthority's control over demolition of buildings and over certain alterations to residential propertieswhich would normally be classed as 'permitted development' and not require planning permission.
Figure 28 Stevenage designated heritage assets (Data source: SBC)
10.12 There are seven conservation areas in Stevenage, as listed in Table 27.
The Stevenage Borough Local Plan Scoping Report74
Cultural heritage
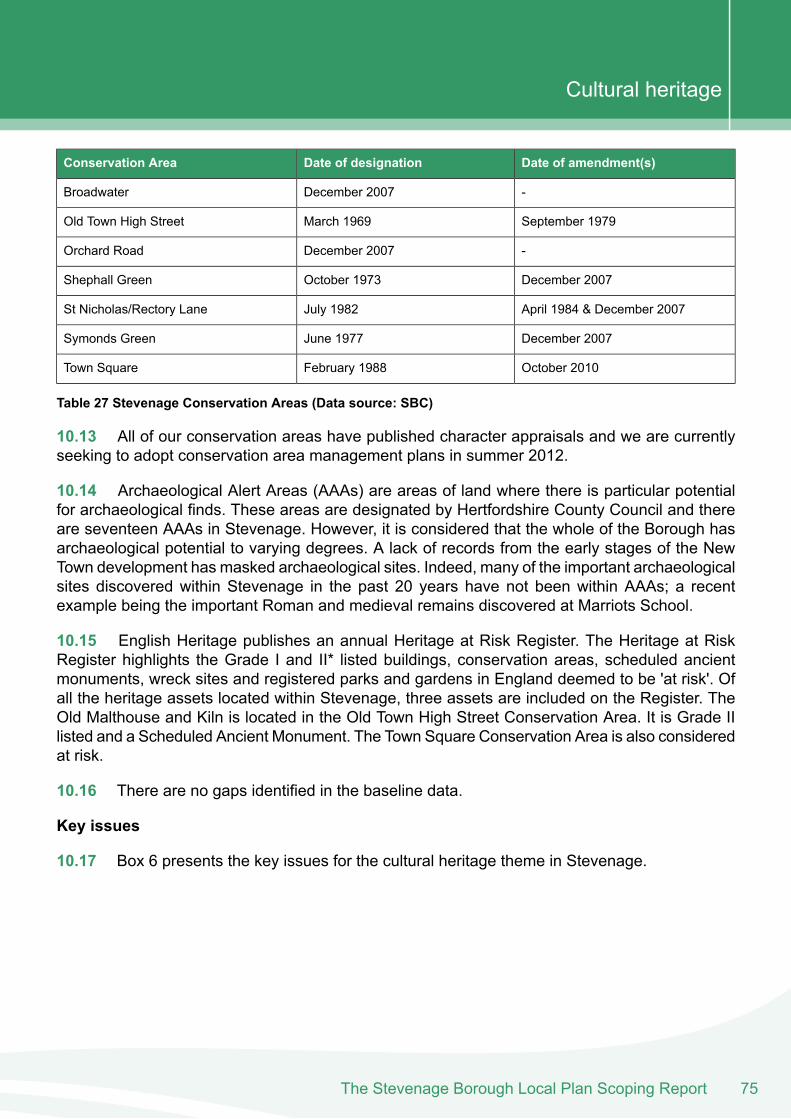
Date of amendment(s)Date of designationConservation Area
-December 2007Broadwater
September 1979March 1969Old Town High Street
-December 2007Orchard Road
December 2007October 1973Shephall Green
April 1984 & December 2007July 1982St Nicholas/Rectory Lane
December 2007June 1977Symonds Green
October 2010February 1988Town Square
Table 27 Stevenage Conservation Areas (Data source: SBC)
10.13 All of our conservation areas have published character appraisals and we are currentlyseeking to adopt conservation area management plans in summer 2012.
10.14 Archaeological Alert Areas (AAAs) are areas of land where there is particular potentialfor archaeological finds. These areas are designated by Hertfordshire County Council and thereare seventeen AAAs in Stevenage. However, it is considered that the whole of the Borough hasarchaeological potential to varying degrees. A lack of records from the early stages of the NewTown development has masked archaeological sites. Indeed, many of the important archaeologicalsites discovered within Stevenage in the past 20 years have not been within AAAs; a recentexample being the important Roman and medieval remains discovered at Marriots School.
10.15 English Heritage publishes an annual Heritage at Risk Register. The Heritage at RiskRegister highlights the Grade I and II* listed buildings, conservation areas, scheduled ancientmonuments, wreck sites and registered parks and gardens in England deemed to be 'at risk'. Ofall the heritage assets located within Stevenage, three assets are included on the Register. TheOld Malthouse and Kiln is located in the Old Town High Street Conservation Area. It is Grade IIlisted and a Scheduled Ancient Monument. The Town Square Conservation Area is also consideredat risk.
10.16 There are no gaps identified in the baseline data.
Key issues
10.17 Box 6 presents the key issues for the cultural heritage theme in Stevenage.
75The Stevenage Borough Local Plan Scoping Report
Cultural heritage
Box 6: Key issues for cultural heritage
One listed building and scheduled ancient monument is at risk.Two conservation areas are at risk.Pressure for development in historic areas increases as the positive management of anarea improves its attractiveness to businesses and developers.The impact of new development must be carefully managed as it can directly affectarchaeological sites, monuments, buildings and areas.Archaeological remains, both seen and unseen, have the potential to be affected by newdevelopments.The Borough has archaeological potential to varying degrees and is not confined byheritage designations.Inappropriate alterations and repairs can have a cumulative impact on the character ofan area.Heritage assets are at risk of decay if the viability of the current use is put at risk.Conserving the commercial heritage of the Old Town and the New Town.Maintaining the local distinctiveness of the townscape character.
The Stevenage Borough Local Plan Scoping Report76
Cultural heritage

11 . LandscapeThe Stevenage Borough Local Plan Scoping Report
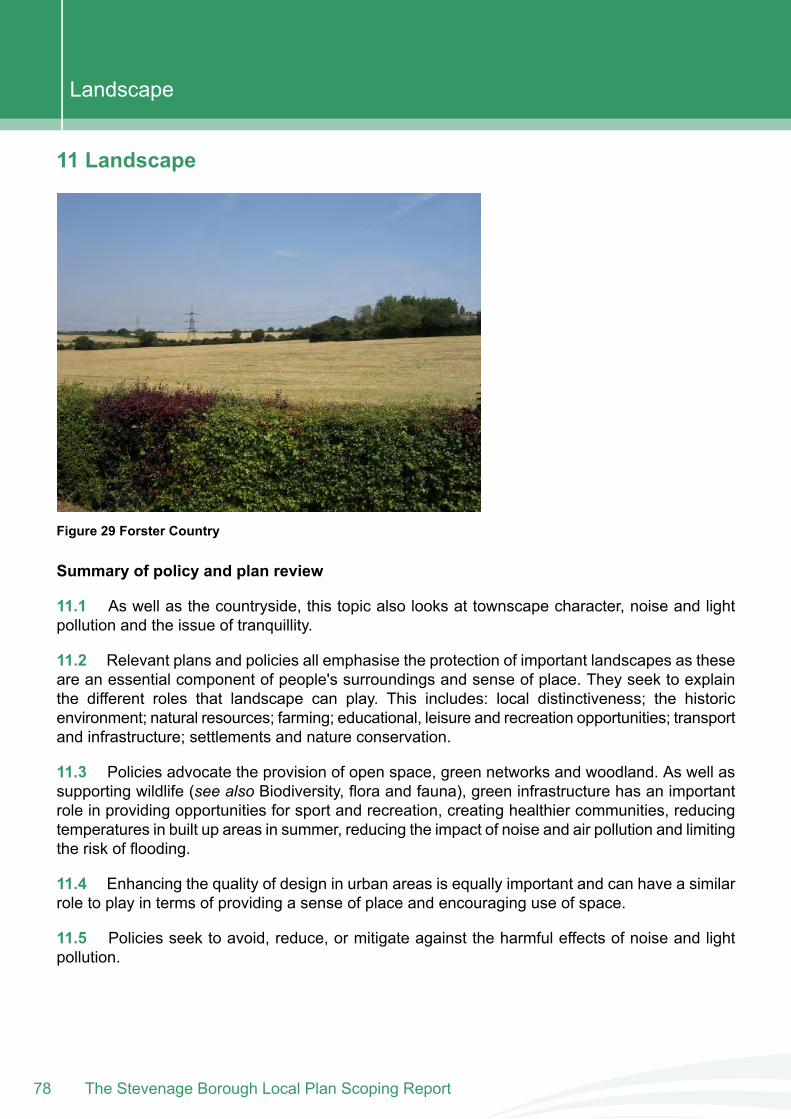
11 Landscape
Figure 29 Forster Country
Summary of policy and plan review
11.1 As well as the countryside, this topic also looks at townscape character, noise and lightpollution and the issue of tranquillity.
11.2 Relevant plans and policies all emphasise the protection of important landscapes as theseare an essential component of people's surroundings and sense of place. They seek to explainthe different roles that landscape can play. This includes: local distinctiveness; the historicenvironment; natural resources; farming; educational, leisure and recreation opportunities; transportand infrastructure; settlements and nature conservation.
11.3 Policies advocate the provision of open space, green networks and woodland. As well assupporting wildlife (see also Biodiversity, flora and fauna), green infrastructure has an importantrole in providing opportunities for sport and recreation, creating healthier communities, reducingtemperatures in built up areas in summer, reducing the impact of noise and air pollution and limitingthe risk of flooding.
11.4 Enhancing the quality of design in urban areas is equally important and can have a similarrole to play in terms of providing a sense of place and encouraging use of space.
11.5 Policies seek to avoid, reduce, or mitigate against the harmful effects of noise and lightpollution.
The Stevenage Borough Local Plan Scoping Report78
Landscape
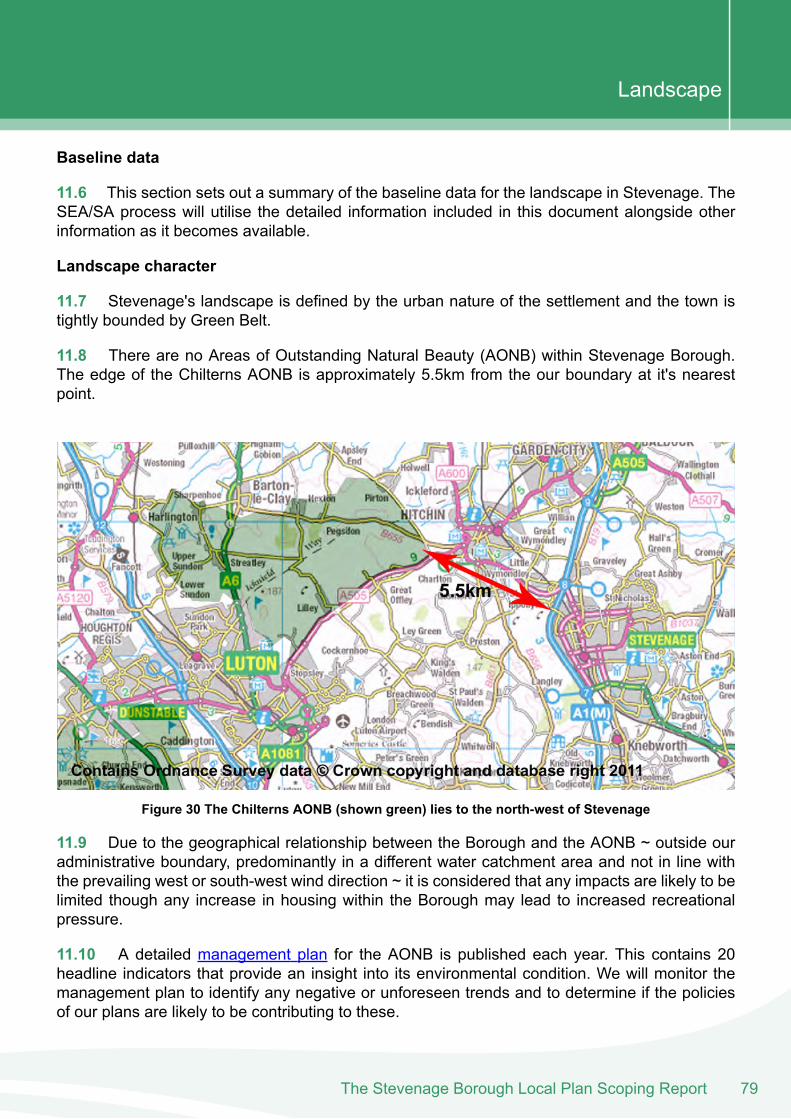
Baseline data
11.6 This section sets out a summary of the baseline data for the landscape in Stevenage. TheSEA/SA process will utilise the detailed information included in this document alongside otherinformation as it becomes available.
Landscape character
11.7 Stevenage's landscape is defined by the urban nature of the settlement and the town istightly bounded by Green Belt.
11.8 There are no Areas of Outstanding Natural Beauty (AONB) within Stevenage Borough.The edge of the Chilterns AONB is approximately 5.5km from the our boundary at it's nearestpoint.
Figure 30 The Chilterns AONB (shown green) lies to the north-west of Stevenage
11.9 Due to the geographical relationship between the Borough and the AONB ~ outside ouradministrative boundary, predominantly in a different water catchment area and not in line withthe prevailing west or south-west wind direction ~ it is considered that any impacts are likely to belimited though any increase in housing within the Borough may lead to increased recreationalpressure.
11.10 A detailed management plan for the AONB is published each year. This contains 20headline indicators that provide an insight into its environmental condition. We will monitor themanagement plan to identify any negative or unforeseen trends and to determine if the policiesof our plans are likely to be contributing to these.
79The Stevenage Borough Local Plan Scoping Report
Landscape
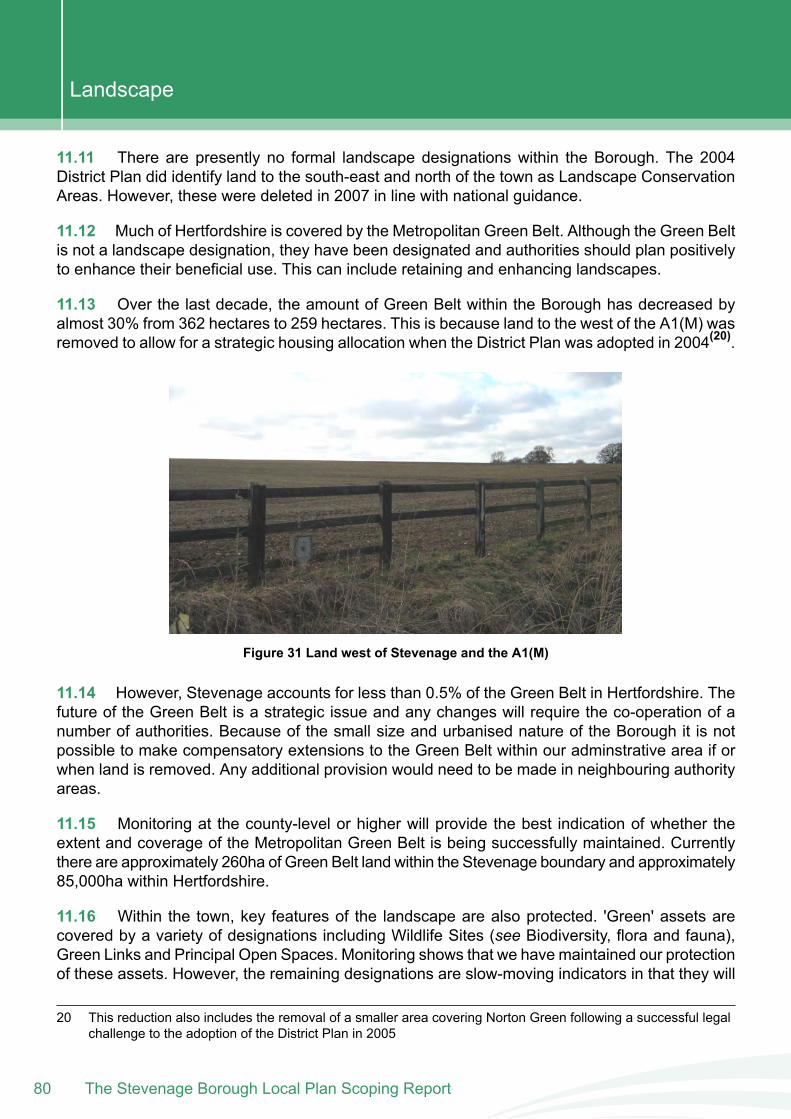
11.11 There are presently no formal landscape designations within the Borough. The 2004District Plan did identify land to the south-east and north of the town as Landscape ConservationAreas. However, these were deleted in 2007 in line with national guidance.
11.12 Much of Hertfordshire is covered by the Metropolitan Green Belt. Although the Green Beltis not a landscape designation, they have been designated and authorities should plan positivelyto enhance their beneficial use. This can include retaining and enhancing landscapes.
11.13 Over the last decade, the amount of Green Belt within the Borough has decreased byalmost 30% from 362 hectares to 259 hectares. This is because land to the west of the A1(M) wasremoved to allow for a strategic housing allocation when the District Plan was adopted in 2004(20).
Figure 31 Land west of Stevenage and the A1(M)
11.14 However, Stevenage accounts for less than 0.5% of the Green Belt in Hertfordshire. Thefuture of the Green Belt is a strategic issue and any changes will require the co-operation of anumber of authorities. Because of the small size and urbanised nature of the Borough it is notpossible to make compensatory extensions to the Green Belt within our adminstrative area if orwhen land is removed. Any additional provision would need to be made in neighbouring authorityareas.
11.15 Monitoring at the county-level or higher will provide the best indication of whether theextent and coverage of the Metropolitan Green Belt is being successfully maintained. Currentlythere are approximately 260ha of Green Belt land within the Stevenage boundary and approximately85,000ha within Hertfordshire.
11.16 Within the town, key features of the landscape are also protected. 'Green' assets arecovered by a variety of designations including Wildlife Sites (see Biodiversity, flora and fauna),Green Links and Principal Open Spaces. Monitoring shows that we have maintained our protectionof these assets. However, the remaining designations are slow-moving indicators in that they will
20 This reduction also includes the removal of a smaller area covering Norton Green following a successful legalchallenge to the adoption of the District Plan in 2005
The Stevenage Borough Local Plan Scoping Report80
Landscape
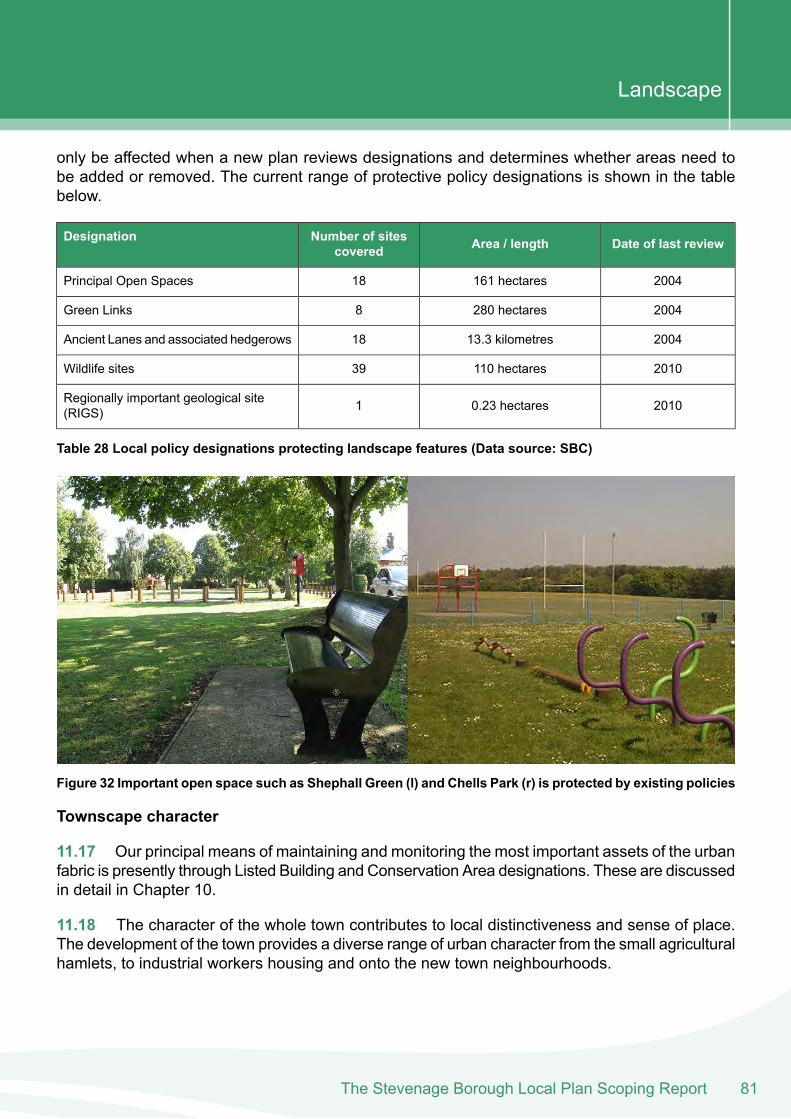
only be affected when a new plan reviews designations and determines whether areas need tobe added or removed. The current range of protective policy designations is shown in the tablebelow.
Date of last reviewArea / lengthNumber of sitescovered
Designation
2004161 hectares18Principal Open Spaces
2004280 hectares8Green Links
200413.3 kilometres18Ancient Lanes and associated hedgerows
2010110 hectares39Wildlife sites
20100.23 hectares1Regionally important geological site(RIGS)
Table 28 Local policy designations protecting landscape features (Data source: SBC)
Figure 32 Important open space such as Shephall Green (l) and Chells Park (r) is protected by existing policies
Townscape character
11.17 Our principal means of maintaining and monitoring the most important assets of the urbanfabric is presently through Listed Building and Conservation Area designations. These are discussedin detail in Chapter 10.
11.18 The character of the whole town contributes to local distinctiveness and sense of place.The development of the town provides a diverse range of urban character from the small agriculturalhamlets, to industrial workers housing and onto the new town neighbourhoods.
81The Stevenage Borough Local Plan Scoping Report
Landscape
11.19 The Code for Sustainable Homes (CSH) is the national standard for the sustainable designand construction of new homes. It aims to reduce our carbon emissions and create homes thatare more sustainable.
11.20 The Code measures the sustainability of a new home against categories of sustainabledesign, rating the ‘whole home’ as a complete package using a 1 to 6 star rating system tocommunicate the overall sustainability performance of a new home.
11.21 Since April 2008, there has been a requirement for all new social housing to be built to aminimum of Level 3. The Code is still voluntary for privately built housing, although BuildingRegulations have required all new homes to reach the energy standards of Level 3 since 2010.
11.22 The Building Research Establishment Environmental Assessment Methodology (BREEAM)is a commonly used environmental certification scheme in the UK. For non-residential developmentswe encourage the use of the BREEAM standards.
11.23 Of the ten major applications determined during 2011/12, four were assessed under theCSH/BREEAM schemes.
Noise and tranquillity
11.24 The New Town generally separates housing and other noise-sensitive uses (such asschools and community facilities) from noise generating uses such as transport corridors andindustry, thereby helping to limit noise disturbance.
11.25 Stevenage is however affected by some aircraft noise generated by operations at LondonLuton Airport. The Borough lies on flightpaths to and from the airport, most frequently experiencinginbound flights which broadly cross the centre of the town from east to west.
11.26 The airport's annual monitoring reports contain detailed analysis of noise issues. Thisincludes analysis of noise contours, which detail the areas that are subject to certain levels ofimpact. The annual report explains that:
Since 1989, the preferred measure of aircraft noise has been the A-weighted equivalentnoise level, Leq. This indicator takes account of all the noise energy that occurs over aparticular time period and thus takes account of all the aircraft movements, both departuresand arrivals, that occurred in that period.
In the UK, the noise impact of an airport is primarily described in terms of the LAeq averagedover the 16 hour period from 0700 – 2300 for an average day between the 16th June and15th September. In addition, London Luton Airport also produces contours for the 8 hournight period between 2300 and 0700 for an average summer night in terms of the LAeq, 8hindicator.
The daytime contours show the LAeq,16h values in 3 dB(A) steps from 57 dB(A) to 72 dB(A).The night contours show the LAeq, 8h values also in 3 dB(A) starting at 48 dB(A). Thesevalues relate to guidance provided in Planning Policy Guidance Note 24 –Planning & Noise.
The Stevenage Borough Local Plan Scoping Report82
Landscape
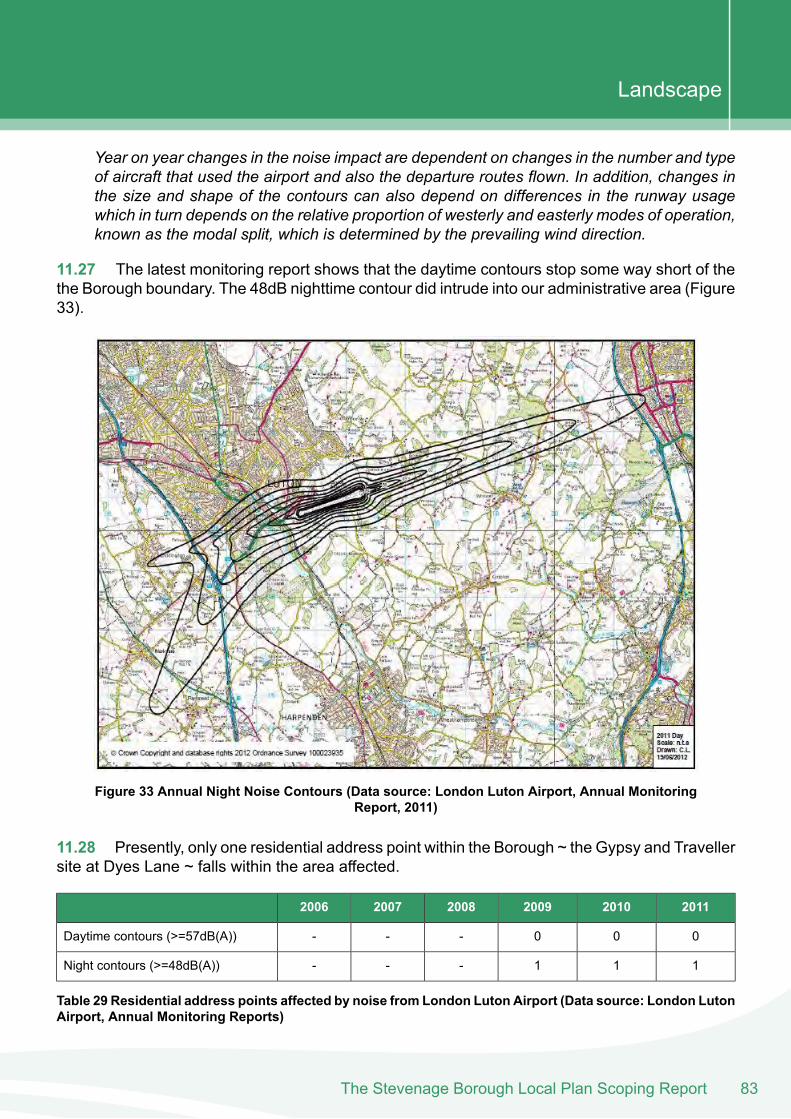
Year on year changes in the noise impact are dependent on changes in the number and typeof aircraft that used the airport and also the departure routes flown. In addition, changes inthe size and shape of the contours can also depend on differences in the runway usagewhich in turn depends on the relative proportion of westerly and easterly modes of operation,known as the modal split, which is determined by the prevailing wind direction.
11.27 The latest monitoring report shows that the daytime contours stop some way short of thethe Borough boundary. The 48dB nighttime contour did intrude into our administrative area (Figure33).
Figure 33 Annual Night Noise Contours (Data source: London Luton Airport, Annual MonitoringReport, 2011)
11.28 Presently, only one residential address point within the Borough ~ the Gypsy and Travellersite at Dyes Lane ~ falls within the area affected.
201120102009200820072006
000---Daytime contours (>=57dB(A))
111---Night contours (>=48dB(A))
Table 29 Residential address points affected by noise from London Luton Airport (Data source: London LutonAirport, Annual Monitoring Reports)
83The Stevenage Borough Local Plan Scoping Report
Landscape
11.29 The airport's annual monitoring reports also contain data on complaints. The number ofcomplaints arising from Stevenage since 2005 are shown in the table below. This informationshould be treated with some caution as they may not relate solely to noise issues. However, itprovides a useful context.
11.30 The number of events eliciting a complaint has fallen over the period shown.
201120102009200820072006
1015713921Complaints
2117614Events eliciting a complaint
815713815Complainants
Table 30 Complaints to London Luton Airport from addresses in Stevenage (Data source: London LutonAirport, Annual Monitoring Reports)
11.31 There are plans to increase capacity at the airport within the limits of the existing singlerunway. There have historically been proposals to make changes to flight paths which could alsoaffect noise-sensitive uses in Stevenage.
11.32 Future decisions relating to the role and development of London Luton Airport lie outsidethe direct control of the Borough Council and the plan to which this scoping report relates.
11.33 However, spatial decisions made through the plan will need to consider this issue,particularly where this could lead to noise-sensitive uses being located in areas affected by aircraftnoise. Decisions relating to the land within the Borough boundary to the west of the A1(M) aremost likely to be affected.
11.34 There is no consistently collected dataset which can be used to establish a baseline withregards light pollution. The significant majority of the Borough is urbanised and, as such, there isan inevitable degree of 'skyglow' arising from the concentration of buildings and streetlighting(21).
11.35 Qualitative analysis of recent development activity, such as the new football academy onBroadhall Way, shows that an evidence-based approach has been taken and existing policieshave helped limit light levels to those required for operational purposes.
Data gaps
11.36 The following gaps have been identified in the baseline data:
Townscape datasets;Monitoring of light pollution.
Key issues
11.37 Box 7 presents the key issues for the landscape theme in Stevenage.
21 The latter of which is a highway, rather than a planning, matter and outside the direct control of this plan
The Stevenage Borough Local Plan Scoping Report84
Landscape
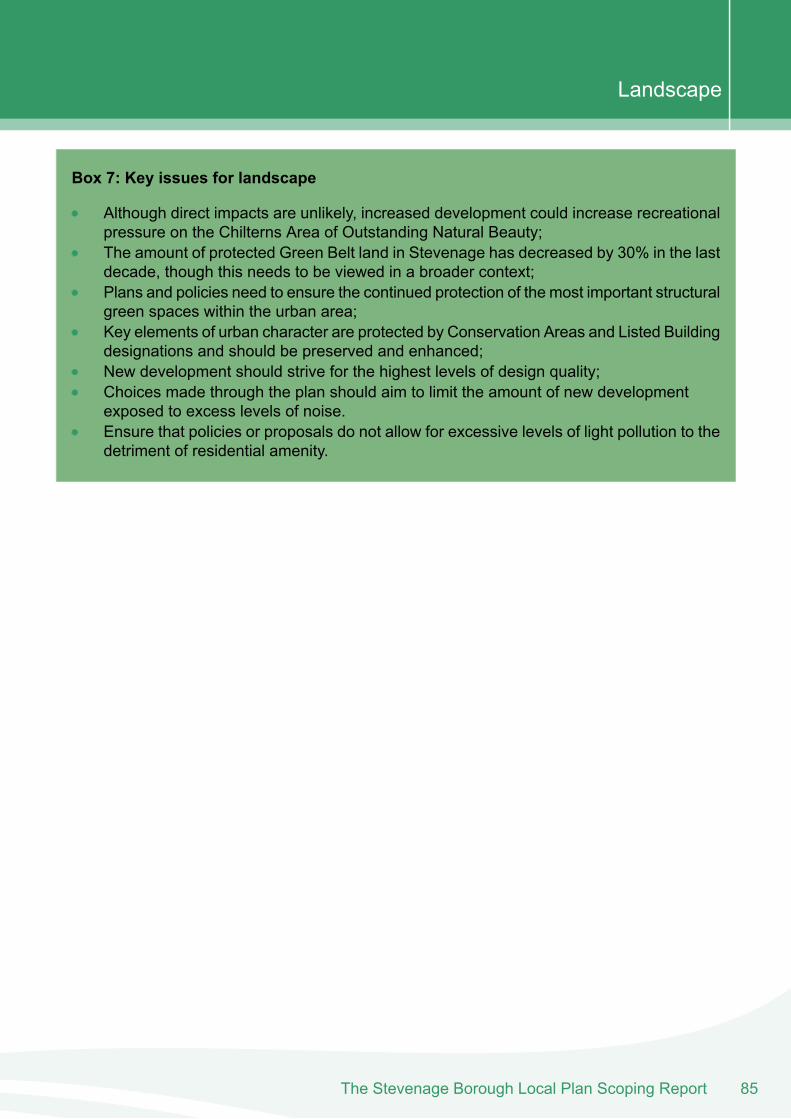
Box 7: Key issues for landscape
Although direct impacts are unlikely, increased development could increase recreationalpressure on the Chilterns Area of Outstanding Natural Beauty;The amount of protected Green Belt land in Stevenage has decreased by 30% in the lastdecade, though this needs to be viewed in a broader context;Plans and policies need to ensure the continued protection of the most important structuralgreen spaces within the urban area;Key elements of urban character are protected by Conservation Areas and Listed Buildingdesignations and should be preserved and enhanced;New development should strive for the highest levels of design quality;Choices made through the plan should aim to limit the amount of new developmentexposed to excess levels of noise.Ensure that policies or proposals do not allow for excessive levels of light pollution to thedetriment of residential amenity.
85The Stevenage Borough Local Plan Scoping Report
Landscape
The Stevenage Borough Local Plan Scoping Report86
Landscape

12 . Social InclusivenessThe Stevenage Borough Local Plan Scoping Report
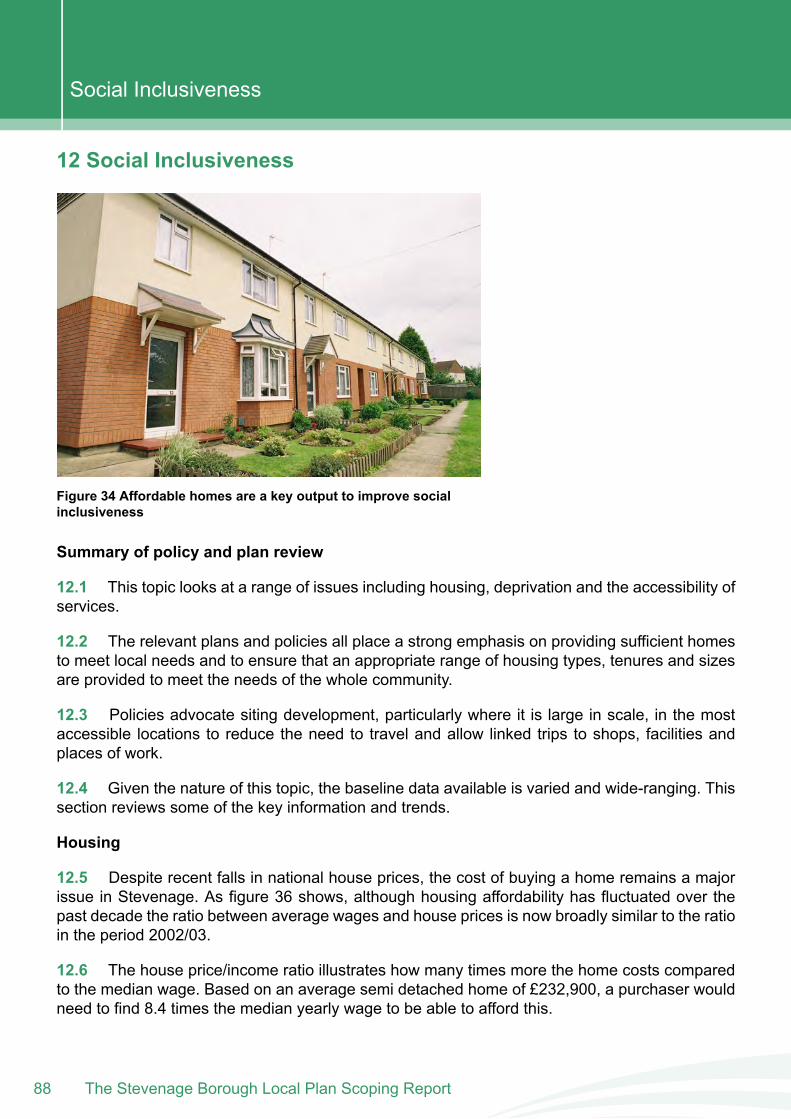
12 Social Inclusiveness
Figure 34 Affordable homes are a key output to improve socialinclusiveness
Summary of policy and plan review
12.1 This topic looks at a range of issues including housing, deprivation and the accessibility ofservices.
12.2 The relevant plans and policies all place a strong emphasis on providing sufficient homesto meet local needs and to ensure that an appropriate range of housing types, tenures and sizesare provided to meet the needs of the whole community.
12.3 Policies advocate siting development, particularly where it is large in scale, in the mostaccessible locations to reduce the need to travel and allow linked trips to shops, facilities andplaces of work.
12.4 Given the nature of this topic, the baseline data available is varied and wide-ranging. Thissection reviews some of the key information and trends.
Housing
12.5 Despite recent falls in national house prices, the cost of buying a home remains a majorissue in Stevenage. As figure 36 shows, although housing affordability has fluctuated over thepast decade the ratio between average wages and house prices is now broadly similar to the ratioin the period 2002/03.
12.6 The house price/income ratio illustrates how many times more the home costs comparedto the median wage. Based on an average semi detached home of £232,900, a purchaser wouldneed to find 8.4 times the median yearly wage to be able to afford this.
The Stevenage Borough Local Plan Scoping Report88
Social Inclusiveness
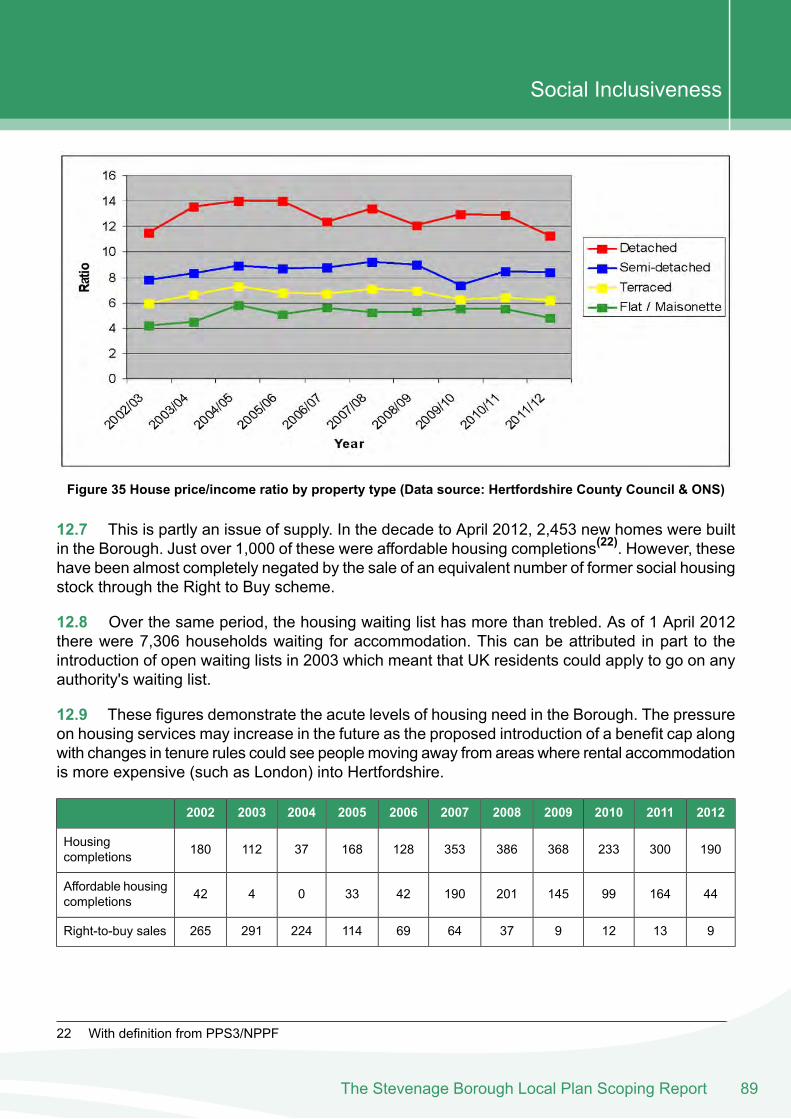
Figure 35 House price/income ratio by property type (Data source: Hertfordshire County Council & ONS)
12.7 This is partly an issue of supply. In the decade to April 2012, 2,453 new homes were builtin the Borough. Just over 1,000 of these were affordable housing completions(22). However, thesehave been almost completely negated by the sale of an equivalent number of former social housingstock through the Right to Buy scheme.
12.8 Over the same period, the housing waiting list has more than trebled. As of 1 April 2012there were 7,306 households waiting for accommodation. This can be attributed in part to theintroduction of open waiting lists in 2003 which meant that UK residents could apply to go on anyauthority's waiting list.
12.9 These figures demonstrate the acute levels of housing need in the Borough. The pressureon housing services may increase in the future as the proposed introduction of a benefit cap alongwith changes in tenure rules could see peoplemoving away from areas where rental accommodationis more expensive (such as London) into Hertfordshire.
20122011201020092008200720062005200420032002
19030023336838635312816837112180Housingcompletions
441649914520119042330442Affordable housingcompletions
913129376469114224291265Right-to-buy sales
22 With definition from PPS3/NPPF
89The Stevenage Borough Local Plan Scoping Report
Social Inclusiveness
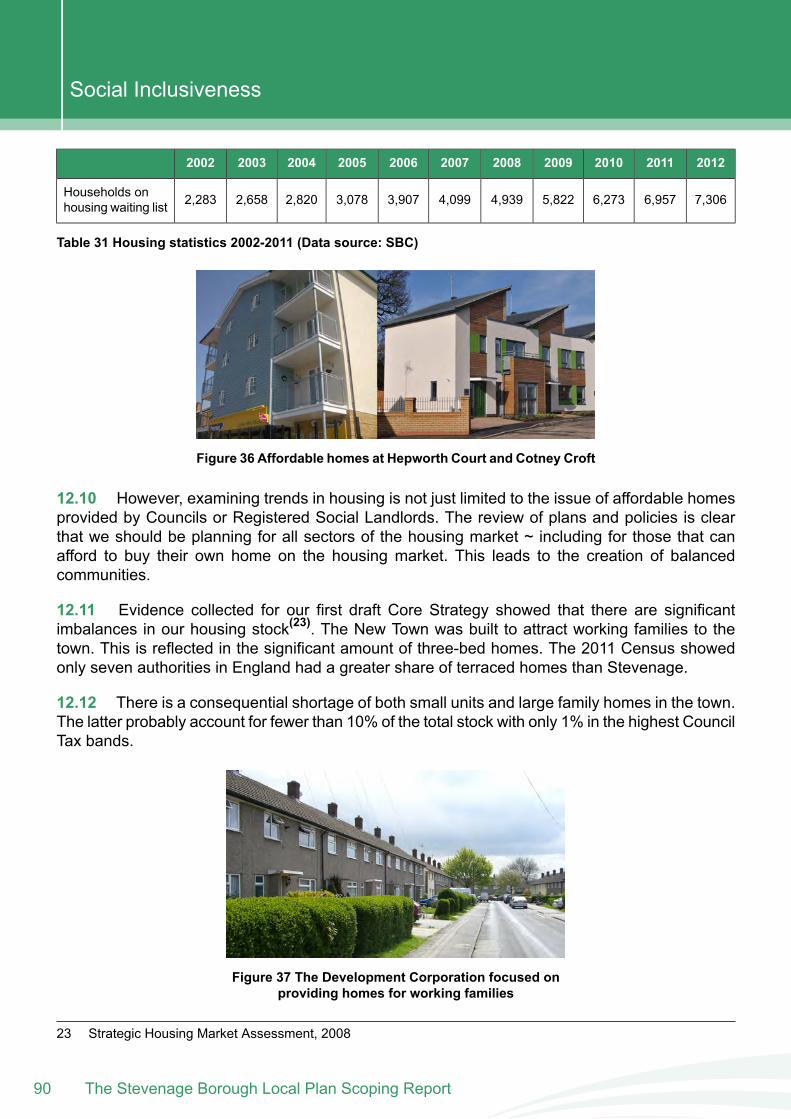
20122011201020092008200720062005200420032002
7,3066,9576,2735,8224,9394,0993,9073,0782,8202,6582,283Households onhousing waiting list
Table 31 Housing statistics 2002-2011 (Data source: SBC)
Figure 36 Affordable homes at Hepworth Court and Cotney Croft
12.10 However, examining trends in housing is not just limited to the issue of affordable homesprovided by Councils or Registered Social Landlords. The review of plans and policies is clearthat we should be planning for all sectors of the housing market ~ including for those that canafford to buy their own home on the housing market. This leads to the creation of balancedcommunities.
12.11 Evidence collected for our first draft Core Strategy showed that there are significantimbalances in our housing stock(23). The New Town was built to attract working families to thetown. This is reflected in the significant amount of three-bed homes. The 2011 Census showedonly seven authorities in England had a greater share of terraced homes than Stevenage.
12.12 There is a consequential shortage of both small units and large family homes in the town.The latter probably account for fewer than 10% of the total stock with only 1% in the highest CouncilTax bands.
Figure 37 The Development Corporation focused onproviding homes for working families
23 Strategic Housing Market Assessment, 2008
The Stevenage Borough Local Plan Scoping Report90
Social Inclusiveness
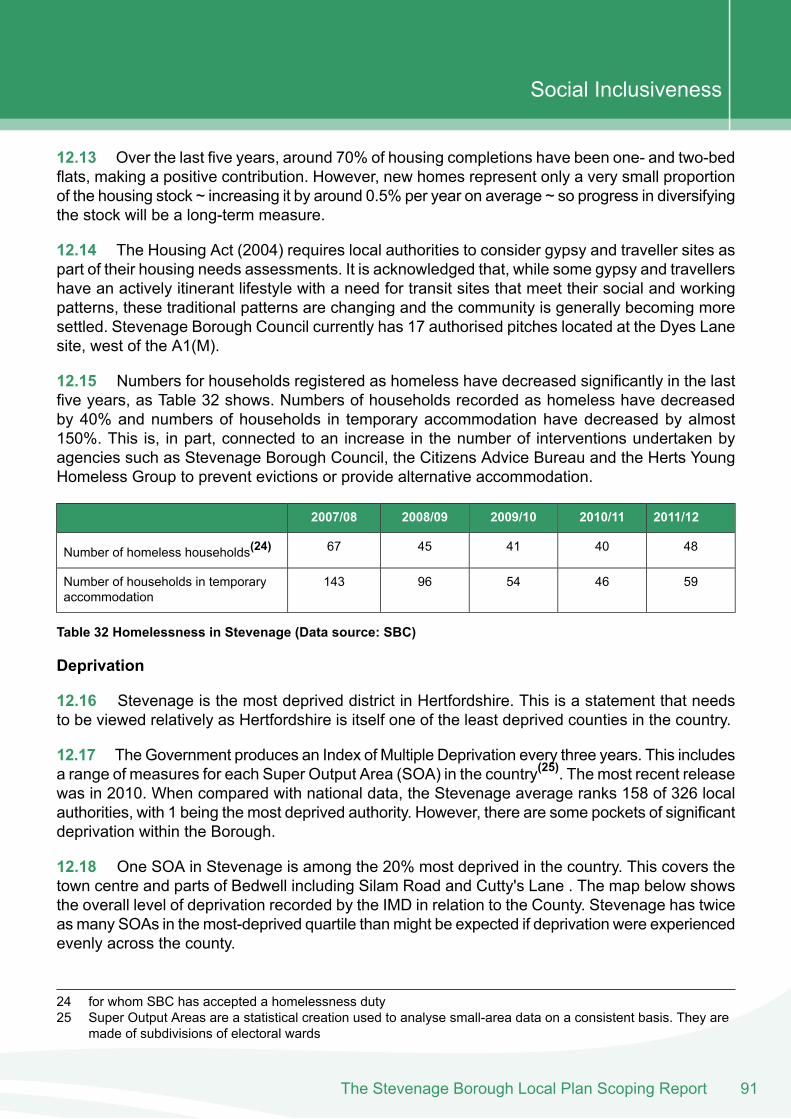
12.13 Over the last five years, around 70% of housing completions have been one- and two-bedflats, making a positive contribution. However, new homes represent only a very small proportionof the housing stock ~ increasing it by around 0.5% per year on average ~ so progress in diversifyingthe stock will be a long-term measure.
12.14 The Housing Act (2004) requires local authorities to consider gypsy and traveller sites aspart of their housing needs assessments. It is acknowledged that, while some gypsy and travellershave an actively itinerant lifestyle with a need for transit sites that meet their social and workingpatterns, these traditional patterns are changing and the community is generally becoming moresettled. Stevenage Borough Council currently has 17 authorised pitches located at the Dyes Lanesite, west of the A1(M).
12.15 Numbers for households registered as homeless have decreased significantly in the lastfive years, as Table 32 shows. Numbers of households recorded as homeless have decreasedby 40% and numbers of households in temporary accommodation have decreased by almost150%. This is, in part, connected to an increase in the number of interventions undertaken byagencies such as Stevenage Borough Council, the Citizens Advice Bureau and the Herts YoungHomeless Group to prevent evictions or provide alternative accommodation.
2011/122010/112009/102008/092007/08
4840414567Number of homeless households(24)
59465496143Number of households in temporaryaccommodation
Table 32 Homelessness in Stevenage (Data source: SBC)
Deprivation
12.16 Stevenage is the most deprived district in Hertfordshire. This is a statement that needsto be viewed relatively as Hertfordshire is itself one of the least deprived counties in the country.
12.17 TheGovernment produces an Index of Multiple Deprivation every three years. This includesa range of measures for each Super Output Area (SOA) in the country(25). The most recent releasewas in 2010. When compared with national data, the Stevenage average ranks 158 of 326 localauthorities, with 1 being the most deprived authority. However, there are some pockets of significantdeprivation within the Borough.
12.18 One SOA in Stevenage is among the 20% most deprived in the country. This covers thetown centre and parts of Bedwell including Silam Road and Cutty's Lane . The map below showsthe overall level of deprivation recorded by the IMD in relation to the County. Stevenage has twiceasmany SOAs in themost-deprived quartile thanmight be expected if deprivation were experiencedevenly across the county.
24 for whom SBC has accepted a homelessness duty25 Super Output Areas are a statistical creation used to analyse small-area data on a consistent basis. They are
made of subdivisions of electoral wards
91The Stevenage Borough Local Plan Scoping Report
Social Inclusiveness
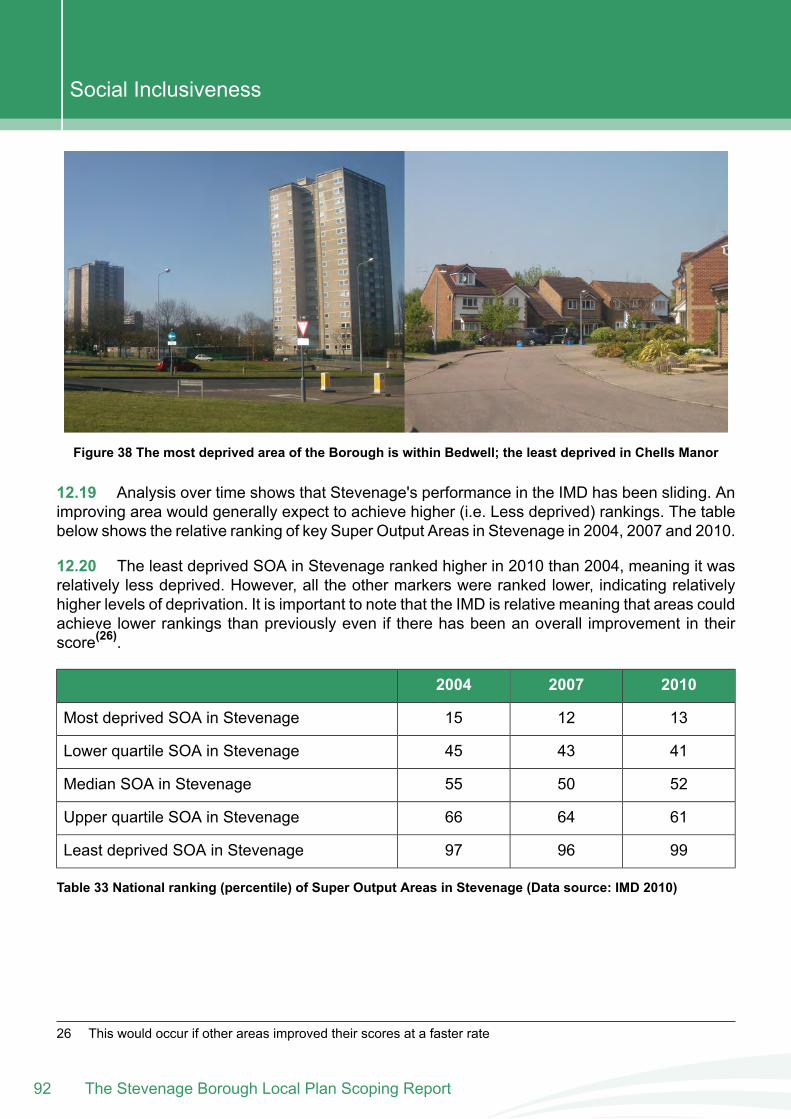
Figure 38 The most deprived area of the Borough is within Bedwell; the least deprived in Chells Manor
12.19 Analysis over time shows that Stevenage's performance in the IMD has been sliding. Animproving area would generally expect to achieve higher (i.e. Less deprived) rankings. The tablebelow shows the relative ranking of key Super Output Areas in Stevenage in 2004, 2007 and 2010.
12.20 The least deprived SOA in Stevenage ranked higher in 2010 than 2004, meaning it wasrelatively less deprived. However, all the other markers were ranked lower, indicating relativelyhigher levels of deprivation. It is important to note that the IMD is relative meaning that areas couldachieve lower rankings than previously even if there has been an overall improvement in theirscore(26).
201020072004
131215Most deprived SOA in Stevenage
414345Lower quartile SOA in Stevenage
525055Median SOA in Stevenage
616466Upper quartile SOA in Stevenage
999697Least deprived SOA in Stevenage
Table 33 National ranking (percentile) of Super Output Areas in Stevenage (Data source: IMD 2010)
26 This would occur if other areas improved their scores at a faster rate
The Stevenage Borough Local Plan Scoping Report92
Social Inclusiveness
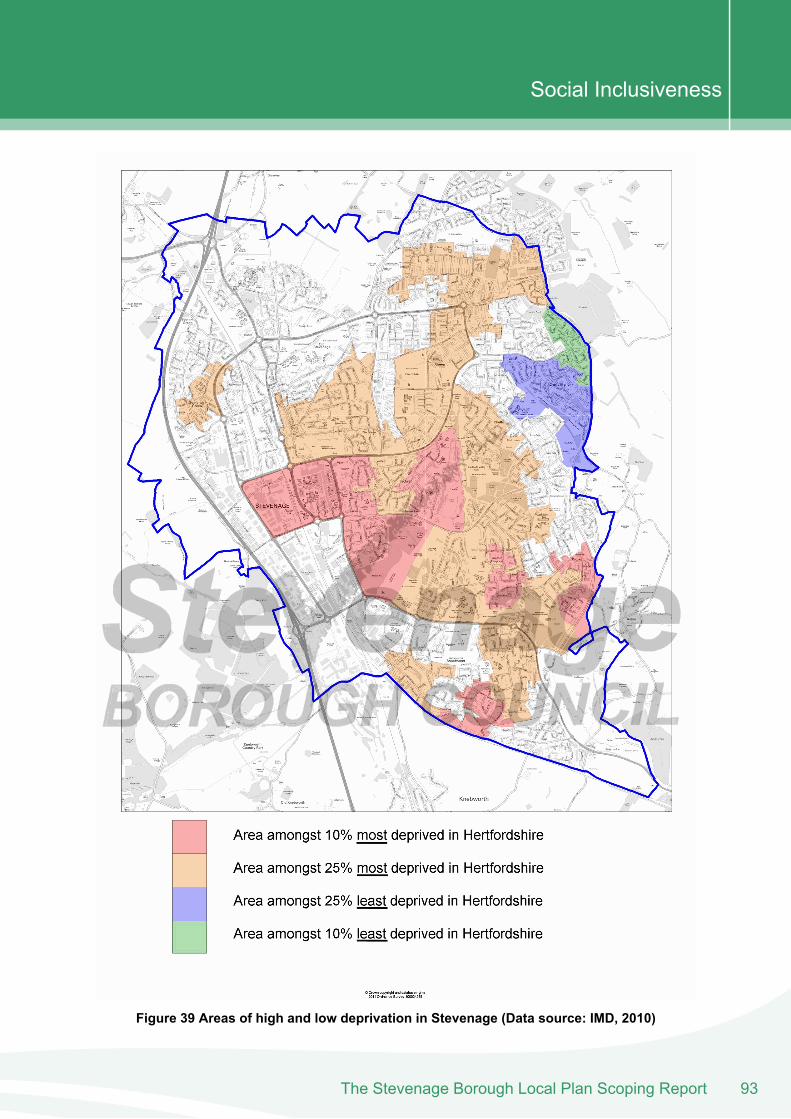
Figure 39 Areas of high and low deprivation in Stevenage (Data source: IMD, 2010)
93The Stevenage Borough Local Plan Scoping Report
Social Inclusiveness
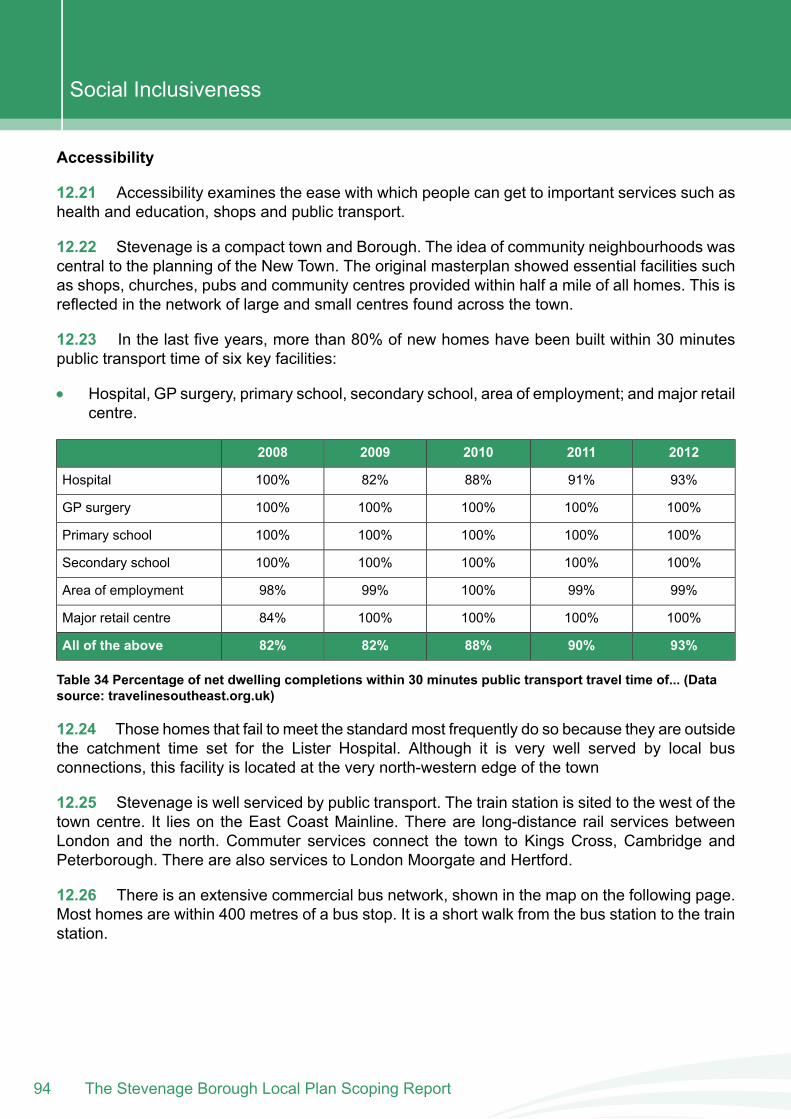
Accessibility
12.21 Accessibility examines the ease with which people can get to important services such ashealth and education, shops and public transport.
12.22 Stevenage is a compact town and Borough. The idea of community neighbourhoods wascentral to the planning of the New Town. The original masterplan showed essential facilities suchas shops, churches, pubs and community centres provided within half a mile of all homes. This isreflected in the network of large and small centres found across the town.
12.23 In the last five years, more than 80% of new homes have been built within 30 minutespublic transport time of six key facilities:
Hospital, GP surgery, primary school, secondary school, area of employment; and major retailcentre.
20122011201020092008
93%91%88%82%100%Hospital
100%100%100%100%100%GP surgery
100%100%100%100%100%Primary school
100%100%100%100%100%Secondary school
99%99%100%99%98%Area of employment
100%100%100%100%84%Major retail centre
93%90%88%82%82%All of the above
Table 34 Percentage of net dwelling completions within 30 minutes public transport travel time of... (Datasource: travelinesoutheast.org.uk)
12.24 Those homes that fail to meet the standard most frequently do so because they are outsidethe catchment time set for the Lister Hospital. Although it is very well served by local busconnections, this facility is located at the very north-western edge of the town
12.25 Stevenage is well serviced by public transport. The train station is sited to the west of thetown centre. It lies on the East Coast Mainline. There are long-distance rail services betweenLondon and the north. Commuter services connect the town to Kings Cross, Cambridge andPeterborough. There are also services to London Moorgate and Hertford.
12.26 There is an extensive commercial bus network, shown in the map on the following page.Most homes are within 400 metres of a bus stop. It is a short walk from the bus station to the trainstation.
The Stevenage Borough Local Plan Scoping Report94
Social Inclusiveness
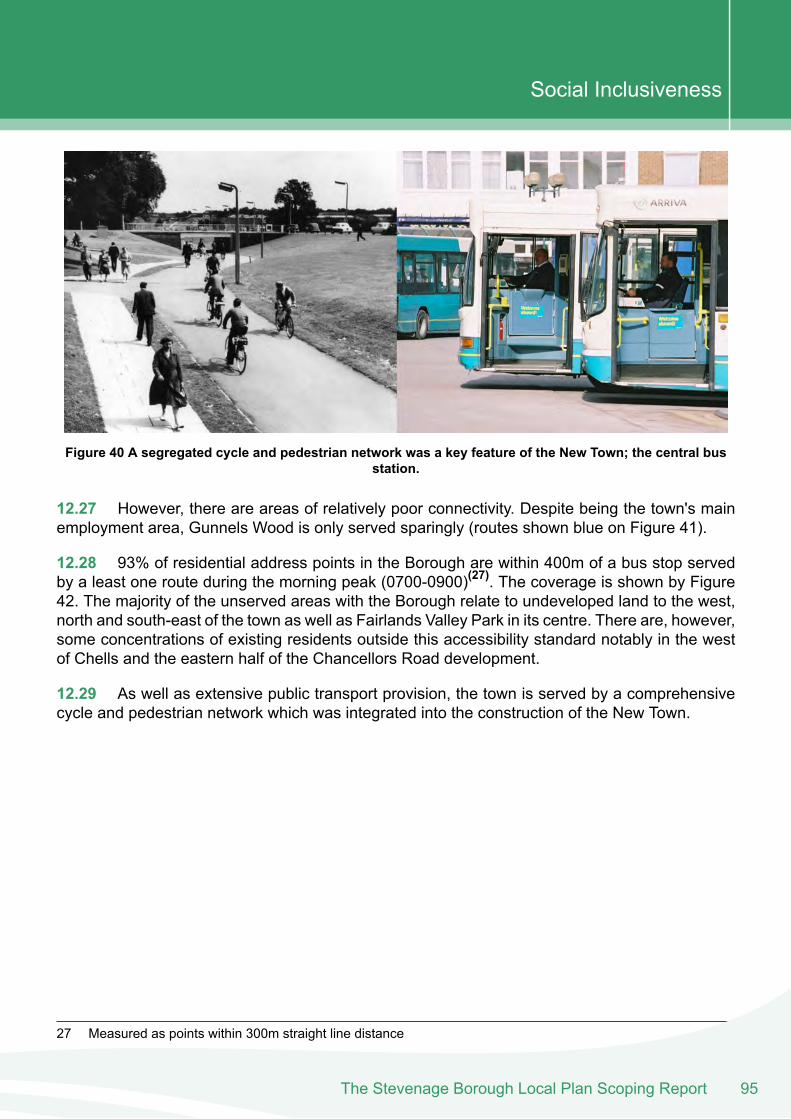
Figure 40 A segregated cycle and pedestrian network was a key feature of the New Town; the central busstation.
12.27 However, there are areas of relatively poor connectivity. Despite being the town's mainemployment area, Gunnels Wood is only served sparingly (routes shown blue on Figure 41).
12.28 93% of residential address points in the Borough are within 400m of a bus stop servedby a least one route during the morning peak (0700-0900)(27). The coverage is shown by Figure42. The majority of the unserved areas with the Borough relate to undeveloped land to the west,north and south-east of the town as well as Fairlands Valley Park in its centre. There are, however,some concentrations of existing residents outside this accessibility standard notably in the westof Chells and the eastern half of the Chancellors Road development.
12.29 As well as extensive public transport provision, the town is served by a comprehensivecycle and pedestrian network which was integrated into the construction of the New Town.
27 Measured as points within 300m straight line distance
95The Stevenage Borough Local Plan Scoping Report
Social Inclusiveness
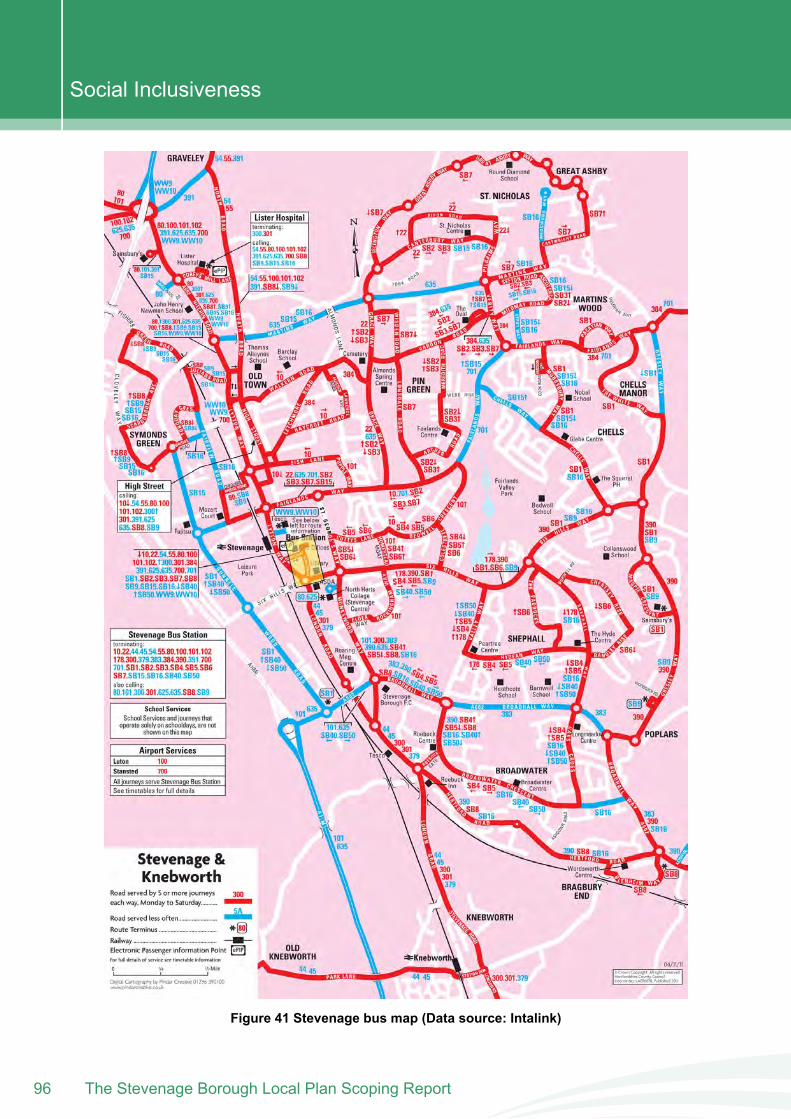
Figure 41 Stevenage bus map (Data source: Intalink)
The Stevenage Borough Local Plan Scoping Report96
Social Inclusiveness
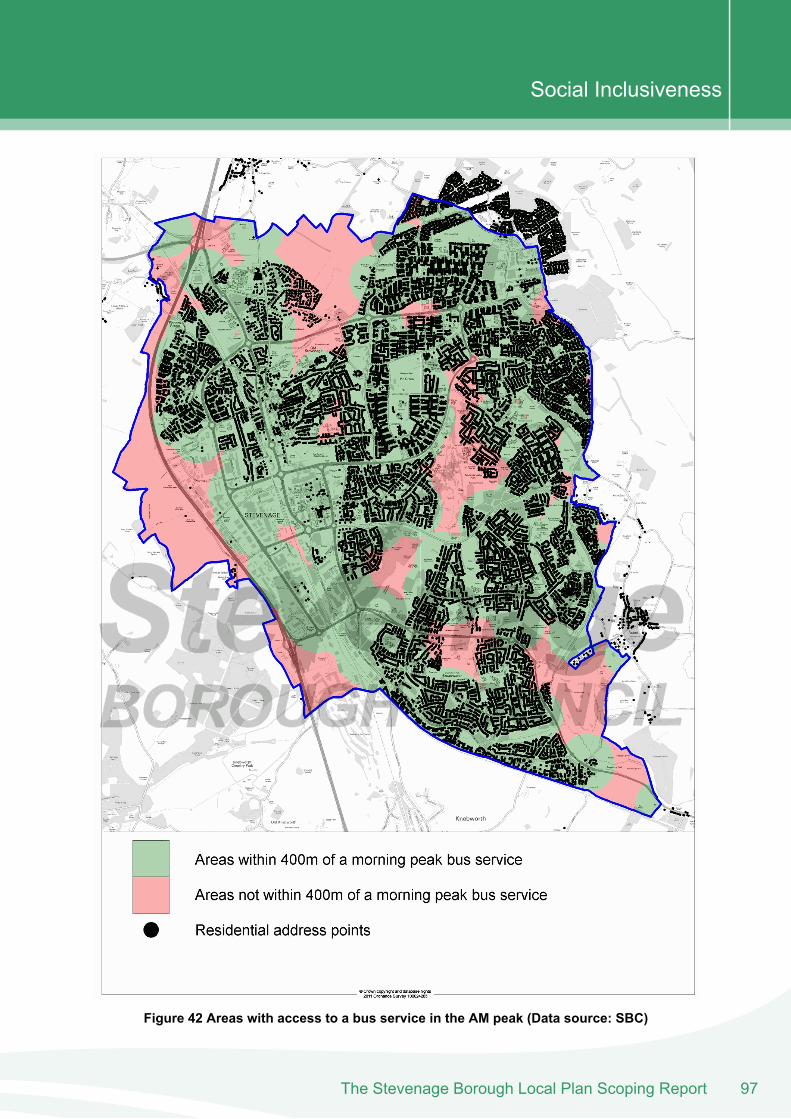
Figure 42 Areas with access to a bus service in the AM peak (Data source: SBC)
97The Stevenage Borough Local Plan Scoping Report
Social Inclusiveness
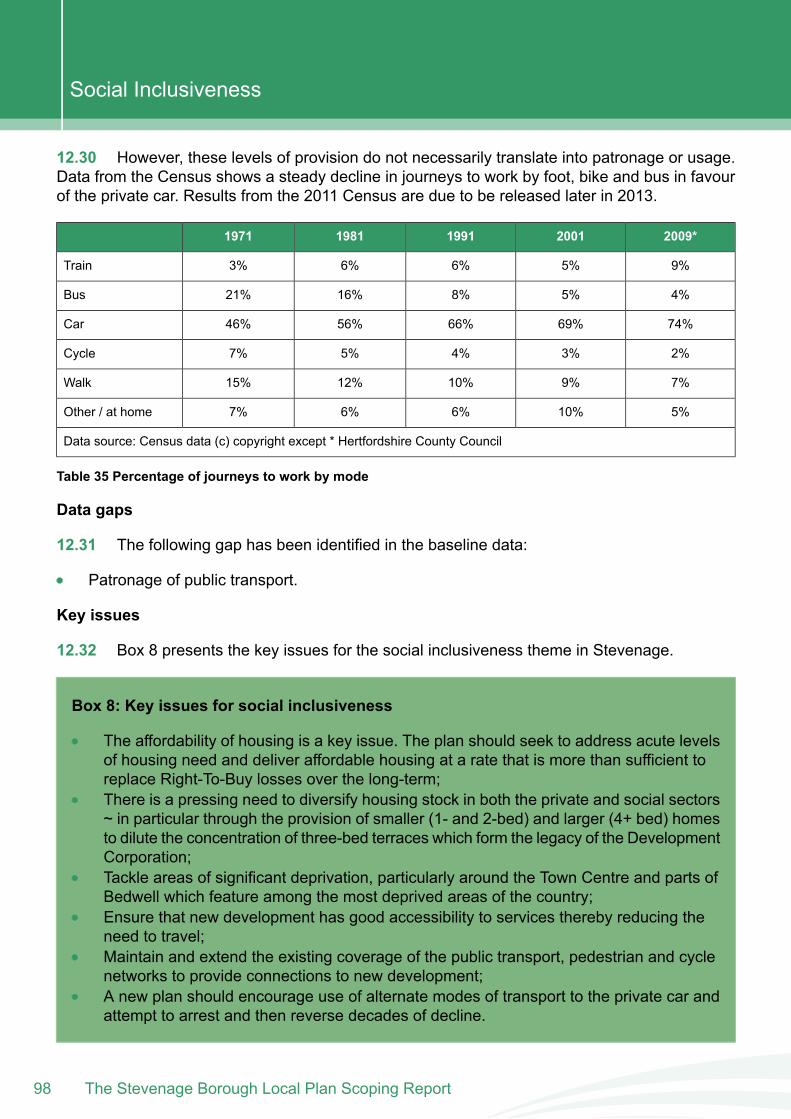
12.30 However, these levels of provision do not necessarily translate into patronage or usage.Data from the Census shows a steady decline in journeys to work by foot, bike and bus in favourof the private car. Results from the 2011 Census are due to be released later in 2013.
2009*2001199119811971
9%5%6%6%3%Train
4%5%8%16%21%Bus
74%69%66%56%46%Car
2%3%4%5%7%Cycle
7%9%10%12%15%Walk
5%10%6%6%7%Other / at home
Data source: Census data (c) copyright except * Hertfordshire County Council
Table 35 Percentage of journeys to work by mode
Data gaps
12.31 The following gap has been identified in the baseline data:
Patronage of public transport.
Key issues
12.32 Box 8 presents the key issues for the social inclusiveness theme in Stevenage.
Box 8: Key issues for social inclusiveness
The affordability of housing is a key issue. The plan should seek to address acute levelsof housing need and deliver affordable housing at a rate that is more than sufficient toreplace Right-To-Buy losses over the long-term;There is a pressing need to diversify housing stock in both the private and social sectors~ in particular through the provision of smaller (1- and 2-bed) and larger (4+ bed) homesto dilute the concentration of three-bed terraces which form the legacy of the DevelopmentCorporation;Tackle areas of significant deprivation, particularly around the Town Centre and parts ofBedwell which feature among the most deprived areas of the country;Ensure that new development has good accessibility to services thereby reducing theneed to travel;Maintain and extend the existing coverage of the public transport, pedestrian and cyclenetworks to provide connections to new development;A new plan should encourage use of alternate modes of transport to the private car andattempt to arrest and then reverse decades of decline.
The Stevenage Borough Local Plan Scoping Report98
Social Inclusiveness

13 . Economic DevelopmentThe Stevenage Borough Local Plan Scoping Report
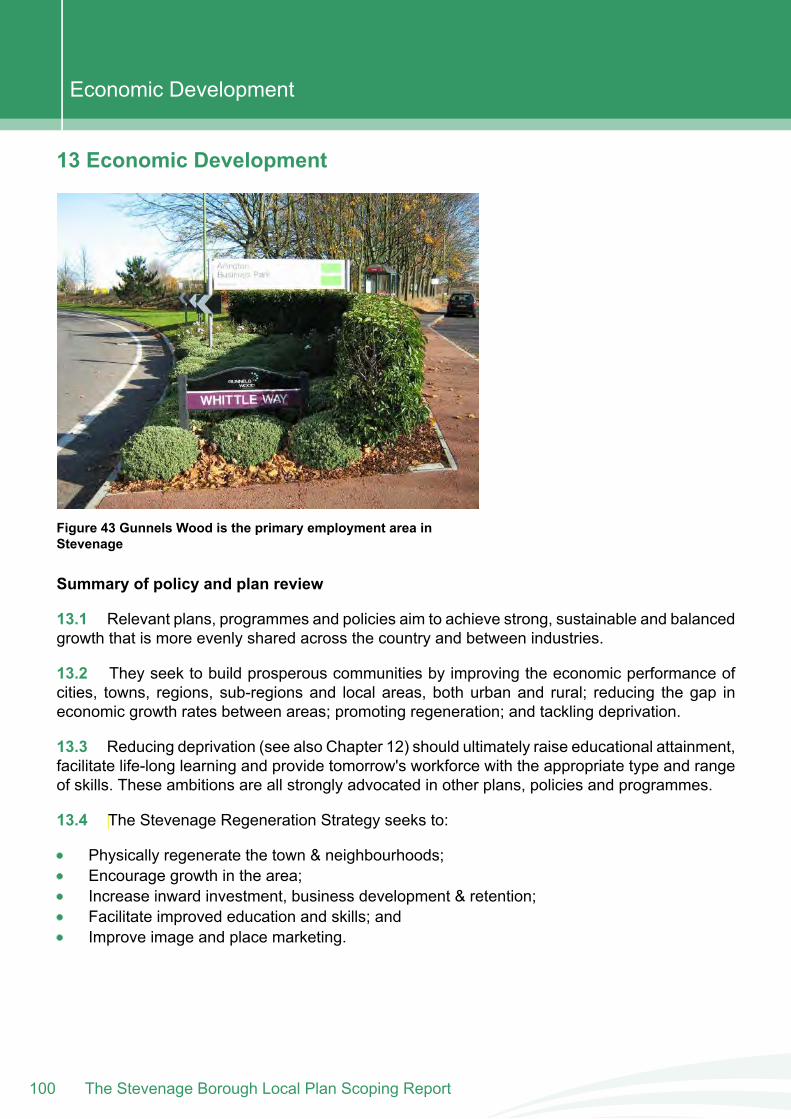
13 Economic Development
Figure 43 Gunnels Wood is the primary employment area inStevenage
Summary of policy and plan review
13.1 Relevant plans, programmes and policies aim to achieve strong, sustainable and balancedgrowth that is more evenly shared across the country and between industries.
13.2 They seek to build prosperous communities by improving the economic performance ofcities, towns, regions, sub-regions and local areas, both urban and rural; reducing the gap ineconomic growth rates between areas; promoting regeneration; and tackling deprivation.
13.3 Reducing deprivation (see also Chapter 12) should ultimately raise educational attainment,facilitate life-long learning and provide tomorrow's workforce with the appropriate type and rangeof skills. These ambitions are all strongly advocated in other plans, policies and programmes.
13.4 The Stevenage Regeneration Strategy seeks to:
Physically regenerate the town & neighbourhoods;Encourage growth in the area;Increase inward investment, business development & retention;Facilitate improved education and skills; andImprove image and place marketing.
The Stevenage Borough Local Plan Scoping Report100
Economic Development
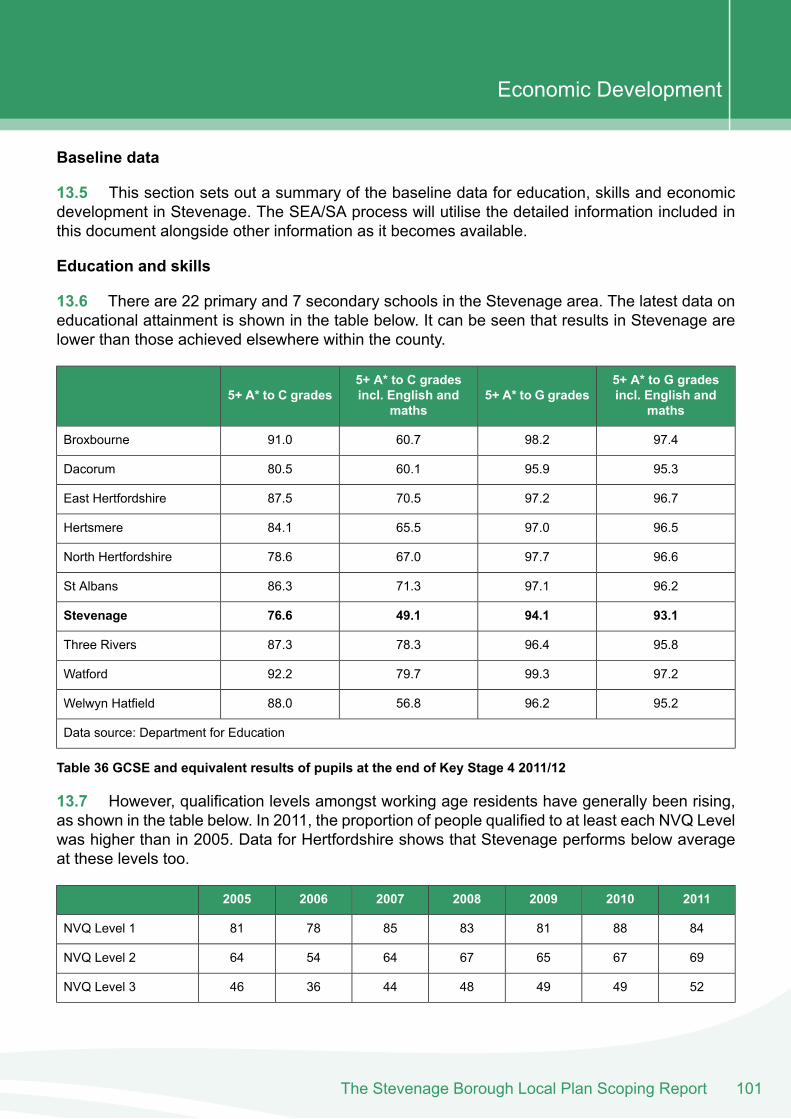
Baseline data
13.5 This section sets out a summary of the baseline data for education, skills and economicdevelopment in Stevenage. The SEA/SA process will utilise the detailed information included inthis document alongside other information as it becomes available.
Education and skills
13.6 There are 22 primary and 7 secondary schools in the Stevenage area. The latest data oneducational attainment is shown in the table below. It can be seen that results in Stevenage arelower than those achieved elsewhere within the county.
5+ A* to G gradesincl. English and
maths5+ A* to G grades
5+ A* to C gradesincl. English and
maths5+ A* to C grades
97.498.260.791.0Broxbourne
95.395.960.180.5Dacorum
96.797.270.587.5East Hertfordshire
96.597.065.584.1Hertsmere
96.697.767.078.6North Hertfordshire
96.297.171.386.3St Albans
93.194.149.176.6Stevenage
95.896.478.387.3Three Rivers
97.299.379.792.2Watford
95.296.256.888.0Welwyn Hatfield
Data source: Department for Education
Table 36 GCSE and equivalent results of pupils at the end of Key Stage 4 2011/12
13.7 However, qualification levels amongst working age residents have generally been rising,as shown in the table below. In 2011, the proportion of people qualified to at least each NVQ Levelwas higher than in 2005. Data for Hertfordshire shows that Stevenage performs below averageat these levels too.
2011201020092008200720062005
84888183857881NVQ Level 1
69676567645464NVQ Level 2
52494948443646NVQ Level 3
101The Stevenage Borough Local Plan Scoping Report
Economic Development
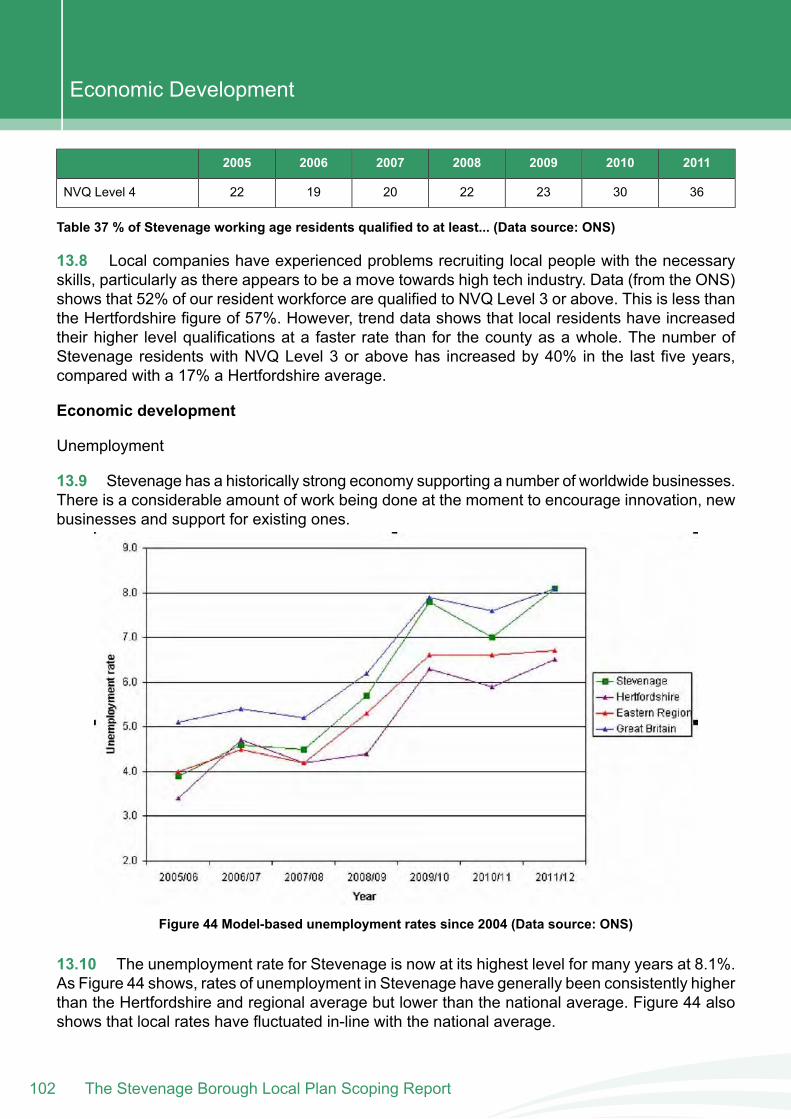
2011201020092008200720062005
36302322201922NVQ Level 4
Table 37 % of Stevenage working age residents qualified to at least... (Data source: ONS)
13.8 Local companies have experienced problems recruiting local people with the necessaryskills, particularly as there appears to be a move towards high tech industry. Data (from the ONS)shows that 52% of our resident workforce are qualified to NVQ Level 3 or above. This is less thanthe Hertfordshire figure of 57%. However, trend data shows that local residents have increasedtheir higher level qualifications at a faster rate than for the county as a whole. The number ofStevenage residents with NVQ Level 3 or above has increased by 40% in the last five years,compared with a 17% a Hertfordshire average.
Economic development
Unemployment
13.9 Stevenage has a historically strong economy supporting a number of worldwide businesses.There is a considerable amount of work being done at the moment to encourage innovation, newbusinesses and support for existing ones.
Figure 44 Model-based unemployment rates since 2004 (Data source: ONS)
13.10 The unemployment rate for Stevenage is now at its highest level for many years at 8.1%.As Figure 44 shows, rates of unemployment in Stevenage have generally been consistently higherthan the Hertfordshire and regional average but lower than the national average. Figure 44 alsoshows that local rates have fluctuated in-line with the national average.
The Stevenage Borough Local Plan Scoping Report102
Economic Development
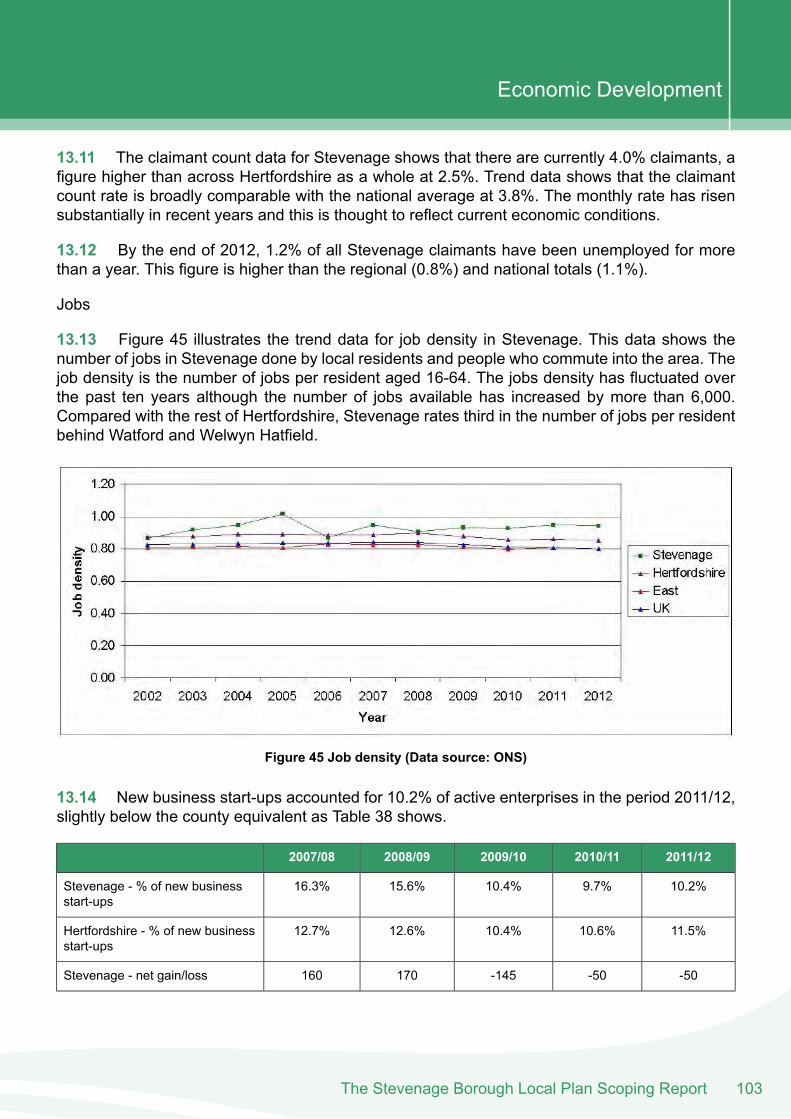
13.11 The claimant count data for Stevenage shows that there are currently 4.0% claimants, afigure higher than across Hertfordshire as a whole at 2.5%. Trend data shows that the claimantcount rate is broadly comparable with the national average at 3.8%. The monthly rate has risensubstantially in recent years and this is thought to reflect current economic conditions.
13.12 By the end of 2012, 1.2% of all Stevenage claimants have been unemployed for morethan a year. This figure is higher than the regional (0.8%) and national totals (1.1%).
Jobs
13.13 Figure 45 illustrates the trend data for job density in Stevenage. This data shows thenumber of jobs in Stevenage done by local residents and people who commute into the area. Thejob density is the number of jobs per resident aged 16-64. The jobs density has fluctuated overthe past ten years although the number of jobs available has increased by more than 6,000.Compared with the rest of Hertfordshire, Stevenage rates third in the number of jobs per residentbehind Watford and Welwyn Hatfield.
Figure 45 Job density (Data source: ONS)
13.14 New business start-ups accounted for 10.2% of active enterprises in the period 2011/12,slightly below the county equivalent as Table 38 shows.
2011/122010/112009/102008/092007/08
10.2%9.7%10.4%15.6%16.3%Stevenage - % of new businessstart-ups
11.5%10.6%10.4%12.6%12.7%Hertfordshire - % of new businessstart-ups
-50-50-145170160Stevenage - net gain/loss
103The Stevenage Borough Local Plan Scoping Report
Economic Development
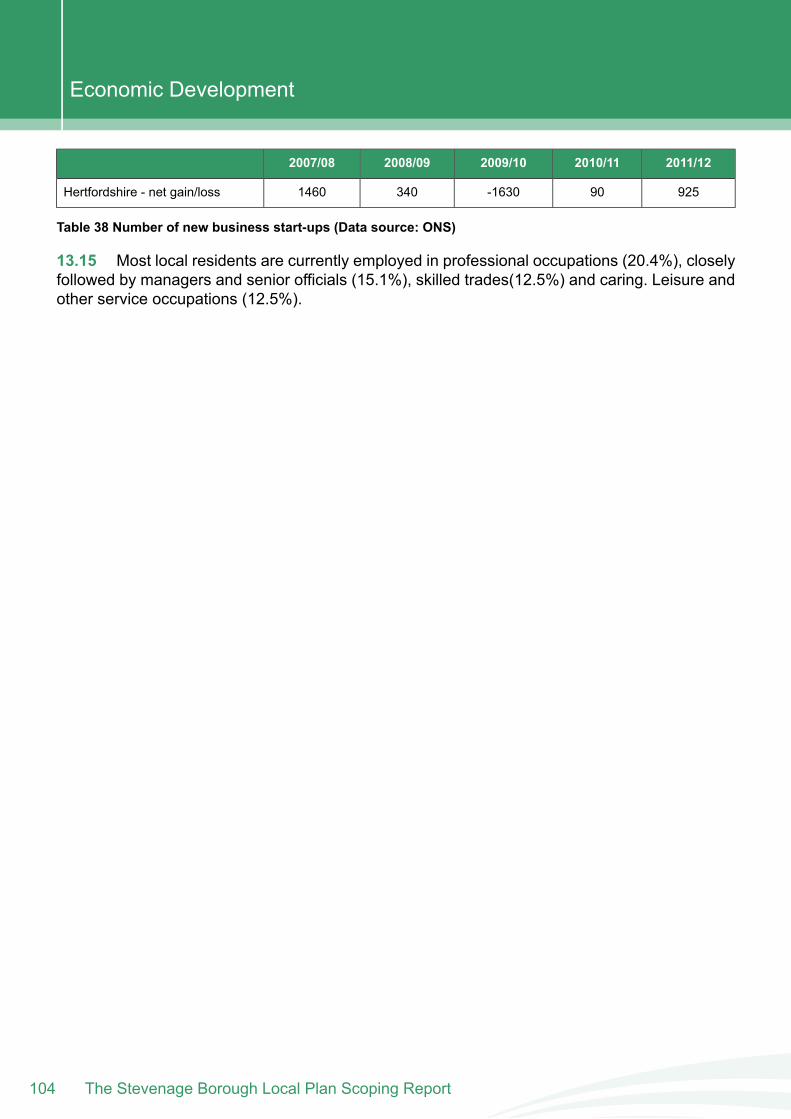
2011/122010/112009/102008/092007/08
92590-16303401460Hertfordshire - net gain/loss
Table 38 Number of new business start-ups (Data source: ONS)
13.15 Most local residents are currently employed in professional occupations (20.4%), closelyfollowed by managers and senior officials (15.1%), skilled trades(12.5%) and caring. Leisure andother service occupations (12.5%).
The Stevenage Borough Local Plan Scoping Report104
Economic Development
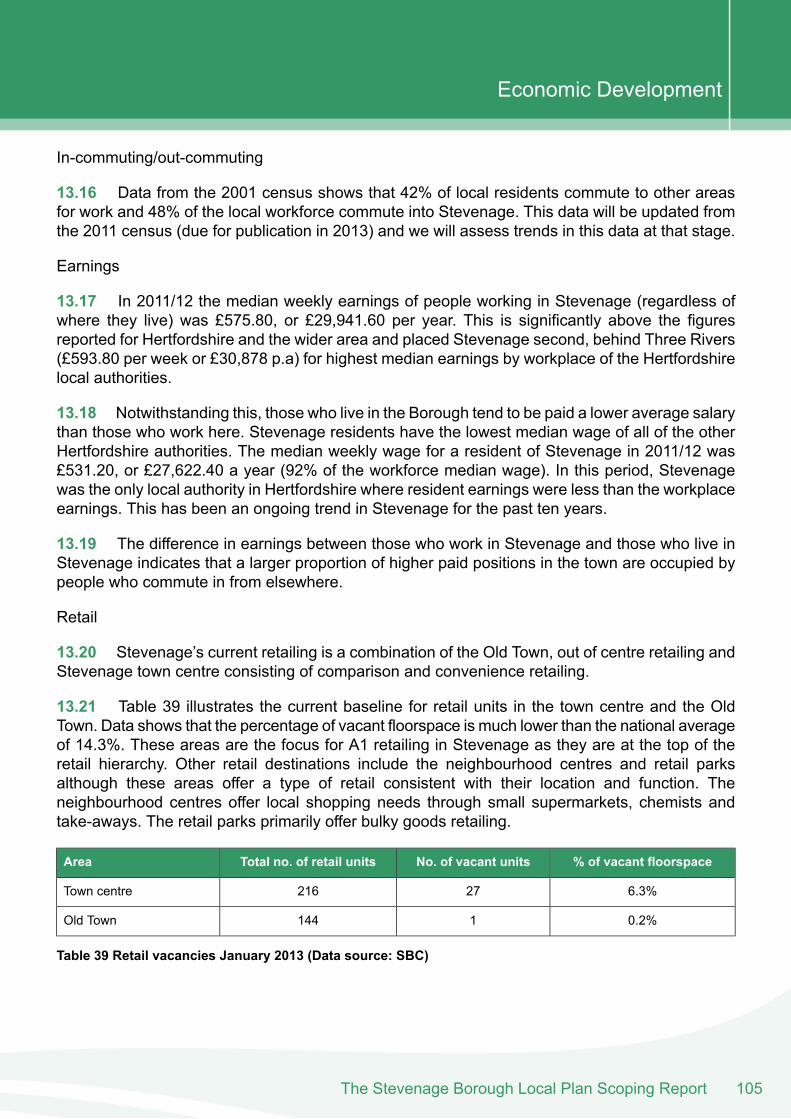
In-commuting/out-commuting
13.16 Data from the 2001 census shows that 42% of local residents commute to other areasfor work and 48% of the local workforce commute into Stevenage. This data will be updated fromthe 2011 census (due for publication in 2013) and we will assess trends in this data at that stage.
Earnings
13.17 In 2011/12 the median weekly earnings of people working in Stevenage (regardless ofwhere they live) was £575.80, or £29,941.60 per year. This is significantly above the figuresreported for Hertfordshire and the wider area and placed Stevenage second, behind Three Rivers(£593.80 per week or £30,878 p.a) for highest median earnings by workplace of the Hertfordshirelocal authorities.
13.18 Notwithstanding this, those who live in the Borough tend to be paid a lower average salarythan those who work here. Stevenage residents have the lowest median wage of all of the otherHertfordshire authorities. The median weekly wage for a resident of Stevenage in 2011/12 was£531.20, or £27,622.40 a year (92% of the workforce median wage). In this period, Stevenagewas the only local authority in Hertfordshire where resident earnings were less than the workplaceearnings. This has been an ongoing trend in Stevenage for the past ten years.
13.19 The difference in earnings between those who work in Stevenage and those who live inStevenage indicates that a larger proportion of higher paid positions in the town are occupied bypeople who commute in from elsewhere.
Retail
13.20 Stevenage’s current retailing is a combination of the Old Town, out of centre retailing andStevenage town centre consisting of comparison and convenience retailing.
13.21 Table 39 illustrates the current baseline for retail units in the town centre and the OldTown. Data shows that the percentage of vacant floorspace is much lower than the national averageof 14.3%. These areas are the focus for A1 retailing in Stevenage as they are at the top of theretail hierarchy. Other retail destinations include the neighbourhood centres and retail parksalthough these areas offer a type of retail consistent with their location and function. Theneighbourhood centres offer local shopping needs through small supermarkets, chemists andtake-aways. The retail parks primarily offer bulky goods retailing.
% of vacant floorspaceNo. of vacant unitsTotal no. of retail unitsArea
6.3%27216Town centre
0.2%1144Old Town
Table 39 Retail vacancies January 2013 (Data source: SBC)
105The Stevenage Borough Local Plan Scoping Report
Economic Development

13.22 Trend data shows that the two primary retail centres have performed consistently wellagainst national averages. However, whilst the town centre shows signs of vitality and viability,there are serious shortcomings in the environmental quality of the centre and the limited natureof the retail offer. There has been limited growth in the total quantity of units available and existingunits do not meet current retail needs.
13.23 Larger retail centres are generally experiencing growth with demand for developmentactivity whilst the smaller centres serve a more localised function without the same demand fordevelopment opportunity. The Stevenage Town Centre Retail Assessment demonstrates that inretail terms Stevenage has fallen significantly behind other Hertfordshire centres such as Watford.It is therefore imperative that Stevenage and its town centre be enhanced to be in parallel to meetthe requirements of the existing and growing population.
Data gaps
13.24 The following gaps have been identified in the baseline data:
Further detail on local occupations;Further data on the skills gap;Up to date commuting for work data;Townscape analysis.
Key issues
Seek to improve educational attainment in schools and sustain improvements inqualification levels amongst the working population.The sustainability of any future housing growth in Stevenage will develop strong linkswith the provision of employment. Employment levels will need to support the expectedpopulation growth whilst also having consideration level of skill likely to be required.There is a need to achieve a closer match between the demand and supply of labour byincreasing the supply of affordable housing and introducing training and educationmeasures that will improve local access.An urban renaissance is required that respects the New Town heritage status.Stevenage town centre and retail provision will need to significantly improve to maximisethe regeneration of the town.Stevenage must be firmly established as a focal point for economic growth betweenLondon and Cambridge, by supporting key areas of economic development such asbiotechnology and research and development.An adequate supply of high quality business land and premises that meet the needs ofthe town’s diverse economy will need to be provided.
The Stevenage Borough Local Plan Scoping Report106
Economic Development

14 . Developing SEA/SA ObjectivesThe Stevenage Borough Local Plan Scoping Report
14 Developing SEA/SA ObjectivesDeveloping objectives
14.1 Chapters 4 to 13 highlight a number of issues within the current baseline. This has led tothe formulation of a number of objectives for future iterations of the SEA/SA process. Theseobjectives are intended to strengthen positive trends. They are also intended to enable the localplan process to provide further support to themes which negatively impact the local baseline.
Objective 1
To protect and enhance biodiversity in all areas and maintain and restore the full range of habitatsand species to viable levels.
14.2 This objective is intended to protect all areas which promote biodiversity. Designated sitesmust be protected through policy at the local level but the importance of non-designated sites mustalso be considered. This may be of particular concern where areas for growth are identified.
Objective 2
To protect and enhance human health & wellbeing, meeting the needs of existing residents andencourage local population growth.
14.3 This objective is intended to ensure that the existing and growing population reach theirfull potential. Reducing crime, improving levels of physical activity and reducing areas of healthconcern are key issues to be achieved via this objective. Baseline data shows that an ageingpopulation coupled with high levels of out-migration will require strategic objectives to meet theneeds of local residents. The continued growth of the local population will further improve thesustainability of the town by providing a balance between population, homes and jobs.
Objective 3
To protect and enhance water quality, encourage water conservation and reduce flood risk.
14.4 This objective is intended to reduce pressure on local water resources and reduce floodrisk where possible. Higher than average water consumption had led to the local aquifer beingclassified as over-abstracted. Policies should aim to encourage water conservation principles toincrease local flows and improve water quality. The local plan process can also aim to reduceflood risk through the sequential testing of potential development sites.
Objective 4
To reduce land contamination and safeguard soil quality.
The Stevenage Borough Local Plan Scoping Report108
Developing SEA/SA Objectives
14.5 This objective is intended to ensure that the best quality agricultural land is retained forsuch use. Land contamination should be considered an issue where previously developed sitesare identified for development.
Objective 5
To minimise waste and increase recycling.
14.6 This objective is intended to ensure than minimal household waste is transported for landfillwith the maximum amount of waste sent for recycling. Local plan policies might achieve this throughpolicies which require space for recycling facilities provided on new developments.
Objective 6
To maximise the quality of environmental conditions by limiting noise and air pollution, reducinggreenhouse gas and carbon emissions and maximising the potential for renewable energyproduction.
14.7 This objective is intended to limit noise and air pollution from all sources and ensure thatnew developments do not negatively affect the monitored levels for nitrogen dioxide and PM10.Current data does not suggest that there are any relevant exceedences of the Air Quality Objectivesin Stevenage and this objective seeks to maintain this trend. It is also intended to reduce energyconsumption, and therefore carbon emissions, and improve access to renewable energy sources.This objective is closely linked to Objective 11.
Objective 7
To preserve and enhance heritage assets designated for their archaeological, architectural,artistic and/or historic interest and protect their settings.
14.8 This objective is intended to maintain the historic environment. Heritage assets are at riskfrom inappropriate development if sites and site allocations are not managed properly. The localplan process will be required to outline how Stevenage's heritage assets will be maintained.
Objective 8
To create places, spaces and buildings that work well, age well, look well and which enhancethe diversity and distinctiveness of the local character and landscape.
14.9 This objective is intended to create places where people want to live, work and spend time.Buildings which are well designed and able to adapt to potential future needs should be encouragedthrough the local plan process.
109The Stevenage Borough Local Plan Scoping Report
Developing SEA/SA Objectives
Objective 9
To improve access to all services, taking into consideration inequalities relating to age,gender,disability, race and faith.
14.10 This objective is intended to ensure that all local residents can access all of the necessaryservices to provide an excellent quality of life. This might include healthcare, schools, communityfacilities, leisure facilities, open space, shops and employment services.
Objective 10
To address the causes of deprivation and ensure everyone has access to decent, appropriateand affordable housing.
14.11 This objective is intended to ensure that local people can afford to live locally. Affordabilityis a key issue and the local plan process will need to identify sufficient sites to deliver appropriatehousing within appropriate timeframes.
Objective 11
To reduce the need to travel and increase the use of sustainable methods of transportation.
14.12 This objective is intended to reduce the need to travel, and therefore greenhouse gasemissions. Road transport is the main impact on air quality in Stevenage and this indicator seeksto ensure that these effects are further reduced through positive management of alternative methodsof transport. This objective is also further linked to human health by promoting walking, cyclingand other methods of transport.
Objective 12
To improve access to skills, knowledge and education to ensure that people can gain access toappropriate and satisfying work.
14.13 This objective is intended to balance local skills with local jobs. Ensuring working ageresidents have access to the necessary facilities to improve skills and education will improve thecurrent imbalance. The local plan process will need to ensure that there is a suitable supply ofland for employment and skills development.
The Stevenage Borough Local Plan Scoping Report110
Developing SEA/SA Objectives
Objective 13
To support and grow the local economy, increase investment in people, equipment, employment,infrastructure and other assets ensuring that economic and employment centres remain efficientand viable.
14.14 This objective is intended to ensure that a programme of regeneration for Stevenage issupported via the local plan process. The structure of the town centre and some of theneighbourhood centres will need to be moved through a process of renewal to ensure thatinvestment is made at a suitable and the most appropriate location. This will be supported by localinfrastructure provision which should also be supported through the local plan process. Mainemployment centres should also be highlighted as areas with further growth potential, capitalisingon the prominent location of the town between London and Cambridge.
14.15 Table 40 illustrates the consistency between the proposed SEA/SA objectives.
111The Stevenage Borough Local Plan Scoping Report
Developing SEA/SA Objectives
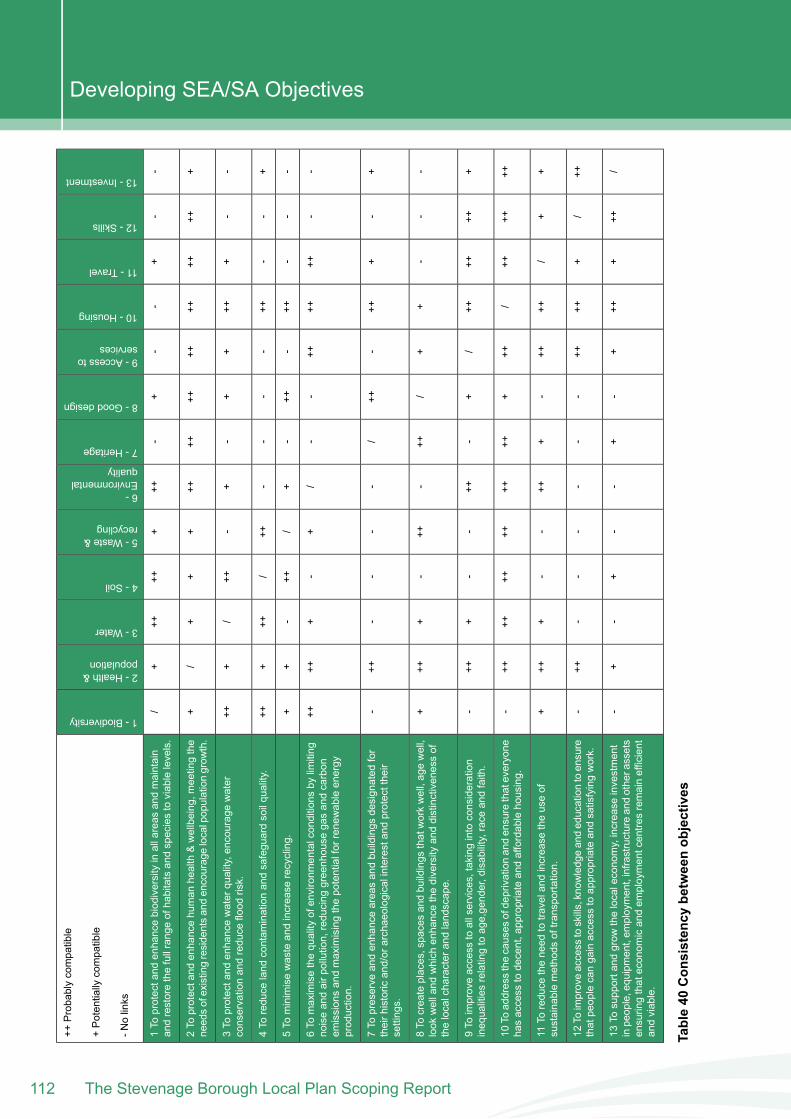
13-Investment
12-Skills
11-Travel
10-Housing
9-Accesstoservices
8-Gooddesign
7-Heritage
6-Environmentalquality
5-Waste&recycling
4-Soil
3-Water
2-Health&population
1-Biodiversity
++Probablycompatible
+Potentially
compatible
-Nolinks
--
+-
-+
-++
+++
+++
/1To
protectand
enhancebiodiversityinallareas
andmaintain
andrestorethefullrangeofhabitatsandspeciestoviablelevels.
+++
++++
++++
++++
++
+/
+2To
protectand
enhancehuman
health&wellbeing,m
eetingthe
needsofexistingresidentsandencouragelocalpopulationgrow
th.
--
+++
++
-+
-++
/+
++3To
protectand
enhancewaterquality,encourage
water
conservationandreduce
flood
risk.
+-
-++
--
--
++/
+++
++4To
reduce
land
contam
inationandsafeguardsoilquality.
--
-++
-++
-+
/++
-+
+5To
minimisewasteandincrease
recycling.
--
++++
++-
-/
+-
+++
++6To
maximisethequality
ofenvironm
entalconditions
bylim
iting
noiseandairpollution,reducing
greenhouse
gasandcarbon
emissionsandmaximisingthepotentialforrenewableenergy
production.
+-
+++
-++
/-
--
-++
-7To
preserve
andenhanceareasandbuildings
designated
for
theirhistoric
and/orarchaeologicalinterestandprotecttheir
settings.
--
-+
+/
++-
++-
+++
+8To
createplaces,spacesandbuildings
thatworkwell,agewell,
look
welland
which
enhancethediversity
anddistinctivenessof
thelocalcharacterandlandscape.
+++
++++
/+
-++
--
+++
-9To
improveaccess
toallservices,taking
intoconsideration
inequalitiesrelatingtoage,gender,disability,raceandfaith.
++++
++/
+++
++++
++++
++++
-10
Toaddressthecauses
ofdeprivationandensurethateveryone
hasaccess
todecent,appropriateandaffordablehousing.
++
/++
++-
+++
--
+++
+11
Toreduce
theneed
totraveland
increase
theuseof
sustainablemethods
oftransportation.
++/
+++
++-
--
--
-++
-12
Toimproveaccess
toskills,knowledgeandeducationtoensure
thatpeoplecangainaccess
toappropriateandsatisfyingwork.
/++
+++
+-
+-
-+
-+
-13
Tosupportand
grow
thelocaleconomy,increase
investment
inpeople,equipment,em
ployment,infrastructureandotherassets
ensuringthateconom
icandem
ploymentcentresremainefficient
andviable.
Table40
Con
sisten
cybe
tweenob
jectives
The Stevenage Borough Local Plan Scoping Report112
Developing SEA/SA Objectives

15 . Next stagesThe Stevenage Borough Local Plan Scoping Report
15 Next stages15.1 This chapter summarises the stages of, and approach to the SEA/SA process that will becarried out following consultation on this Scoping Report. This has been presented through thestages set out in Chapter 2. This section also illustrates how the SEA/SA process is interlinkedwith the DPD process.
Stage B: Developing and refining alternatives and assessing effects
15.2 This stage (and the following two stages) of the process falls in line with the productionstages of the local plan process. This is the time when the detail of the plan is developed. Theassessment of options (or alternatives) is an important requirement of the SEA Directive, whichrequires that the Environmental Report includes the following information about reasonablealternatives: “an outline of the reasons for selecting the alternatives dealt with, and a descriptionof how the assessment was undertaken including any difficulties (such as technical deficienciesor lack of know-how) encountered in compiling the required information”.
15.3 An assessment of alternatives has already started with the first stage of the SA process.This is an iterative process as we consult on the plan during its preparation. As part of this process,a ‘do nothing’ option will be included. This is in order to demonstrate that the relevant aspects ofthe current state of the environment and the likely evolution thereof without implementation of theplan or programme have been examined.
Stage C: Preparing the Environmental Report
15.4 The preparation of the Environmental Report includes the assessment of all policy proposalswithin the local plan. Whilst assessment work has been undertaken in Stage B, the informationthat is prepared as part of the Environmental Report is generally more detailed.
15.5 In terms of the assessment methodology, detailed analysis of each policy of the local planwill be provided as they are developed. This introduces the application of Detailed AssessmentMatrices. The purpose of Detailed Assessment Matrices are to provide an in-depth assessmentof the different aspects of a particular policy to meet the requirements of the SEA Directive. Wehave started this process in the SA.
15.6 Detailed Assessment Matrices will include:
A description of the predicted effect;The duration of the effect;The frequency of the effect;Whether the effect is temporary or permanent;The geographic significance;The magnitude of effect;The severity of significance; andWhether mitigation is required/possible to reduce the effect.
The Stevenage Borough Local Plan Scoping Report114
Next stages
15.7 As required by the SEA Directive, cumulative, synergistic and indirect effects will also beidentified and evaluated during the assessment. An explanation of these is as follows:
Indirect effects are effects that are not a direct result of the plan, but occur away from theoriginal effect or as a result of a complex pathway.Cumulative effects arise where several developments each have insignificant effects buttogether have a significant effect, or where several individual effects of the plan have acombined effect.Synergistic effects interact to produce a total effect greater than the sum of the individualeffects.
15.8 The assessment of these effects will be presented in tabular format and show where thedifferent effects arise when two or more draft policies operate together.
Environmental Report
15.9 The above process will lead to the preparation of a Draft Environmental Report. This versionwill not contain every last detail required by the SEA Directive. It will instead carry out a role asan internal document designed to provide sustainability feedback to the local plan makers duringpreparation.
15.10 The purpose of the Draft Environmental Report is to enable plan makers to take on boardassessment findings, and proposed mitigation and monitoring whilst developing the plan. Thecombined presentation of these SEA/SA documents will form the Environmental Report.
Consultation of the Environmental Report
15.11 Once plan-makers have received and considered the Draft Environmental Report, anyamendments which are been made to the local plan will then be re-appraised by the SEA process.The result of the appraisal at this stage in the process will be the finalised consultation version ofthe Environmental Report.
15.12 The Environmental Report will be written in a form suitable for public consultation anduse by decision-makers. This version of the Environmental Report will be fully compliant with allaspects of the SEA Directive as set out in Annex 1 of the Directive. In line with the requirementsof the SEA Directive, a Non-Technical Summary will be produced to accompany the finalisedconsultation version of the Environmental Report.
Stage D: Consultation and decision-making
15.13 The Environmental Report will be presented alongside the draft versions of the local plan.Each version of the local plan will require an updated version of the Environmental Report toillustrate the decision making process with regard to environmental, social and economicassessments.
15.14 Following each consultation period, all responses concerning the SEA/SA process willbe analysed and reviewed. These will then be presented to plan-makers as part of the ongoingconsultation process.
115The Stevenage Borough Local Plan Scoping Report
Next stages
15.15 In accordance with the SEA procedures, a post-adoption statement will be produced atthe very end of the process.
Stage E: Monitoring implementation of the plan or programme
15.16 Having completed the assessment of the local plan as adopted, the SEA process requiresthe plan making authority to monitor any aspect of the assessment findings that might be associatedwith significant effects in the future. To address this requirement a monitoring framework will beprepared to incorporate indicators which are related to the identified potential adverse effects.
15.17 Indicators will be chosen in terms of their ability to provide information at the earliestpossible stage.
The Stevenage Borough Local Plan Scoping Report116
Next stages

Appendix 1The Stevenage Borough Local Plan Scoping Report
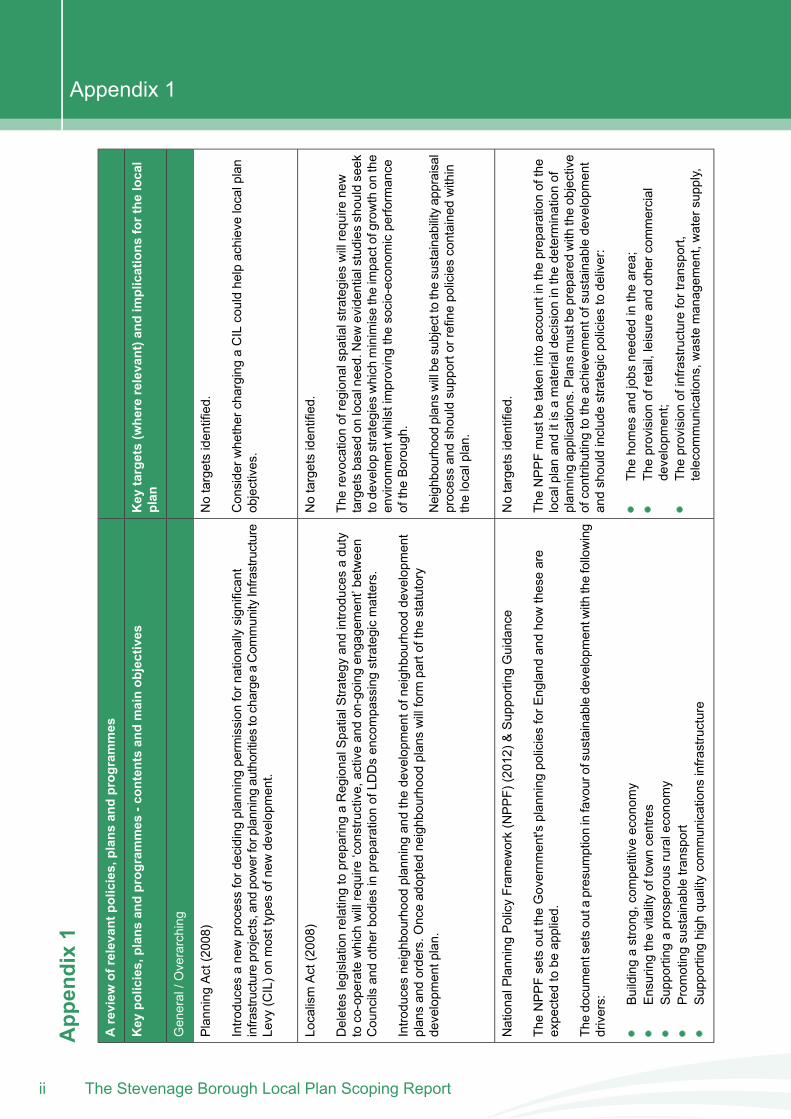
App
endix1
Areview
ofrelevant
policies,plan
san
dprog
rammes
Key
targets(whe
rerelevant)a
ndim
plications
forthe
local
plan
Key
policies,plan
san
dprog
rammes
-con
tentsan
dmainob
jectives
General/O
verarching
Notargetsidentified.
PlanningAct(2008)
Considerw
hethercharging
aCILcouldhelpachievelocalplan
objectives.
Introducesanewprocessfordecidingplanning
permission
fornationally
significant
infrastructureprojects,and
powerforplanningauthorities
tocharge
aCom
munity
Infrastructure
Levy
(CIL)onmosttypes
ofnewdevelopm
ent.
Notargetsidentified.
LocalismAct(2008)
Therevocationofregionalspatialstrategies
willrequire
new
targetsbasedon
localneed.New
evidentialstudies
shouldseek
todevelopstrategies
which
minimisetheimpactofgrow
thon
the
environm
entw
hilstimprovingthesocio-econom
icperformance
oftheBorough.
Deletes
legislationrelatingtopreparingaRegionalSpatialStrategy
andintroducesaduty
toco-operatewhich
willrequire
‘constructive,activeandon-going
engagement’between
Councils
andotherbodiesinpreparationofLD
Dsencompassingstrategicmatters.
Introducesneighbourhoodplanning
andthedevelopm
entofneighbourhood
developm
ent
plansandorders.O
nceadoptedneighbourhoodplanswillform
partofthestatutory
developm
entplan.
Neighbourhood
planswillbe
subjecttothesustainabilityappraisal
processandshouldsupportorrefinepoliciescontainedwithin
thelocalplan.
Notargetsidentified.
NationalPlanningPolicyFram
ework(NPPF)
(2012)&Supporting
Guidance
TheNPPFmustbetakenintoaccountinthepreparationofthe
localplananditisamaterialdecisioninthedeterminationof
planning
applications.P
lans
mustbeprepared
with
theobjective
ofcontributingtotheachievem
entofsustainabledevelopm
ent
andshouldincludestrategicpoliciestodeliver:
TheNPPFsetsoutthe
Governm
ent's
planning
policiesforE
ngland
andhowtheseare
expected
tobe
applied.
Thedocumentsetsouta
presum
ptioninfavourofsustainabledevelopm
entw
iththefollowing
drivers:
Thehomes
andjobs
needed
inthearea;
Buildingastrong,com
petitiveeconom
yTheprovisionofretail,leisureandothercom
mercial
developm
ent;
Ensuringthevitalityoftowncentres
Supporting
aprosperous
ruraleconomy
Theprovisionofinfrastructurefortransport,
telecommunications,w
astemanagem
ent,watersupply,
Promotingsustainabletransport
Supporting
high
quality
communications
infrastructure
The Stevenage Borough Local Plan Scoping Reportii
Appendix 1
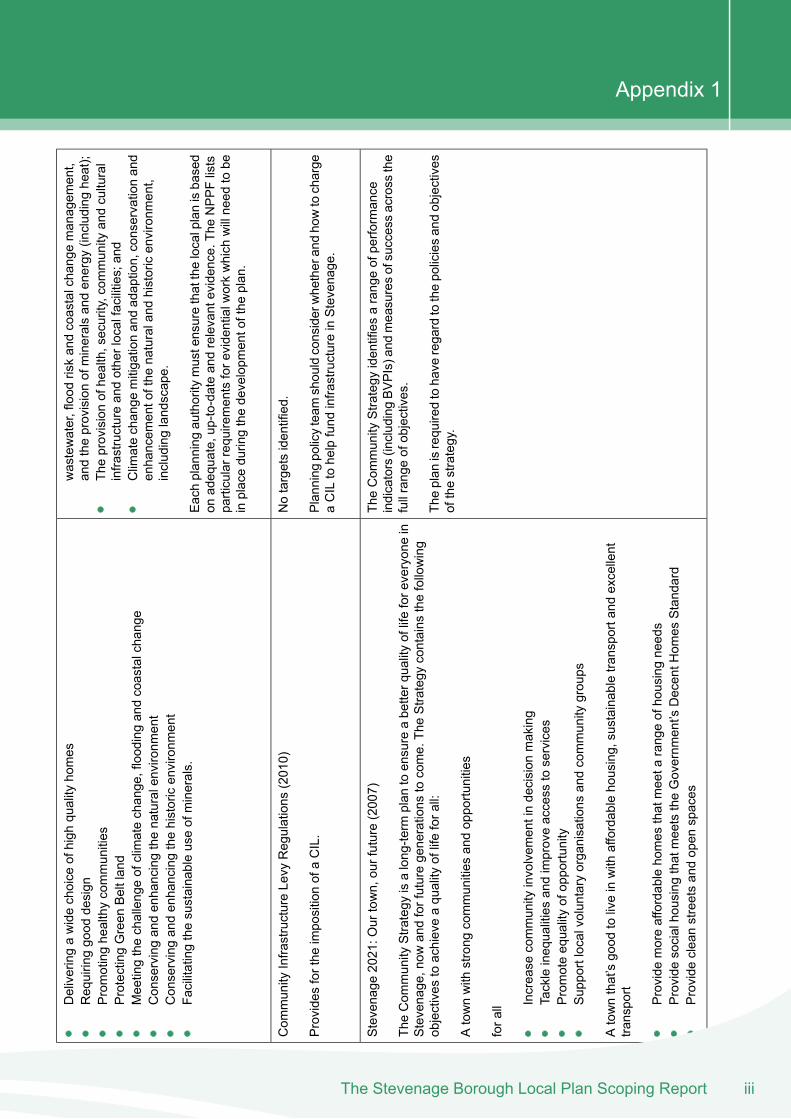
wastewater,flood
riskandcoastalchangemanagem
ent,
andtheprovisionofmineralsandenergy
(includingheat);
Deliveringawidechoice
ofhigh
quality
homes
Requiringgood
design
Theprovisionofhealth,security,com
munity
andcultural
infrastructureandotherlocalfacilities;and
Promotinghealthycommunities
ProtectingGreen
Beltland
Clim
atechange
mitigationandadaption,conservationand
enhancem
entofthe
naturaland
historicenvironm
ent,
includinglandscape.
Meetingthechallengeofclimatechange,floodingandcoastalchange
Conservingandenhancingthenaturalenvironm
ent
Conservingandenhancingthehistoricenvironm
ent
Eachplanning
authority
mustensurethatthelocalplanisbased
onadequate,up-to-dateandrelevantevidence.The
NPPFlists
particularrequirementsforevidentialw
orkwhich
willneed
tobe
inplaceduringthedevelopm
entofthe
plan.
Facilitatingthesustainableuseofminerals.
Notargetsidentified.
Com
munity
InfrastructureLevy
Regulations
(2010)
Planning
policyteam
shouldconsiderwhetherandhowtocharge
aCILtohelpfund
infrastructureinStevenage.
Providesforthe
impositionofaCIL.
TheCom
munity
Strategy
identifiesarangeofperformance
indicators(includingBV
PIs)andmeasuresofsuccessacross
the
fullrangeofobjectives.
Stevenage
2021:O
urtown,ourfuture(2007)
TheCom
munity
Strategy
isalong-term
plan
toensureabetterqualityoflifeforeveryonein
Stevenage,now
andforfuturegenerations
tocome.TheStrategy
contains
thefollowing
objectives
toachieveaquality
oflifeforall:
Theplan
isrequiredtohave
regardtothepoliciesandobjectives
ofthestrategy.
Atownwith
strong
communities
andopportunities
forall In
crease
community
involvem
entindecision
making
Tackleinequalitiesandimproveaccess
toservices
Promoteequalityofopportunity
Supportlocalvoluntaryorganisations
andcommunity
groups
Atownthat’sgood
toliveinwith
affordablehousing,sustainabletransportandexcellent
transport
Provide
moreaffordablehomes
thatmeeta
rangeofhousingneeds
Provide
socialhousingthatmeetstheGovernm
ent’s
DecentH
omes
Standard
Provide
cleanstreetsandopen
spaces
iiiThe Stevenage Borough Local Plan Scoping Report
Appendix 1
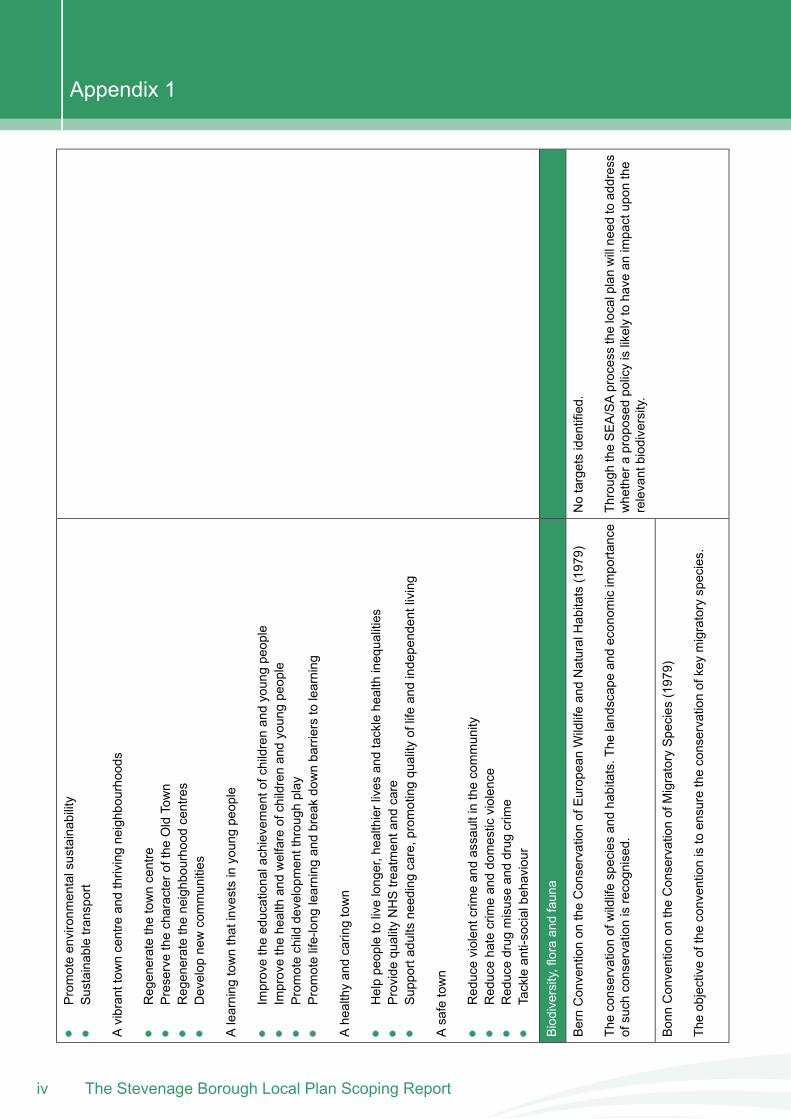
Promoteenvironm
entalsustainability
Sustainabletransport
Avibranttow
ncentreandthrivingneighbourhoods
Regeneratethetowncentre
Preservethecharacterofthe
OldTown
Regeneratetheneighbourhoodcentres
Develop
newcommunities
Alearning
townthatinvestsinyoungpeople
Improvetheeducationalachievementofchildrenandyoungpeople
Improvethehealthandwelfareofchildrenandyoungpeople
Promotechild
developm
entthrough
play
Promotelife-long
learning
andbreakdownbarrierstolearning
Ahealthyandcaringtown
Helppeopletolivelonger,healthierlives
andtacklehealthinequalities
Provide
quality
NHStreatmentand
care
Supportadultsneedingcare,promotingquality
oflifeandindependentliving
Asafetown
Reduceviolentcrim
eandassaultinthecommunity
Reducehatecrimeanddomestic
violence
Reducedrug
misuseanddrug
crime
Tackleanti-socialbehaviour
Biodiversity,floraandfauna
Notargetsidentified.
BernConventionon
theConservationofEuropeanWildlifeandNaturalHabitats(1979)
ThroughtheSEA/SAprocessthelocalplanwillneed
toaddress
whetheraproposed
policyislikelytohave
animpactupon
the
relevantbiodiversity.
Theconservationofwildlifespeciesandhabitats.The
landscapeandeconom
icimportance
ofsuch
conservationisrecognised.
BonnConventionon
theConservationofMigratorySpecies
(1979)
Theobjectiveoftheconventionistoensuretheconservationofkeymigratoryspecies.
The Stevenage Borough Local Plan Scoping Reportiv
Appendix 1
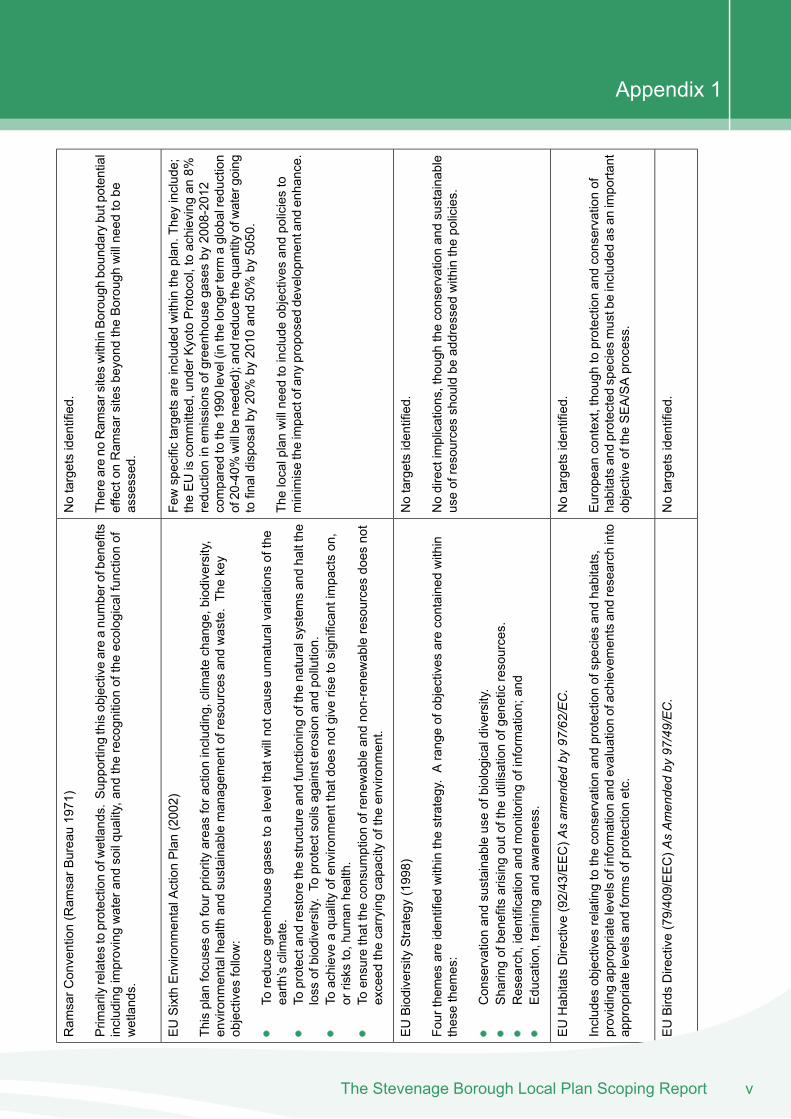
Notargetsidentified.
Ram
sarC
onvention(Ram
sarB
ureau1971)
Thereareno
Ram
sarsiteswithinBo
roughboundarybutpotential
effecton
Ram
sarsitesbeyond
theBorough
willneed
tobe
assessed.
Prim
arilyrelatestoprotectionofwetlands.
Supporting
thisobjectiveareanumberofbenefits
includingimprovingwaterandsoilquality,and
therecognition
oftheecologicalfunctionof
wetlands.
Fewspecifictargetsareincluded
withintheplan.Theyinclude;
theEUiscommitted,underKyotoProtocol,toachievingan
8%reductioninem
issionsofgreenhouse
gasesby
2008-2012
EUSixthEnvironm
entalActionPlan(2002)
Thisplan
focuseson
fourpriorityareasforactionincluding,climatechange,biodiversity,
environm
entalhealth
andsustainablemanagem
entofresources
andwaste.Thekey
objectives
follow:
comparedtothe1990
level(inthelongerterm
aglobalreduction
of20-40%
willbe
needed);andreduce
thequantityofwatergoing
tofinaldisposalby
20%by
2010
and50%by
5050.
Toreduce
greenhouse
gasestoalevelthatw
illnotcause
unnaturalvariations
ofthe
earth’sclimate.
Thelocalplanwillneed
toincludeobjectives
andpoliciesto
minimisetheimpactofanyproposed
developm
entand
enhance.
Toprotectand
restorethestructureandfunctioning
ofthenaturalsystemsandhaltthe
loss
ofbiodiversity.To
protectsoilsagainsterosion
andpollution.
Toachieveaquality
ofenvironm
entthatdoesnotgiverisetosignificantimpactson,
orrisks
to,hum
anhealth.
Toensurethattheconsum
ptionofrenewableandnon-renewableresourcesdoes
not
exceed
thecarrying
capacityoftheenvironm
ent.
Notargetsidentified.
EUBiodiversity
Strategy
(1998)
Nodirectimplications,thoughtheconservationandsustainable
useofresourcesshouldbe
addressedwithinthepolicies.
Fourthem
esareidentifiedwithinthestrategy.Arangeofobjectives
arecontainedwithin
thesethem
es:
Conservationandsustainableuseofbiologicaldiversity.
Sharingofbenefitsarisingoutofthe
utilisationofgenetic
resources.
Research,identificationandmonitoringofinformation;and
Education,trainingandaw
areness.
Notargetsidentified.
EUHabitatsDirective(92/43/EEC)A
sam
ende
dby
97/62/EC.
Europeancontext,though
toprotectionandconservationof
habitatsandprotectedspeciesmustbeincluded
asan
important
objectiveoftheSEA/SAprocess.
Includes
objectives
relatingtotheconservationandprotectionofspeciesandhabitats,
providingappropriatelevelsofinformationandevaluationofachievem
entsandresearch
into
appropriatelevelsandformsofprotectionetc.
Notargetsidentified.
EUBirdsDirective(79/409/EEC)A
sAmen
dedby
97/49/EC.
vThe Stevenage Borough Local Plan Scoping Report
Appendix 1
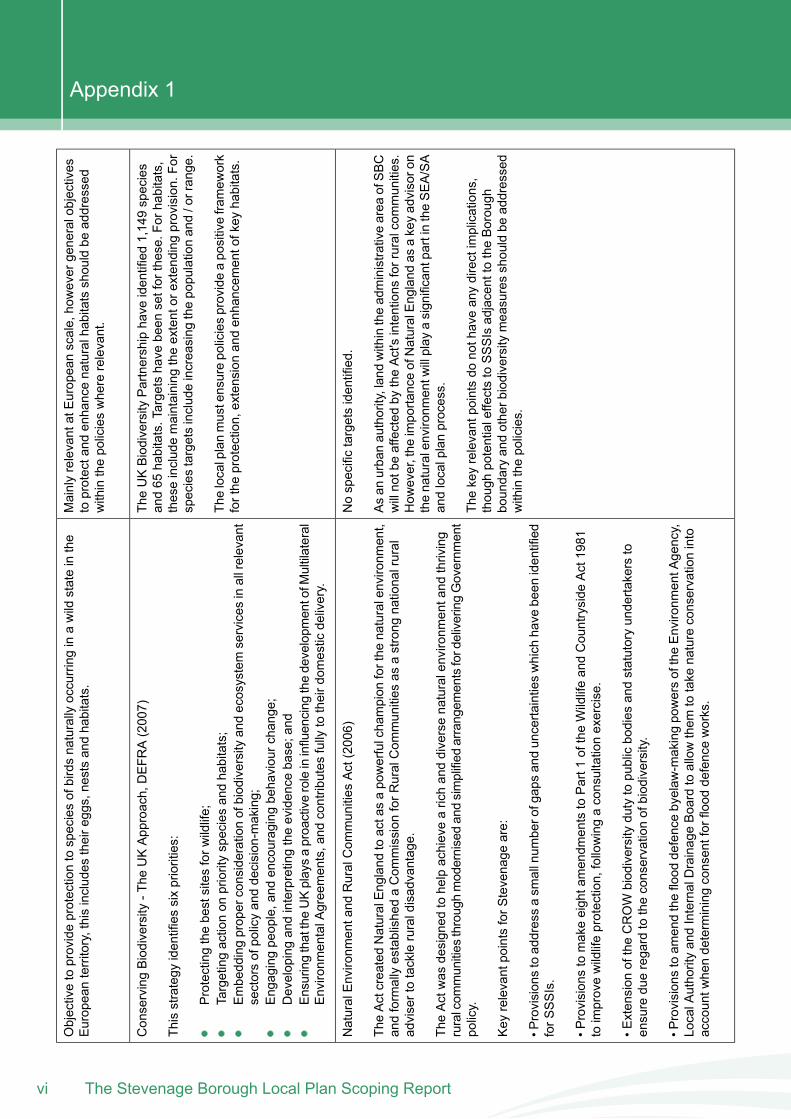
MainlyrelevantatEuropeanscale,howevergeneralobjectives
toprotectand
enhancenaturalhabitatsshouldbe
addressed
withinthepolicieswhererelevant.
Objectivetoprovideprotectiontospeciesofbirdsnaturally
occurringinawild
stateinthe
Europeanterritory,thisincludes
theireggs,nestsandhabitats.
TheUKBiodiversity
Partnershiphave
identified1,149species
and65
habitats.Targetshave
been
setforthese.Forhabitats,
theseincludemaintaining
theextentorextendingprovision.For
speciestargetsincludeincreasing
thepopulationand/orrange.
ConservingBiodiversity
-The
UKApproach,DEFR
A(2007)
Thisstrategy
identifiessixpriorities:
Protectingthebestsitesforw
ildlife;
Thelocalplanmustensurepoliciesprovideapositiveframew
ork
forthe
protection,extensionandenhancem
entofkey
habitats.
Targetingactionon
priorityspeciesandhabitats;
Embeddingproperconsiderationofbiodiversityandecosystemservices
inallrelevant
sectorsofpolicyanddecision-making;
Engagingpeople,and
encouragingbehaviourchange;
Developingandinterpretingtheevidence
base;and
EnsuringthattheUKplaysaproactiveroleininfluencing
thedevelopm
entofM
ultilateral
Environm
entalAgreements,and
contributes
fully
totheirdom
estic
delivery.
Nospecifictargetsidentified.
NaturalEnvironm
entand
RuralCom
munities
Act(2006)
Asan
urbanauthority,landwithintheadministrativearea
ofSBC
willnotbeaffected
bytheAct'sintentions
forruralcommunities.
How
ever,the
importanceofNaturalEngland
asakeyadvisoron
thenaturalenvironm
entw
illplay
asignificantpartintheSEA/SA
andlocalplanprocess.
TheActcreatedNaturalEngland
toactasapowerfulchampion
forthe
naturalenvironm
ent,
andformallyestablishedaCom
mission
forR
uralCom
munities
asastrong
nationalrural
advisertotackleruraldisadvantage.
TheActwas
designed
tohelpachievearichanddiversenaturalenvironm
entand
thriving
ruralcom
munities
throughmodernisedandsimplified
arrangem
entsfordeliveringGovernm
ent
policy.
Thekeyrelevantpointsdo
nothaveanydirectimplications,
though
potentialeffectstoSSSIsadjacenttotheBorough
boundaryandotherbiodiversity
measuresshouldbe
addressed
withinthepolicies.
Key
relevantpointsforS
tevenage
are:
•Provisionstoaddressasm
allnum
berofgapsanduncertaintieswhich
have
been
identified
forS
SSIs.
•Provisionstomakeeightamendm
entstoPart1
oftheWildlifeandCountryside
Act1981
toimprovewildlifeprotection,followingaconsultationexercise.
•Extension
oftheCROW
biodiversitydutytopublicbodies
andstatutoryundertakersto
ensuredueregardtotheconservationofbiodiversity.
•Provisionstoam
endtheflood
defencebyelaw
-makingpowersoftheEnvironm
entA
gency,
LocalAuthorityandInternalDrainageBoardtoallowthem
totake
natureconservationinto
accountw
hendeterminingconsentforflood
defenceworks.
The Stevenage Borough Local Plan Scoping Reportvi
Appendix 1
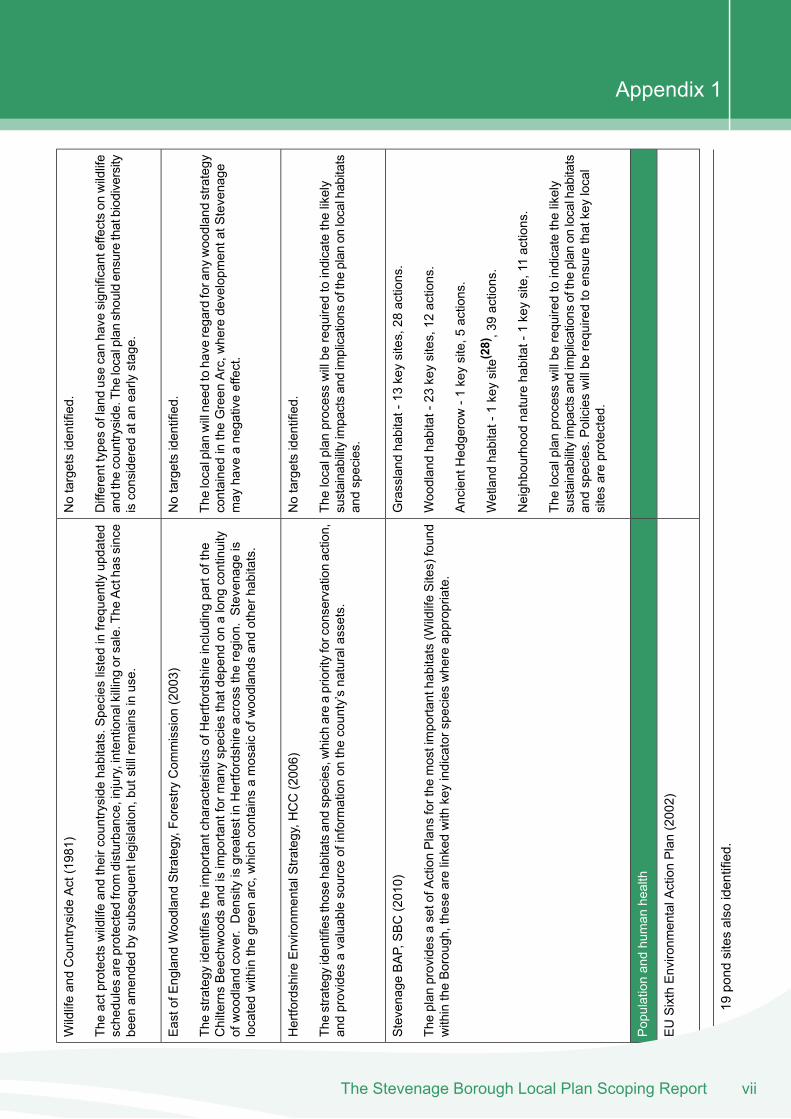
Notargetsidentified.
WildlifeandCountryside
Act(1981)
Differenttypes
ofland
usecanhave
significanteffectson
wildlife
andthecountryside.The
localplanshouldensurethatbiodiversity
isconsidered
atan
early
stage.
Theactprotectswildlifeandtheircountryside
habitats.S
pecies
listedinfrequently
updated
schedulesareprotectedfromdisturbance,injury,intentionalkillingorsale.The
Acthassince
been
amendedby
subsequentlegislation,butstillrem
ains
inuse.
Notargetsidentified.
EastofE
ngland
WoodlandStrategy,Forestry
Com
mission
(2003)
Thelocalplanwillneed
tohave
regardforany
woodlandstrategy
containedintheGreen
Arc,w
heredevelopm
entatS
tevenage
may
have
anegativeeffect.
Thestrategy
identifiestheimportantcharacteristicsofHertfordshire
includingpartofthe
ChilternsBeechwoods
andisimportantform
anyspeciesthatdepend
onalong
continuity
ofwoodlandcover.DensityisgreatestinHertfordshire
across
theregion.Stevenage
islocatedwithinthegreenarc,which
contains
amosaicofwoodlands
andotherhabitats.
Notargetsidentified.
Hertfordshire
Environm
entalStrategy,H
CC(2006)
Thelocalplanprocesswillbe
requiredtoindicatethelikely
sustainabilityimpactsandimplications
oftheplan
onlocalhabitats
andspecies.
Thestrategy
identifiesthosehabitatsandspecies,which
areapriorityforconservationaction,
andprovides
avaluablesource
ofinformationon
thecounty’snaturalassets.
Grassland
habitat-13
keysites,28
actions.
Stevenage
BAP,SBC(2010)
Woodlandhabitat-23
keysites,12
actions.
Theplan
provides
asetofA
ctionPlans
forthe
mostimportanthabitats(W
ildlifeSites)found
withintheBorough,these
arelinkedwith
keyindicatorspecies
whereappropriate.
AncientHedgerow-1
keysite,5
actions.
Wetland
habitat-1keysite(28),39actions.
Neighbourhood
naturehabitat-1keysite,11actions.
Thelocalplanprocesswillbe
requiredtoindicatethelikely
sustainabilityimpactsandimplications
oftheplan
onlocalhabitats
andspecies.Policieswillbe
requiredtoensurethatkeylocal
sitesareprotected.
Populationandhuman
health
EUSixthEnvironm
entalActionPlan(2002)
2819
pond
sitesalso
identified.
viiThe Stevenage Borough Local Plan Scoping Report
Appendix 1
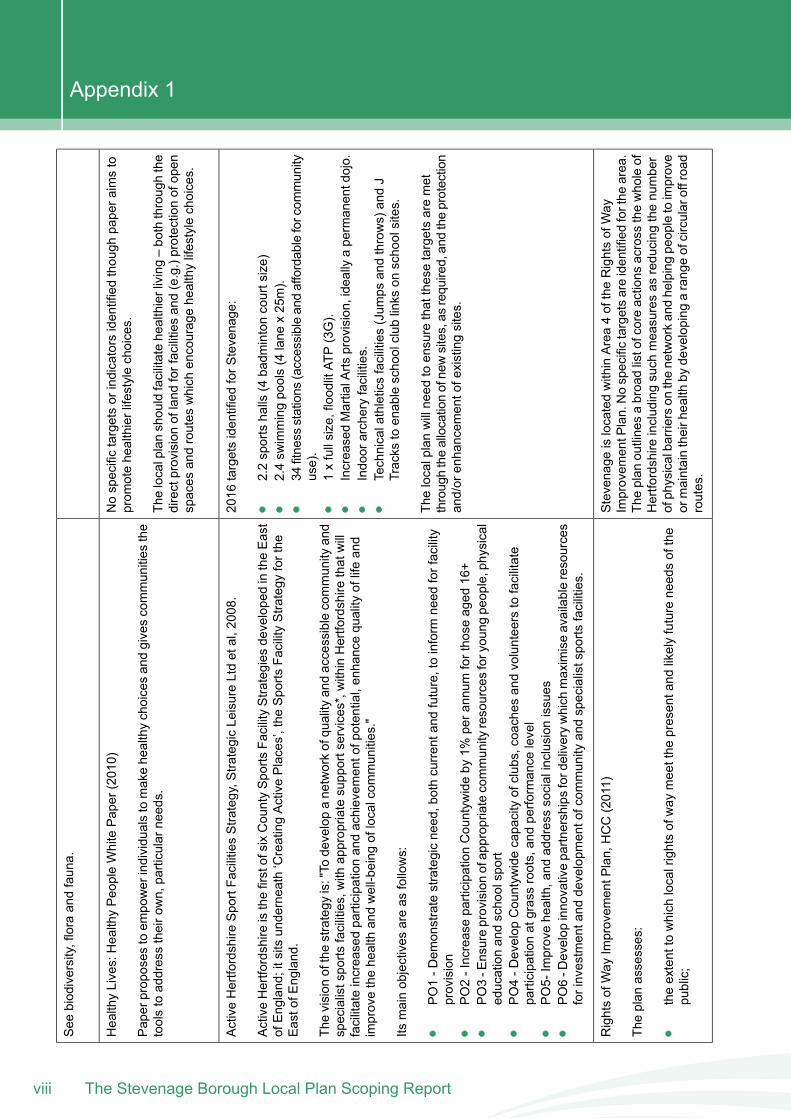
See
biodiversity,floraandfauna.
Nospecifictargetsorindicatorsidentifiedthough
paperaimsto
prom
otehealthierlifestylechoices.
HealthyLives:HealthyPeopleWhitePaper(2010)
Paperproposes
toem
powerindividualstomakehealthychoicesandgivescommunities
the
toolstoaddresstheirown,particularneeds.
Thelocalplanshouldfacilitatehealthierliving–boththroughthe
directprovisionofland
forfacilitiesand(e.g.)protectionofopen
spaces
androutes
which
encouragehealthylifestylechoices.
2016
targetsidentifiedforS
tevenage:
ActiveHertfordshire
SportFacilitiesStrategy,S
trategicLeisureLtdetal,2008.
ActiveHertfordshire
isthefirstofsixCountySports
FacilityStrategies
developedintheEast
ofEngland;itsits
underneath‘CreatingActivePlaces’,the
Sports
FacilityStrategy
forthe
EastofE
ngland.
2.2sportshalls
(4badm
intoncourtsize)
2.4sw
immingpools(4lane
x25m).
34fitness
stations
(accessibleandaffordableforcom
munity
use).
Thevision
ofthestrategy
is:"To
developanetworkofquality
andaccessiblecommunity
and
specialistsports
facilities,with
appropriatesupportservices*,w
ithinHertfordshire
thatwill
facilitateincreasedparticipationandachievem
entofpotential,enhancequality
oflifeand
improvethehealthandwell-being
oflocalcom
munities."
1xfullsize,floodlitAT
P(3G).
IncreasedMartialArts
provision,ideally
apermanentdojo.
Indoorarcheryfacilities.
Technicalathleticsfacilities(Jum
psandthrows)andJ
Tracks
toenableschoolclub
links
onschoolsites.
Itsmainobjectives
areas
follows:
Thelocalplanwillneed
toensurethatthesetargetsaremet
throughtheallocationofnewsites,as
required,andtheprotection
and/orenhancem
entofexistingsites.
PO1-D
emonstratestrategicneed,bothcurrentand
future,toinform
need
forfacility
provision
PO2-IncreaseparticipationCountyw
ideby
1%perannum
forthose
aged
16+
PO3-E
nsureprovisionofappropriatecommunity
resourcesforyoung
people,physical
educationandschoolsport
PO4-D
evelop
Countyw
idecapacityofclubs,coachesandvolunteerstofacilitate
participationatgrassroots,andperformance
level
PO5-Improvehealth,and
addresssocialinclusionissues
PO6-D
evelop
innovativepartnershipsfordeliverywhich
maximiseavailableresources
forinvestmentand
developm
entofcom
munity
andspecialistsports
facilities.
Stevenage
islocatedwithinArea4oftheRightsofWay
Improvem
entPlan.Nospecifictargetsareidentifiedforthe
area.
Theplan
outlinesabroadlistofcoreactions
across
thewholeof
RightsofWay
Improvem
entP
lan,HCC(2011)
Theplan
assesses:
Hertfordshire
includingsuch
measuresas
reducing
thenumber
ofphysicalbarrierson
thenetworkandhelpingpeopletoimprove
ormaintaintheirhealth
bydeveloping
arangeofcircularoffroad
routes.
theextenttowhich
localrightsofway
meetthe
presentand
likelyfutureneedsofthe
public;
The Stevenage Borough Local Plan Scoping Reportviii
Appendix 1
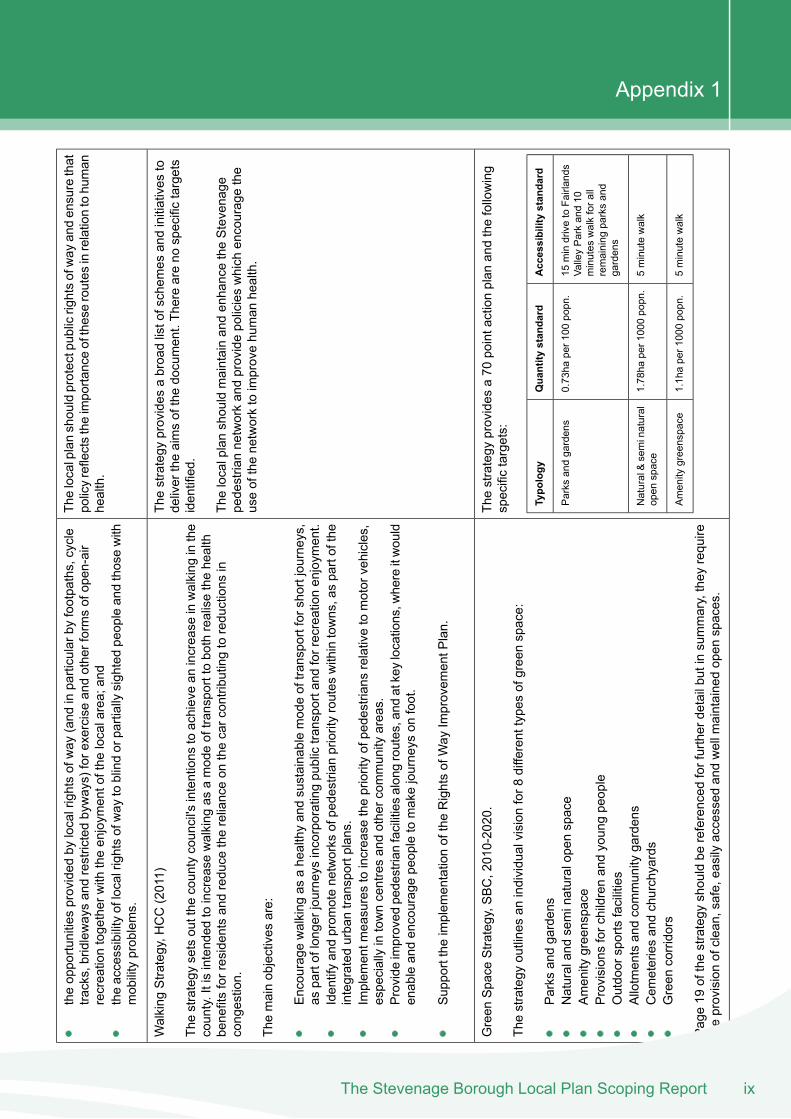
Thelocalplanshouldprotectpublicrightsofway
andensurethat
policyreflectstheimportanceoftheseroutes
inrelationtohuman
health.
theopportunitiesprovided
bylocalrightsofway
(and
inparticularbyfootpaths,cycle
tracks,bridlewaysandrestrictedbyways)forexerciseandotherformsofopen-air
recreationtogetherwith
theenjoym
entofthe
localarea;and
theaccessibilityoflocalrightsofway
toblindorpartiallysightedpeopleandthosewith
mobilityproblems.
Thestrategy
provides
abroadlistofschem
esandinitiatives
todelivertheaimsofthedocument.Thereareno
specifictargets
identified.
Walking
Strategy,H
CC(2011)
Thestrategy
setsoutthe
countycouncil'sintentions
toachievean
increase
inwalking
inthe
county.Itisintended
toincrease
walking
asamodeoftransporttobothrealisethehealth
benefitsforresidentsandreduce
therelianceon
thecarcontributingtoreductions
incongestion.
ThelocalplanshouldmaintainandenhancetheStevenage
pedestriannetworkandprovidepolicieswhich
encouragethe
useofthenetworktoimprovehuman
health.
Themainobjectives
are:
Encourage
walking
asahealthyandsustainablemodeoftransportforshortjourneys,
aspartoflongerjourneys
incorporatingpublictransportandforrecreationenjoym
ent.
Identifyandprom
otenetworks
ofpedestrianpriorityroutes
withintowns,aspartofthe
integrated
urbantransportplans.
Implem
entm
easurestoincrease
thepriorityofpedestrians
relativetomotorvehicles,
especiallyintowncentresandothercom
munity
areas.
Provideimproved
pedestrianfacilitiesalongroutes,and
atkeylocations,w
hereitwould
enableandencouragepeopletomakejourneys
onfoot.
Supporttheimplem
entationoftheRightsofWay
Improvem
entP
lan.
Thestrategy
provides
a70
pointactionplan
andthefollowing
specifictargets:
Green
Space
Strategy,S
BC,2010-2020.
Thestrategy
outlinesan
individualvision
for8
differenttypesofgreenspace:
Accessibilitystan
dard
Qua
ntity
stan
dard
Typo
logy
Parks
andgardens
15mindrivetoFairlands
ValleyParkand10
0.73ha
per100
popn.
Parks
andgardens
Naturalandseminaturalopen
space
Amenity
greenspace
minutes
walkforall
remaining
parksand
gardens
Provisionsforchildrenandyoungpeople
Outdoorsportsfacilities
Allotmentsandcommunity
gardens
5minutewalk
1.78ha
per1000popn.
Natural&seminatural
open
space
Cem
eteriesandchurchyards
Green
corridors
5minutewalk
1.1haper1000popn.
Amenity
greenspace
Page19
ofthestrategy
shouldbe
referenced
forfurtherdetailbutinsummary,they
require
theprovisionofclean,safe,easily
accessed
andwellm
aintainedopen
spaces.
ixThe Stevenage Borough Local Plan Scoping Report
Appendix 1
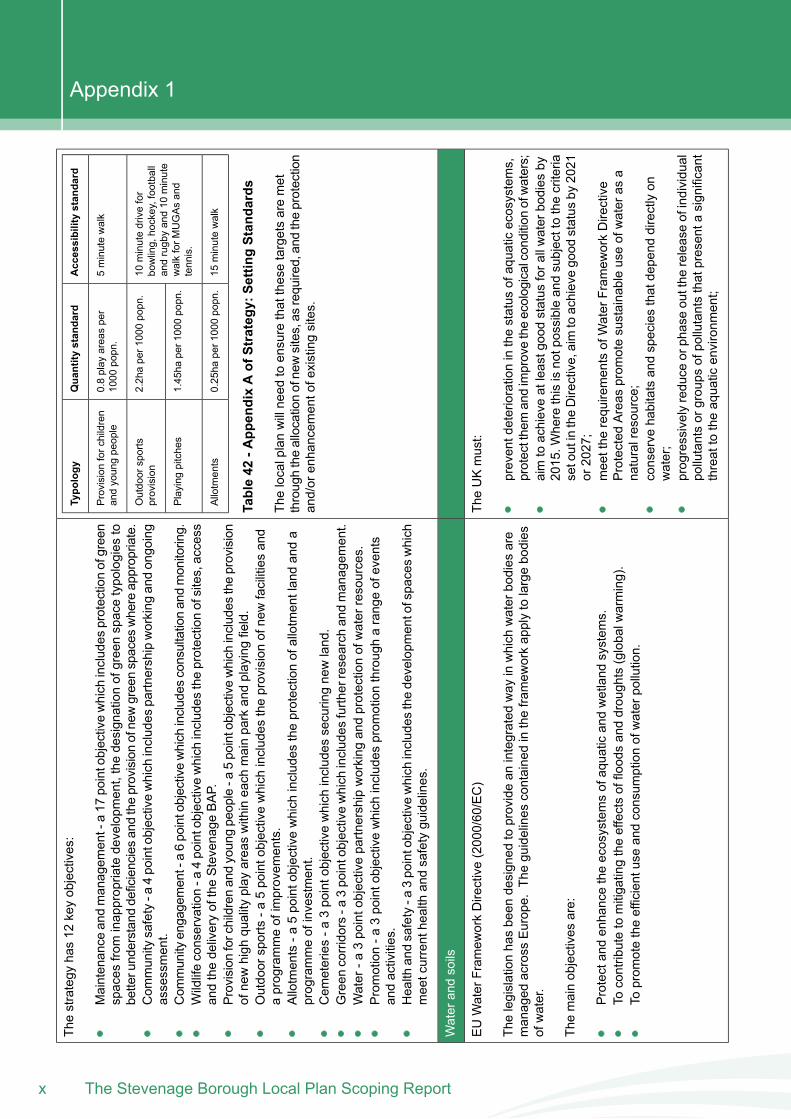
Accessibilitystan
dard
Qua
ntity
stan
dard
Typo
logy
Thestrategy
has12
keyobjectives:
5minutewalk
0.8play
areasper
1000
popn.
Provision
forchildren
andyoungpeople
Maintenance
andmanagem
ent-a17
pointobjectivewhich
includes
protectionofgreen
spaces
frominappropriatedevelopm
ent,thedesignationofgreenspacetypologies
tobetterunderstanddeficienciesandtheprovisionofnewgreenspaces
whereappropriate.
10minutedrivefor
bowling,hockey,football
2.2haper1000popn.
Outdoorsports
provision
Com
munity
safety-a
4pointobjectivewhich
includes
partnershipworking
andongoing
assessment.
andrugbyand10
minute
walkforM
UGAsand
tennis.
1.45ha
per1000popn.
Playing
pitches
Com
munity
engagement-a6pointobjectivewhich
includes
consultationandmonitoring.
Wildlifeconservation-a
4pointobjectivewhich
includes
theprotectionofsites,access
andthedeliveryoftheStevenage
BAP.
15minutewalk
0.25ha
per1000popn.
Allotments
Provisionforchildrenandyoungpeople-a
5pointobjectivewhich
includes
theprovision
ofnewhigh
quality
play
areaswithineach
mainparkandplayingfield.
Table42
-App
endixAof
Strategy
:Settin
gStan
dards
Outdoorsports-a
5pointobjectivewhich
includes
theprovisionofnewfacilitiesand
aprogrammeofimprovem
ents.
Thelocalplanwillneed
toensurethatthesetargetsaremet
throughtheallocationofnewsites,as
required,andtheprotection
and/orenhancem
entofexistingsites.
Allotments-a
5pointobjectivewhich
includes
theprotectionofallotmentlandanda
programmeofinvestment.
Cem
eteries-a
3pointobjectivewhich
includes
securingnewland.
Green
corridors-a
3pointobjectivewhich
includes
furtherresearch
andmanagem
ent.
Water-a
3pointobjectivepartnershipworking
andprotectionofwaterresources.
Promotion-a
3pointobjectivewhich
includes
prom
otionthrougharangeofevents
andactivities.
Health
andsafety-a
3pointobjectivewhich
includes
thedevelopm
entofspaceswhich
meetcurrenthealthandsafetyguidelines.
Waterandsoils
TheUKmust:
EUWaterFram
eworkDirective(2000/60/EC)
Thelegislationhasbeen
designed
toprovidean
integrated
way
inwhich
waterbodies
are
managed
across
Europe.
Theguidelines
containedintheframew
orkapplytolargebodies
ofwater.
preventdeteriorationinthestatus
ofaquatic
ecosystems,
protectthemandimprovetheecologicalcondition
ofwaters;
aimtoachieveatleastgoodstatus
forallwaterbodies
by2015.W
herethisisnotpossibleandsubjecttothecriteria
Themainobjectives
are:
setoutintheDirective,aimtoachievegood
status
by2021
or2027;
Protectandenhancetheecosystemsofaquatic
andwetland
system
s.meetthe
requirementsofWaterFram
eworkDirective
Protected
Areas
prom
otesustainableuseofwateras
anaturalresource;
Tocontributetomitigatingtheeffectsoffloodsanddroughts(globalw
arming).
Toprom
otetheefficientuseandconsum
ptionofwaterpollution.
conserve
habitatsandspeciesthatdepend
directlyon
water;
progressivelyreduce
orphaseoutthe
releaseofindividual
pollutantsorgroups
ofpollutantsthatpresenta
significant
threattotheaquatic
environm
ent;
The Stevenage Borough Local Plan Scoping Reportx
Appendix 1
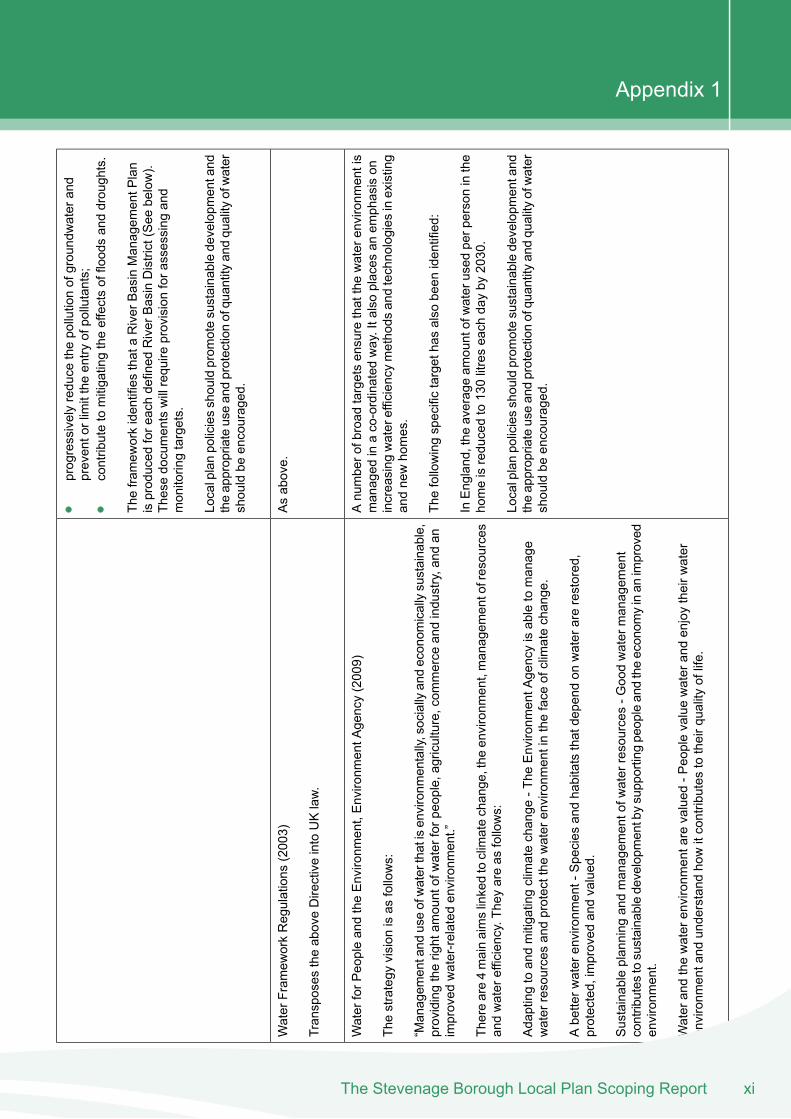
progressivelyreduce
thepollutionofgroundwaterand
preventorlimittheentry
ofpollutants;
contributetomitigatingtheeffectsoffloodsanddroughts.
Theframew
orkidentifiesthataRiverBasinManagem
entP
lan
isproduced
foreachdefined
RiverBasinDistrict(See
below).
Thesedocumentswillrequire
provisionforassessing
and
monitoringtargets.
Localplanpoliciesshouldprom
otesustainabledevelopm
entand
theappropriateuseandprotectionofquantityandquality
ofwater
shouldbe
encouraged.
Asabove.
WaterFram
eworkRegulations
(2003)
Transposes
theaboveDirectiveintoUKlaw.
Anumberofbroad
targetsensurethatthewaterenvironm
entis
managed
inaco-ordinated
way.Italsoplaces
anem
phasison
increasing
waterefficiencymethods
andtechnologies
inexisting
andnewhomes.
WaterforP
eopleandtheEnvironm
ent,Environm
entA
gency(2009)
Thestrategy
vision
isas
follows:
“Managem
entand
useofwaterthatisenvironm
entally,sociallyandeconom
icallysustainable,
providingtherightam
ountofwaterforpeople,agriculture,com
merce
andindustry,and
animproved
water-related
environm
ent.”
Thefollowingspecifictargethasalso
been
identified:
InEngland,the
averageam
ountofwaterused
perpersoninthe
homeisreducedto130litreseach
dayby
2030.
Thereare4mainaimslinkedtoclimatechange,the
environm
ent,managem
entofresources
andwaterefficiency.They
areas
follows:
Localplanpoliciesshouldprom
otesustainabledevelopm
entand
theappropriateuseandprotectionofquantityandquality
ofwater
shouldbe
encouraged.
Adaptingtoandmitigatingclimatechange
-The
Environm
entA
gencyisabletomanage
waterresourcesandprotectthe
waterenvironm
entintheface
ofclimatechange.
Abetterw
aterenvironm
ent-Species
andhabitatsthatdepend
onwaterarerestored,
protected,improved
andvalued.
Sustainableplanning
andmanagem
entofw
aterresources-G
oodwatermanagem
ent
contributes
tosustainabledevelopm
entbysupportingpeopleandtheeconom
yinan
improved
environm
ent.
Waterandthewaterenvironm
entarevalued
-Peoplevaluewaterandenjoytheirw
ater
environm
entand
understand
howitcontributes
totheirqualityoflife.
xiThe Stevenage Borough Local Plan Scoping Report
Appendix 1
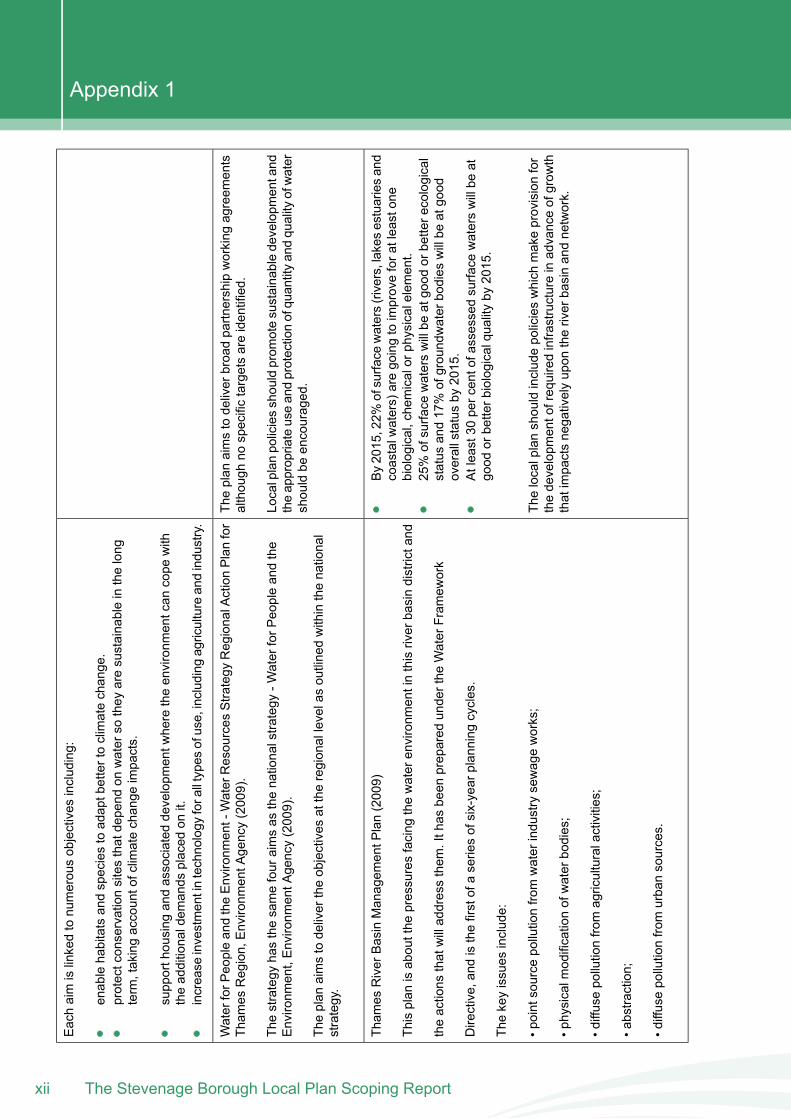
Eachaimislinkedtonumerousobjectives
including:
enablehabitatsandspeciestoadaptbettertoclimatechange.
protectconservationsitesthatdepend
onwaterso
they
aresustainableinthelong
term,takingaccountofclim
atechange
impacts.
supporthousing
andassociated
developm
entw
heretheenvironm
entcan
cope
with
theadditionaldem
ands
placed
onit.
increase
investmentintechnology
foralltypes
ofuse,includingagricultureandindustry.
Theplan
aimstodeliverbroadpartnershipworking
agreem
ents
although
nospecifictargetsareidentified.
WaterforP
eopleandtheEnvironm
ent-WaterResources
Strategy
RegionalActionPlanfor
Tham
esRegion,Environm
entA
gency(2009).
Localplanpoliciesshouldprom
otesustainabledevelopm
entand
theappropriateuseandprotectionofquantityandquality
ofwater
shouldbe
encouraged.
Thestrategy
hasthesamefouraimsas
thenationalstrategy
-WaterforP
eopleandthe
Environm
ent,Environm
entA
gency(2009).
Theplan
aimstodelivertheobjectives
attheregionallevelasoutlinedwithinthenational
strategy.
Tham
esRiverBasinManagem
entP
lan(2009)
By2015,22%
ofsurface
waters(rivers,lakes
estuariesand
coastalw
aters)aregoingtoimproveforatleastone
biological,chemicalorphysicalelem
ent.
Thisplan
isaboutthe
pressuresfacing
thewaterenvironm
entinthisriverbasindistrictand
25%ofsurface
waterswillbe
atgood
orbetterecological
status
and17%ofgroundwaterbodies
willbe
atgood
overallstatusby
2015.
theactions
thatwilladdressthem
.Ithas
been
prepared
underthe
WaterFram
ework
Directive,andisthefirstofaseriesofsix-yearplanning
cycles.
Atleast30
percentofassessedsurface
waterswillbe
atgood
orbetterbiologicalqualityby
2015.
Thekeyissues
include:
Thelocalplanshouldincludepolicieswhich
makeprovisionfor
thedevelopm
entofrequiredinfrastructureinadvanceofgrow
ththatimpactsnegativelyupon
theriverbasinandnetwork.
•pointsource
pollutionfromwaterindustrysewageworks;
•physicalm
odificationofwaterbodies;
•diffusepollutionfromagriculturalactivities;
•abstraction;
•diffusepollutionfromurbansources.
The Stevenage Borough Local Plan Scoping Reportxii
Appendix 1
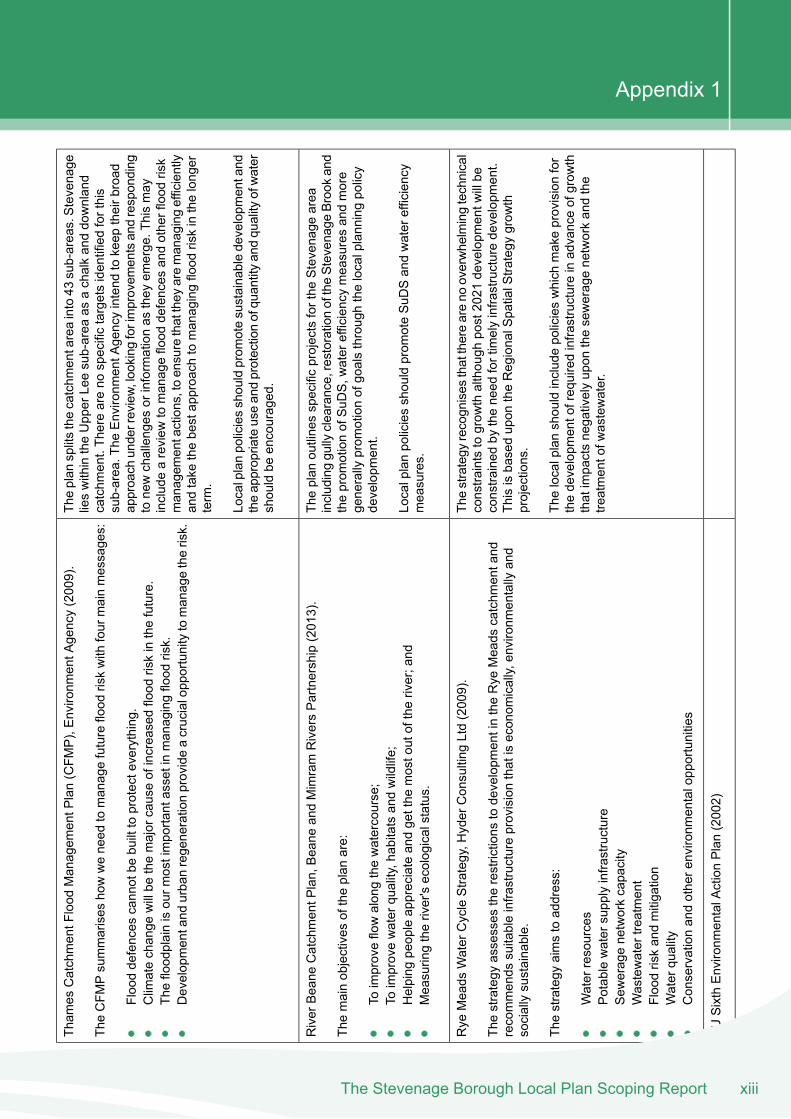
Theplan
splitsthecatchm
entareainto43
sub-areas.Stevenage
lieswithintheUpperLeesub-area
asachalkanddownland
catchm
ent.Thereareno
specifictargetsidentifiedforthis
Tham
esCatchmentFlood
Managem
entP
lan(CFM
P),Environm
entA
gency(2009).
TheCFM
Psummarises
howweneed
tomanagefutureflood
riskwith
fourmainmessages:
sub-area.The
Environm
entA
gencyintend
tokeep
theirbroad
approach
underreview,lookingforimprovem
entsandresponding
Flooddefences
cannotbe
builttoprotecteverything.
tonewchallenges
orinformationas
they
emerge.Thismay
Clim
atechange
willbe
themajorcauseofincreasedflood
riskinthefuture.
includeareview
tomanageflood
defences
andotherflood
risk
Thefloodplainisourm
ostimportantassetinmanagingflood
risk.
managem
entactions,toensurethatthey
aremanagingefficiently
andtake
thebestapproach
tomanagingflood
riskinthelonger
term.
Developmentand
urbanregenerationprovideacrucialopportunitytomanagetherisk.
Localplanpoliciesshouldprom
otesustainabledevelopm
entand
theappropriateuseandprotectionofquantityandquality
ofwater
shouldbe
encouraged.
Theplan
outlinesspecificprojectsforthe
Stevenage
area
includinggullyclearance,restorationoftheStevenageBrookand
theprom
otionofSuD
S,w
aterefficiencymeasuresandmore
generally
prom
otionofgoalsthroughthelocalplanningpolicy
developm
ent.
RiverBeane
CatchmentP
lan,Beane
andMimramRiversPartnership(2013).
Themainobjectives
oftheplan
are:
Toimproveflowalongthewatercourse;
Toimprovewaterquality,habitatsandwildlife;
Localplanpoliciesshouldprom
oteSuD
Sandwaterefficiency
measures.
Helping
peopleappreciateandgetthe
mostoutoftheriver;and
Measuringtheriver'secologicalstatus.
Thestrategy
recognises
thatthereareno
overwhelmingtechnical
constraintstogrow
thalthough
post2021
developm
entw
illbe
constrained
bytheneed
fortimelyinfrastructuredevelopm
ent.
Thisisbasedupon
theRegionalSpatialStrategy
grow
thprojections.
Rye
Meads
WaterCycleStrategy,H
yderConsulting
Ltd(2009).
Thestrategy
assesses
therestrictions
todevelopm
entintheRye
Meads
catchm
entand
recommends
suitableinfrastructureprovisionthatiseconom
ically,
environm
entally
and
sociallysustainable.
Thelocalplanshouldincludepolicieswhich
makeprovisionfor
thedevelopm
entofrequiredinfrastructureinadvanceofgrow
ththatimpactsnegativelyupon
theseweragenetworkandthe
treatmentofw
astewater.
Thestrategy
aimstoaddress:
Waterresources
Potablewatersupplyinfrastructure
Sew
eragenetworkcapacity
Wastewatertreatment
Floodriskandmitigation
Waterquality
Conservationandotherenvironm
entalopportunities
EUSixthEnvironm
entalActionPlan(2002)
xiiiThe Stevenage Borough Local Plan Scoping Report
Appendix 1
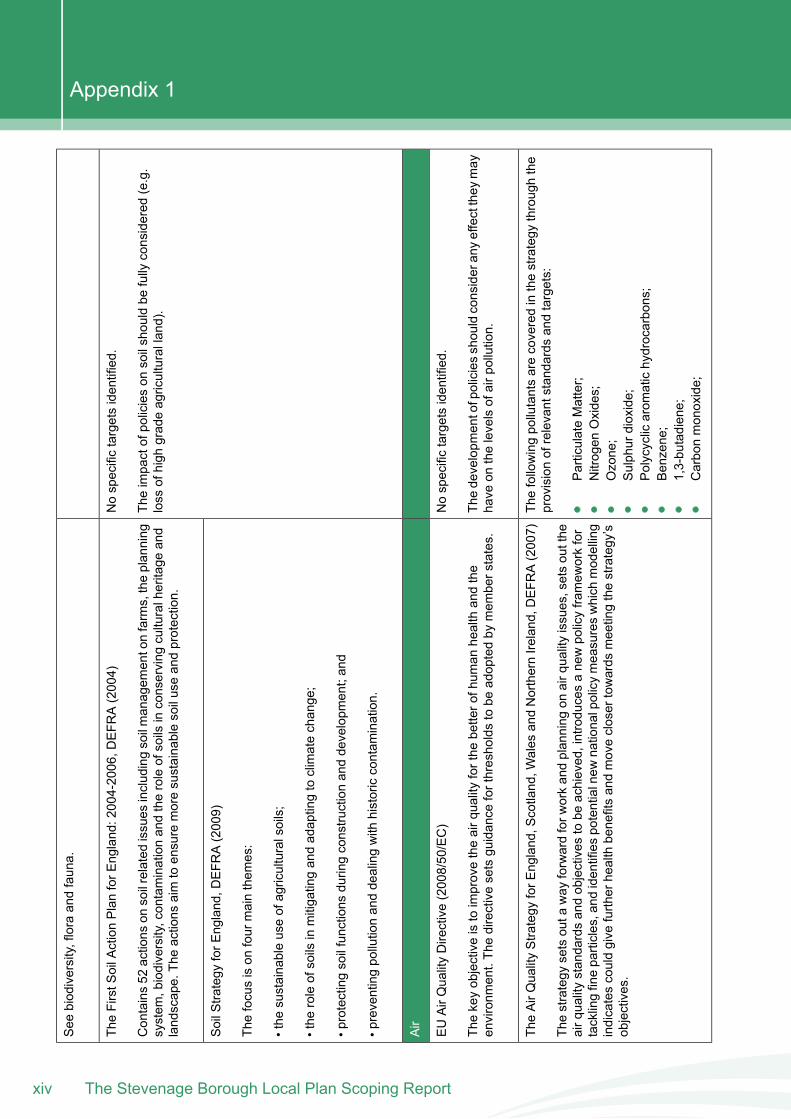
See
biodiversity,floraandfauna.
Nospecifictargetsidentified.
TheFirstS
oilActionPlanforE
ngland:2004-2006,D
EFR
A(2004)
Theimpactofpolicieson
soilshouldbe
fully
considered
(e.g.
loss
ofhigh
gradeagriculturalland).
Contains52
actions
onsoilrelatedissues
includingsoilmanagem
entonfarms,theplanning
system
,biodiversity,contaminationandtheroleofsoils
inconserving
culturalheritage
and
landscape.Theactions
aimtoensuremoresustainablesoiluseandprotection.
SoilStrategy
forE
ngland,D
EFR
A(2009)
Thefocusison
fourmainthem
es:
•the
sustainableuseofagriculturalsoils;
•the
roleofsoils
inmitigatingandadaptingtoclimatechange;
•protectingsoilfunctions
duringconstructionanddevelopm
ent;and
•preventingpollutionanddealingwith
historiccontam
ination.
Air
Nospecifictargetsidentified.
EUAirQualityDirective(2008/50/EC)
Thedevelopm
entofpoliciesshouldconsideranyeffectthey
may
have
onthelevelsofairpollution.
Thekeyobjectiveistoimprovetheairqualityforthe
betterofhum
anhealthandthe
environm
ent.Thedirectivesetsguidance
forthresholdstobe
adoptedby
mem
berstates.
Thefollowingpollutantsarecoveredinthestrategy
throughthe
provisionofrelevantstandardsandtargets:
TheAirQualityStrategy
forE
ngland,S
cotland,W
ales
andNorthernIreland,D
EFR
A(2007)
Thestrategy
setsouta
way
forwardforw
orkandplanning
onairqualityissues,setsoutthe
airqualitystandardsandobjectives
tobe
achieved,introducesanewpolicyframew
orkfor
tacklingfineparticles,and
identifiespotentialnew
nationalpolicymeasureswhich
modelling
indicatescouldgive
furtherhealthbenefitsandmoveclosertowards
meetingthestrategy’s
objectives.
ParticulateMatter;
Nitrogen
Oxides;
Ozone;
Sulphurdioxide;
Polycyclic
arom
atichydrocarbons;
Benzene;
1,3-butadiene;
Carbonmonoxide;
The Stevenage Borough Local Plan Scoping Reportxiv
Appendix 1
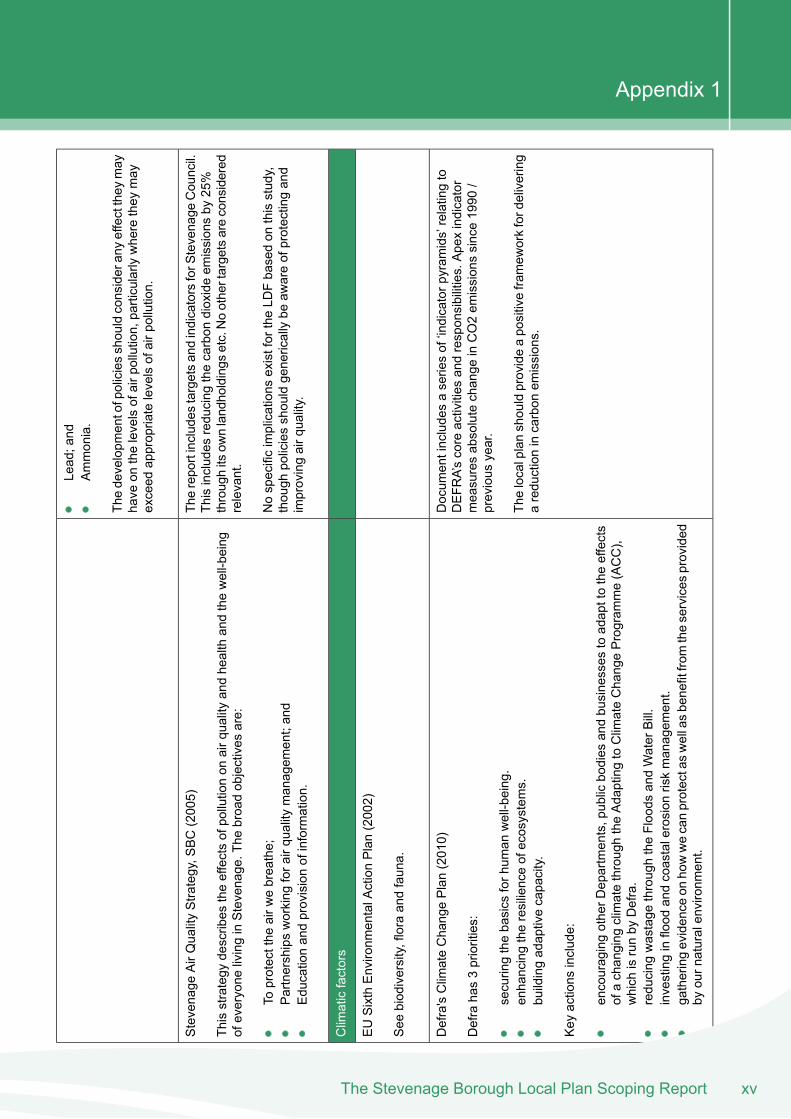
Lead;and
Ammonia.
Thedevelopm
entofpoliciesshouldconsideranyeffectthey
may
have
onthelevelsofairpollution,particularly
wherethey
may
exceed
appropriatelevelsofairpollution.
Thereportincludes
targetsandindicatorsforS
tevenage
Council.
Thisincludes
reducing
thecarbon
dioxideem
issionsby
25%
throughits
ownlandholdings
etc.Noothertargetsareconsidered
relevant.
Stevenage
AirQualityStrategy,S
BC(2005)
Thisstrategy
describes
theeffectsofpollutionon
airqualityandhealthandthewell-being
ofeveryone
livinginStevenage.The
broadobjectives
are:
Nospecificimplications
existfortheLD
Fbasedon
thisstudy,
though
policiesshouldgenericallybe
awareofprotectingand
improvingairquality.
Toprotectthe
airw
ebreathe;
Partnershipsworking
forairquality
managem
ent;and
Educationandprovisionofinformation.
Clim
aticfactors
EUSixthEnvironm
entalActionPlan(2002)
See
biodiversity,floraandfauna.
Docum
entincludesaseriesof‘indicatorpyram
ids’relatingto
DEFR
A’scoreactivities
andresponsibilities.Apexindicator
measuresabsolutechange
inCO2em
issionssince1990
/previous
year.
Defra'sClim
ateChangePlan(2010)
Defrahas3priorities:
securingthebasics
forhum
anwell-being.
Thelocalplanshouldprovideapositiveframew
orkfordelivering
areductionincarbon
emissions.
enhancingtheresilienceofecosystems.
buildingadaptivecapacity.
Key
actions
include:
encouragingotherD
epartments,public
bodies
andbusinesses
toadapttotheeffects
ofachanging
climatethroughtheAdaptingtoClim
ateChangeProgram
me(ACC),
which
isrunby
Defra.
reducing
wastage
throughtheFloods
andWaterBill.
investinginflood
andcoastalerosion
riskmanagem
ent.
gatheringevidence
onhowwecanprotectaswellasbenefitfromtheservices
provided
byournaturalenvironm
ent.
xvThe Stevenage Borough Local Plan Scoping Report
Appendix 1
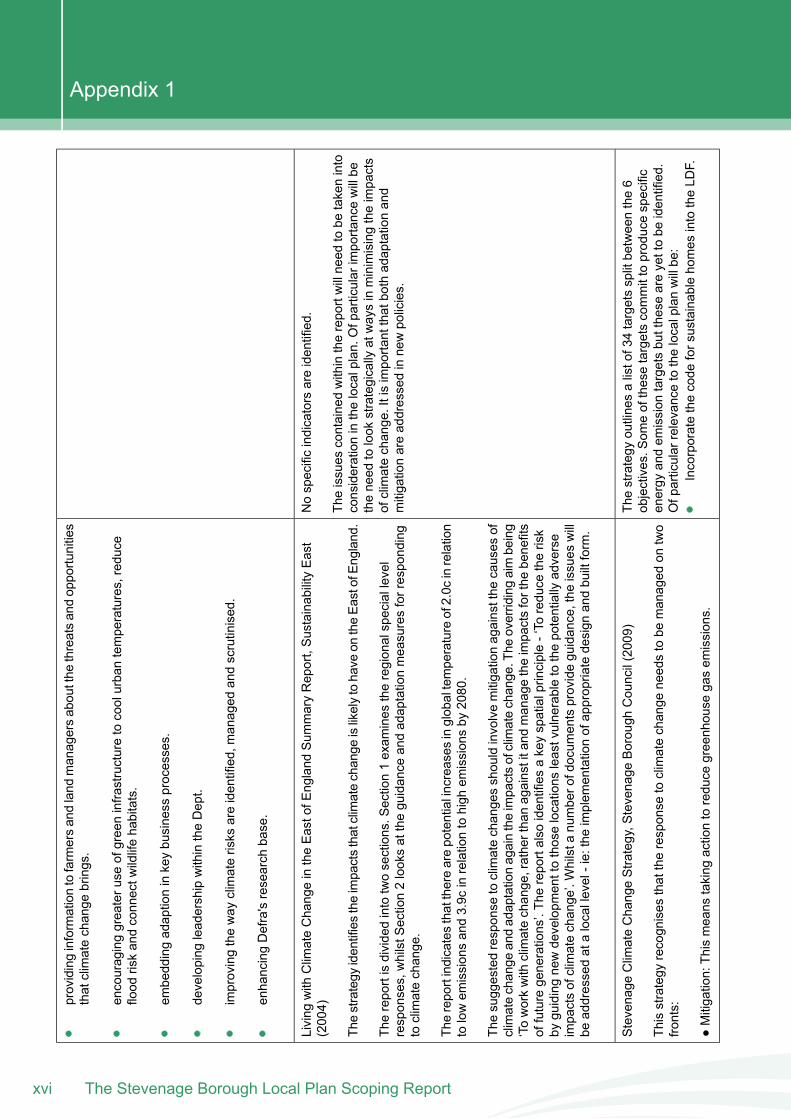
providinginformationtofarmersandland
managersaboutthe
threatsandopportunities
thatclimatechange
brings.
encouraginggreateruse
ofgreeninfrastructuretocoolurbantemperatures,reduce
flood
riskandconnectw
ildlifehabitats.
embeddingadaptioninkeybusiness
processes.
developing
leadershipwithintheDept.
improvingtheway
climaterisks
areidentified,managed
andscrutinised.
enhancingDefra'sresearch
base.
Nospecificindicatorsareidentified.
Living
with
Clim
ateChangeintheEastofE
ngland
Sum
maryReport,SustainabilityEast
(2004)
Theissues
containedwithinthereportwillneed
tobe
takeninto
considerationinthelocalplan.Ofparticularimportancewillbe
theneed
tolook
strategically
atwaysinminimisingtheimpacts
ofclimatechange.Itisimportantthatbothadaptationand
mitigationareaddressedinnewpolicies.
Thestrategy
identifiestheimpactsthatclimatechange
islikelytohave
ontheEa
stofEn
gland.
Thereportisdividedintotwosections.S
ection1exam
ines
theregionalspeciallevel
responses,whilstS
ection2looksattheguidance
andadaptationmeasuresforresponding
toclimatechange.
Thereportindicatesthattherearepotentialin
creasesinglobaltemperatureof2.0c
inrelation
tolowem
issionsand3.9c
inrelationtohigh
emissionsby
2080.
Thesuggestedresponse
toclimatechangesshouldinvolvemitigationagainstthe
causes
ofclimatechange
andadaptationagaintheimpactsofclimatechange.The
overridingaimbeing
‘Toworkwith
climatechange,ratherthanagainstitand
managetheimpactsforthe
benefits
offuturegenerations’.Thereportalso
identifiesakeyspatialprinciple-‘To
reduce
therisk
byguidingnewdevelopm
enttothoselocations
leastvulnerabletothepotentially
adverse
impactsofclimatechange’.Whilsta
numberofdocum
entsprovideguidance,the
issues
will
beaddressedatalocallevel-ie:theimplem
entationofappropriatedesign
andbuiltform.
Thestrategy
outlinesalistof34targetssplitbetweenthe6
objectives.S
omeofthesetargetscommittoproducespecific
energy
andem
ission
targetsbutthese
areyettobe
identified.
Ofparticularrelevancetothelocalplanwillbe:
Stevenage
Clim
ateChangeStrategy,S
tevenage
Borough
Council(2009)
Thisstrategy
recognises
thattheresponse
toclimatechange
needstobe
managed
ontwo
fronts:
Incorporatethecode
forsustainablehomes
intotheLD
F.●Mitigation:Thismeans
taking
actiontoreduce
greenhouse
gasem
issions.
The Stevenage Borough Local Plan Scoping Reportxvi
Appendix 1
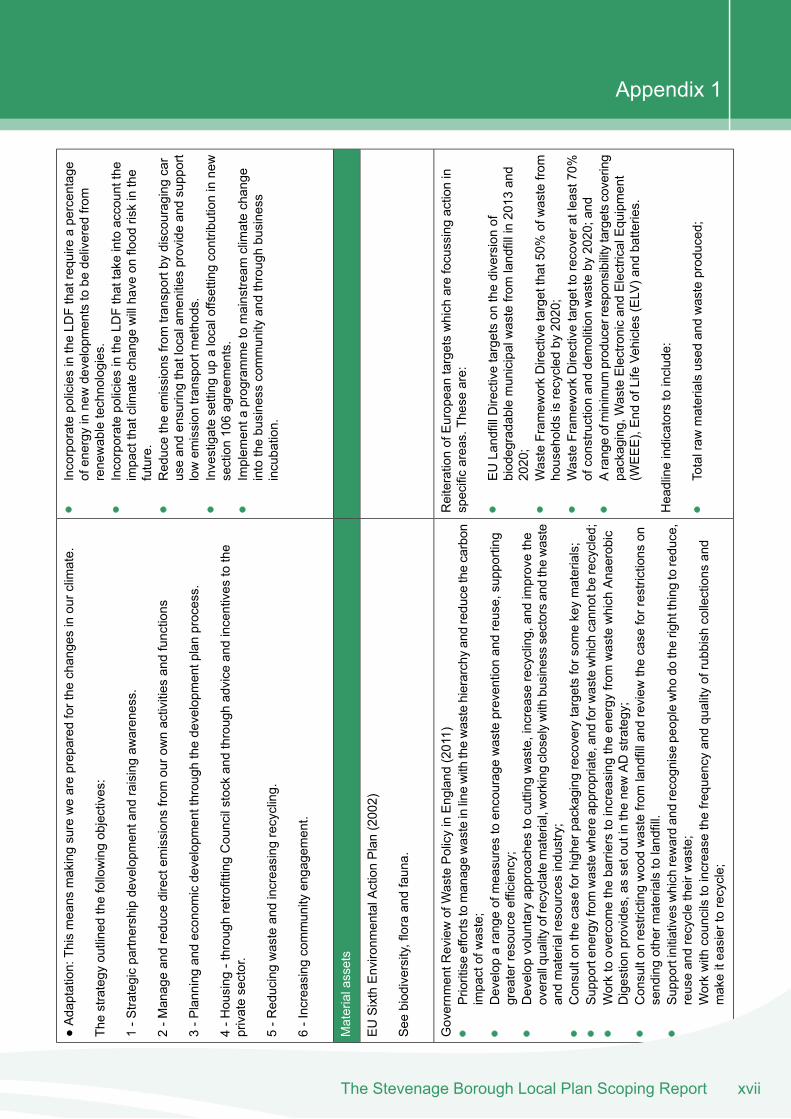
●Adaptation:Thismeans
makingsureweareprepared
forthe
changesinourclim
ate.
IncorporatepoliciesintheLD
Fthatrequire
apercentage
ofenergy
innewdevelopm
entstobe
delivered
from
renewabletechnologies.
Thestrategy
outlinedthefollowingobjectives:
IncorporatepoliciesintheLD
Fthattake
intoaccountthe
impactthatclimatechange
willhave
onflood
riskinthe
future.
1-S
trategicpartnershipdevelopm
entand
raisingaw
areness.
2-M
anageandreduce
directem
issionsfromourownactivities
andfunctions
Reducetheem
issionsfromtransportby
discouraging
car
useandensuringthatlocalamenities
provideandsupport
lowem
ission
transportmethods.
3-P
lanningandeconom
icdevelopm
entthrough
thedevelopm
entplanprocess.
Investigatesetting
upalocaloffsettingcontributioninnew
section106agreem
ents.
4-H
ousing
-through
retrofittingCouncilstockandthroughadvice
andincentives
tothe
privatesector.
Implem
enta
programmetomainstream
climatechange
intothebusiness
community
andthroughbusiness
incubation.
5-R
educingwasteandincreasing
recycling.
6-Increasingcommunity
engagement.
Materialassets
EUSixthEnvironm
entalActionPlan(2002)
See
biodiversity,floraandfauna.
ReiterationofEuropeantargetswhich
arefocussingactionin
specificareas.Theseare:
Governm
entR
eviewofWastePolicyinEngland
(2011)
Prioritiseefforts
tomanagewasteinlinewith
thewastehierarchyandreduce
thecarbon
impactofwaste;
EULandfillD
irectivetargetson
thediversionof
biodegradablemunicipalwastefromlandfillin2013
and
2020;
Develop
arangeofmeasurestoencouragewastepreventionandreuse,supporting
greaterresourceefficiency;
Develop
voluntaryapproaches
tocutting
waste,increaserecycling,andimprovethe
overallqualityofrecyclatematerial,working
closelywith
business
sectorsandthewaste
andmaterialresources
industry;
WasteFram
eworkDirectivetargetthat50%ofwastefrom
households
isrecycled
by2020;
WasteFram
eworkDirectivetargettorecoveratleast70%
ofconstructionanddemolition
wasteby
2020;and
Consulton
thecase
forhigherpackaging
recoverytargetsforsom
ekeymaterials;
Supportenergyfromwastewhereappropriate,and
forw
astewhich
cannotbe
recycled;
Arangeofminimum
producerresponsibilitytargetscovering
packaging,WasteElectronicandElectricalEquipment
(WEEE),End
ofLifeVehicles
(ELV)and
batteries.
Worktoovercomethebarrierstoincreasing
theenergy
fromwastewhich
Anaerobic
Digestionprovides,assetoutinthenewADstrategy;
Consulton
restrictingwoodwastefromlandfilland
review
thecase
forrestrictions
onsendingotherm
aterialstolandfill.
Headlineindicatorstoinclude:
Supportinitiatives
which
rewardandrecognisepeoplewho
dotherightthingtoreduce,
reuseandrecycletheirw
aste;
Totalraw
materialsused
andwasteproduced;
Workwith
councilstoincrease
thefrequency
andquality
ofrubbishcollections
and
makeiteasiertorecycle;
xviiThe Stevenage Borough Local Plan Scoping Report
Appendix 1
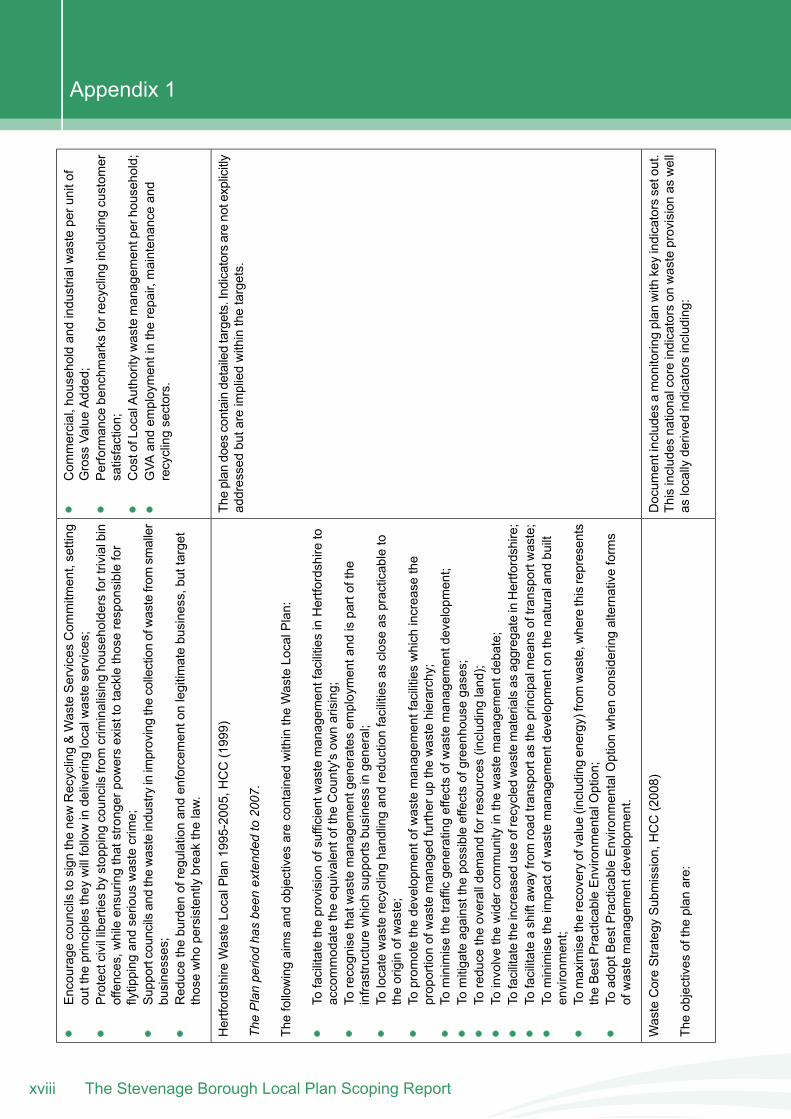
Com
mercial,householdandindustrialw
asteperunitof
Gross
ValueAdded;
Encourage
councilstosign
thenewRecycling&WasteServicesCom
mitm
ent,setting
outthe
principles
they
willfollowindeliveringlocalw
asteservices;
Protectcivillibertiesby
stopping
councilsfromcriminalisinghouseholdersfortrivialbin
offences,w
hileensuringthatstrongerpowersexisttotacklethoseresponsiblefor
flytipping
andserious
wastecrime;
Performance
benchm
arks
forrecyclingincludingcustom
ersatisfaction;
CostofLocalAuthoritywastemanagem
entperhousehold;
Supportcouncilsandthewasteindustryinimprovingthecollectionofwastefromsm
aller
businesses;
GVA
andem
ploymentintherepair,maintenance
and
recyclingsectors.
Reducetheburden
ofregulationandenforcem
entonlegitim
atebusiness,buttarget
thosewho
persistentlybreakthelaw.
Theplan
does
containdetailedtargets.Indicatorsarenotexplicitly
addressedbutareimpliedwithinthetargets.
Hertfordshire
WasteLocalPlan1995-2005,HCC(1999)
ThePlanpe
riodha
sbe
enextend
edto
2007
.
Thefollowingaimsandobjectives
arecontainedwithintheWasteLocalPlan:
Tofacilitatetheprovisionofsufficientw
astemanagem
entfacilitiesinHertfordshire
toaccommodatetheequivalentoftheCounty'sow
narising;
Torecognisethatwastemanagem
entgenerates
employmentand
ispartofthe
infrastructurewhich
supportsbusiness
ingeneral;
Tolocatewasterecyclinghandlingandreductionfacilitiesas
closeas
practicableto
theoriginofwaste;
Toprom
otethedevelopm
entofw
astemanagem
entfacilitieswhich
increase
the
proportionofwastemanaged
furtherup
thewastehierarchy;
Tominimisethetrafficgeneratingeffectsofwastemanagem
entdevelopment;
Tomitigateagainstthe
possibleeffectsofgreenhouse
gases;
Toreduce
theoveralldem
andforresources
(includingland);
Toinvolvethewidercommunity
inthewastemanagem
entdebate;
Tofacilitatetheincreaseduseofrecycled
wastematerialsas
aggregateinHertfordshire;
Tofacilitateashiftaw
ayfromroad
transportas
theprincipalm
eans
oftransportwaste;
Tominimisetheimpactofwastemanagem
entdevelopmentonthenaturaland
built
environm
ent;
Tomaximisetherecoveryofvalue(includingenergy)fromwaste,w
herethisrepresents
theBestP
racticableEnvironm
entalO
ption;
ToadoptB
estP
racticableEnvironm
entalO
ptionwhenconsideringalternativeforms
ofwastemanagem
entdevelopment.
Docum
entincludesamonitoringplan
with
keyindicatorssetout.
Thisincludes
nationalcoreindicatorson
wasteprovisionas
well
aslocally
derived
indicatorsincluding:
WasteCoreStrategy
Submission,H
CC(2008)
Theobjectives
oftheplan
are:
The Stevenage Borough Local Plan Scoping Reportxviii
Appendix 1
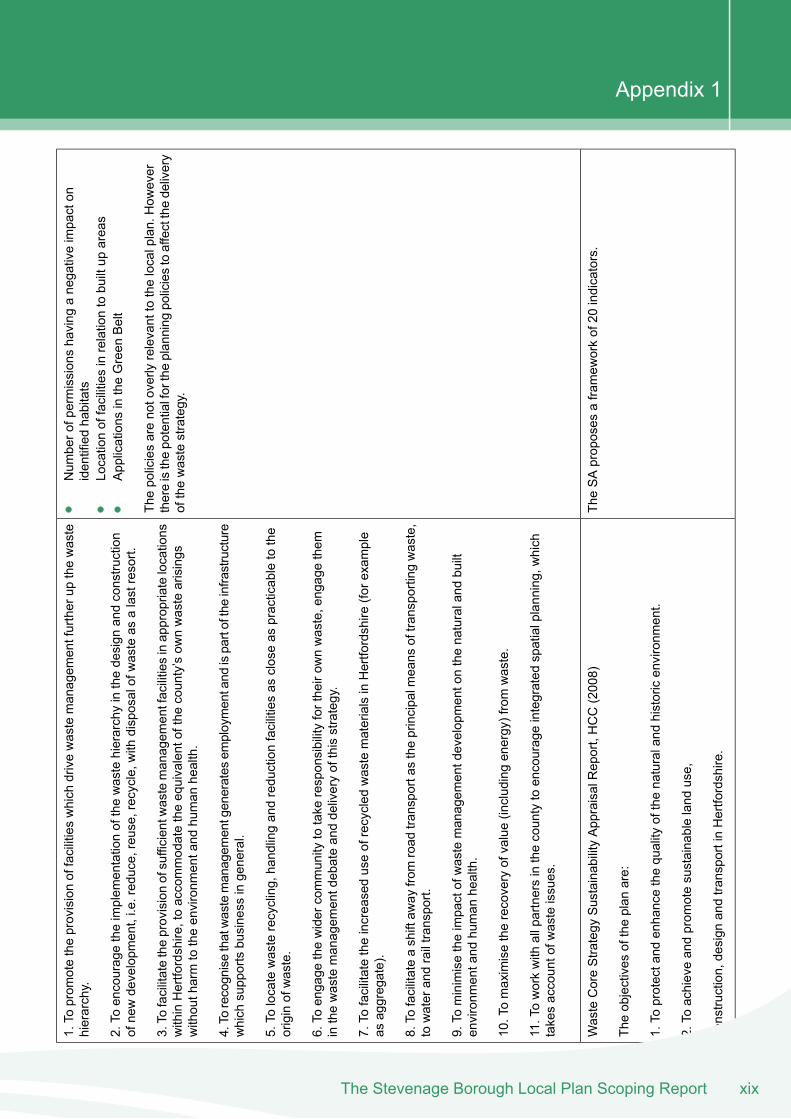
1.To
prom
otetheprovisionoffacilitieswhich
drivewastemanagem
entfurtherup
thewaste
hierarchy.
Num
berofpermissionshaving
anegativeimpacton
identifiedhabitats
Locationoffacilitiesinrelationtobuiltup
areas
2.To
encouragetheimplem
entationofthewastehierarchyinthedesign
andconstruction
ofnewdevelopm
ent,i.e.reduce,reuse,recycle,with
disposalofwasteas
alastresort.
Applications
intheGreen
Belt
Thepoliciesarenotoverly
relevanttothelocalplan.How
ever
thereisthepotentialfortheplanning
policiestoaffectthedelivery
ofthewastestrategy.
3.To
facilitatetheprovisionofsufficientw
astemanagem
entfacilitiesinappropriatelocations
withinHertfordshire,toaccommodatetheequivalentofthecounty’sow
nwastearisings
withoutharmtotheenvironm
entand
human
health.
4.To
recognisethatwastemanagem
entgenerates
employmentand
ispartoftheinfrastructure
which
supportsbusiness
ingeneral.
5.To
locatewasterecycling,handlingandreductionfacilitiesas
closeas
practicabletothe
originofwaste.
6.To
engage
thewidercommunity
totake
responsibilityfortheirow
nwaste,engagethem
inthewastemanagem
entdebateanddeliveryofthisstrategy.
7.To
facilitatetheincreaseduseofrecycled
wastematerialsinHertfordshire
(forexample
asaggregate).
8.To
facilitateashiftaw
ayfromroad
transportas
theprincipalm
eans
oftransporting
waste,
towaterandrailtransport.
9.To
minimisetheimpactofwastemanagem
entdevelopmentonthenaturaland
built
environm
entand
human
health.
10.Tomaximisetherecoveryofvalue(includingenergy)fromwaste.
11.Toworkwith
allpartnersinthecountytoencourageintegrated
spatialplanning,which
takesaccountofw
asteissues.
TheSAproposes
aframew
orkof20
indicators.
WasteCoreStrategy
SustainabilityAppraisalReport,HCC(2008)
Theobjectives
oftheplan
are:
1.To
protectand
enhancethequality
ofthenaturaland
historicenvironm
ent.
2.To
achieveandprom
otesustainableland
use,
construction,design
andtransportinHertfordshire.
xixThe Stevenage Borough Local Plan Scoping Report
Appendix 1
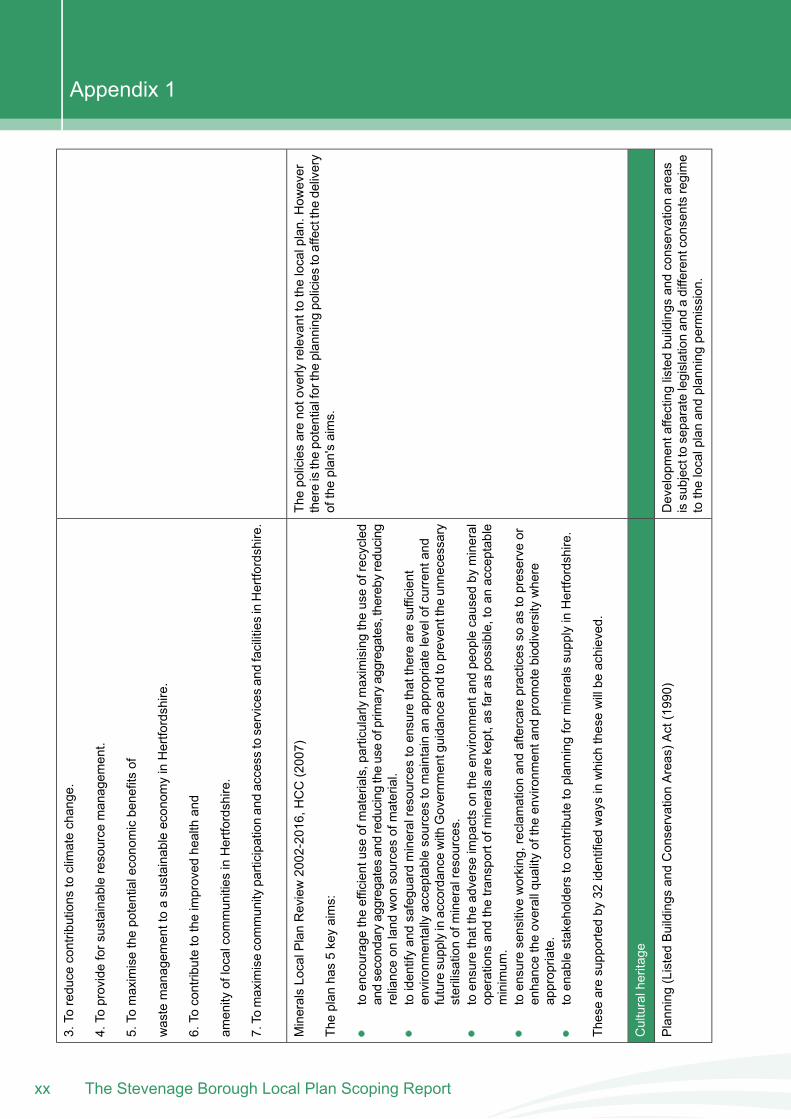
3.To
reduce
contributions
toclimatechange.
4.To
provideforsustainableresource
managem
ent.
5.To
maximisethepotentialeconomicbenefitsof
wastemanagem
enttoasustainableeconom
yinHertfordshire.
6.To
contributetotheimproved
healthand
amenity
oflocalcom
munities
inHertfordshire.
7.To
maximisecommunity
participationandaccess
toservices
andfacilitiesinHertfordshire.
Thepoliciesarenotoverly
relevanttothelocalplan.How
ever
thereisthepotentialfortheplanning
policiestoaffectthedelivery
oftheplan'saims.
MineralsLocalPlanReview2002-2016,HCC(2007)
Theplan
has5keyaims:
toencouragetheefficientuseofmaterials,particularlymaximisingtheuseofrecycled
andsecondaryaggregates
andreducing
theuseofprimaryaggregates,thereby
reducing
relianceon
land
won
sourcesofmaterial.
toidentifyandsafeguardmineralresourcestoensurethattherearesufficient
environm
entally
acceptablesourcestomaintainan
appropriatelevelofcurrentand
futuresupplyinaccordance
with
Governm
entguidanceandtopreventthe
unnecessary
sterilisationofmineralresources.
toensurethattheadverseimpactson
theenvironm
entand
peoplecaused
bymineral
operations
andthetransportofmineralsarekept,asfaraspossible,toan
acceptable
minimum
.toensuresensitive
working,reclamationandaftercarepractices
soas
topreserve
orenhancetheoverallqualityoftheenvironm
entand
prom
otebiodiversitywhere
appropriate.
toenablestakeholderstocontributetoplanning
form
ineralssupplyinHertfordshire.
Thesearesupportedby
32identifiedwaysinwhich
thesewillbe
achieved.
Culturalheritage
Developmentaffectinglistedbuildings
andconservationareas
issubjecttoseparatelegislationandadifferentconsentsregime
tothelocalplanandplanning
permission.
Planning(ListedBuildings
andConservationAreas)A
ct(1990)
The Stevenage Borough Local Plan Scoping Reportxx
Appendix 1
Themainlegislationforlistedbuildings
andthedesignationofconservationareas.ThisAct
enablesbuildings
tobe
listedbecausethey
arejudged
tobe
ofnationalarchitecturalor
historicinterest
Notwithstanding
this,the
actplacesadutyon
theauthority
toensurethepreservationandenhancem
entofaffected
assets
which
shouldbe
reflected
inthelocalplanandanyconsideration
ofits
potentialimpacts.
Atthe
locallevel,the
Actenableslocalauthoritiestodesignateas
aconservationarea
"an
area
ofspecialarchitecturalorhistoricinterest,the
characterorappearanceofwhich
itis
desirabletopreserve
orenhance".
Theareno
specifictargetsbutthe
Actplaces
adutyon
the
authority
toensurethepreservationandenhancem
entofheritage
assetswhich
shouldbe
reflected
inthelocalplanandany
considerationofits
potentialimpacts.
AncientMonum
entsandArchaeologicalAreas
Act(1979)
AnActlegislatingtoprotectthe
archaeologicalheritageofGreatBritain.
Theaimistopreserve
ourm
ostimportantarchaeologicalsitesandmonum
entsandensure
that,w
herearchaeologicalevidence
mustbedestroyedby
essentialdevelopment,an
appropriaterecordismade.Whenexcavationisrequired,professionalarchaeological
organisations
carryitoutand
archaeologistsagreetheprojectdesignas
wellasmonitoring
theworkinprogress.
NationalPlanningPolicyFram
ework
seeGen
eral/o
verarching
Stevenage
2021:O
urtown,ourfuture
seeGen
eral/o
verarching
Themanagem
entplans
donotprovide
specifictargetsbutoutline
generalguidanceforthe
futuredevelopm
entand
maintenance
ofeach
area.
IndividualStevenage
ConservationAreaManagem
entP
lans
forall7oftheconservation
areas:
BroadwaterConservationAreaManagem
entP
lanSPD:O
ldTownHighStreetConservation
AreaManagem
entP
lanSPD:O
rchardRoadConservationAreaManagem
entP
lanSPD:
ShephallG
reen
ConservationAreaManagem
entP
lanSPD:S
tNicholasConservationArea
Managem
entP
lanSPD:S
ymonds
Green
ConservationAreaManagem
entP
lanSPD:Tow
nSquareConservationAreaManagem
entP
lanSPD.
Theseplansaimtoprovideguidance
onappropriaterepairs,m
aintenance
anddevelopm
ent
principles
across
each
conservationarea.E
achmanagem
entplans
aimsto:
xxiThe Stevenage Borough Local Plan Scoping Report
Appendix 1
establishanddefinethesignificanceoftheconservationarea
asawholeandofthe
individualelem
entswhich
contributetothatsignificance,buildingon
thecharacter
appraisal.
assess
anddefinethestrengths,weaknesses,opportunitiesandthreatswithinthearea
andhowtheseimpacton
thesignificanceoftheindividualelem
entsandofthe
conservationarea
asawhole.
provideabenchm
arkforassessing
andmanagingchange.
provideguidance
toensurethatthecharacterand
appearance
oftheconservationarea
willbe
maintainedthroughtheeffectivemanagem
entofchangeandthatopportunities
toenhancethecharacterand
appearance
aremaximised.
Landscape
Nospecifictargetsareidentified.
TheEuropeanLandscapeConvention(2004)
Although
thisDirectivedoes
notimpose
requirementsdirectly
upon
theLocalPlan,itisimportantthatit'spoliciesseek
tomanageorreduce
impactson
thelandscape,whetherspecifically
Signedandratifiedby
theUKin2006.
TheConvention(alsoknow
nas
theFlorence
Convention)introducedaEurope-wideconcept
centringon
thequality
oflandscapeprotection,managem
entand
planning
andcoveringthe
entireterritory,notjustoutstandinglandscapes.Itcomplem
entstheCouncilofEurope’sand
UNESCO’sheritageconventions.
designated
ornot.TheConventionoutlinestheneed
forjoint
working
aslandscapes
donotholdthesameadministrative
boundariesas
localauthorities.
TheaimsofthisConventionaretoprom
otelandscapeprotection,managem
entand
planning,
andtoorganise
Europeanco-operationon
landscapeissues.
EUSixthEnvironm
entalActionPlan(2002)
See
biod
iversity,flora
andfaun
a.
Therearemorethan
100indicatorsassociated
with
thestrategy,
ofwhich
11have
been
chosen
asheadlineindicators.M
onitoring
reports
identifywhetherperformance
againstthese
isresulting
infavourablechange
andachievem
entofthe
targetpath.
EUSustainableDevelopmentS
trategy
(2006)
Thestrategy
identifiessevenkeyprioritychallenges,m
anyofwhich
arepredom
inantly
environm
ental:
Indicatorsassess
mattersincludinggreenhouse
gasem
issions,
grow
thofGDP,abundanceofkeyspecies,riskofpoverty,life
expectancy
andchangesinbuiltup
land.
Clim
atechange
andcleanenergy
Sustainabletransport
Sustainableconsum
ption&production
Conservationandmanagem
entofnaturalresources
Thelocalplan'spoliciesshouldcontributetowards
the
achievem
entoftargetsinthisdocument.
Public
Health
The Stevenage Borough Local Plan Scoping Reportxxii
Appendix 1
Socialinclusion,dem
ographyandmigration
Globalpovertyandsustainabledevelopm
entchallenges
Nospecifictargetsareidentified.
TheEUEnvironm
entalN
oise
Directive(2002/49/EC)
Although
thisDirectivedoes
notimpose
requirementsdirectly
upon
theLocalPlan,itisimportantthatit'spoliciesseek
tomanageorreduce
noisepollutionandits
impacts.
Theunderlyingprinciples
ofthisdirectiveare:
•Monitoringtheenvironm
entalproblem
;byrequiring
competentauthorities
inMem
berS
tates
todraw
up"strategicnoisemaps"for
majorroads,railways,airportsandagglom
erations,using
harmonised
noiseindicators;
•Informingandconsultingthepublicaboutnoise
exposure,itseffects,andthemeasures
considered
toaddressnoise,inlinewith
theprinciples
oftheAarhusConvention;
•Addressinglocalnoise
issues
byrequiring
competentauthorities
todraw
upactionplans
toreduce
noisewherenecessaryandmaintainenvironm
entalnoise
quality
whereitisgood;
and
•Developingalong-term
EUstrategy,w
hich
includes
objectives
toreduce
thenumberof
peopleaffected
bynoiseinthelongerterm,
andprovides
aframew
orkfordevelopingexistingCom
munity
policyon
noisereductionfrom
source.
DraftNationalPlanningPolicyFram
ework
See
Gen
eral/o
verarching
NaturalEnvironm
entand
RuralCom
munities
Act(2006)
See
Biodiversity,flora
andfaun
a
Key
targetsinclude:
SecuringtheFuture:The
UKGovernm
entS
ustainableDevelopmentS
trategy
(2005)
Astrategy
toensuretheaimofsustainabledevelopm
entthrough
implem
entingguiding
principles:
A12.5%reductioningreenhouse
gasem
issionsbelow
1990
levelsand
movetowards
a20%reductionincarbon
dioxideem
issions
below1990
levelsby
2010;
xxiiiThe Stevenage Borough Local Plan Scoping Report
Appendix 1
Living
withinenvironm
entallimits
–respectingthelim
itsoftheplanet’senvironm
ent,
resourcesandbiodiversity.Improvetheenvironm
entand
ensurethatresource
levels
arenotimpairedandremainforfuturegeneration.
Reversing
thelong-term
declineinthenumberoffarmland
birdsby
2020,asmeasuredannuallyagainstunderlying
trends;
Achieve
abetterbalance
betweenhousingavailabilityand
thedemandforhousing,including
improvingaffordability,
Ensuringastrong
healthyandjustsociety–meetingthediverseneedsofallpeoplein
existingandfuturecommunities
throughtheprom
otionofpersonalwell-being,social
cohesion
andinclusion,andequalopportunityforall.
inallEnglishregionswhileprotectingvaluablecountryside
around
ourtow
ns,cities
andinthegreenbeltandthe
sustainabilityoftowns
andcities.
Achieving
asustainableeconom
y–buildingastrong,stableandsustainableeconom
ywhich
provides
prosperityandopportunitiesforallandinwhich
environm
entaland
socialcostsfallon
thosewho
impose
them
andincentives
aredevelopedforefficient
resource
use.
Reassurethepublic,reducingthefearofcrimeand
anti-socialbehaviour,andbuildingconfidence
inthe
Crim
inalJusticeSystemwithoutcom
prom
isingfairness.
PromotingGoodGovernance–Activelyprom
otingeffective,participativesystem
sof
governance
inalllevelsofsociety,engaging
people’screativity,energyanddiversity.
Halve
thenumberofchildreninrelativelow-income
households
between1998-99and2010-11,on
theway
toeradicatingchild
poverty
by2020
Using
Sound
Science
ResponsiblyEnsuringpolicyisdevelopedandimplem
entedon
thebasisofstrong
scientificuncertaintyas
wellaspublicattitudes
andvalues.
Reducehealthinequalitiesby
10%by
2010
asmeasured
byinfantmortalityandlifeexpectancy
atbirth
By2010,increasetheuseofpublictransport(bus
andlight
rail)by
morethan
12%inEngland
comparedwith
2000
levels,w
ithgrow
thineveryregion
Lead
thedeliveryofcleaner,saferand
greenerpublic
spaces
andimprovem
entofthe
quality
ofthebuilt
environm
entindeprived
areasandacross
thecountry,w
ithmeasurableimprovem
entby2008
Thelocalplan'spoliciesandobjectives
shouldcontributetowards
theprinciples
andtargetscontainedinthisdocument.
Nospecificindicatorsortargetsareidentified.
Countryside
andRIghtsofWay
Act(2000)
Thelocalplanshouldensureareasofvalueareappropriately
protectedand/orenhanced.
TheActprovides
forpublic
access
onfoottocertaintypesofland,amends
thelawrelating
topublicrightsofway,increases
protectionforS
itesofSpecialScientificInterest(SSSI)and
strengthenswildlifeenforcem
entlegislation,andprovides
forbetterm
anagem
entofA
reas
ofOutstanding
NaturalBeauty(AONB).
EastofE
ngland
WoodlandStrategy,Forestry
Com
mission
(2003)
See
Biodiversity,flora
andfaun
a
The Stevenage Borough Local Plan Scoping Reportxxiv
Appendix 1
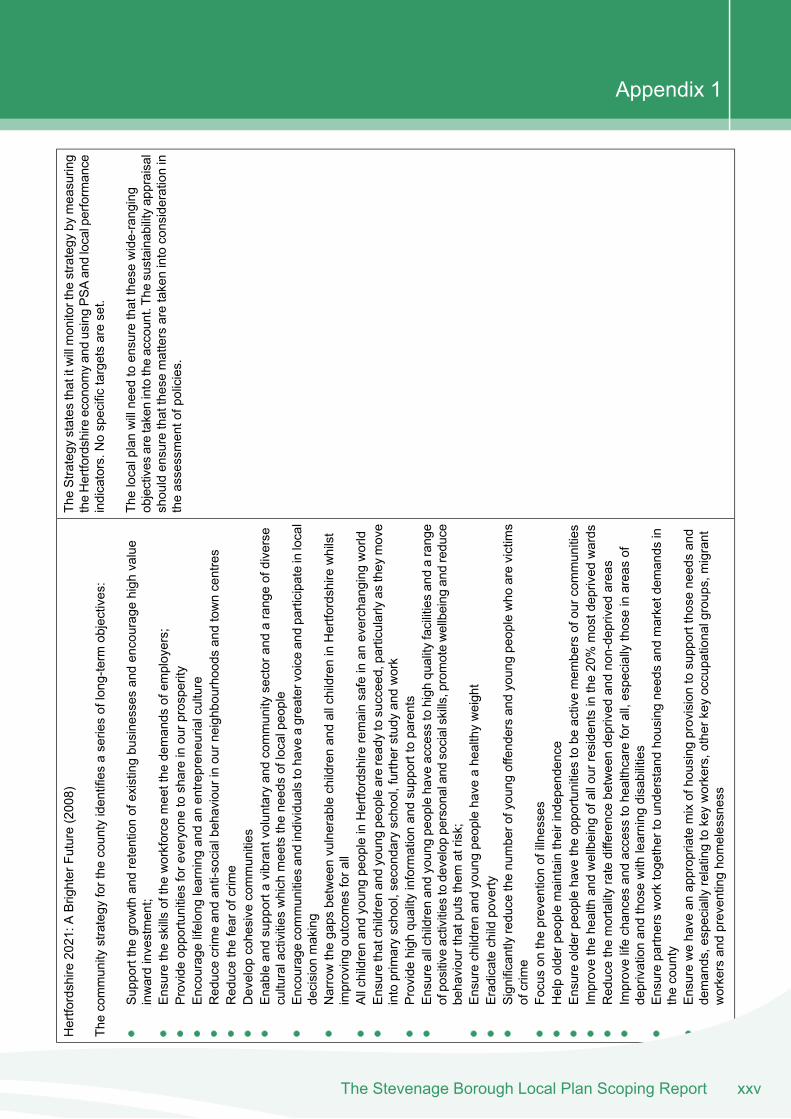
TheStrategy
states
thatitwillmonitorthe
strategy
bymeasuring
theHertfordshire
econom
yandusingPS
Aandlocalperformance
indicators.N
ospecifictargetsareset.
Hertfordshire
2021:A
BrighterFuture(2008)
Thecommunity
strategy
forthe
countyidentifiesaseriesoflong-term
objectives:
Thelocalplanwillneed
toensurethatthesewide-ranging
objectives
aretakenintotheaccount.Thesustainabilityappraisal
shouldensurethatthesemattersaretakenintoconsiderationin
theassessmentofpolicies.
Supportthegrow
thandretentionofexistingbusinesses
andencouragehigh
value
inwardinvestment;
Ensuretheskillsoftheworkforce
meetthe
demands
ofem
ployers;
Provide
opportunitiesforeveryonetoshareinourprosperity
Encourage
lifelonglearning
andan
entrepreneurialculture
Reducecrimeandanti-socialbehaviourinourneighbourhoodsandtowncentres
Reducethefearofcrime
Develop
cohesive
communities
Enableandsupporta
vibrantvoluntaryandcommunity
sectorandarangeofdiverse
culturalactivities
which
meetstheneedsoflocalpeople
Encourage
communities
andindividualstohave
agreatervoice
andparticipateinlocal
decision
making
Narrowthegaps
betweenvulnerablechildrenandallchildreninHertfordshire
whilst
improvingoutcom
esforall
AllchildrenandyoungpeopleinHertfordshire
remainsafeinan
everchanging
world
Ensurethatchildrenandyoungpeoplearereadytosucceed,particularly
asthey
move
intoprimaryschool,secondaryschool,furtherstudyandwork
Provide
high
quality
informationandsupporttoparents
Ensureallchildrenandyoungpeoplehave
access
tohigh
quality
facilitiesandarange
ofpositiveactivities
todeveloppersonalandsocialskills,promotewellbeing
andreduce
behaviourthatputsthem
atrisk;
Ensurechildrenandyoungpeoplehave
ahealthyweight
Eradicatechild
poverty
Significantly
reduce
thenumberofyoung
offendersandyoungpeoplewho
arevictims
ofcrime
Focuson
thepreventionofillnesses
Helpolderpeoplemaintaintheirindependence
Ensureolderpeoplehave
theopportunitiestobe
activemem
bersofourcom
munities
Improvethehealthandwellbeing
ofallourresidentsinthe20%mostdeprived
wards
Reducethemortalityratedifferencebetweendeprived
andnon-deprived
areas
Improvelifechancesandaccess
tohealthcareforall,especiallythoseinareasof
deprivationandthosewith
learning
disabilities
Ensurepartnersworktogethertounderstand
housingneedsandmarketdem
ands
inthecounty
Ensurewehave
anappropriatemixofhousingprovisiontosupportthose
needsand
demands,especially
relatingtokeyworkers,otherkeyoccupationalgroups,migrant
workersandpreventinghomelessness
xxvThe Stevenage Borough Local Plan Scoping Report
Appendix 1
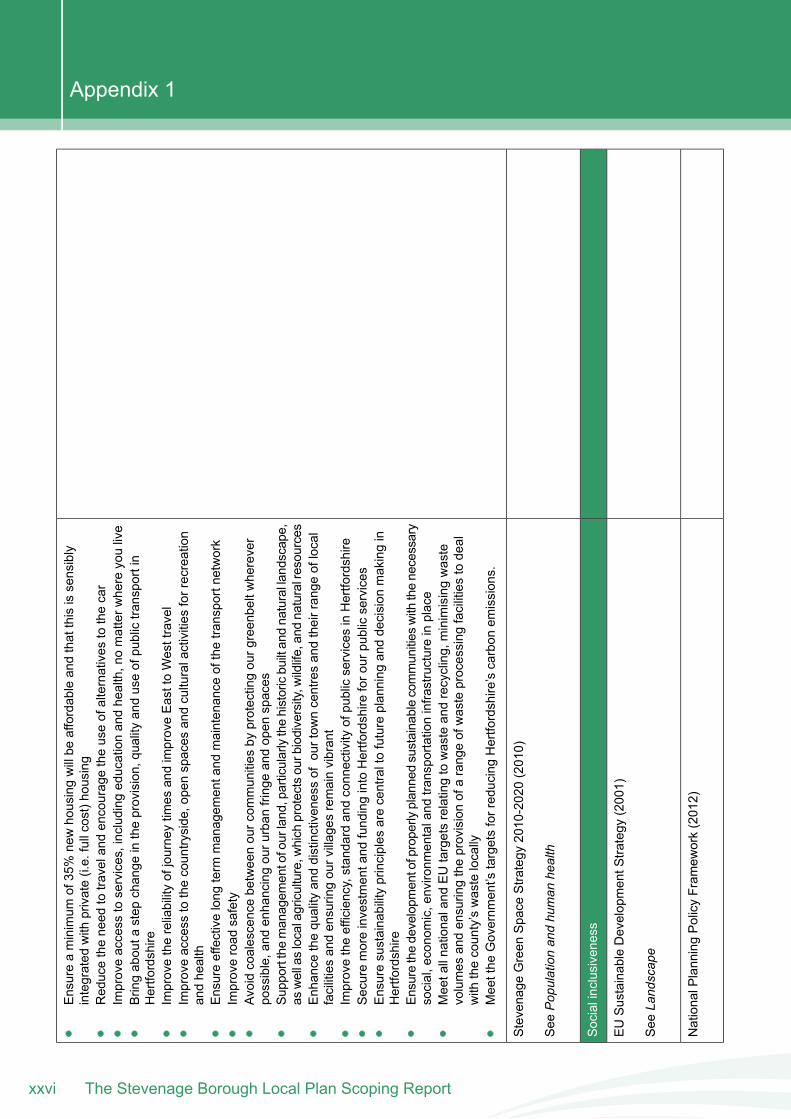
Ensureaminimum
of35%newhousingwillbe
affordableandthatthisissensibly
integrated
with
private(i.e.fullcost)housing
Reducetheneed
totraveland
encouragetheuseofalternatives
tothecar
Improveaccess
toservices,including
educationandhealth,nomatterw
hereyoulive
Bringabouta
step
change
intheprovision,quality
anduseofpublictransportin
Hertfordshire
Improvethereliabilityofjourneytim
esandimproveEasttoWesttravel
Improveaccess
tothecountryside,openspaces
andculturalactivities
forrecreation
andhealth
Ensureeffectivelong
term
managem
entand
maintenance
ofthetransportnetwork
Improveroad
safety
Avoidcoalescencebetweenourcom
munities
byprotectingourgreenbeltwherever
possible,and
enhancingoururban
fringeandopen
spaces
Supportthe
managem
entofourland,particularlythehistoricbuiltandnaturalla
ndscape,
aswellaslocalagriculture,w
hich
protectsourbiodiversity,w
ildlife,andnaturalresources
Enhance
thequality
anddistinctivenessof
ourtow
ncentresandtheirrange
oflocal
facilitiesandensuringourvillages
remainvibrant
Improvetheefficiency,standardandconnectivity
ofpublicservices
inHertfordshire
Securemoreinvestmentand
fundingintoHertfordshire
forourpublicservices
Ensuresustainabilityprinciples
arecentraltofutureplanning
anddecision
makingin
Hertfordshire
Ensurethedevelopm
entofproperly
plannedsustainablecommunities
with
thenecessary
social,economic,environm
entaland
transportationinfrastructureinplace
Meetallnationaland
EUtargetsrelatingtowasteandrecycling,minimisingwaste
volumes
andensuringtheprovisionofarangeofwasteprocessing
facilitiestodeal
with
thecounty’swastelocally
Meetthe
Governm
ent’s
targetsforreducingHertfordshire’scarbon
emissions.
Stevenage
Green
Space
Strategy
2010-2020(2010)
See
Pop
ulationan
dhu
man
health
Socialinclusiveness
EUSustainableDevelopmentS
trategy
(2001)
See
Land
scap
e
NationalPlanningPolicyFram
ework(2012)
The Stevenage Borough Local Plan Scoping Reportxxvi
Appendix 1
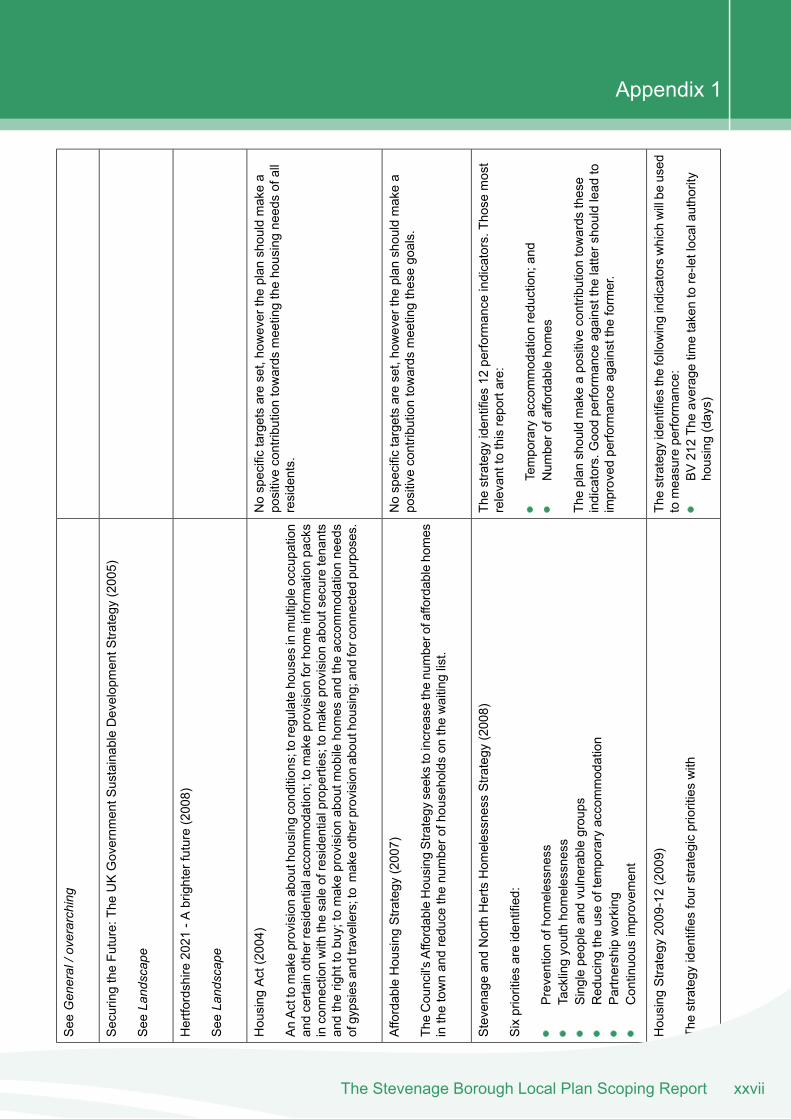
See
Gen
eral/o
verarching
SecuringtheFuture:The
UKGovernm
entS
ustainableDevelopmentS
trategy
(2005)
See
Land
scap
e
Hertfordshire
2021
-Abrighterfuture(2008)
See
Land
scap
e
Nospecifictargetsareset,howevertheplan
shouldmakea
positivecontributiontowards
meetingthehousingneedsofall
residents.
Housing
Act(2004)
AnActtomakeprovisionabouthousing
conditions;toregulatehouses
inmultipleoccupation
andcertainotherresidentialaccom
modation;tomakeprovisionforhom
einformationpacks
inconnectionwith
thesaleofresidentialproperties;tomakeprovisionaboutsecuretenants
andtherighttobuy;tomakeprovisionaboutm
obile
homes
andtheaccommodationneeds
ofgypsiesandtravellers;tomakeotherprovision
abouthousing;and
forconnected
purposes.
Nospecifictargetsareset,howevertheplan
shouldmakea
positivecontributiontowards
meetingthesegoals.
AffordableHousing
Strategy
(2007)
TheCouncil's
AffordableHousing
Strategy
seekstoincrease
thenumberofaffordablehomes
inthetownandreduce
thenumberofhouseholdson
thewaitinglist.
Thestrategy
identifies12
performance
indicators.Those
most
relevanttothisreportare:
Stevenage
andNorthHertsHom
elessnessStrategy
(2008)
Sixprioritiesareidentified:
Temporaryaccommodationreduction;and
Preventionofhomelessness
Num
berofaffordablehomes
Theplan
shouldmakeapositivecontributiontowards
these
indicators.G
oodperformance
againstthe
lattershouldlead
toimproved
performance
againstthe
former.
Tacklingyouthhomelessness
Singlepeopleandvulnerablegroups
Reducingtheuseoftemporaryaccommodation
Partnershipworking
Continuous
improvem
ent
Thestrategy
identifiesthefollowingindicatorswhich
willbe
used
tomeasureperformance:
Housing
Strategy
2009-12(2009)
Thestrategy
identifiesfourstrategicprioritieswith
BV212Theaveragetim
etakentore-letlocalauthority
housing(days)
xxviiThe Stevenage Borough Local Plan Scoping Report
Appendix 1
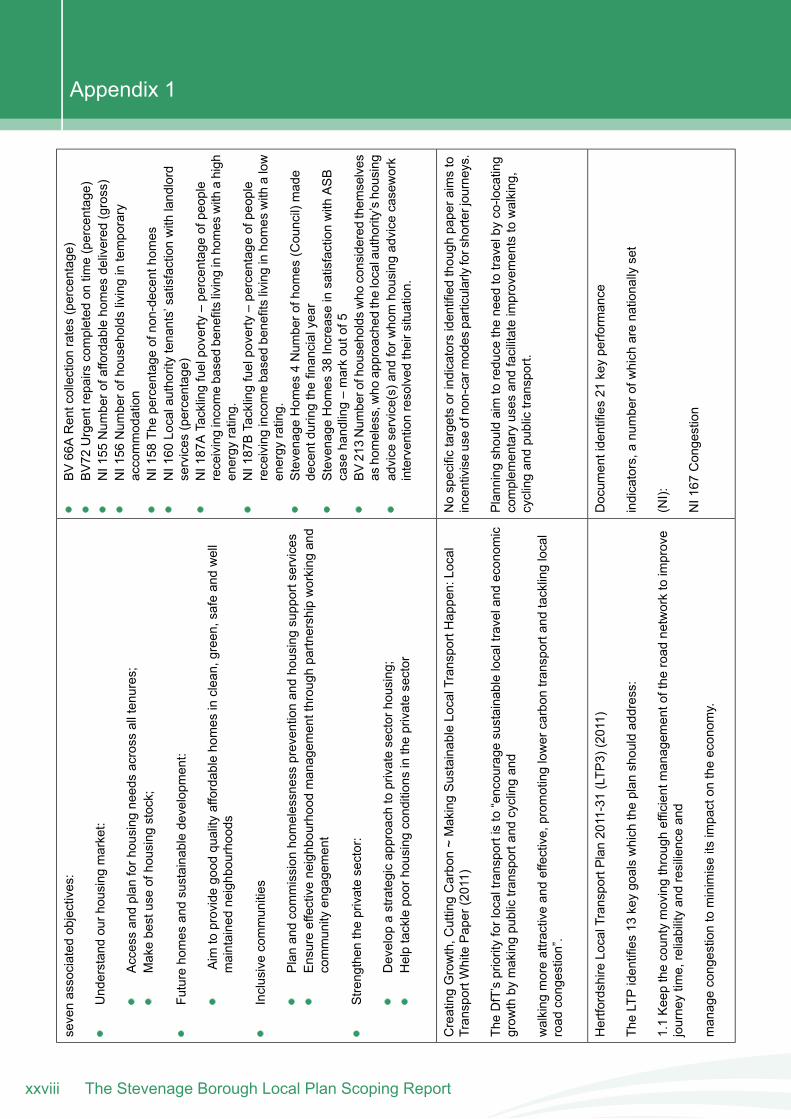
sevenassociated
objectives:
BV66ARentcollectionrates(percentage)
BV72
Urgentrepairscompleted
ontim
e(percentage)
Understandourhousing
market:
NI155
Num
berofaffordablehomes
delivered
(gross)
NI156
Num
berofhouseholdslivingintemporary
accommodation
Accessandplan
forhousing
needsacross
alltenures;
Makebestuseofhousingstock;
NI158
Thepercentage
ofnon-decenthomes
NI160
Localauthoritytenants’satisfactionwith
landlord
services
(percentage)
Futurehomes
andsustainabledevelopm
ent:
NI187ATacklingfuelpoverty
–percentage
ofpeople
receivingincomebasedbenefitslivinginhomes
with
ahigh
energy
rating.
Aim
toprovidegood
quality
affordablehomes
inclean,green,safeandwell
maintainedneighbourhoods
NI187BTacklingfuelpoverty
–percentage
ofpeople
receivingincomebasedbenefitslivinginhomes
with
alow
energy
rating.
Inclusivecommunities
Planandcommission
homelessnesspreventionandhousingsupportservices
Stevenage
Hom
es4Num
berofhom
es(Council)made
decentduringthefinancialyear
Ensureeffectiveneighbourhoodmanagem
entthrough
partnershipworking
and
community
engagement
Stevenage
Hom
es38
Increase
insatisfactionwith
ASB
case
handling–markoutof5
Strengthen
theprivatesector:
BV213Num
berofhouseholdswho
considered
them
selves
ashomeless,who
approached
thelocalauthority’shousing
Develop
astrategicapproach
toprivatesectorhousing;
advice
service(s)andforw
homhousingadvice
casework
interventionresolved
theirsituation.
Helptacklepoorhousingconditionsintheprivatesector
Nospecifictargetsorindicatorsidentifiedthough
paperaimsto
incentiviseuseofnon-carm
odes
particularly
forshorterjourneys.
CreatingGrowth,C
uttingCarbon~MakingSustainableLocalTransportHappen:Local
TransportW
hitePaper(2011)
Planningshouldaimtoreduce
theneed
totravelbyco-locating
complem
entaryuses
andfacilitateimprovem
entstowalking,
cyclingandpublictransport.
TheDfT’spriorityforlocaltransportisto“encourage
sustainablelocaltraveland
econom
icgrow
thby
makingpublictransportandcyclingand
walking
moreattractiveandeffective,prom
otinglowercarbon
transportandtacklinglocal
road
congestion”.
Docum
entidentifies
21keyperformance
Hertfordshire
LocalTransportPlan2011-31(LTP
3)(2011)
indicators,a
numberofw
hich
arenationally
set
TheLTPidentifies13
keygoalswhich
theplan
shouldaddress:
(NI):
1.1Keepthecountymovingthroughefficientmanagem
entofthe
road
networktoimprove
journeytim
e,reliabilityandresilienceand
NI167
Congestion
managecongestiontominimiseits
impacton
theeconom
y.
The Stevenage Borough Local Plan Scoping Reportxxviii
Appendix 1
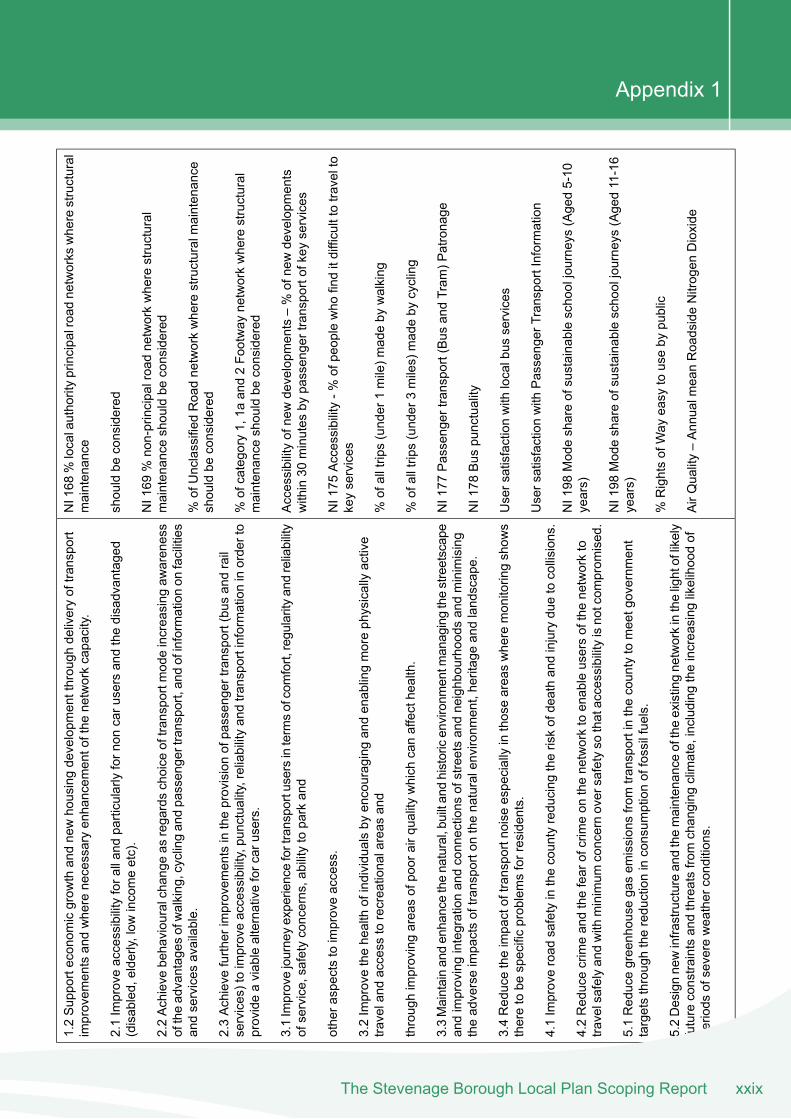
NI168
%localauthorityprincipalroadnetworks
wherestructural
maintenance
1.2Supporteconom
icgrow
thandnewhousingdevelopm
entthrough
deliveryoftransport
improvem
entsandwherenecessaryenhancem
entofthe
networkcapacity.
shouldbe
considered
2.1Improveaccessibilityforallandparticularly
fornon
carusersandthedisadvantaged
(disabled,elderly,low
incomeetc).
NI169
%non-principalroadnetworkwherestructural
maintenance
shouldbe
considered
2.2Achieve
behaviouralchangeas
regardschoice
oftransportmodeincreasing
awareness
oftheadvantages
ofwalking,cyclingandpassengertransport,andofinformationon
facilities
andservices
available.
%ofUnclassified
Roadnetworkwherestructuralmaintenance
shouldbe
considered
2.3Achieve
furtherimprovem
entsintheprovisionofpassengertransport(bus
andrail
services)toimproveaccessibility,punctuality,reliabilityandtransportinformationinorderto
provideaviablealternativeforcarusers.
%ofcategory1,1a
and2Footway
networkwherestructural
maintenance
shouldbe
considered
3.1Improvejourneyexperiencefortransportusersintermsofcomfort,regularityandreliability
ofservice,safetyconcerns,abilitytoparkand
Accessibilityofnewdevelopm
ents–%ofnewdevelopm
ents
within30
minutes
bypassengertransportofkeyservices
otheraspectstoimproveaccess.
NI175
Accessibility-%
ofpeoplewho
finditdifficulttotravelto
keyservices
3.2Improvethehealthofindividualsby
encouragingandenablingmorephysicallyactive
traveland
access
torecreationalareas
and
%ofalltrips(under1mile)m
adeby
walking
throughimprovingareasofpoorairqualitywhich
canaffecthealth.
%ofalltrips(under3miles)madeby
cycling
3.3Maintainandenhancethenatural,builtandhistoricenvironm
entm
anagingthestreetscape
andimprovingintegrationandconnections
ofstreetsandneighbourhoods
andminimising
theadverseimpactsoftransporton
thenaturalenvironm
ent,heritageandlandscape.
NI177
Passengertransport(Bus
andTram
)Patronage
NI178
Bus
punctuality
3.4Reducetheimpactoftransportnoiseespeciallyinthoseareaswheremonitoringshow
stheretobe
specificproblemsforresidents.
Usersatisfactionwith
localbus
services
Usersatisfactionwith
PassengerTransportInformation
4.1Improveroad
safetyinthecountyreducing
theriskofdeathandinjuryduetocollisions.
NI198
Modeshareofsustainableschooljourneys
(Aged5-10
years)
4.2Reducecrimeandthefearofcrimeon
thenetworktoenableusersofthenetworkto
travelsafelyandwith
minimum
concernoversafetyso
thataccessibilityisnotcom
prom
ised.NI198
Modeshareofsustainableschooljourneys
(Aged11-16
years)
5.1Reducegreenhouse
gasem
issionsfromtransportinthecountytomeetgovernm
ent
targetsthroughthereductioninconsum
ptionoffossilfuels.
%RightsofWay
easy
touseby
public
5.2Designnewinfrastructureandthemaintenance
oftheexistingnetworkinthelightoflikely
futureconstraintsandthreatsfromchanging
climate,includingtheincreasing
likelihoodof
periods
ofsevereweatherconditions.
AirQuality–Annualm
eanRoadsideNitrogen
Dioxide
xxixThe Stevenage Borough Local Plan Scoping Report
Appendix 1
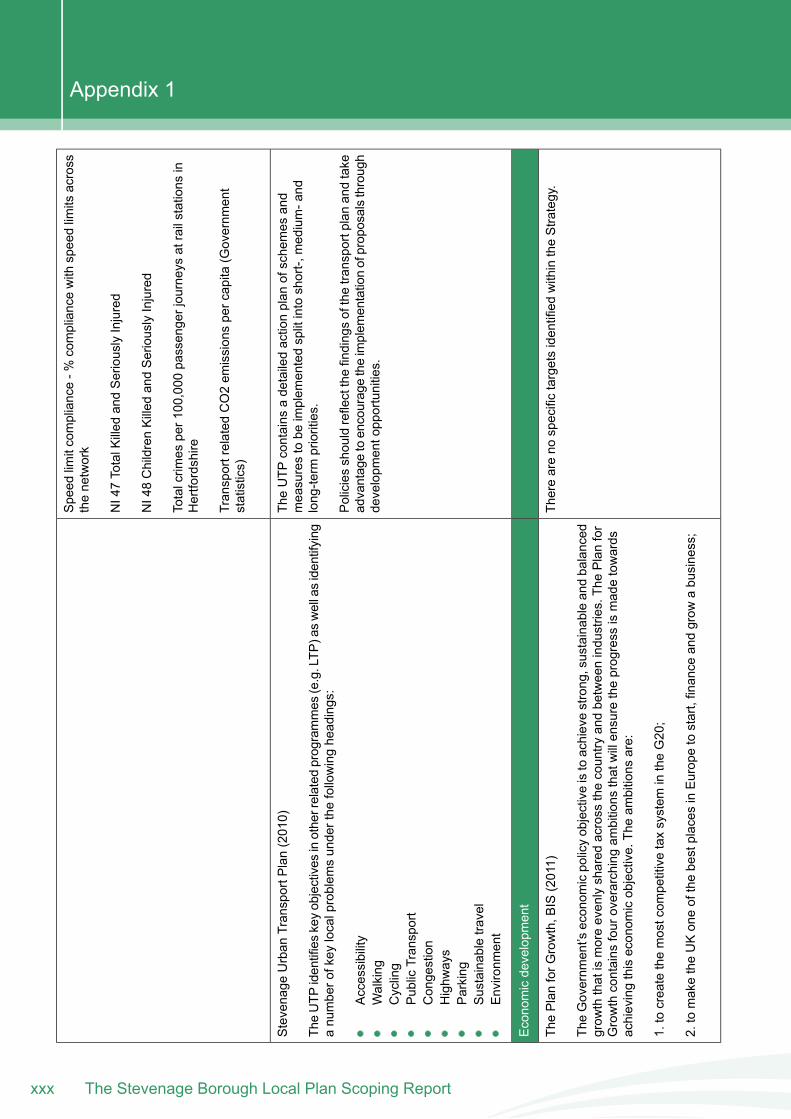
Speed
limitcompliance-%
compliancewith
speedlim
itsacross
thenetwork
NI47TotalKilled
andSeriouslyInjured
NI48ChildrenKilled
andSeriouslyInjured
Totalcrim
esper100,000
passengerjourneysatrailstations
inHertfordshire
Transportrelated
CO2em
issionspercapita
(Governm
ent
statistics)
TheUTP
contains
adetailedactionplan
ofschemes
and
measurestobe
implem
entedsplitintoshort-,medium-and
long-term
priorities.
Stevenage
Urban
TransportP
lan(2010)
TheUTP
identifieskeyobjectives
inotherrelated
programmes
(e.g.LTP
)aswellasidentifying
anumberofkey
localproblem
sunderthe
followingheadings:
Policiesshouldreflectthefindingsofthetransportplan
andtake
advantagetoencouragetheimplem
entationofproposalsthrough
developm
entopportunities.
Accessibility
Walking
Cycling
Public
Transport
Congestion
Highw
ays
Parking
Sustainabletravel
Environm
ent
Economicdevelopm
ent
Thereareno
specifictargetsidentifiedwithintheStrategy.
ThePlanforG
rowth,B
IS(2011)
TheGovernm
ent’s
econom
icpolicyobjectiveistoachievestrong,sustainableandbalanced
grow
ththatismoreevenlyshared
across
thecountry
andbetweenindustries.ThePlanfor
Growthcontains
fouroverarchingam
bitions
thatwillensuretheprogress
ismadetowards
achievingthiseconom
icobjective.Theam
bitions
are:
1.tocreatethemostcom
petitivetaxsystem
intheG20;
2.tomaketheUKoneofthebestplaces
inEuropetostart,finance
andgrow
abusiness;
The Stevenage Borough Local Plan Scoping Reportxxx
Appendix 1
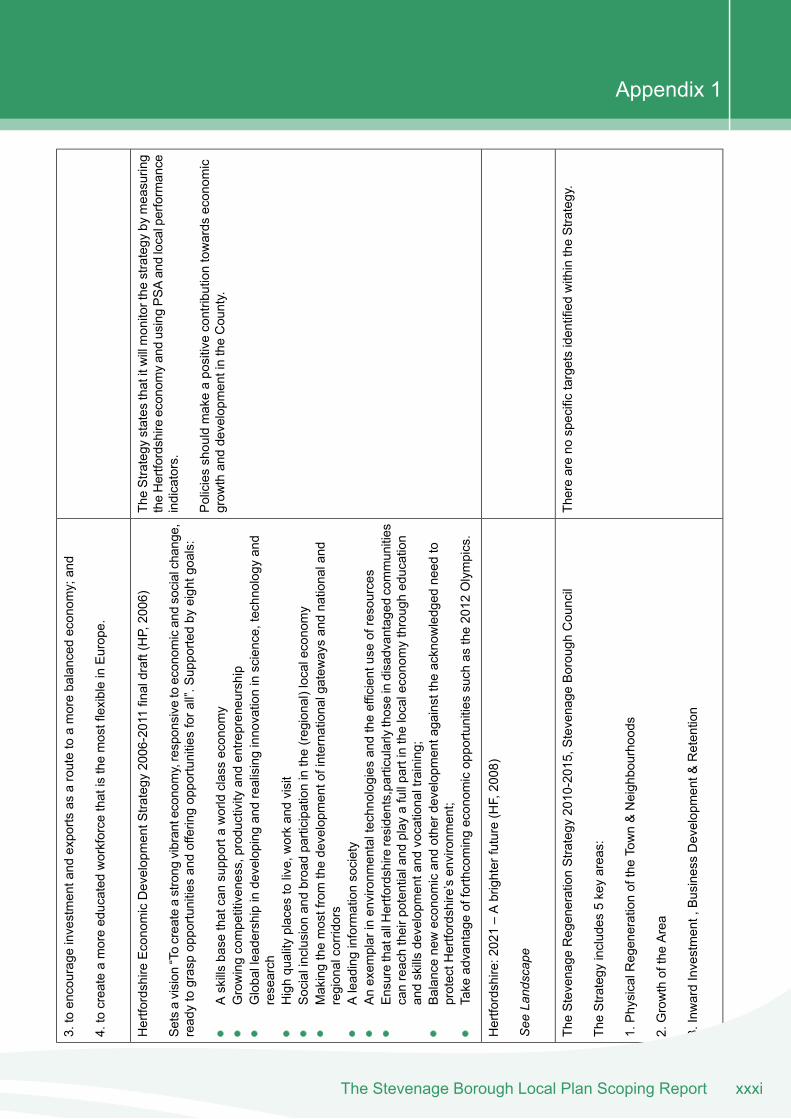
3.toencourageinvestmentand
exports
asaroutetoamorebalanced
econom
y;and
4.tocreateamoreeducated
workforce
thatisthemostflexibleinEurope.
TheStrategy
states
thatitwillmonitorthe
strategy
bymeasuring
theHertfordshire
econom
yandusingPS
Aandlocalperformance
indicators.
Hertfordshire
EconomicDevelopmentS
trategy
2006-2011finaldraft(HP,2006)
Setsavision
“Tocreateastrong
vibranteconomy,responsive
toeconom
icandsocialchange,
readytograspopportunitiesandofferingopportunitiesforall”.S
upportedby
eightgoals:
Policiesshouldmakeapositivecontributiontowards
econom
icgrow
thanddevelopm
entintheCounty.
Askillsbase
thatcansupporta
worldclasseconom
yGrowingcompetitiveness,productivity
andentrepreneurship
Globalleadershipindeveloping
andrealisinginnovationinscience,technology
and
research
Highquality
places
tolive,workandvisit
Socialinclusion
andbroadparticipationinthe(regional)localeconomy
Makingthemostfromthedevelopm
entofinternationalgatew
aysandnationaland
regionalcorridors
Aleadinginformationsociety
Anexem
plarinenvironm
entaltechnologiesandtheefficientuseofresources
EnsurethatallHertfordshire
residents,particularly
thoseindisadvantagedcommunities
canreachtheirpotentialand
play
afullpartinthelocaleconomythrougheducation
andskillsdevelopm
entand
vocationaltraining;
Balance
neweconom
icandotherdevelopmentagainsttheacknow
ledged
need
toprotectH
ertfordshire’senvironm
ent;
Take
advantageofforthcomingeconom
icopportunitiessuch
asthe2012
Olympics.
Hertfordshire:2021–Abrighterfuture(HF,2008)
See
Land
scap
e
Thereareno
specifictargetsidentifiedwithintheStrategy.
TheStevenage
RegenerationStrategy
2010-2015,Stevenage
Borough
Council
TheStrategy
includes
5keyareas:
1.PhysicalR
egenerationoftheTown&Neighbourhoods
2.GrowthoftheArea
3.InwardInvestment,BusinessDevelopment&
Retention
xxxiThe Stevenage Borough Local Plan Scoping Report
Appendix 1
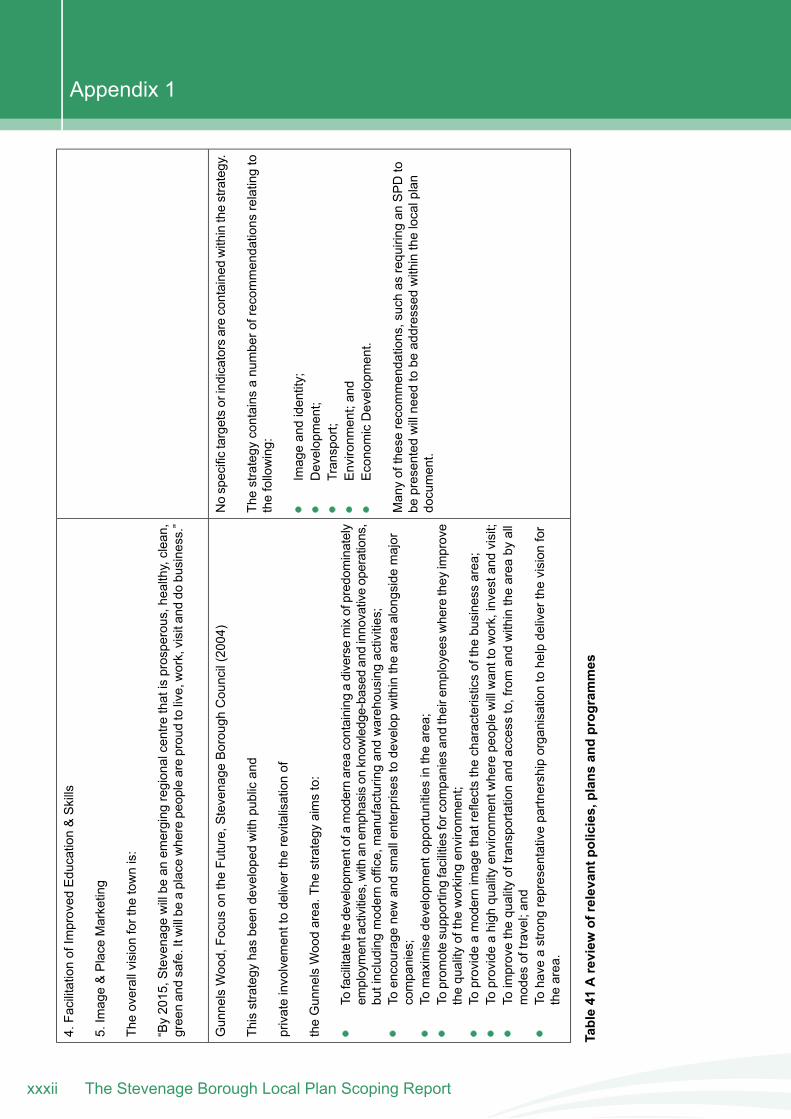
4.FacilitationofImproved
Education&Skills
5.Image&Place
Marketing
Theoverallvisionforthe
townis:
“By2015,S
tevenage
willbe
anem
erging
regionalcentrethatisprosperous,healthy,clean,
greenandsafe.Itw
illbe
aplacewherepeopleareproudtolive,work,visitand
dobusiness.”
Nospecifictargetsorindicatorsarecontainedwithinthestrategy.
GunnelsWood,Focuson
theFuture,S
tevenage
Borough
Council(2004)
Thestrategy
contains
anumberofrecom
mendations
relatingto
thefollowing:
Thisstrategy
hasbeen
developedwith
publicand
privateinvolvem
enttodelivertherevitalisationof
Imageandidentity;
theGunnelsWoodarea.The
strategy
aimsto:
Development;
Transport;
Tofacilitatethedevelopm
entofa
modernarea
containing
adiversemixofpredom
inately
employmentactivities,w
ithan
emphasison
know
ledge-basedandinnovativeoperations,
butincluding
modernoffice,manufacturingandwarehousing
activities;
Environm
ent;and
EconomicDevelopment.
Manyoftheserecommendations,suchas
requiring
anSPDto
bepresentedwillneed
tobe
addressedwithinthelocalplan
document.
Toencouragenewandsm
allenterprises
todevelopwithinthearea
alongsidemajor
companies;
Tomaximisedevelopm
entopportunitiesinthearea;
Toprom
otesupportingfacilitiesforcom
panies
andtheiremployeeswherethey
improve
thequality
oftheworking
environm
ent;
Toprovideamodernimagethatreflectsthecharacteristicsofthebusiness
area;
Toprovideahigh
quality
environm
entw
herepeoplewillwanttowork,investandvisit;
Toimprovethequality
oftransportationandaccess
to,fromandwithinthearea
byall
modes
oftravel;and
Tohave
astrong
representativepartnershiporganisationtohelpdeliverthevision
for
thearea.
Table41
Areview
ofrelevant
policies,plan
san
dprog
rammes
The Stevenage Borough Local Plan Scoping Reportxxxii
Appendix 1