Embed Size (px)
Citation preview
� Corresponding author. Tel.: +E-mail address: p.fokker@nitg
0360-5442/$ - see front matter #doi:10.1016/j.energy.2004.03.076
31 30 256 4644; fax: +31 30 256 4605..tno.nl (P.A. Fokker).
2004 Elsevier Ltd. All rights reserved.
Energy 29 (2004) 1423–1429
www.elsevier.com/locate/energy
The injectivity of coalbed CO2 injection wells
P.A. Fokker �, L.G.H van der Meer
Netherlands Institute of Applied Geosience, TNO—National Geological Survey, Princetonplein 6,P.O. Box 80015, 3508 TA, Utrecht, The Netherlands
Abstract
Though it may be possible to enhance methane production from coal by injecting CO2, because coal ispoorly permeable it is usually necessary to inject under fracturing conditions to achieve acceptable injec-tivity. Concomitantly, the process of replacing methane by the injected CO2 causes the matrix to swell.These two processes—the fracturing of the coal and the swelling—have opposite effect on the injectivity.TNO-NITG have pressure data from a CO2 injection test in a coalbed methane field. We used the SIMED
II coalbed methane simulator to history match the test behaviour and to find the most sensitive parametersaffecting the injectivity of the CO2 injection well. An analysis of the pressure records revealed both theoccurrence of fracturing and the reduction in permeability that swelling induced. When applied to anextended injection simulation, the simulator showed that the most sensitive parameters influencing the injec-tivity were the permeability, the fracture conductivity, and the cleat system porosity. Unfortunately, due tothe adsorption of the CO2 and the fluctuations in pressure during injection tests, all these vary over time.# 2004 Elsevier Ltd. All rights reserved.
1. Introduction
Injecting CO2 into coal seams might be an attractive option for the underground seques-
tration of CO2: the CO2 would be stored and, simultaneously, the production of coalbed meth-
ane enhanced (ECBM) [1]. The revenue from methane production could offset the expenditure
on the storage operation. There is a problem, however, coal is poorly permeable to fluids. Fur-
thermore, replacing methane by the injected CO2 will cause the matrix to swell. This swelling
will partially block the cleat system and negatively affect the main flow parameters. To achieve
an acceptable CO2 injection rate it might therefore be necessary to allow the near-well gas press-
ure in the cleat system to exceed the hydraulic fracturing pressure.
P.A. Fokker, L.G.H. van der Meer / Energy 29 (2004) 1423–14291424
In this paper we present the analysis of a CO2 injection test in a coalbed methane field anddemonstrate the processes of fracturing of the reservoir during injection and a gradual decreasein reservoir permeability during continued injection. We used the resulting knowledge to simu-late extended injection tests, with larger injection rates and greater volumes.
2. Field example
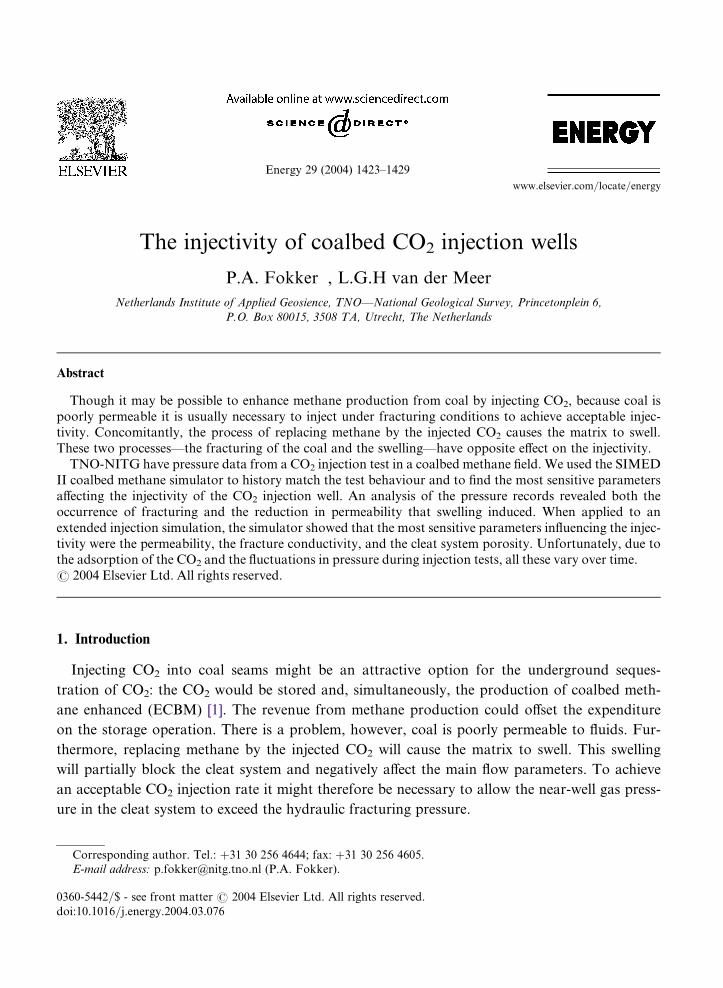
TNO-NITG are involved in two large demonstration projects on ECBM: one in Canada,where Gunter et al. [1] briefly described the setting, and one in Poland in a comparable setting[2]. During the course of these projects, TNO-NITG acquired reliable and comprehensive press-ure data from an intermittent injection test of CO2 into an existing coalbed methane well, fol-lowed by an extended shut-in period. The scaled raw data are depicted in Fig. 1. We madehistory matches using SIMED II [3,4], a reservoir simulator designed for modelling coalbedmethane reservoirs, taking account of combined flow of water and multi-phase gas flow andadsorption onto the coal. For the given problem, we decided to use a two-layered radial gridwith radial symmetry. Where appropriate, the fracture is located in layer 1 and partially pene-trates layer 2. We also performed runs in which a quarter of the reservoir was divided into fouror six radial segments, one of them containing the fracture. This had some effect on the out-come of the adjustable parameters, but it did not influence the major outcomes of the study.The starting point was to try to history match the data conventionally, without using hydrauli-
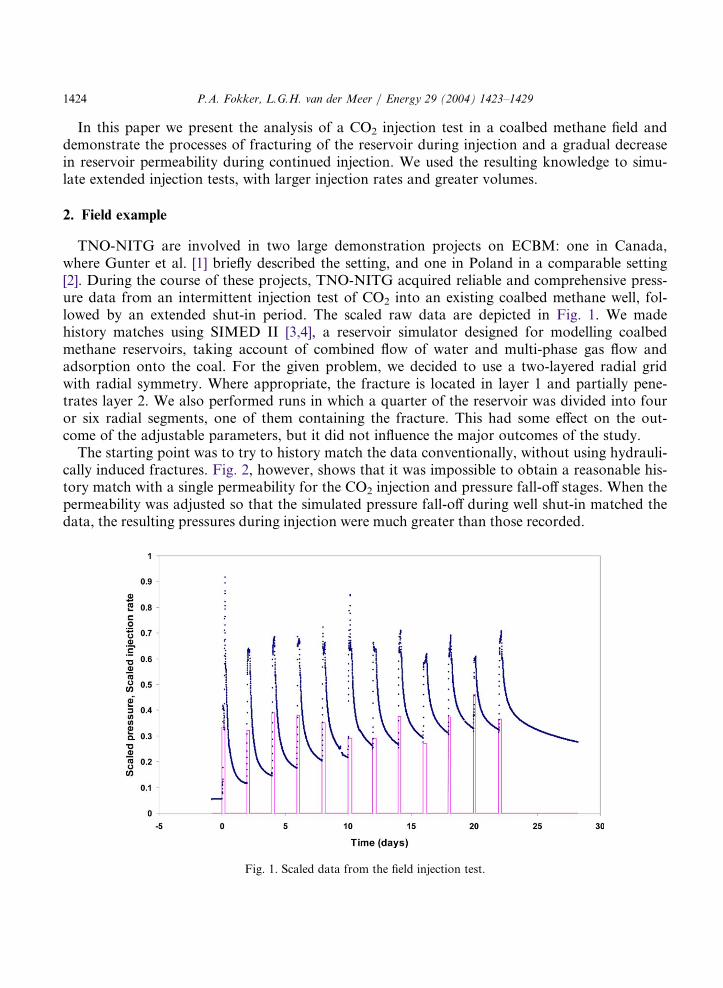
cally induced fractures. Fig. 2, however, shows that it was impossible to obtain a reasonable his-tory match with a single permeability for the CO2 injection and pressure fall-off stages. When thepermeability was adjusted so that the simulated pressure fall-off during well shut-in matched thedata, the resulting pressures during injection were much greater than those recorded.
Fig. 1. Scaled data from the field injection test.
1425P.A. Fokker, L.G.H. van der Meer / Energy 29 (2004) 1423–1429
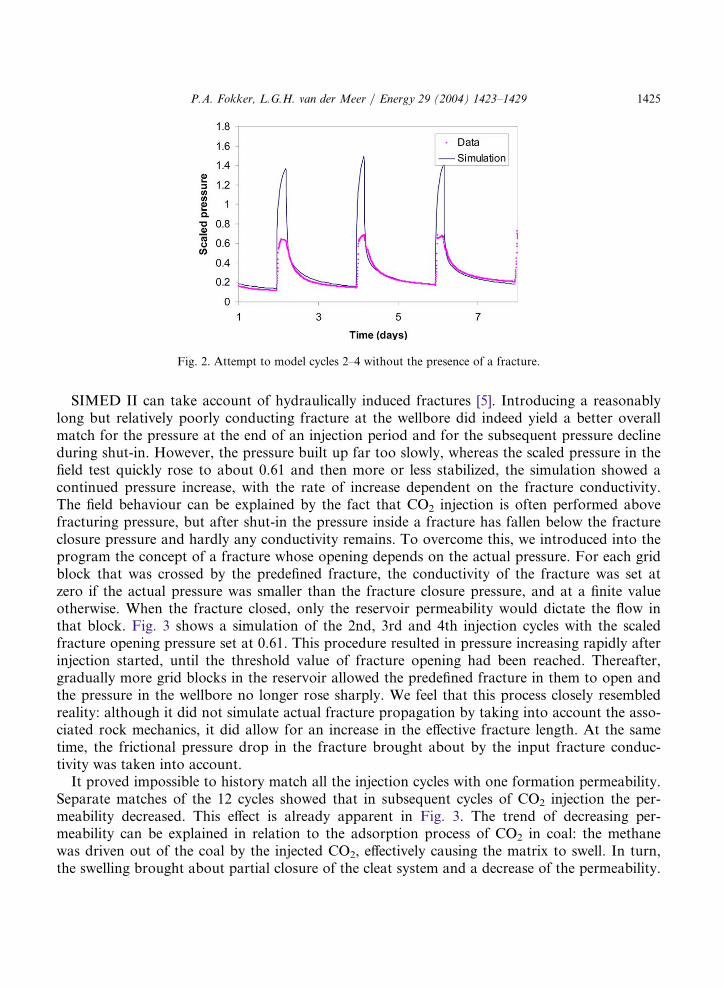
SIMED II can take account of hydraulically induced fractures [5]. Introducing a reasonablylong but relatively poorly conducting fracture at the wellbore did indeed yield a better overallmatch for the pressure at the end of an injection period and for the subsequent pressure declineduring shut-in. However, the pressure built up far too slowly, whereas the scaled pressure in thefield test quickly rose to about 0.61 and then more or less stabilized, the simulation showed acontinued pressure increase, with the rate of increase dependent on the fracture conductivity.The field behaviour can be explained by the fact that CO2 injection is often performed abovefracturing pressure, but after shut-in the pressure inside a fracture has fallen below the fractureclosure pressure and hardly any conductivity remains. To overcome this, we introduced into theprogram the concept of a fracture whose opening depends on the actual pressure. For each gridblock that was crossed by the predefined fracture, the conductivity of the fracture was set atzero if the actual pressure was smaller than the fracture closure pressure, and at a finite valueotherwise. When the fracture closed, only the reservoir permeability would dictate the flow inthat block. Fig. 3 shows a simulation of the 2nd, 3rd and 4th injection cycles with the scaledfracture opening pressure set at 0.61. This procedure resulted in pressure increasing rapidly afterinjection started, until the threshold value of fracture opening had been reached. Thereafter,gradually more grid blocks in the reservoir allowed the predefined fracture in them to open andthe pressure in the wellbore no longer rose sharply. We feel that this process closely resembledreality: although it did not simulate actual fracture propagation by taking into account the asso-ciated rock mechanics, it did allow for an increase in the effective fracture length. At the sametime, the frictional pressure drop in the fracture brought about by the input fracture conduc-tivity was taken into account.It proved impossible to history match all the injection cycles with one formation permeability.
Separate matches of the 12 cycles showed that in subsequent cycles of CO2 injection the per-meability decreased. This effect is already apparent in Fig. 3. The trend of decreasing per-meability can be explained in relation to the adsorption process of CO2 in coal: the methanewas driven out of the coal by the injected CO2, effectively causing the matrix to swell. In turn,the swelling brought about partial closure of the cleat system and a decrease of the permeability.
2. Attempt to model cycles 2–4 without the presence of a fractu
Fig. re.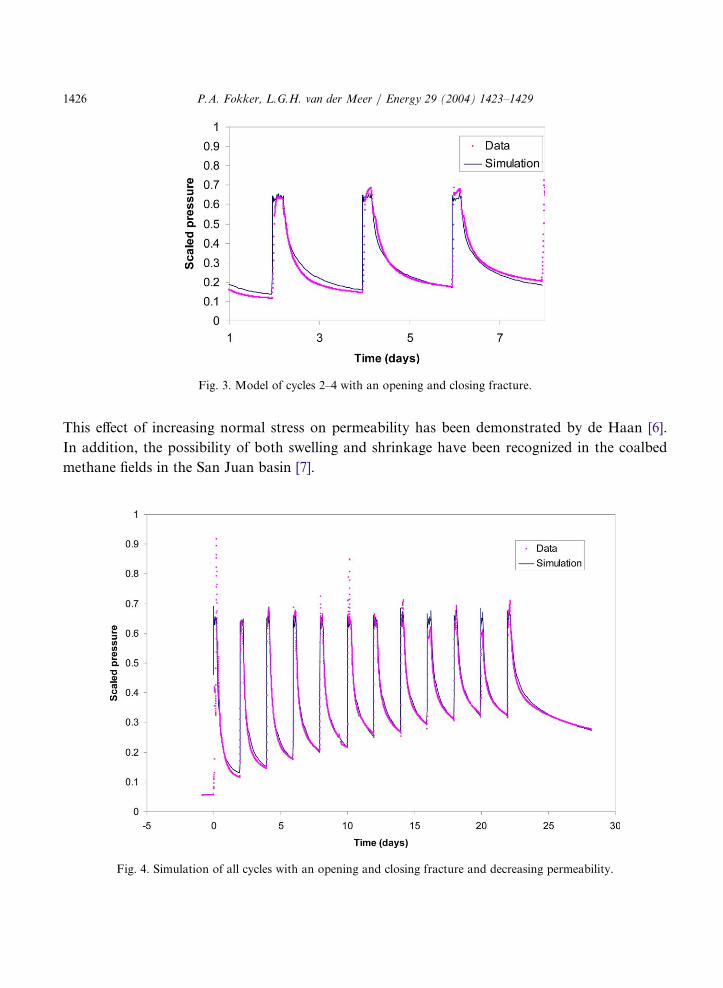
P.A. Fokker, L.G.H. van der Meer / Energy 29 (2004) 1423–14291426
This effect of increasing normal stress on permeability has been demonstrated by de Haan [6].
In addition, the possibility of both swelling and shrinkage have been recognized in the coalbed
methane fields in the San Juan basin [7].
Fig. 3. Model of cycles 2–4 with an opening and closing fracture.
Fig. 4. Simulation of all cycles with an opening and closing fracture and decreasing permeability.
1427P.A. Fokker, L.G.H. van der Meer / Energy 29 (2004) 1423–1429
We built into the program the option to change the permeability over time. Fig. 4 shows ahistory match of all the cycles: the permeability declined steadily, so that by the last injectioncycle it was 4.6 times smaller than the first cycle. Concomitantly, the part of the fracture openduring the injection increased from some 7 m in the first cycle to about 12 m in the last one.(Note that to obtain this match, the injection rate of the 11th cycle had to be decreased by afactor of 0.7. This adjustment is permissible, given the poor data for that cycle. When this cyclewas examined individually, it was difficult to obtain a reasonable match of the pressure declinecurve, and the clear correlation between the injection pressure and the injection rate that wasfound for the other cycles—see Fig. 1—did not hold for cycle 11.) Given the uncertainties in theoperating conditions during the field experiment, the overall history match is very acceptable.
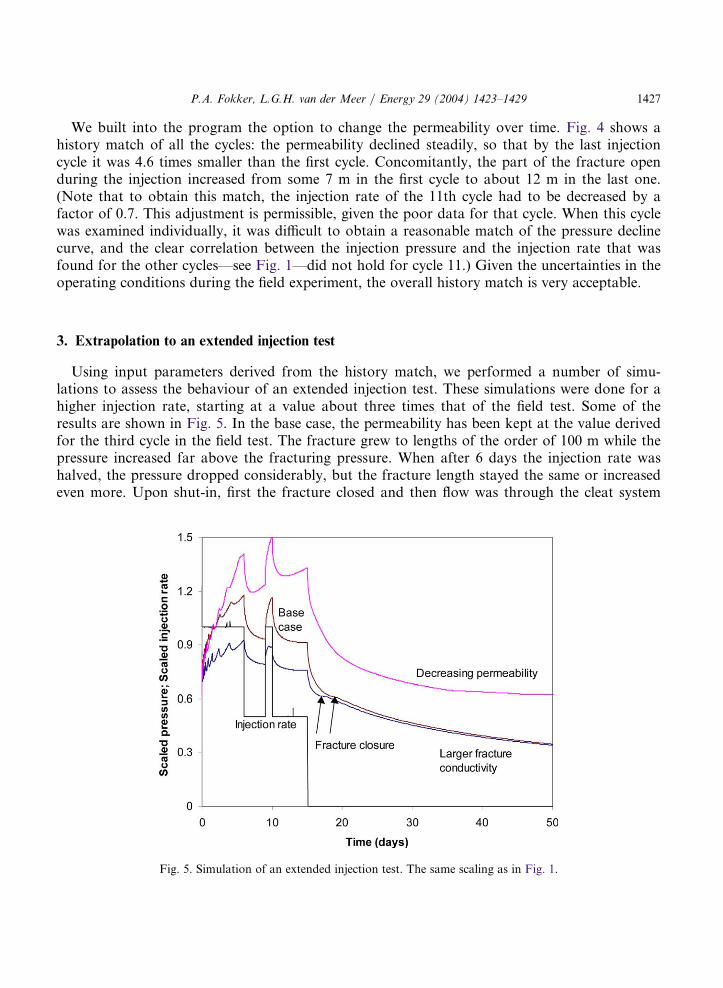
3. Extrapolation to an extended injection test
Using input parameters derived from the history match, we performed a number of simu-lations to assess the behaviour of an extended injection test. These simulations were done for ahigher injection rate, starting at a value about three times that of the field test. Some of theresults are shown in Fig. 5. In the base case, the permeability has been kept at the value derivedfor the third cycle in the field test. The fracture grew to lengths of the order of 100 m while thepressure increased far above the fracturing pressure. When after 6 days the injection rate washalved, the pressure dropped considerably, but the fracture length stayed the same or increasedeven more. Upon shut-in, first the fracture closed and then flow was through the cleat system
Fig. 5. Simulation of an extended injection test. The same scaling as in Fig. 1.
P.A. Fokker, L.G.H. van der Meer / Energy 29 (2004) 1423–14291428
only. The change from the open to the closed fracture is clearly visible in Fig. 5 after about 18.5days, as an abrupt change in slope.Decreasing the value of the permeability during the injection period resulted in an increased
pressure during the test and a slower pressure decline upon well shut-in. Fracture closure wasnot even reached on the scale of the Figure. Increasing the fracture conductivity resulted in thepressure decreasing, and it increased the slope of the pressure decline curve as long as the frac-ture was open. Decreasing the porosity resulted in an increase in injection pressure and a slowerpressure decrease upon shut-in (not shown in Fig. 5).The length of the fractures calculated in this simulation greatly exceeded the height of the
coal seams. The rock mechanics will dictate the amount of vertical fracture propagation. Con-tainment of the fracture within the injection layer is only plausible when a much larger mini-mum stress is encountered in the adjacent layers. Given the amount of increase of the pressureover the fracture pressure, containment is unlikely. A fracture will thus promote communicationbetween the wellbore, the coal and the non-coal layers. Whether this is acceptable must bejudged from the actual situation. It will, for instance, be unacceptable that the fracture wouldcause communication with an aquifer or cause escape of the CO2 to the surface.It was difficult to derive reliable values for the fracture conductivity from the field test
described above, particularly as we knew that the magnitude of this conductivity would bepressure-dependent. To derive reliable values, an injection test like the one shown in Fig. 5would have been required, in which the pressure rose significantly above the hydraulic fractur-ing pressure and in which fracture closure could be observed. Of course, the reservoir simulatoris already a very valuable tool for performing sensitivity analyses.
4. Conclusions and discussion
The field example clearly allowed two conclusions to be drawn. The first is that the injectionin this example took place under fracturing conditions. The opening and closing of the fracture,which was dependent on whether the pressure in the fracture was greater or less than the frac-ture opening pressure, had to be taken into account to obtain a realistic pressure track duringinjection and shut-in. We did not model the actual fracture propagation using the rock mech-anics of the formation, but instead we used an existing fracture which we allowed to open andclose depending on the pressure. This was found to be satisfactory for the present application.The second conclusion is that the continued injection of CO2 in coalbed methane induced a
decrease in the permeability of the cleat system. This effect, which we introduced via trial anderror, merits more detailed study both experimentally and using field tests. Above, we notedthat the reason for the decrease in permeability upon CO2 injection was the total or partial clos-ure of the cleats brought about by the increased normal stress, which in turn originated fromthe swelling of the coal. A proper model of the increased stress should take account not only ofthe local swelling in the grid block under consideration but also of the surrounding reservoir.Indeed, a swelling of the matrix in one location would affect the stress situation at all otherlocations in the reservoir, with the effect diminishing over distance. The theory Biot [8] used toexplain the similar effect of pore pressure on the in situ stress field could be used here as well,instead of the increase in pore pressure we had swelling caused by CO2 adsorption, which affec-
1429P.A. Fokker, L.G.H. van der Meer / Energy 29 (2004) 1423–1429
ted the stress field. The problem of permeability decrease could thus be simplified to that ofdetermining the correlation between permeability and stress. It would not be straightforward toincorporate this in the reservoir simulator, however, since the stress in each block must bedetermined using the pressure in the whole reservoir.Our simulation of an extended injection test with a higher injection rate has shown how sensi-
tive the results are to the formation permeability, the fracture conductivity, and the porosity. Itwould be possible to estimate the formation permeability using field tests like those we analysed;for a reliable estimate of the fracture conductivity, however, injection tests with higher injectionrates would be required, because the pressure must rise significantly above the fracturing press-ure. The fracturing pressure needs to be established using the shut-in period of the well.
References
[1] Gunter WD, Gentzis T, Rottenfuser BA, Richardson RJH. Deep coalbed methane in Alberta, Canada: a fossilresource with the potential of zero greenhouse gas emissions. Energy Conversion Management 1997;38(Suppl):217–22.
[2] van Bergen F, et al. Development of a field experiment of CO2 storage in coal seams in the Upper Silesian Basinof Poland (RECOPOL). Presented at the 6th GHGT, Kyoto, Japan, 1–4 October. 2002.
[3] Stevenson MD, Pinczewski WV, Paterson L, Meaney K. Reservoir simulation of coalbed methane. Presented atthe 1994 Australian Petroleum Explorers Association Conference, Sydney; 1994.
[4] Stevenson MD. Multicomponent gas adsorption on coal at in-situ conditions. PhD thesis, University of NewSouth Wales, Australia, 1997.
[5] Settari A. Modeling of fractures in reservoir simulation. 3rd International Forum on Reservoir Simulation,Baden, Austria. 1990.
[6] De Haan MFE. Delft University of Technology report no. FTA/TG 99.10, 1999.[7] Palmer I, Mansoori J. How permeability depends on stress and pore pressure in coalbeds: a new model. SPE Res-
ervoir Engineering and Evaluation 1998:539.[8] Biot MA. General theory of three-dimensional consolidation. Journal of Applied Physics 1941;12:155–64.