Embed Size (px)
Citation preview

Understanding of Multiphase
Flow for Improved Injectivity
and Trapping 4000.4.641.251.002
Dustin Crandall, URS
PI: Grant Bromhal, NETL ORD
Morgantown, West Virginia
U.S. Department of Energy
National Energy Technology Laboratory
Carbon Storage R&D Project Review Meeting
Developing the Technologies and Building the
Infrastructure for CO2 Storage
August 21-23, 2012

2
Presentation Outline
• Benefit to the program
• Project overview
• Breakdown of FY12 project tasks
• Facilities and personnel
• Task progress to date
• Planned task successes
• Tech transfer and summary
3
Benefit to the Program
• Program goal being addressed – Develop technologies that will support industries’ ability
to predict CO2 storage capacity in geologic formations to within ±30%.
• Project benefits statement – This research project is an examination of pore scale
multiphase flow behavior, in the lab and with micro-scale simulations, to inform key processes of reservoir-scale simulations (e.g. capacity & injectivity prediction, sweep efficiency, storage permanence). This insight contributes to the Carbon Storage Program’s effort of ability to predict CO2 storage capacity in geologic formations to within ±30%.
4
Project Overview: Goals and Objectives
• Numerical modeling, laboratory measurements,
and field samples to focus on the key processes
that will allow more accurate prediction of CO2
capacity, injectivity, sweep efficiency and
storage permanence.
• Objectives for FY12: – Make measurements of key parameters for injectivity, sweep
efficiency, and trapping
– Perform simulations to investigate the effects of parameter
variability
– Develop a framework for understanding “atypical” CO2 migration
Project Tasks for FY12
• Task 2.5.1 - Measurement of pore geometries and residual saturation/relative permeability in cores
• Task 2.5.2 - Immiscible flow scaling relationship
• Task 2.5.3 - Reservoir scale impacts of relative permeabilities and residual saturations on injectivity and capillary trapping
• Task 2.5.4 - Estimation of CO2 losses along leakage pathways between the reservoir and the near-surface
• Task 2.5.5 - CO2 trapping mechanisms in clay materials
5
Project Tasks for FY12
• Task 2.5.1 - Measurement of pore geometries and residual saturation/relative permeability in cores
• Task 2.5.2 - Immiscible flow scaling relationship
• Task 2.5.3 - Reservoir scale impacts of relative permeabilities and residual saturations on injectivity and capillary trapping
• Task 2.5.4 - Estimation of CO2 losses along leakage pathways between the reservoir and the near-surface
• Task 2.5.5 - CO2 trapping mechanisms in clay materials
6

Collaboration Is Key
7
• Team Members/Collaborators:
– Grant Bromhal – NETL-ORD Ale Hakala – NETL-ORD
– Dustin McIntyre – NETL-ORD Christina Lopano – NETL-ORD
– Martin Ferer – ORISE Robert Warzinski – NETL-ORD
– Dustin Crandall - URS Kathy Bruner – URS
– W. Neal Sams – URS Corinne Disenhof – URS
– Shahab Mohaghegh – WVU Igor Haljasmaa – URS
– Donald Gray – WVU Magdalena Gill – URS
– Egemen Ogretim – WVU Yongkoo Seol – NETL-ORD
– Jeong Choi – ORISE Ken Jordan – Pitt
– Eugene Myshakin – ORISE Dan Mareno - WVU
– Vinod Kumar – UTEP Paul Delgado – UTEP
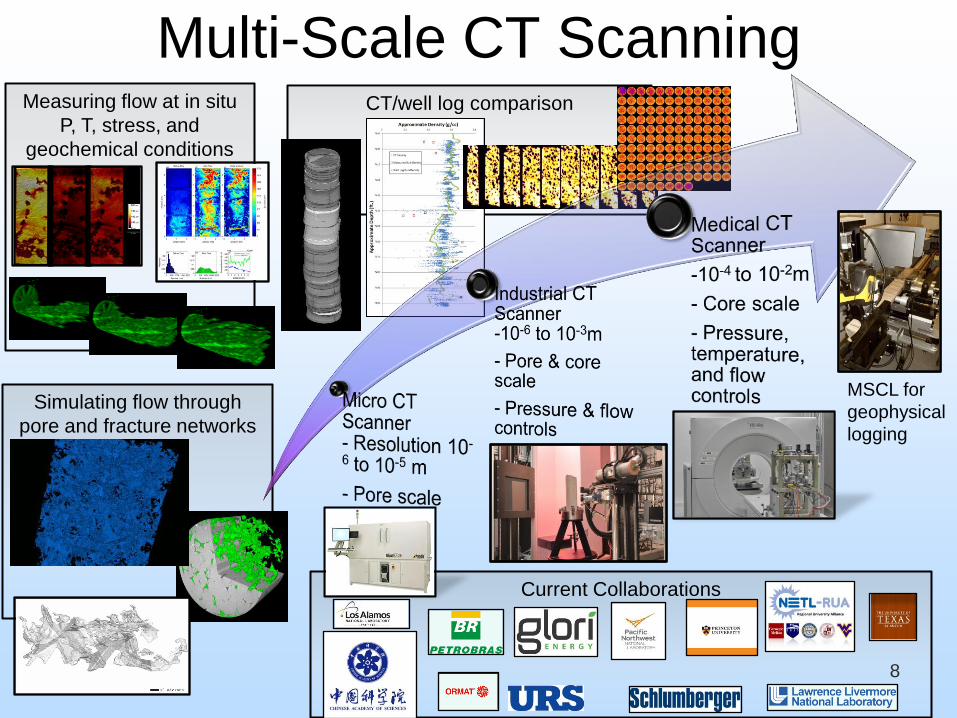
Multi-Scale CT Scanning
8
Simulating flow through
pore and fracture networks
Measuring flow at in situ
P, T, stress, and
geochemical conditions
CT/well log comparison
Current Collaborations
MSCL for
geophysical
logging
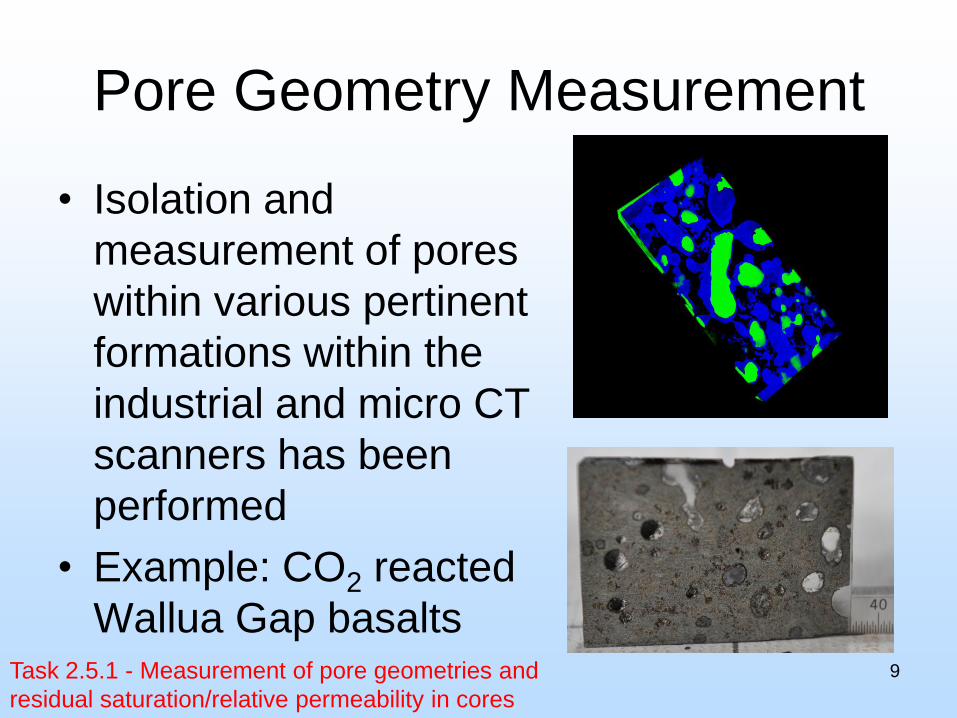
Pore Geometry Measurement
• Isolation and
measurement of pores
within various pertinent
formations within the
industrial and micro CT
scanners has been
performed
• Example: CO2 reacted
Wallua Gap basalts 9 Task 2.5.1 - Measurement of pore geometries and
residual saturation/relative permeability in cores
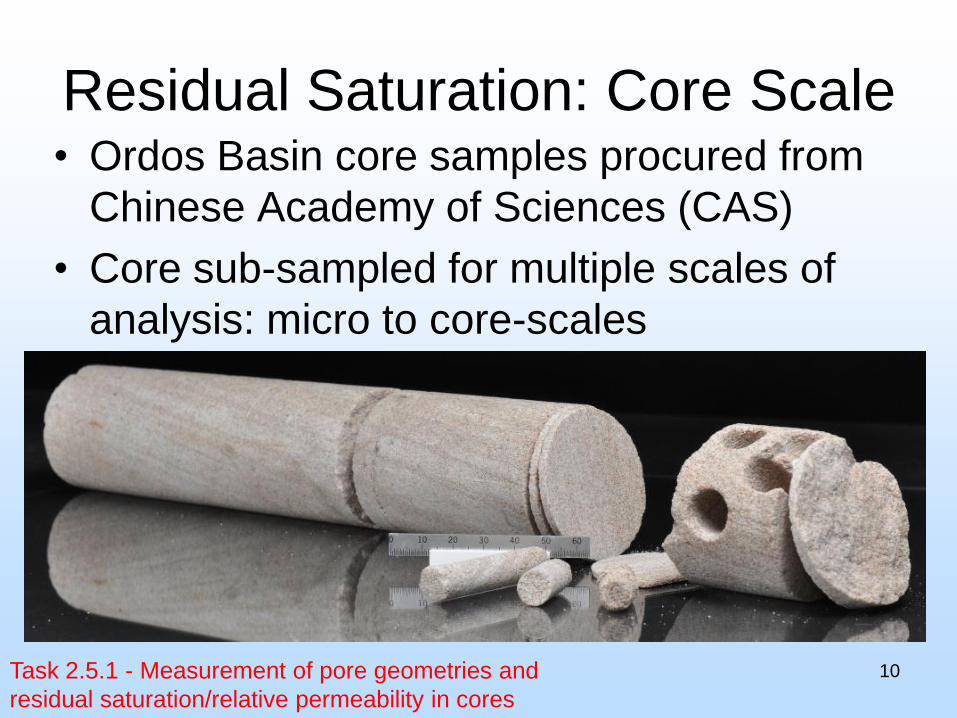
Residual Saturation: Core Scale
10 Task 2.5.1 - Measurement of pore geometries and
residual saturation/relative permeability in cores
• Ordos Basin core samples procured from
Chinese Academy of Sciences (CAS)
• Core sub-sampled for multiple scales of
analysis: micro to core-scales
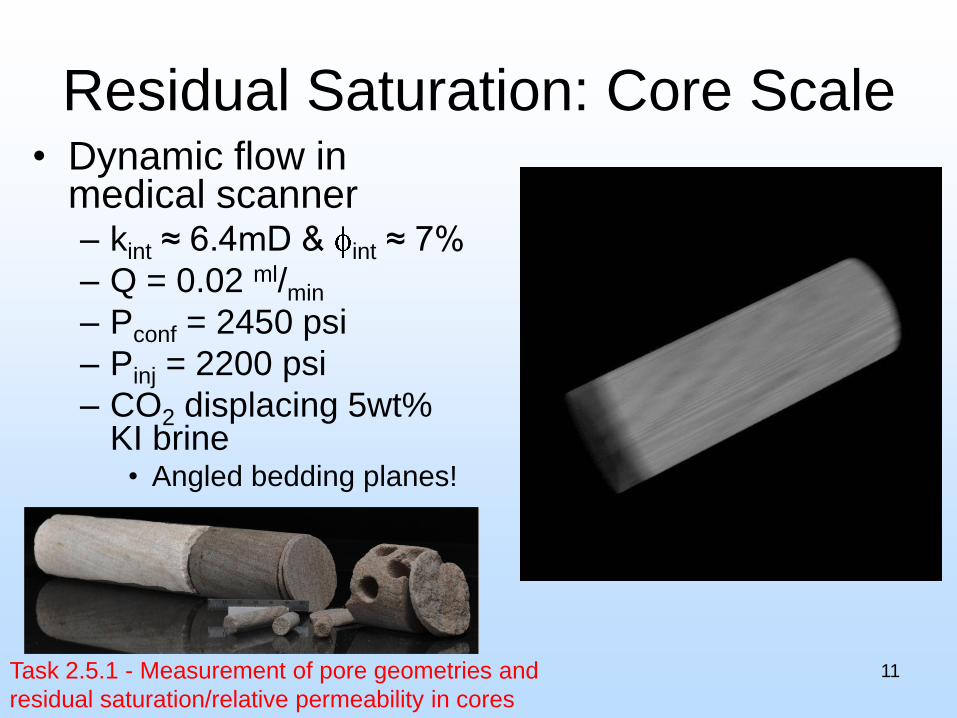
Residual Saturation: Core Scale
11 Task 2.5.1 - Measurement of pore geometries and
residual saturation/relative permeability in cores
• Dynamic flow in medical scanner – kint ≈ 6.4mD & int ≈ 7%
– Q = 0.02 ml/min
– Pconf = 2450 psi
– Pinj = 2200 psi
– CO2 displacing 5wt% KI brine
• Angled bedding planes!
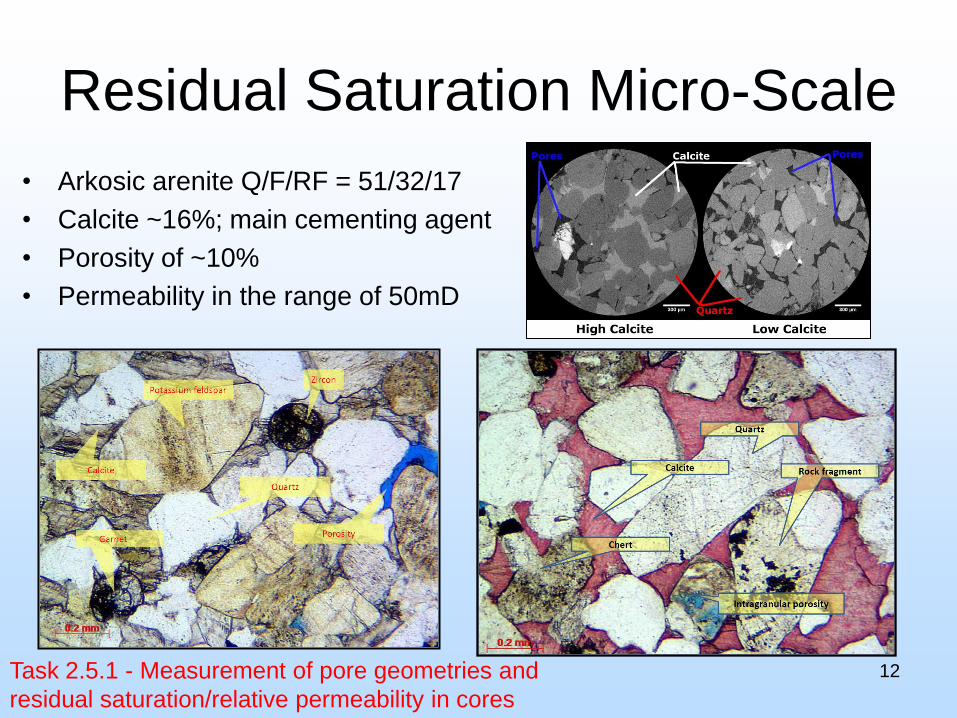
Residual Saturation Micro-Scale
12 Task 2.5.1 - Measurement of pore geometries and
residual saturation/relative permeability in cores
• Arkosic arenite Q/F/RF = 51/32/17
• Calcite ~16%; main cementing agent
• Porosity of ~10%
• Permeability in the range of 50mD
Immiscible flow relationship
13 Task 2.5.2 - Immiscible flow scaling relationship
• Pore-scale simulation of two-phase flow for the purpose of being able to generate relative permeability “data” without needing large numbers of experiments
• Multiple techniques have been used for multiphase flow simulations in pore scale
• Lattice Boltzmann
• Navier-Stokes with Volume-of-Fluid
• Pore-Network modeling
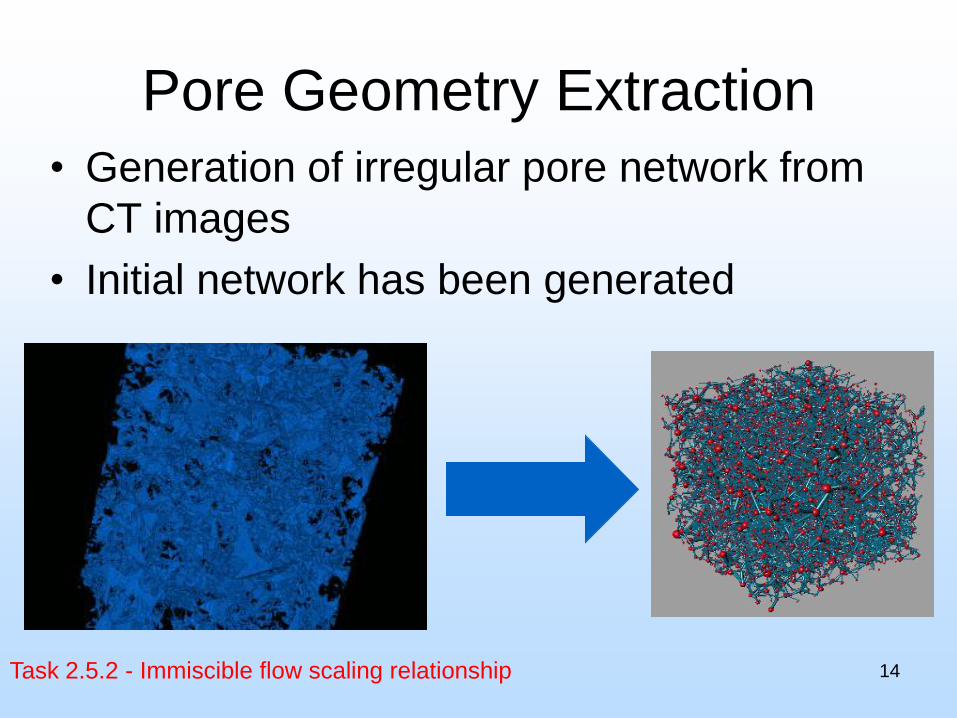
Pore Geometry Extraction
14 Task 2.5.2 - Immiscible flow scaling relationship
• Generation of irregular pore network from
CT images
• Initial network has been generated
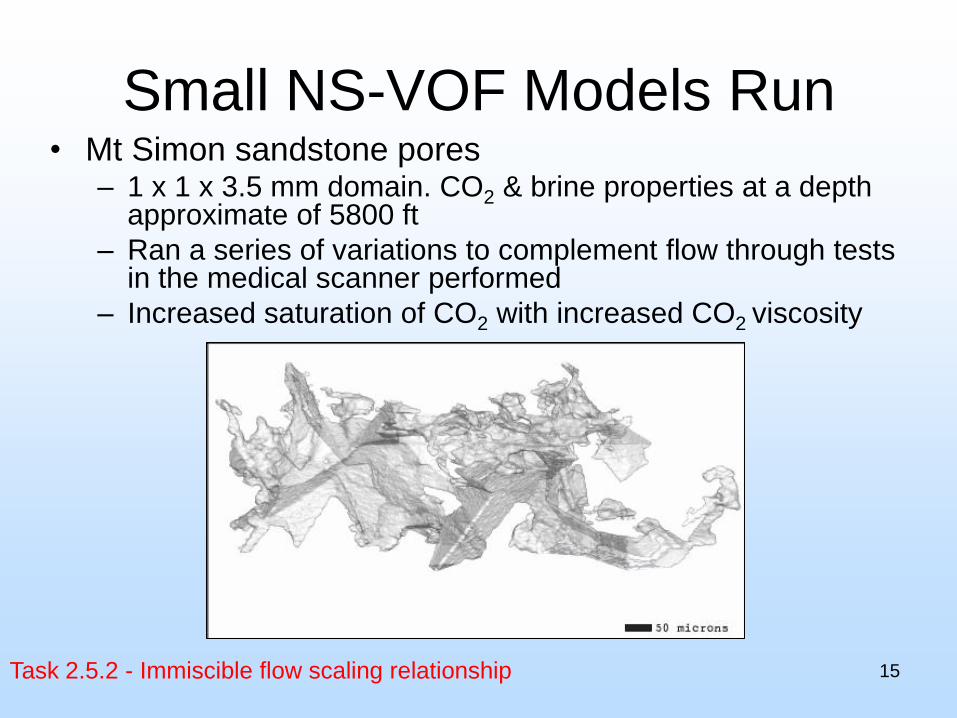
Small NS-VOF Models Run
15 Task 2.5.2 - Immiscible flow scaling relationship
• Mt Simon sandstone pores – 1 x 1 x 3.5 mm domain. CO2 & brine properties at a depth
approximate of 5800 ft
– Ran a series of variations to complement flow through tests in the medical scanner performed
– Increased saturation of CO2 with increased CO2 viscosity
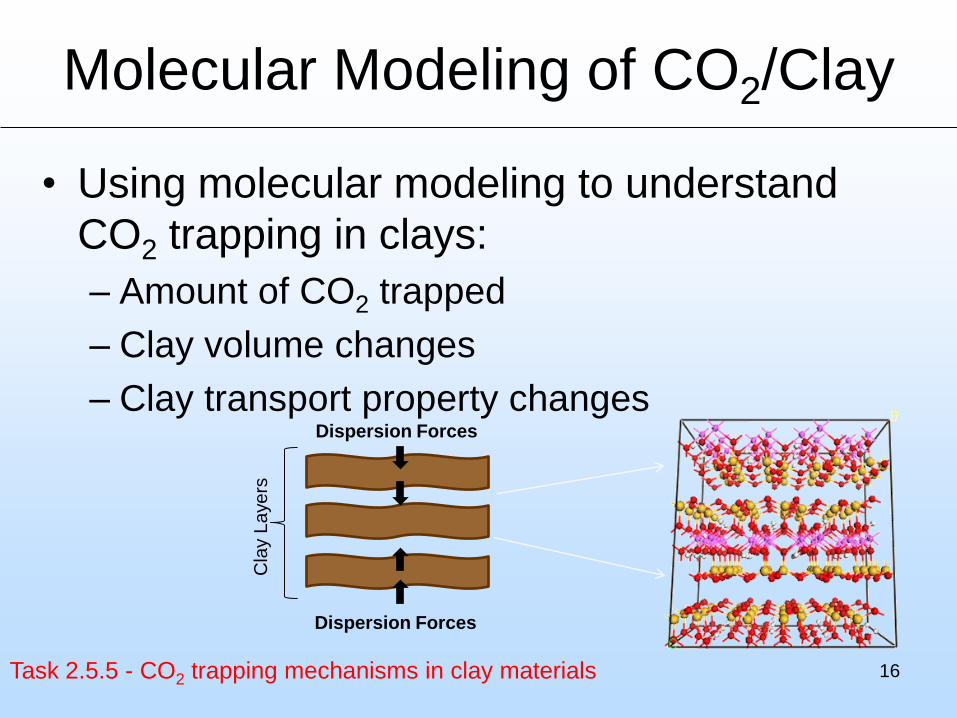
Molecular Modeling of CO2/Clay
16 Task 2.5.5 - CO2 trapping mechanisms in clay materials
• Using molecular modeling to understand
CO2 trapping in clays:
– Amount of CO2 trapped
– Clay volume changes
– Clay transport property changes
Cla
y L
aye
rs
Dispersion Forces
Dispersion Forces
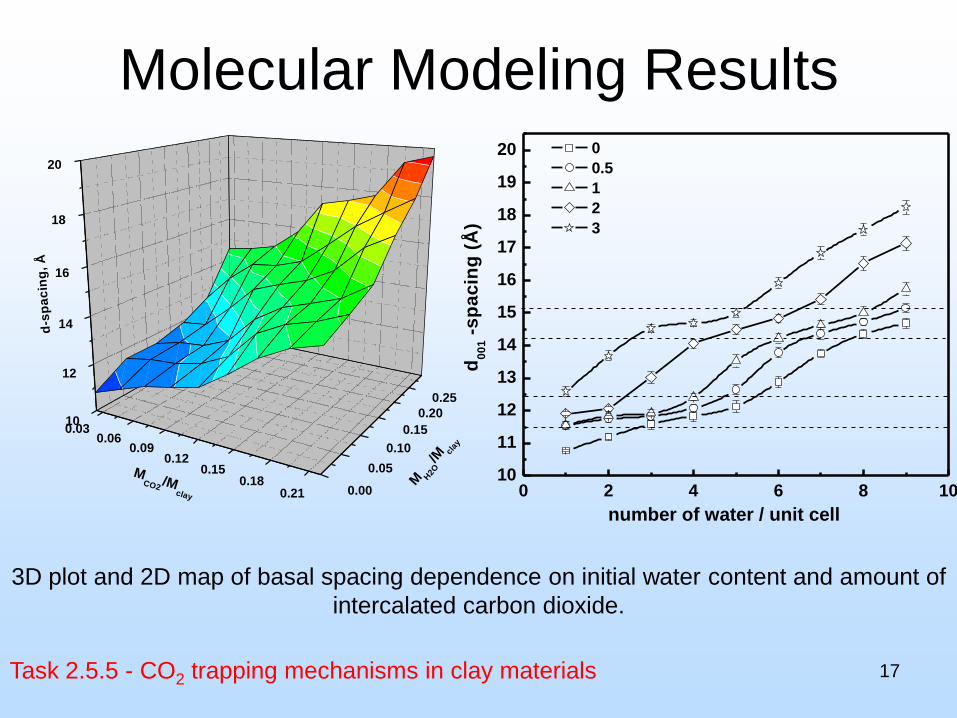
Molecular Modeling Results
17 Task 2.5.5 - CO2 trapping mechanisms in clay materials
3D plot and 2D map of basal spacing dependence on initial water content and amount of
intercalated carbon dioxide.
0.030.06
0.090.12
0.150.18
0.21
10
12
14
16
18
20
0.00
0.05
0.10
0.15
0.20
0.25
d-s
pa
cin
g,
Å
M H2O
/Mcl
ay
MCO2
/Mclay 0 2 4 6 8 10
10
11
12
13
14
15
16
17
18
19
20
d
00
1 -
sp
ac
ing
(Å
)
0
0.5
1
2
3
number of water / unit cell
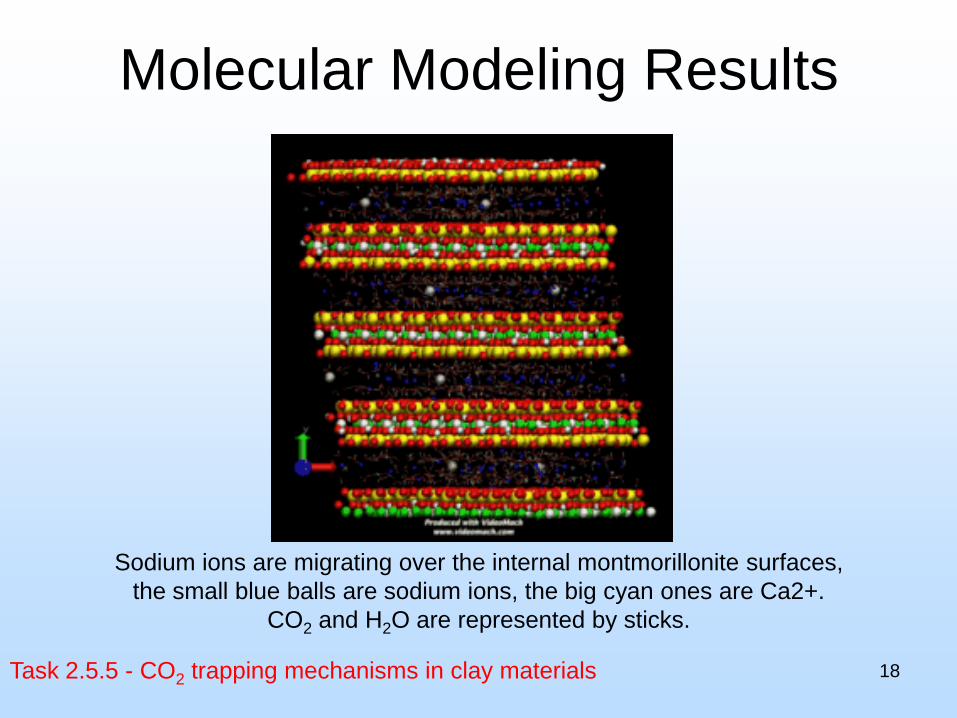
Molecular Modeling Results
18 Task 2.5.5 - CO2 trapping mechanisms in clay materials
Sodium ions are migrating over the internal montmorillonite surfaces,
the small blue balls are sodium ions, the big cyan ones are Ca2+.
CO2 and H2O are represented by sticks.
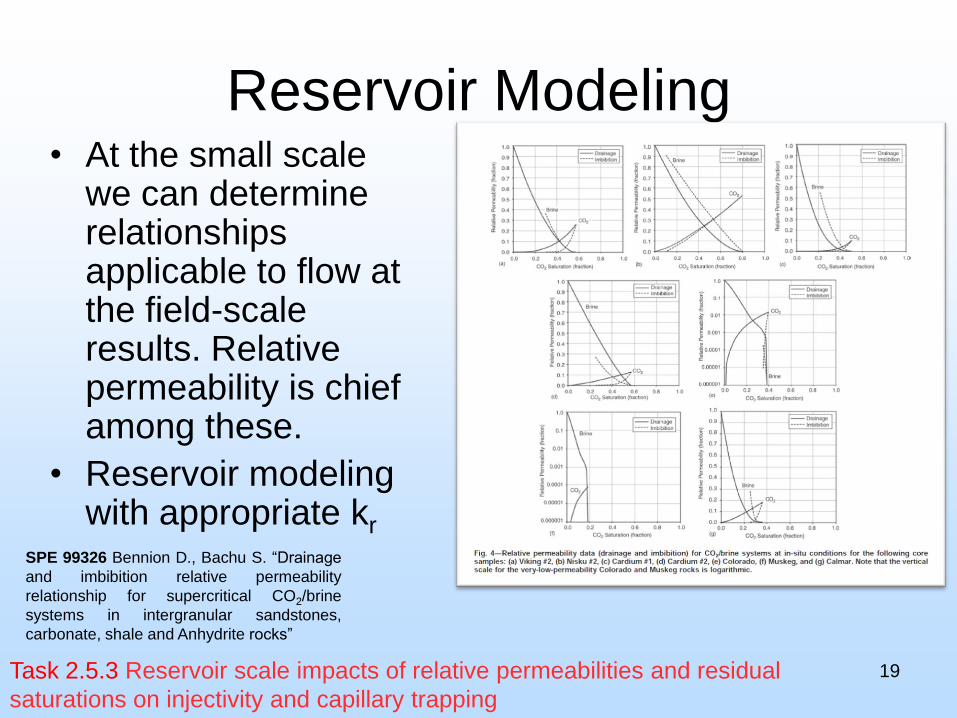
Reservoir Modeling
19 Task 2.5.3 Reservoir scale impacts of relative permeabilities and residual
saturations on injectivity and capillary trapping
• At the small scale we can determine relationships applicable to flow at the field-scale results. Relative permeability is chief among these.
• Reservoir modeling with appropriate kr
SPE 99326 Bennion D., Bachu S. “Drainage
and imbibition relative permeability
relationship for supercritical CO2/brine
systems in intergranular sandstones,
carbonate, shale and Anhydrite rocks”
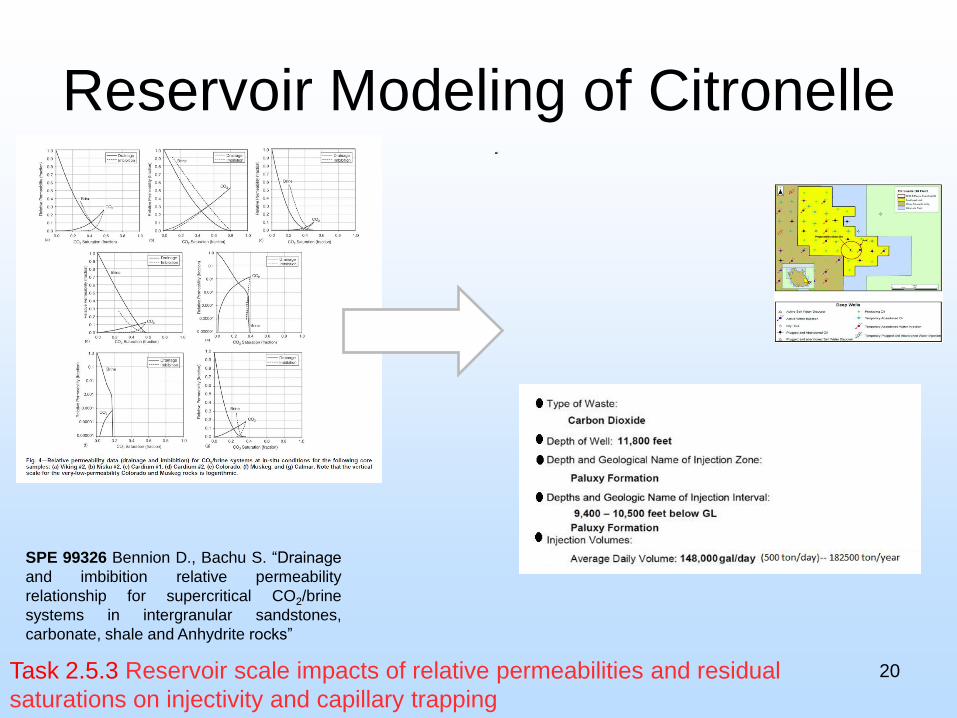
Reservoir Modeling of Citronelle
20 Task 2.5.3 Reservoir scale impacts of relative permeabilities and residual
saturations on injectivity and capillary trapping
SPE 99326 Bennion D., Bachu S. “Drainage
and imbibition relative permeability
relationship for supercritical CO2/brine
systems in intergranular sandstones,
carbonate, shale and Anhydrite rocks”
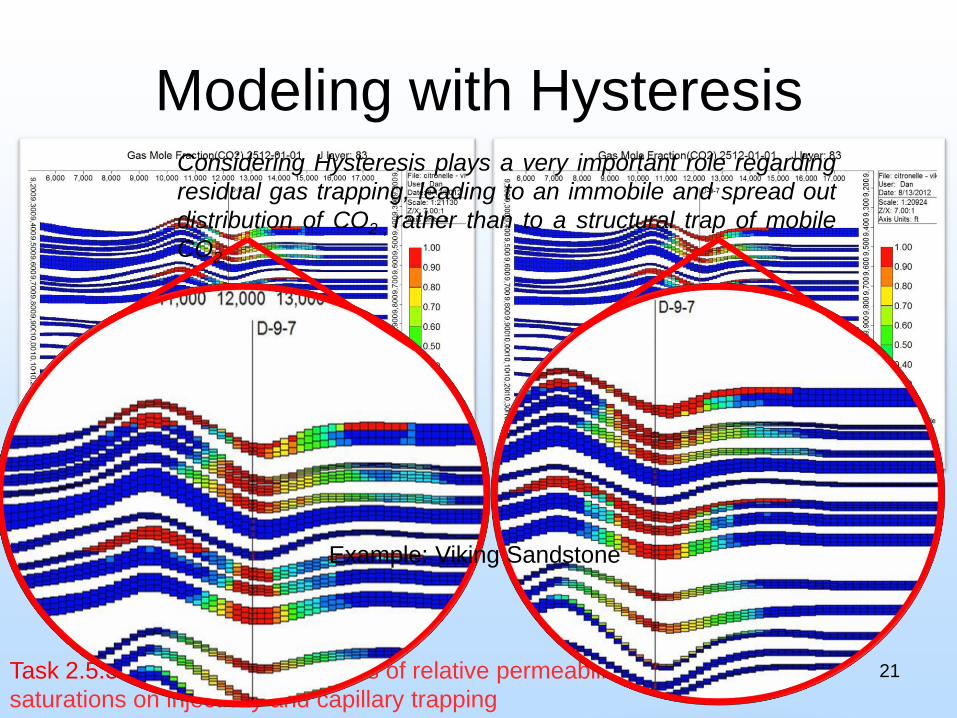
Modeling with Hysteresis
21 Task 2.5.3 Reservoir scale impacts of relative permeabilities and residual
saturations on injectivity and capillary trapping
With Hysteresis
With out Hysteresis
Considering Hysteresis plays a very important role regarding
residual gas trapping, leading to an immobile and spread out
distribution of CO2 , rather than to a structural trap of mobile
CO2.
Example: Viking Sandstone
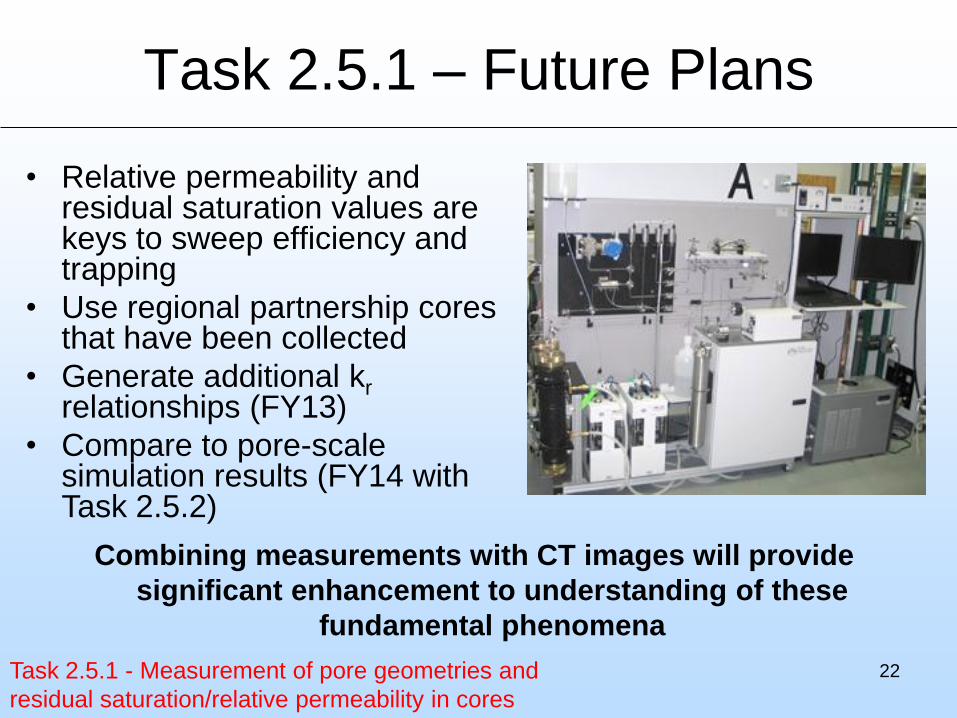
Task 2.5.1 – Future Plans
22
• Relative permeability and residual saturation values are keys to sweep efficiency and trapping
• Use regional partnership cores that have been collected
• Generate additional kr relationships (FY13)
• Compare to pore-scale simulation results (FY14 with Task 2.5.2)
Combining measurements with CT images will provide
significant enhancement to understanding of these
fundamental phenomena
Task 2.5.1 - Measurement of pore geometries and
residual saturation/relative permeability in cores
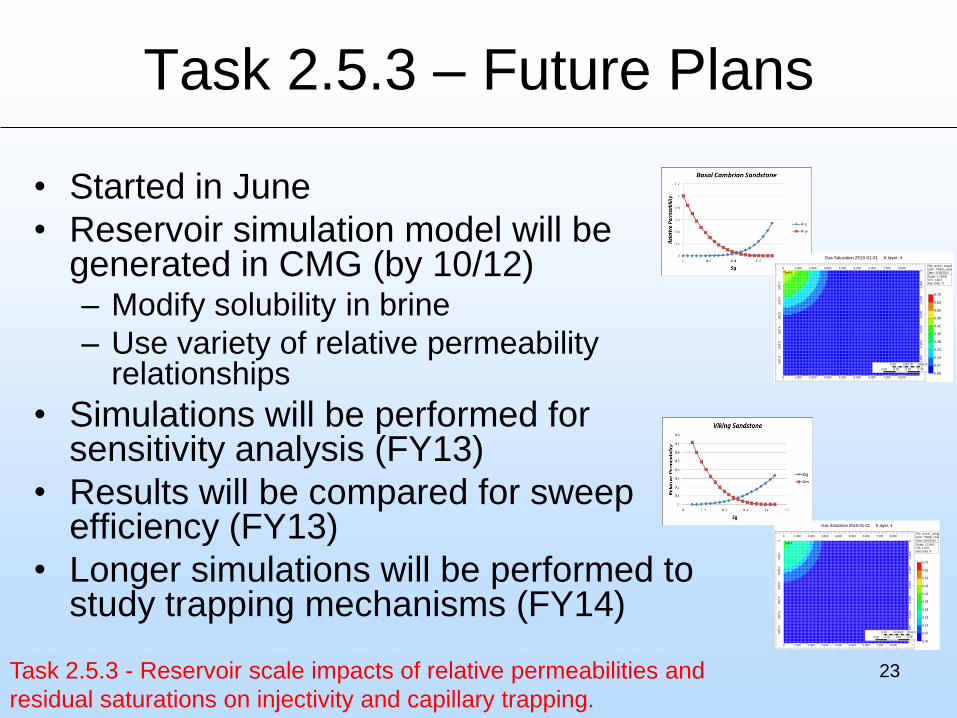
Task 2.5.3 – Future Plans
23
• Started in June
• Reservoir simulation model will be generated in CMG (by 10/12) – Modify solubility in brine
– Use variety of relative permeability relationships
• Simulations will be performed for sensitivity analysis (FY13)
• Results will be compared for sweep efficiency (FY13)
• Longer simulations will be performed to study trapping mechanisms (FY14)
Task 2.5.3 - Reservoir scale impacts of relative permeabilities and
residual saturations on injectivity and capillary trapping.
well-1
0 1,000 2,000 3,000 4,000 5,000 6,000 7,000 8,000
0 1,000 2,000 3,000 4,000 5,000 6,000 7,000 8,000
-6,0
00
-5,0
00
-4,0
00
-3,0
00
-2,0
00
-1,0
00
-6,0
00
-5,0
00
-4,0
00
-3,0
00
-2,0
00
-1,0
00
0
0.00 1020.00 2040.00 feet
0.00 0.25 0.50 0.75 1.00 km
File: urs147_basal cambrian.irfUser: PNGE_UserDate: 5/29/2012
Scale: 1:15930Y/X: 1.00:1Axis Units: ft
0.00
0.07
0.14
0.21
0.28
0.35
0.42
0.49
0.56
0.63
0.70
Gas Saturation 2510-01-01 K layer: 4
well-1
0 1,000 2,000 3,000 4,000 5,000 6,000 7,000 8,000
0 1,000 2,000 3,000 4,000 5,000 6,000 7,000 8,000
-6,0
00
-5,0
00
-4,0
00
-3,0
00
-2,0
00
-1,0
00
0
-6,0
00
-5,0
00
-4,0
00
-3,0
00
-2,0
00
-1,0
00
0
0.00 1020.00 2040.00 feet
0.00 0.25 0.50 0.75 1.00 km
File: urs147_viking sandstone.irfUser: PNGE_UserDate: 5/29/2012
Scale: 1:15942Y/X: 1.00:1Axis Units: ft
0.00
0.07
0.14
0.21
0.28
0.35
0.42
0.49
0.56
0.63
0.70
Gas Saturation 2510-01-01 K layer: 4
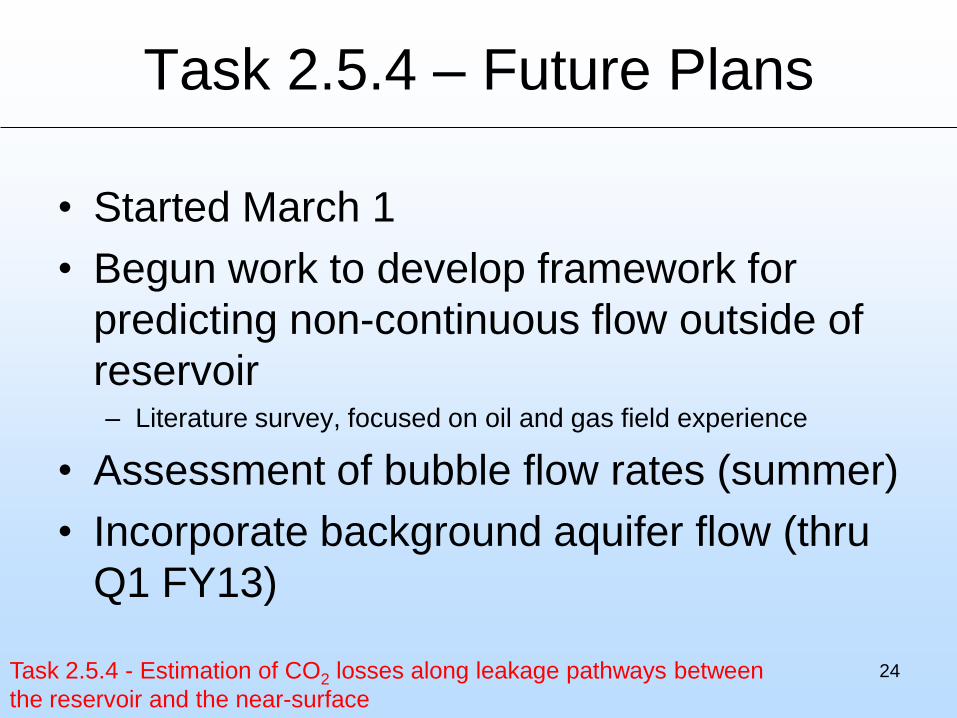
Task 2.5.4 – Future Plans
24
• Started March 1
• Begun work to develop framework for
predicting non-continuous flow outside of
reservoir – Literature survey, focused on oil and gas field experience
• Assessment of bubble flow rates (summer)
• Incorporate background aquifer flow (thru
Q1 FY13)
Task 2.5.4 - Estimation of CO2 losses along leakage pathways between
the reservoir and the near-surface
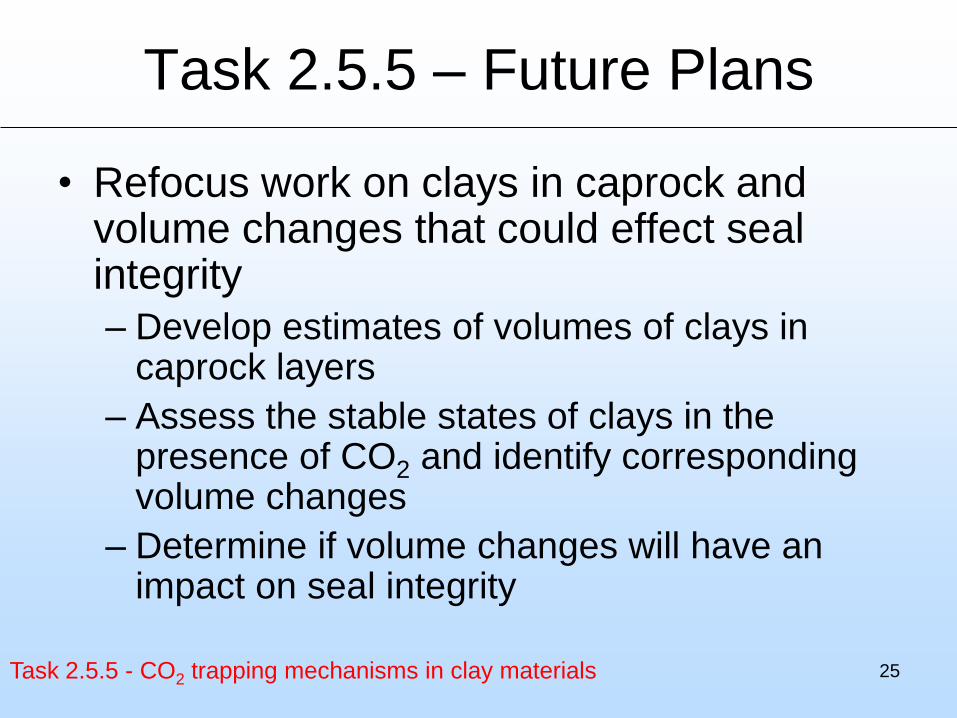
Task 2.5.5 – Future Plans
25
• Refocus work on clays in caprock and volume changes that could effect seal integrity
– Develop estimates of volumes of clays in caprock layers
– Assess the stable states of clays in the presence of CO2 and identify corresponding volume changes
– Determine if volume changes will have an impact on seal integrity
Task 2.5.5 - CO2 trapping mechanisms in clay materials
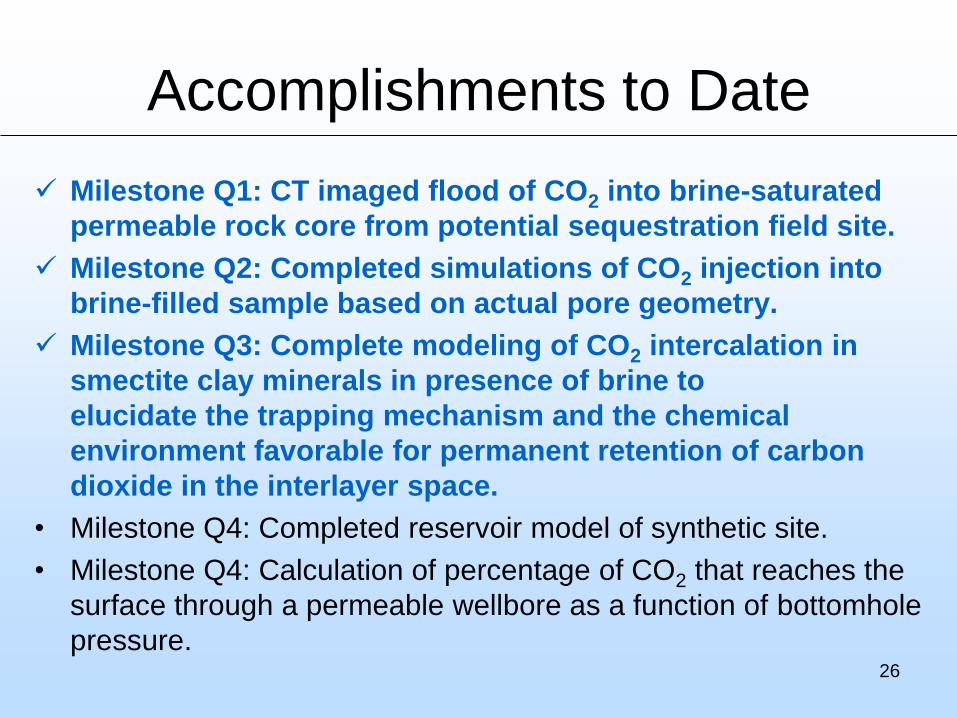
Accomplishments to Date
26
Milestone Q1: CT imaged flood of CO2 into brine-saturated
permeable rock core from potential sequestration field site.
Milestone Q2: Completed simulations of CO2 injection into
brine-filled sample based on actual pore geometry.
Milestone Q3: Complete modeling of CO2 intercalation in
smectite clay minerals in presence of brine to
elucidate the trapping mechanism and the chemical
environment favorable for permanent retention of carbon
dioxide in the interlayer space.
• Milestone Q4: Completed reservoir model of synthetic site.
• Milestone Q4: Calculation of percentage of CO2 that reaches the
surface through a permeable wellbore as a function of bottomhole
pressure.
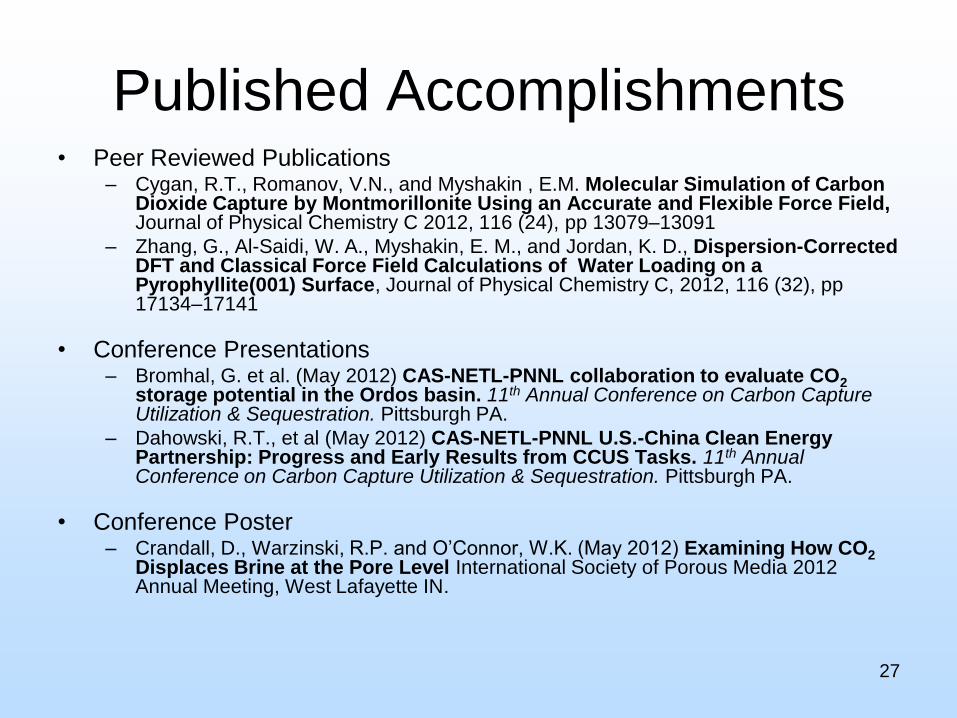
Published Accomplishments • Peer Reviewed Publications
– Cygan, R.T., Romanov, V.N., and Myshakin , E.M. Molecular Simulation of Carbon Dioxide Capture by Montmorillonite Using an Accurate and Flexible Force Field, Journal of Physical Chemistry C 2012, 116 (24), pp 13079–13091
– Zhang, G., Al-Saidi, W. A., Myshakin, E. M., and Jordan, K. D., Dispersion-Corrected DFT and Classical Force Field Calculations of Water Loading on a Pyrophyllite(001) Surface, Journal of Physical Chemistry C, 2012, 116 (32), pp 17134–17141
• Conference Presentations – Bromhal, G. et al. (May 2012) CAS-NETL-PNNL collaboration to evaluate CO2
storage potential in the Ordos basin. 11th Annual Conference on Carbon Capture Utilization & Sequestration. Pittsburgh PA.
– Dahowski, R.T., et al (May 2012) CAS-NETL-PNNL U.S.-China Clean Energy Partnership: Progress and Early Results from CCUS Tasks. 11th Annual Conference on Carbon Capture Utilization & Sequestration. Pittsburgh PA.
• Conference Poster – Crandall, D., Warzinski, R.P. and O’Connor, W.K. (May 2012) Examining How CO2
Displaces Brine at the Pore Level International Society of Porous Media 2012 Annual Meeting, West Lafayette IN.
27
Summary
– Key Findings
• We are able to view experimental multiphase flows on
multiple scales to isolate pertinent relationships
• Simulations at the small-scale are in good agreement
with the experiments to date
• Shale swelling is likely to have little effect on reservoir
behavior for reservoirs with small volumes of clay, but
it may have an effect on seals
– Lessons Learned
• Involving simulation in experimental planning and
vice-versa at the earliest possible times improves
efficiency and effectiveness
28
Thank you
29
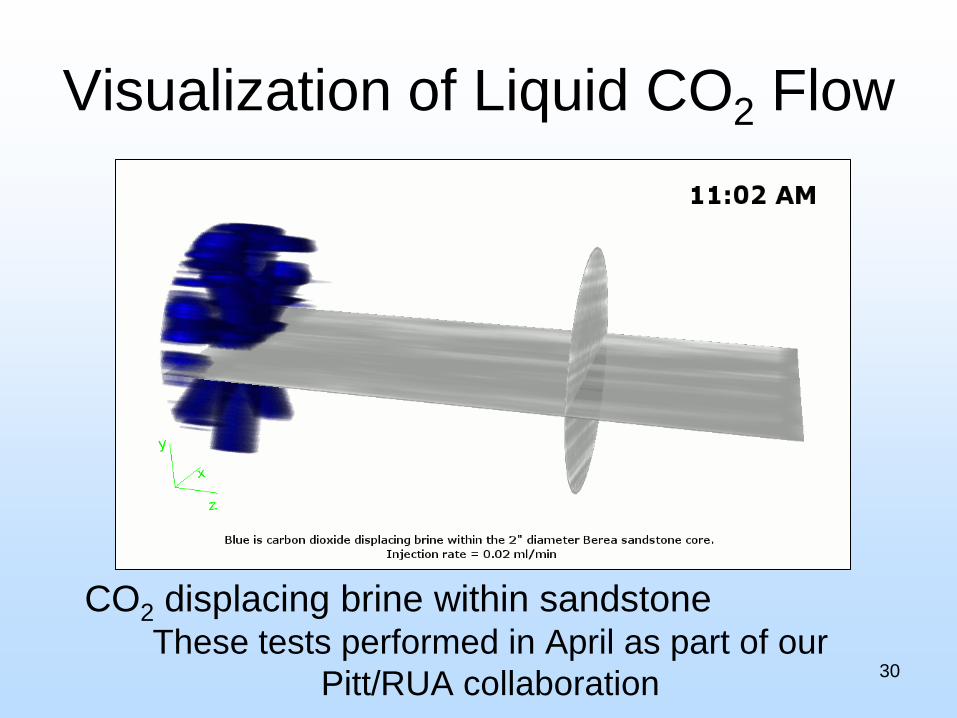
Visualization of Liquid CO2 Flow
30
CO2 displacing brine within sandstone These tests performed in April as part of our
Pitt/RUA collaboration


![arXiv:math/0612069v1 [math.DG] 3 Dec 2006bounded injectivity radii at the marked points. By imposing an injectivity radius condition, he rescaled the solution to show that each singularity](https://img.pdfslide.us/doc/110x75/612080ace3a1697fdf4b1ba4/arxivmath0612069v1-mathdg-3-dec-bounded-injectivity-radii-at-the-marked-points.jpg)
![MTW condition vs. convexity of injectivity domainsrifford/Papiers_en_ligne/Talk_Bonnard60.pdf · x;v: [0;1] !M is the unique geodesic starting at x with speed v. We call injectivity](https://img.pdfslide.us/doc/110x75/5f715d2d4b0cf06993548c24/mtw-condition-vs-convexity-of-injectivity-domains-riffordpapiersenlignetalk.jpg)