Embed Size (px)
Citation preview
The importance of quantitative strategies in the current investment landscape
Marco Avellaneda
Courant Institute, NYU
Finance Concepts
Quant Invest, New York , December 8 2011
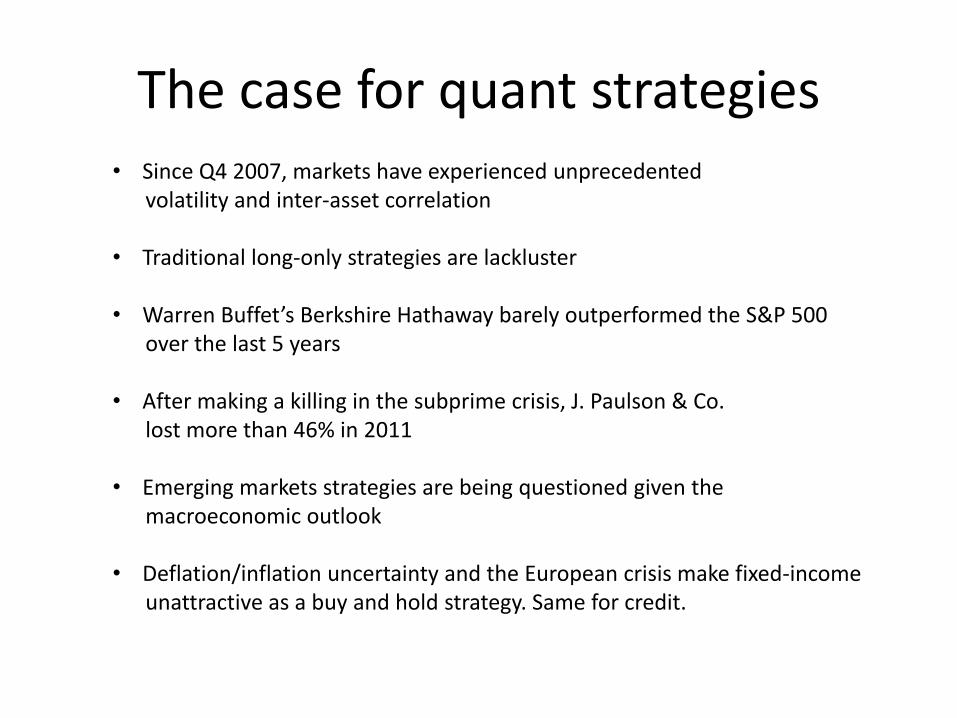
The case for quant strategies • Since Q4 2007, markets have experienced unprecedented volatility and inter-asset correlation • Traditional long-only strategies are lackluster • Warren Buffet’s Berkshire Hathaway barely outperformed the S&P 500 over the last 5 years • After making a killing in the subprime crisis, J. Paulson & Co. lost more than 46% in 2011 • Emerging markets strategies are being questioned given the macroeconomic outlook • Deflation/inflation uncertainty and the European crisis make fixed-income unattractive as a buy and hold strategy. Same for credit.
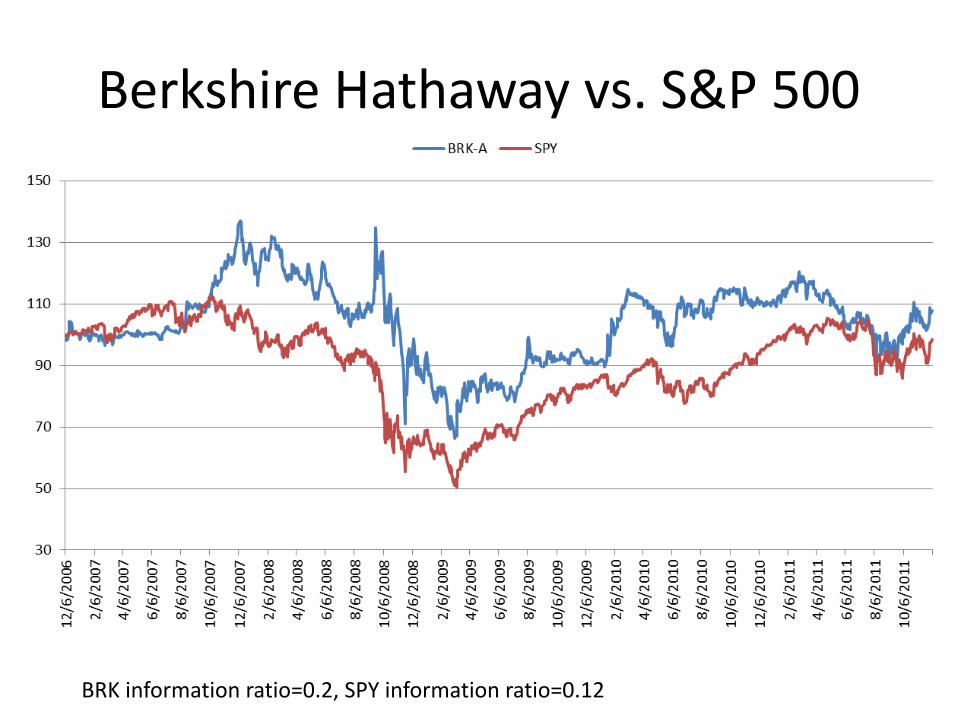
Berkshire Hathaway vs. S&P 500
BRK information ratio=0.2, SPY information ratio=0.12
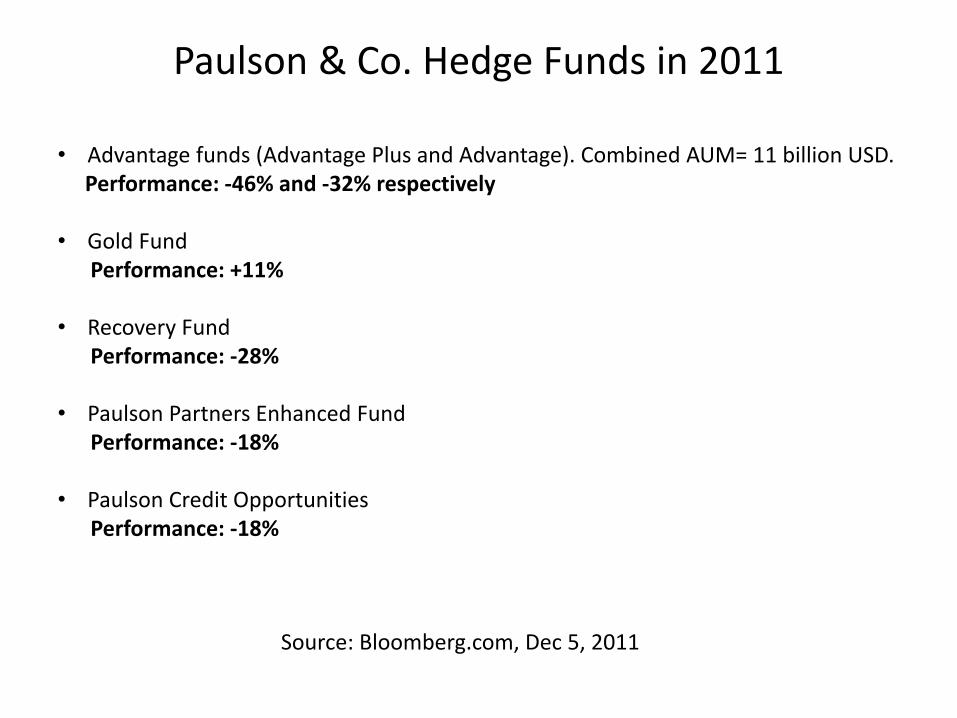
Paulson & Co. Hedge Funds in 2011
• Advantage funds (Advantage Plus and Advantage). Combined AUM= 11 billion USD. Performance: -46% and -32% respectively
• Gold Fund Performance: +11%
• Recovery Fund Performance: -28%
• Paulson Partners Enhanced Fund Performance: -18%
• Paulson Credit Opportunities Performance: -18%
Source: Bloomberg.com, Dec 5, 2011
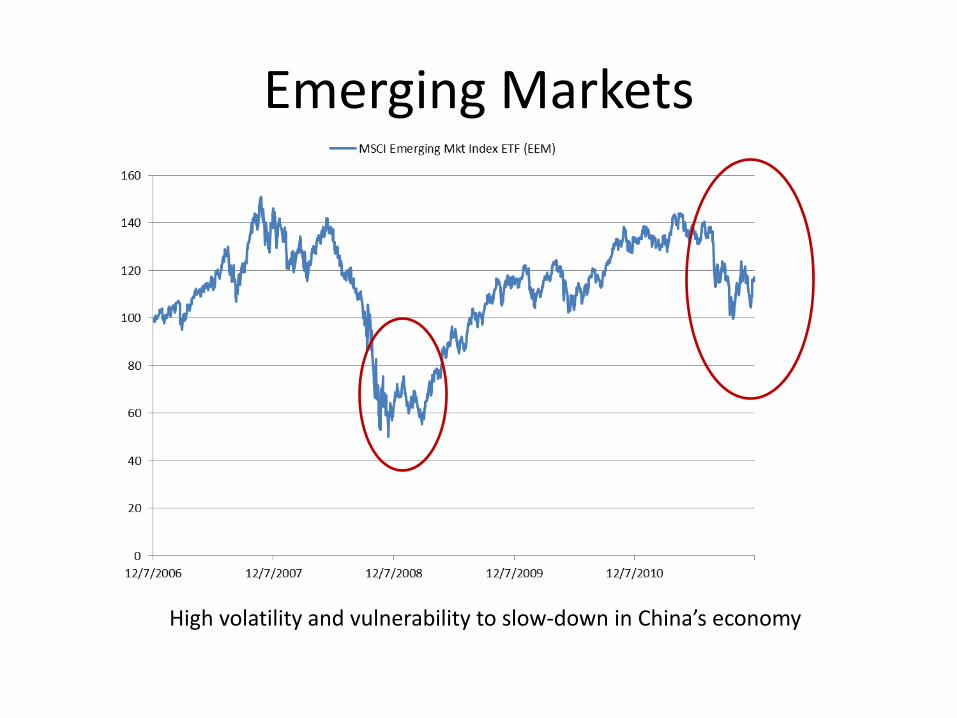
Emerging Markets
High volatility and vulnerability to slow-down in China’s economy
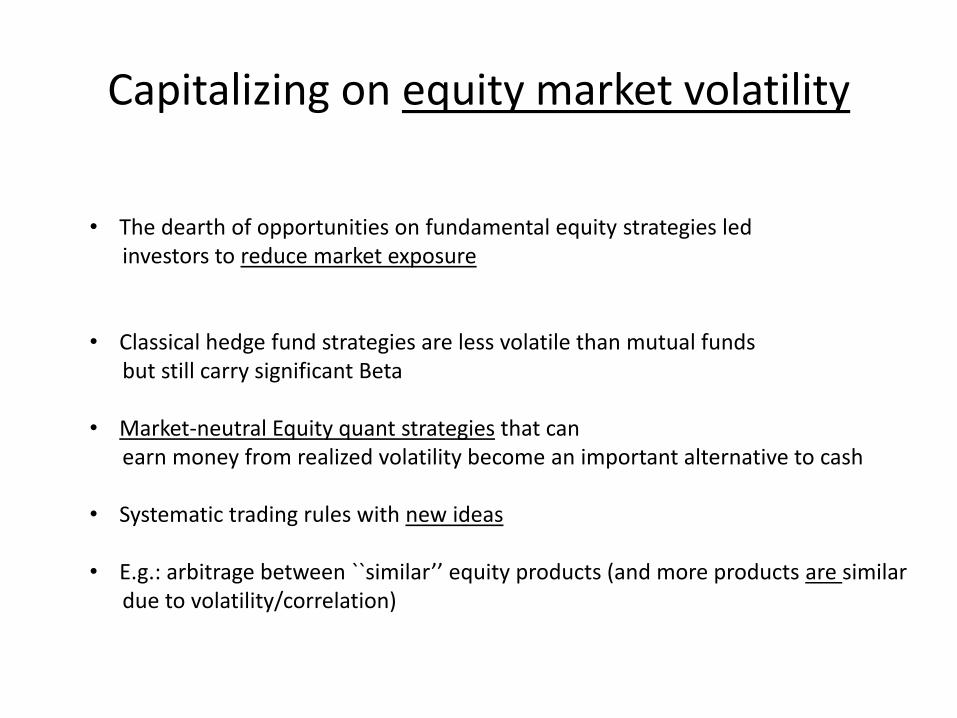
Capitalizing on equity market volatility
• The dearth of opportunities on fundamental equity strategies led investors to reduce market exposure • Classical hedge fund strategies are less volatile than mutual funds but still carry significant Beta • Market-neutral Equity quant strategies that can earn money from realized volatility become an important alternative to cash • Systematic trading rules with new ideas
• E.g.: arbitrage between ``similar’’ equity products (and more products are similar due to volatility/correlation)
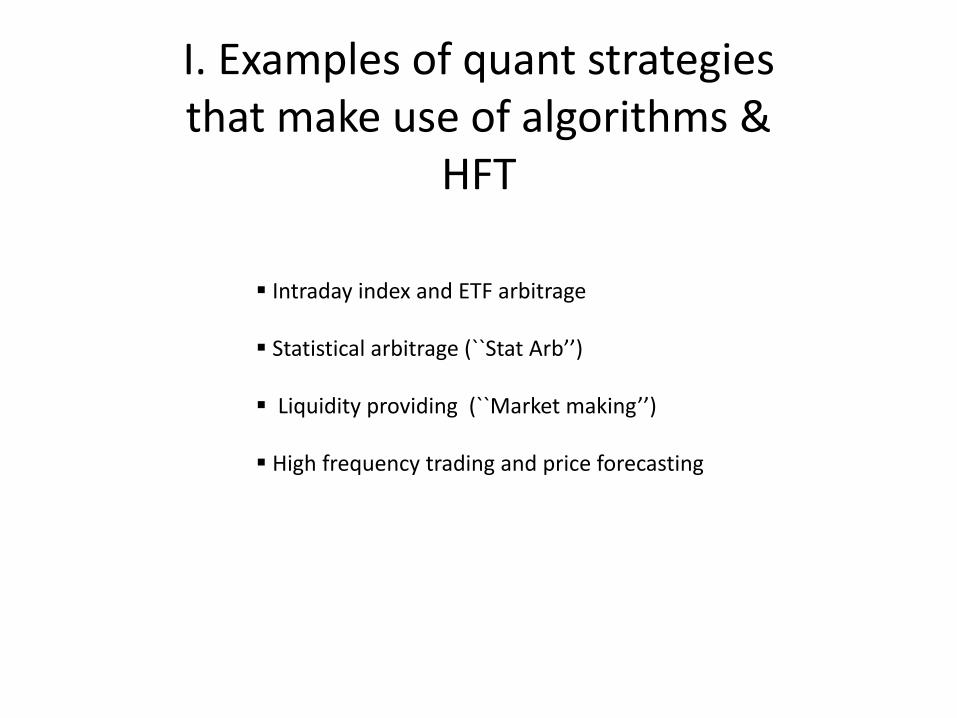
I. Examples of quant strategies that make use of algorithms &
HFT
Intraday index and ETF arbitrage
Statistical arbitrage (``Stat Arb’’)
Liquidity providing (``Market making’’) High frequency trading and price forecasting
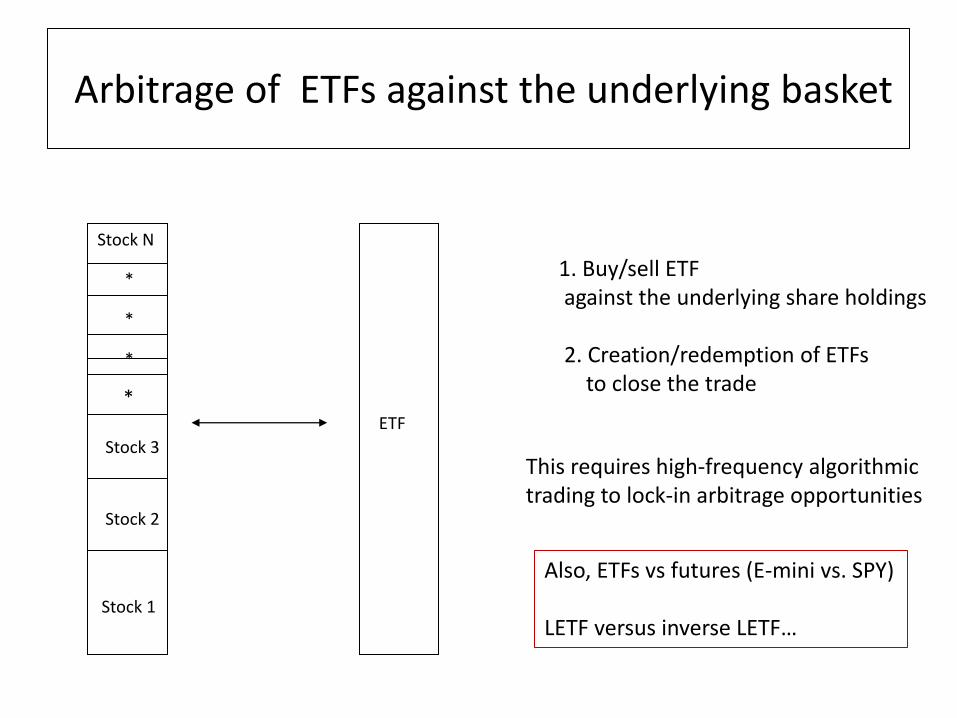
Arbitrage of ETFs against the underlying basket
Stock 1
ETF
Stock N
Stock 3
Stock 2
*
*
*
*
1. Buy/sell ETF against the underlying share holdings 2. Creation/redemption of ETFs to close the trade
This requires high-frequency algorithmic trading to lock-in arbitrage opportunities
Also, ETFs vs futures (E-mini vs. SPY) LETF versus inverse LETF…
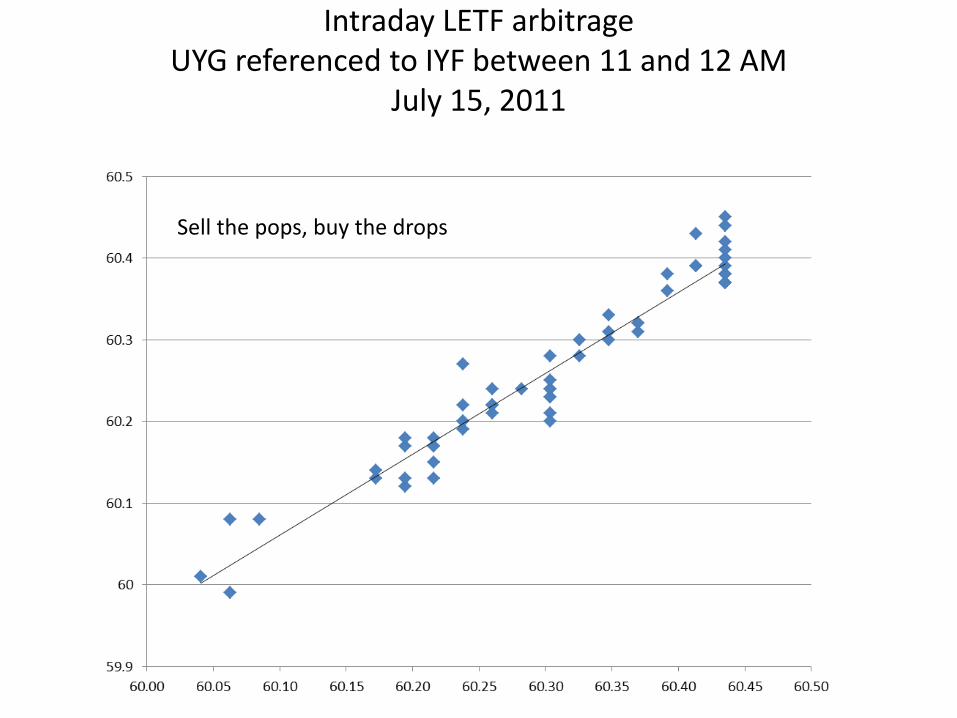
Intraday LETF arbitrage UYG referenced to IYF between 11 and 12 AM
July 15, 2011
Sell the pops, buy the drops
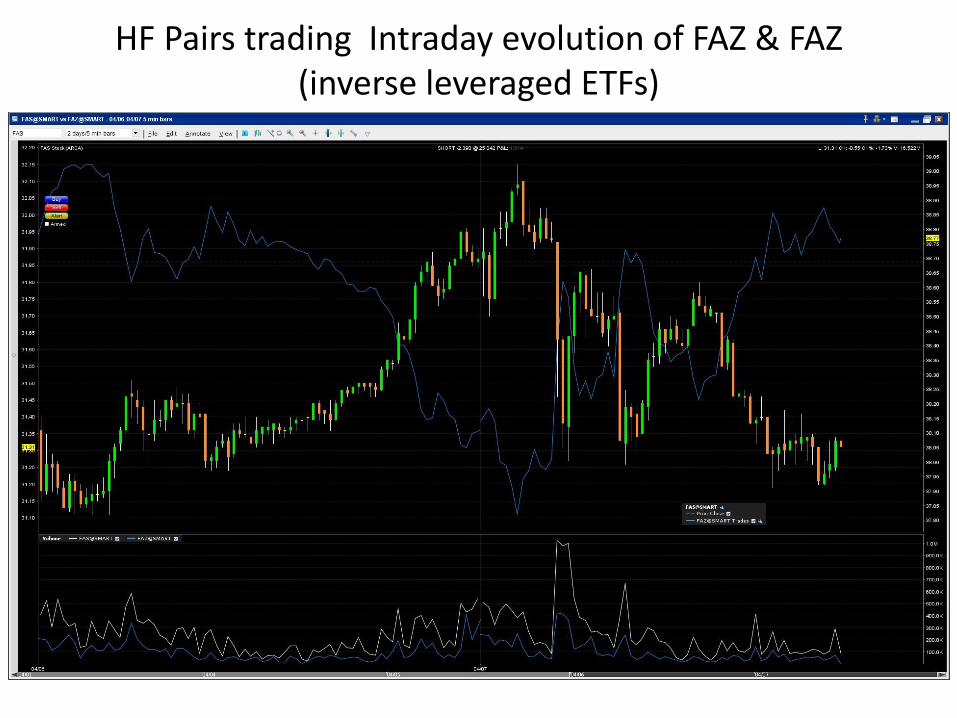
HF Pairs trading Intraday evolution of FAZ & FAZ (inverse leveraged ETFs)
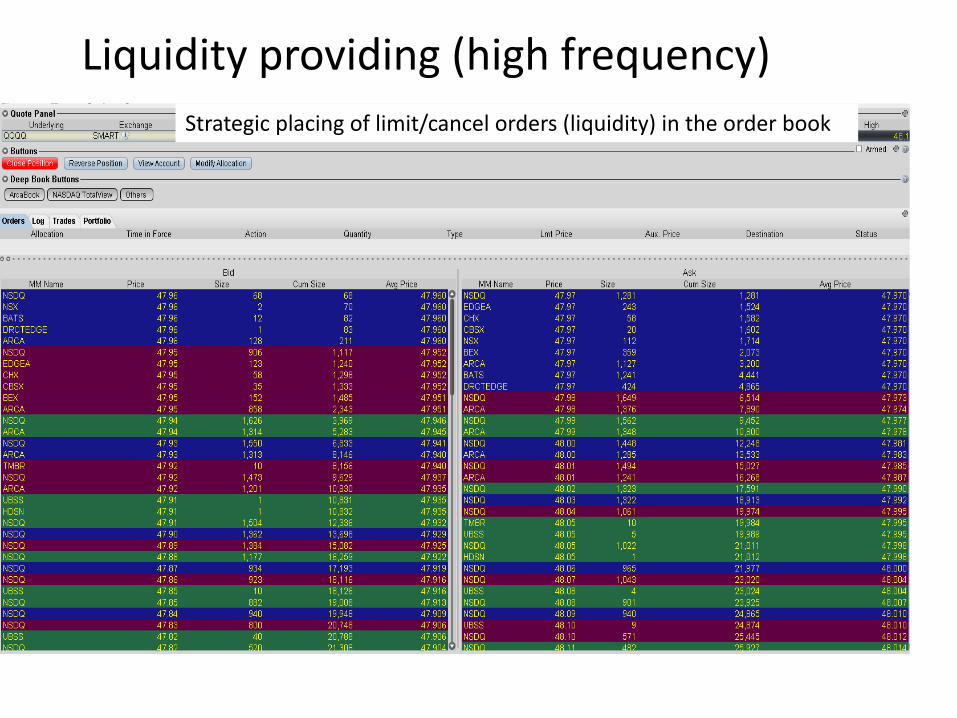
Liquidity providing Strategic placing of limit/cancel orders (liquidity) in the order book
l Liquidity providing (high frequency)
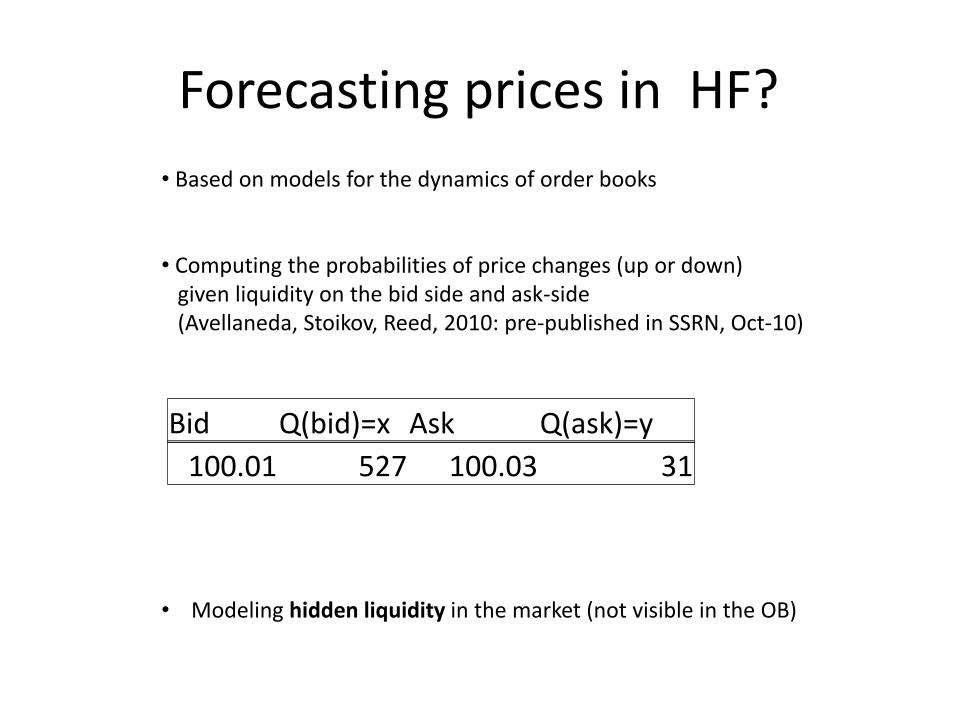
Forecasting prices in HF?
• Based on models for the dynamics of order books
• Computing the probabilities of price changes (up or down) given liquidity on the bid side and ask-side (Avellaneda, Stoikov, Reed, 2010: pre-published in SSRN, Oct-10) • Modeling hidden liquidity in the market (not visible in the OB)
Bid Q(bid)=x Ask Q(ask)=y
100.01 527 100.03 31
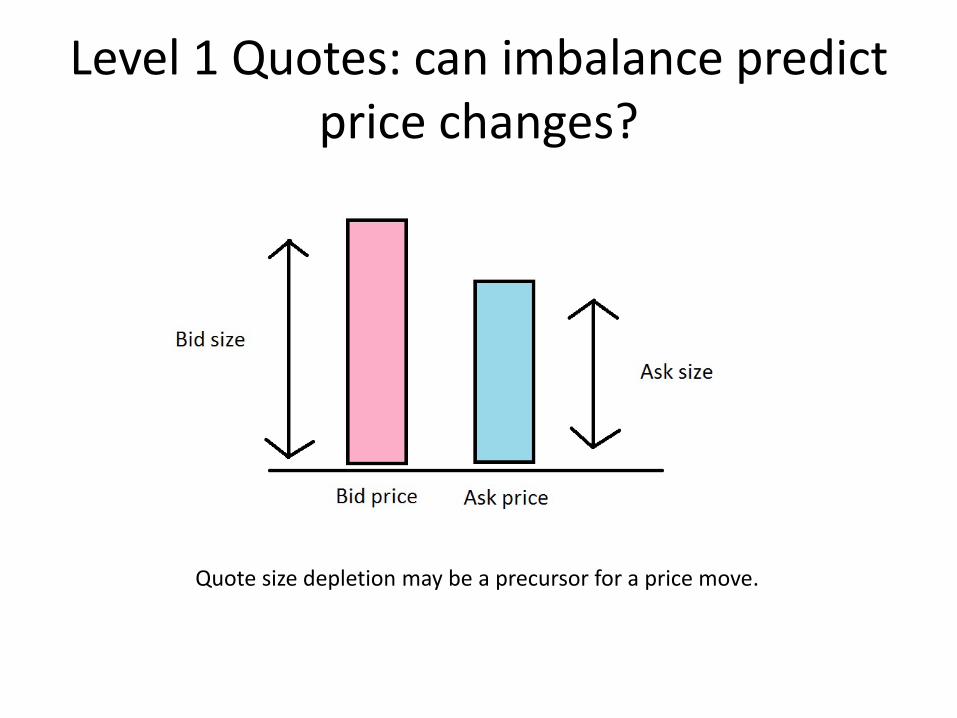
Level 1 Quotes: can imbalance predict price changes?
Quote size depletion may be a precursor for a price move.
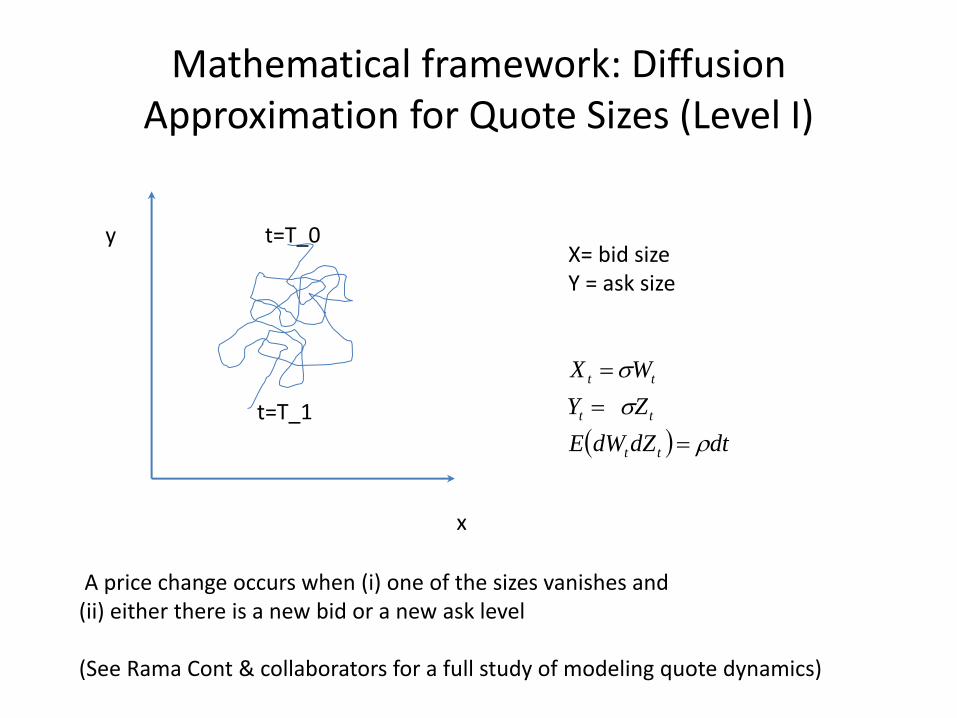
Mathematical framework: Diffusion Approximation for Quote Sizes (Level I)
y
x
X= bid size Y = ask size
dtdZdWE
ZY
WX
tt
tt
tt
t=T_0
t=T_1
A price change occurs when (i) one of the sizes vanishes and (ii) either there is a new bid or a new ask level (See Rama Cont & collaborators for a full study of modeling quote dynamics)
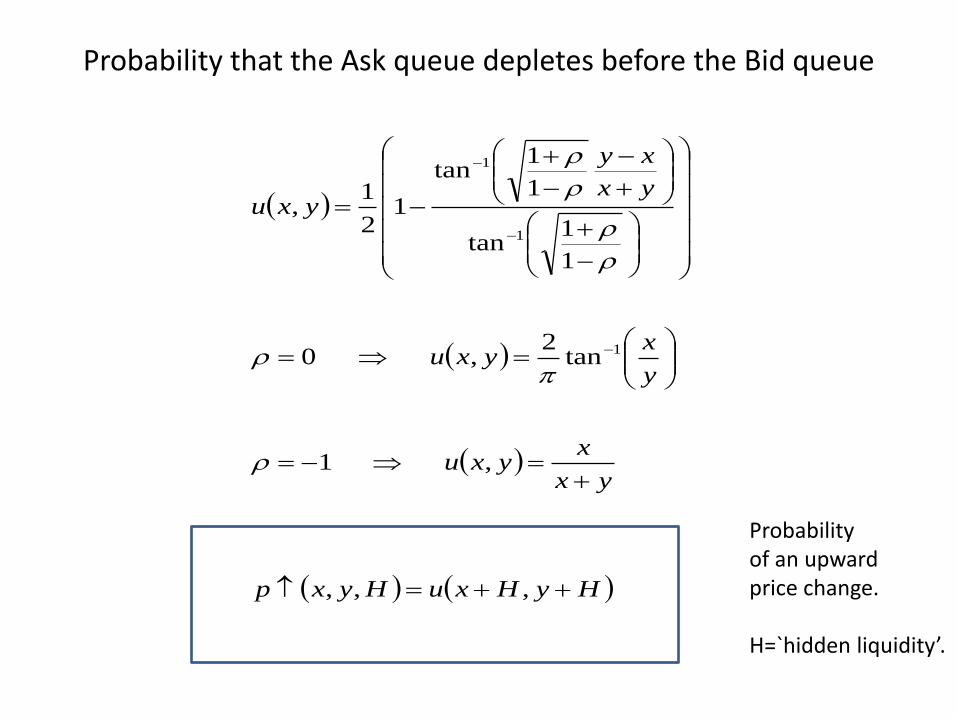
Probability that the Ask queue depletes before the Bid queue
HyHxuHyxp
yx
xyxu
y
xyxu
yx
xy
yxu
,,,
, 1
tan2
, 0
1
1tan
1
1tan
12
1,
1
1
1
Probability of an upward price change. H=`hidden liquidity’.
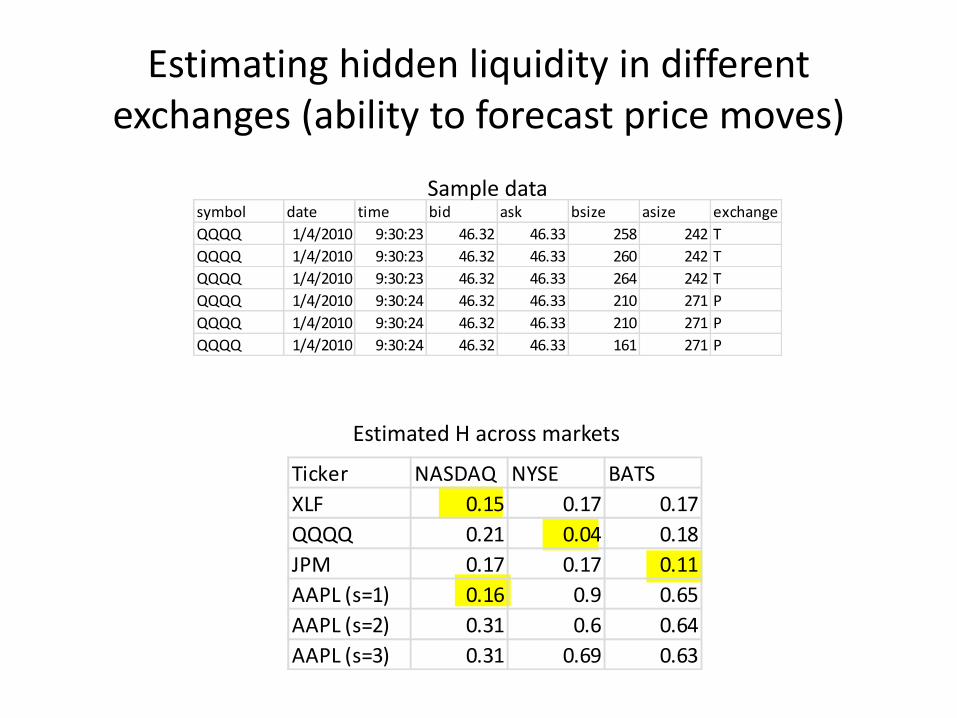
Estimating hidden liquidity in different exchanges (ability to forecast price moves)
symbol date time bid ask bsize asize exchange
QQQQ 1/4/2010 9:30:23 46.32 46.33 258 242 T
QQQQ 1/4/2010 9:30:23 46.32 46.33 260 242 T
QQQQ 1/4/2010 9:30:23 46.32 46.33 264 242 T
QQQQ 1/4/2010 9:30:24 46.32 46.33 210 271 P
QQQQ 1/4/2010 9:30:24 46.32 46.33 210 271 P
QQQQ 1/4/2010 9:30:24 46.32 46.33 161 271 P
Sample data
Ticker NASDAQ NYSE BATS
XLF 0.15 0.17 0.17
QQQQ 0.21 0.04 0.18
JPM 0.17 0.17 0.11
AAPL (s=1) 0.16 0.9 0.65
AAPL (s=2) 0.31 0.6 0.64
AAPL (s=3) 0.31 0.69 0.63
Estimated H across markets
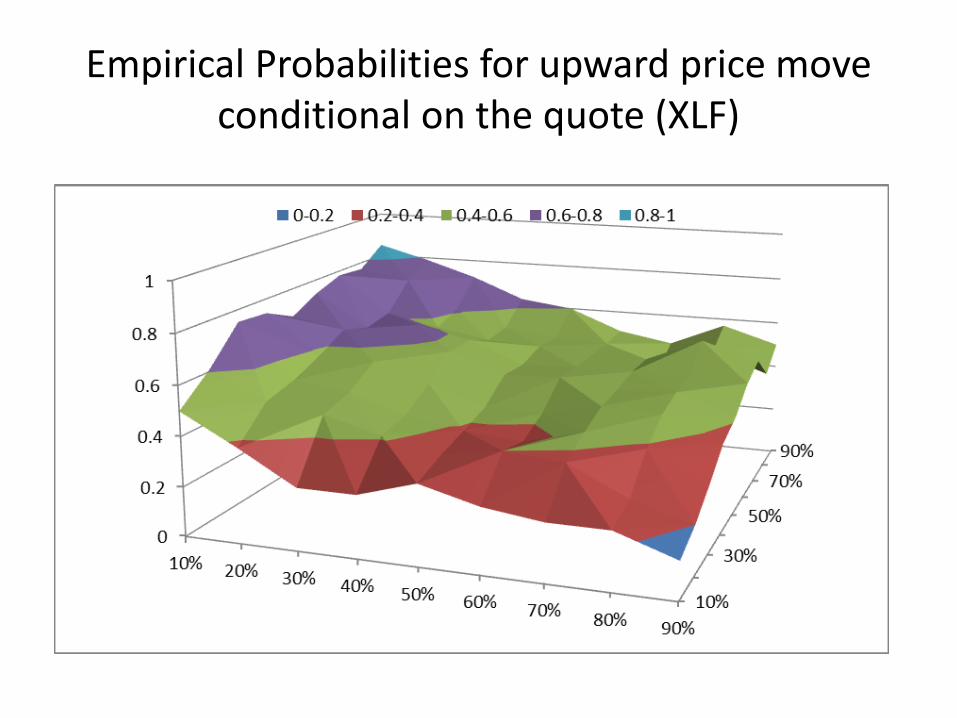
Empirical Probabilities for upward price move conditional on the quote (XLF)

Fitted model (XLF)
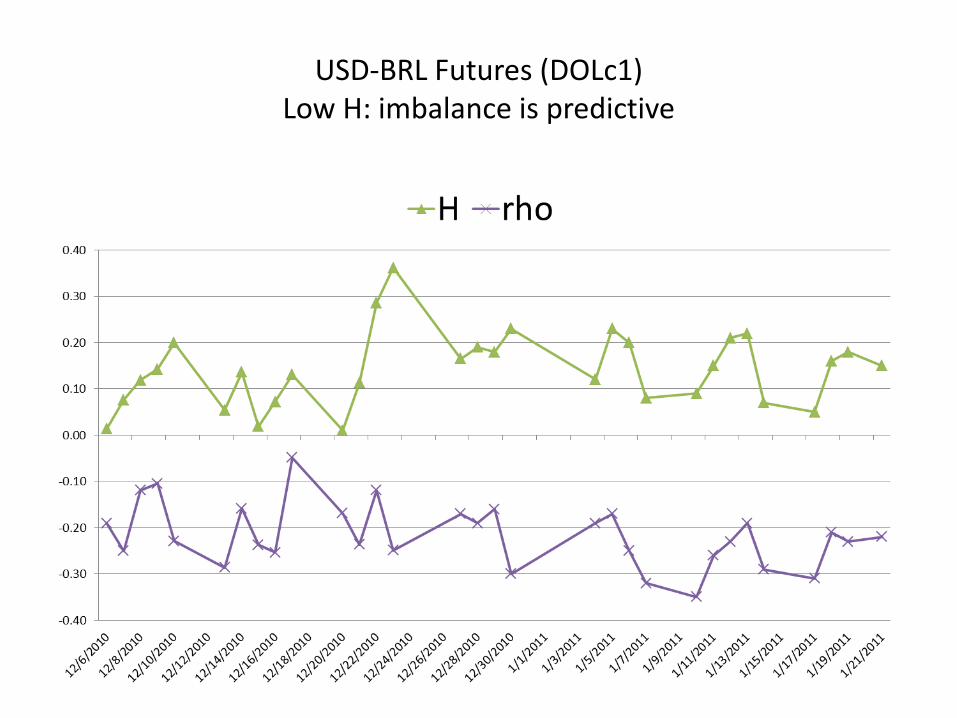
USD-BRL Futures (DOLc1) Low H: imbalance is predictive
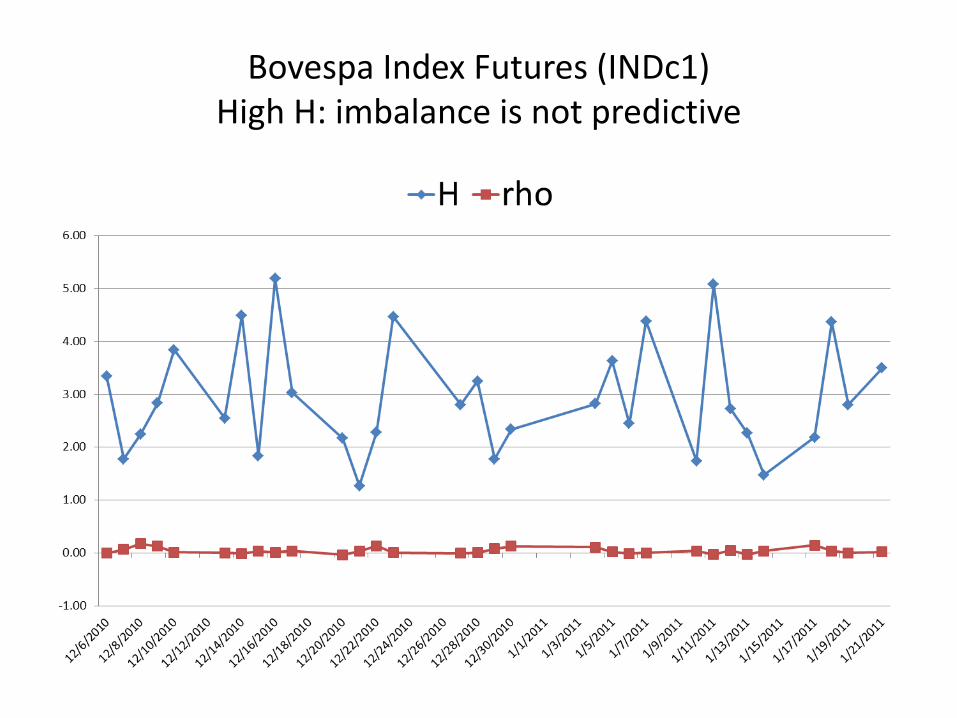
Bovespa Index Futures (INDc1) High H: imbalance is not predictive
tdWdttXmtdX
tdXdtt
ttI
tdI
tS
tdS
iiiiii
iii
ii
i
i
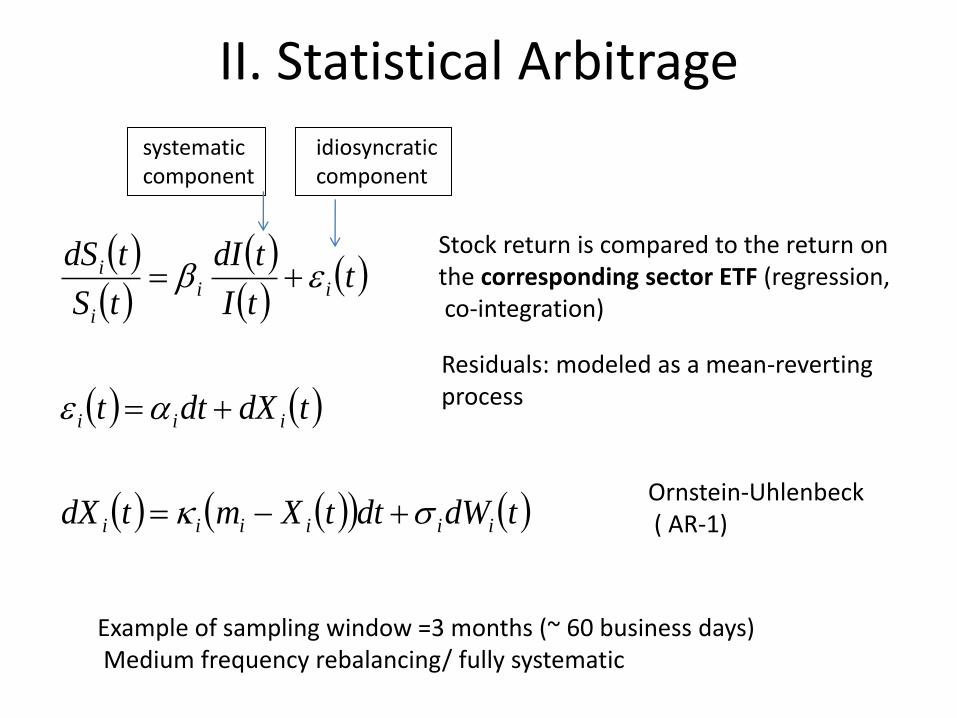
II. Statistical Arbitrage
Example of sampling window =3 months (~ 60 business days) Medium frequency rebalancing/ fully systematic
Stock return is compared to the return on the corresponding sector ETF (regression, co-integration)
Residuals: modeled as a mean-reverting process
Ornstein-Uhlenbeck ( AR-1)
systematic component
idiosyncratic component
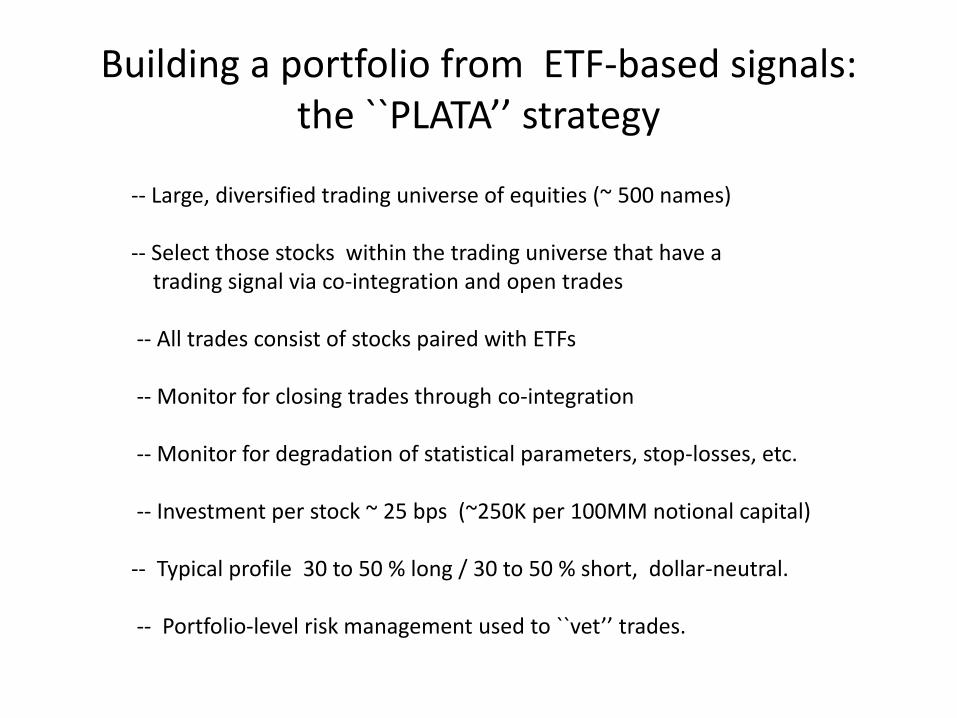
Building a portfolio from ETF-based signals: the ``PLATA’’ strategy
-- Large, diversified trading universe of equities (~ 500 names) -- Select those stocks within the trading universe that have a trading signal via co-integration and open trades -- All trades consist of stocks paired with ETFs -- Monitor for closing trades through co-integration -- Monitor for degradation of statistical parameters, stop-losses, etc. -- Investment per stock ~ 25 bps (~250K per 100MM notional capital) -- Typical profile 30 to 50 % long / 30 to 50 % short, dollar-neutral. -- Portfolio-level risk management used to ``vet’’ trades.
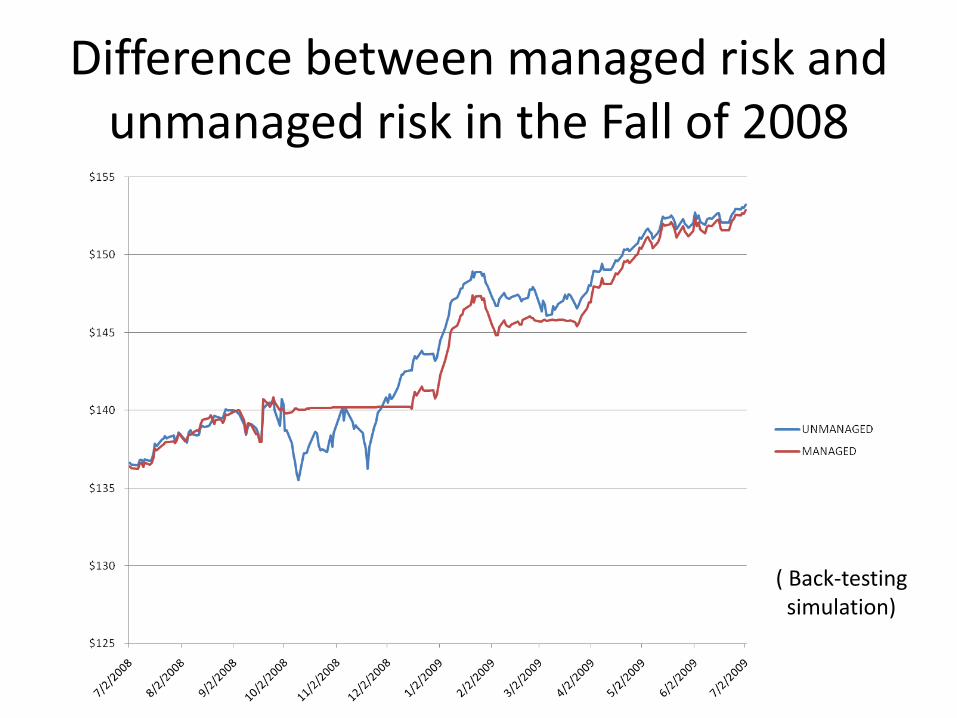
Difference between managed risk and unmanaged risk in the Fall of 2008
( Back-testing simulation)
SPY+PLATA: a synthetic 130/30 fund
Based on a notional amount of 100 MM: -- go long 100 MM SPY and -- implement a PLATA strategy based on 100MM notional amount (30 to 50 mm long/ 30 to 50 mm short) (parameters for PLATA: big universe, 25bps per stock, target daily stdev of portfolio=40bps) Due to market-neutrality of PLATA, this portfolio looks essentially like a 130/30 to a 150/50 depending on the volatility in the market and the turnover.
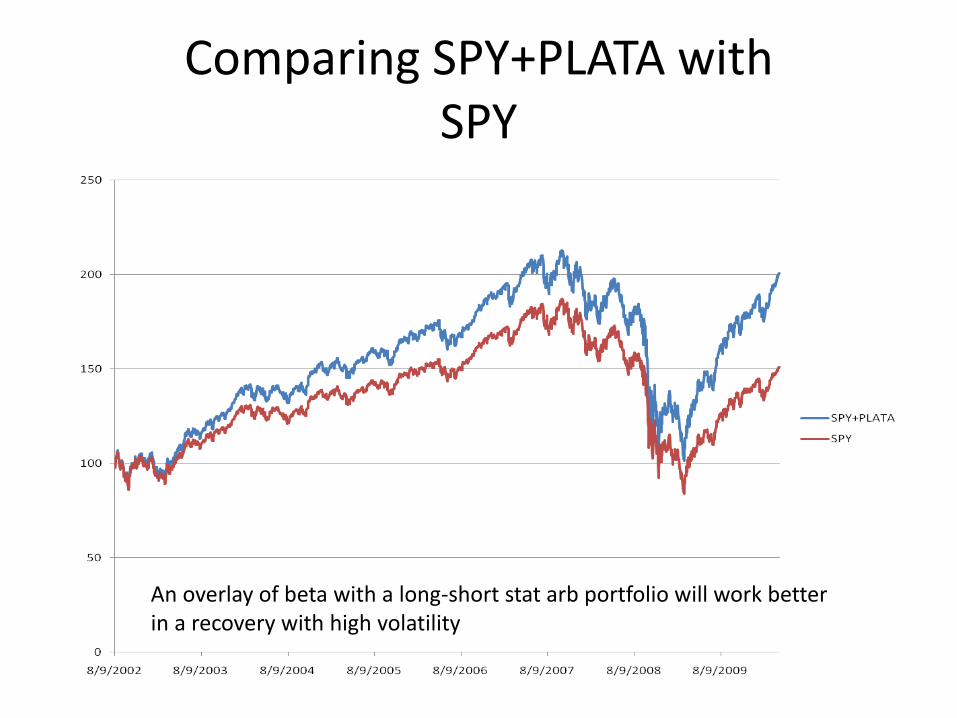
Comparing SPY+PLATA with SPY
An overlay of beta with a long-short stat arb portfolio will work better in a recovery with high volatility
III. Quantitative Low-Frequency ETF strategies
• Contango/backwardation in commodity- and volatility- based ETFs
• Path-dependence and volatility exposure in Leveraged ETFs
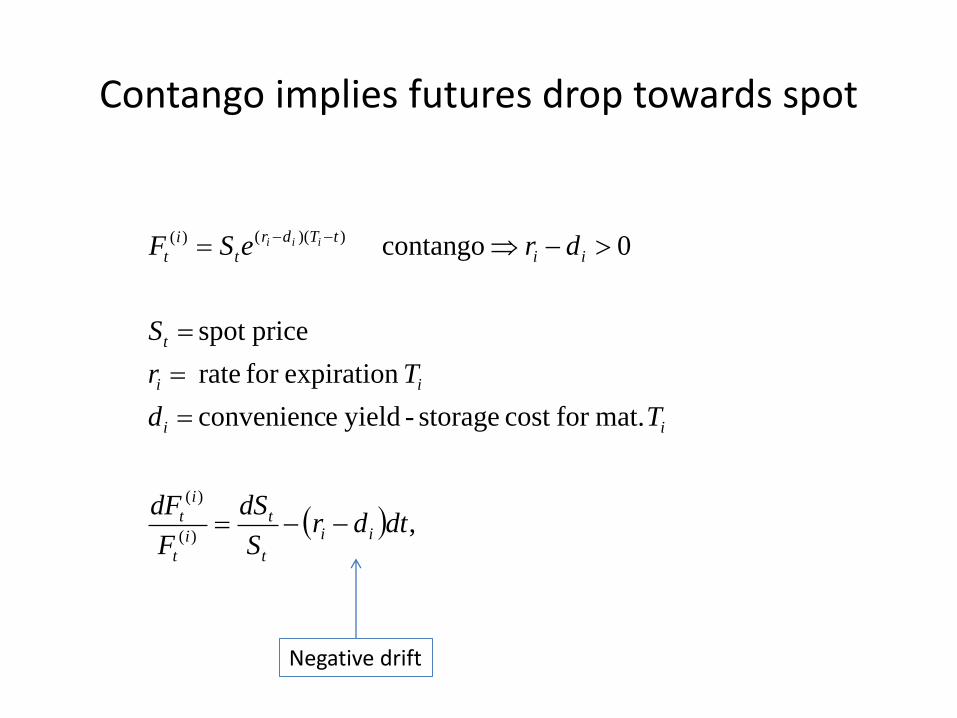
Contango implies futures drop towards spot
,
mat.for cost storage - yield econvenienc
expirationfor rate
pricespot
0contango
)(
)(
))(()(
dtdrS
dS
F
dF
Td
Tr
S
dreSF
ii
t
t
i
t
i
t
ii
ii
t
ii
tTdr
t
i
tiii
Negative drift
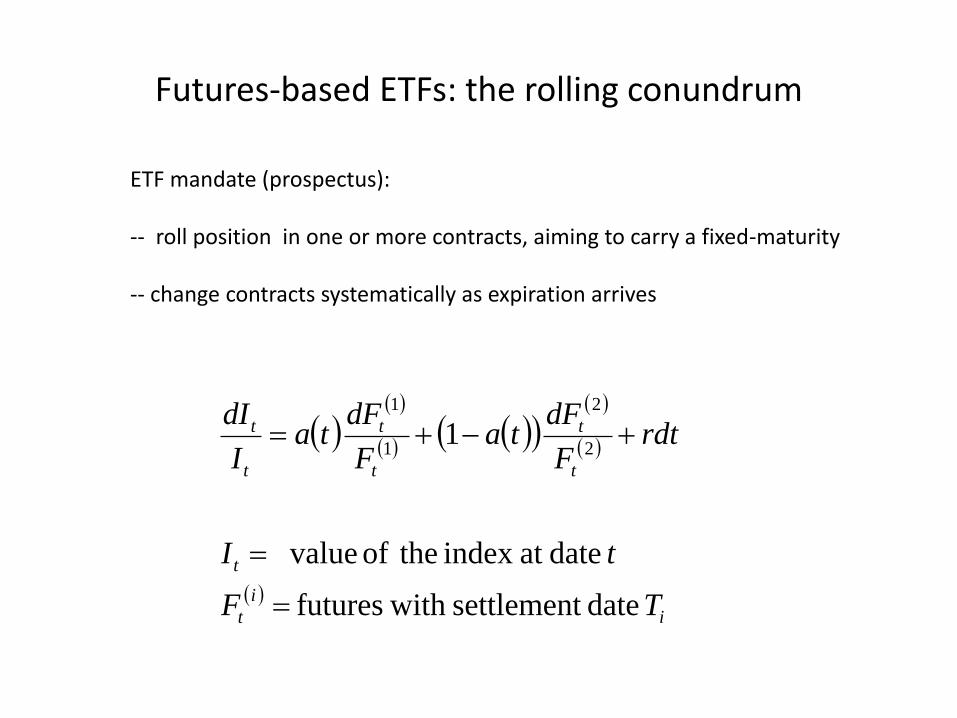
Futures-based ETFs: the rolling conundrum
ETF mandate (prospectus): -- roll position in one or more contracts, aiming to carry a fixed-maturity -- change contracts systematically as expiration arrives
i
i
t
t
t
t
t
t
t
t
TF
tI
rdtF
dFta
F
dFta
I
dI
date settlement with futures
dateat index theof value
12
2
1
1
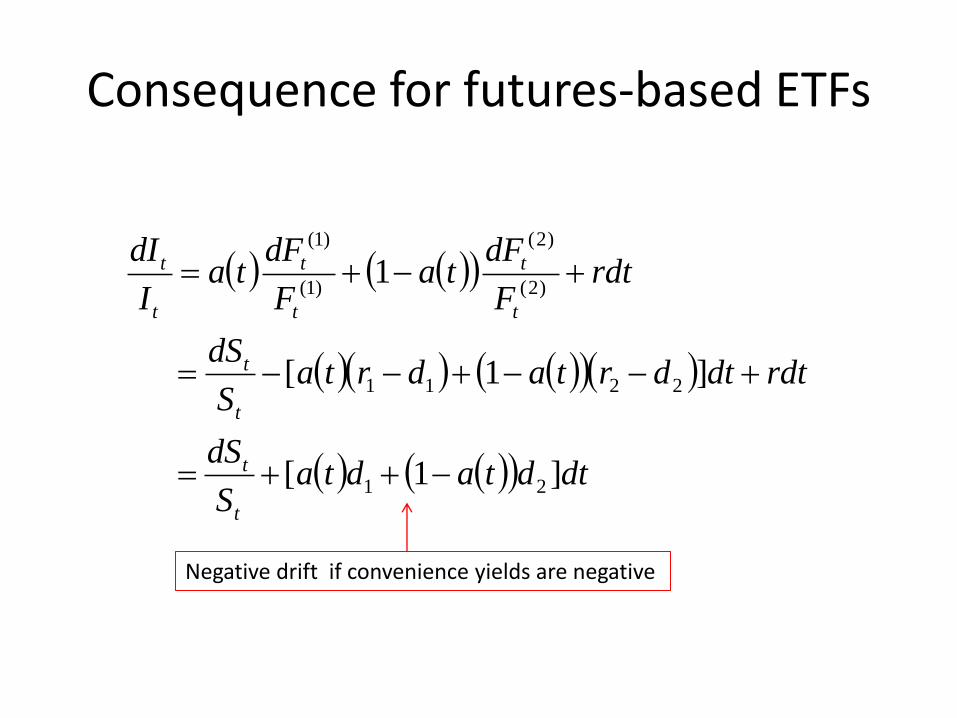
Consequence for futures-based ETFs
dtdtadtaS
dS
rdtdtdrtadrtaS
dS
rdtF
dFta
F
dFta
I
dI
t
t
t
t
t
t
t
t
t
t
]1[
]1[
1
21
2211
)2(
)2(
)1(
)1(
Negative drift if convenience yields are negative
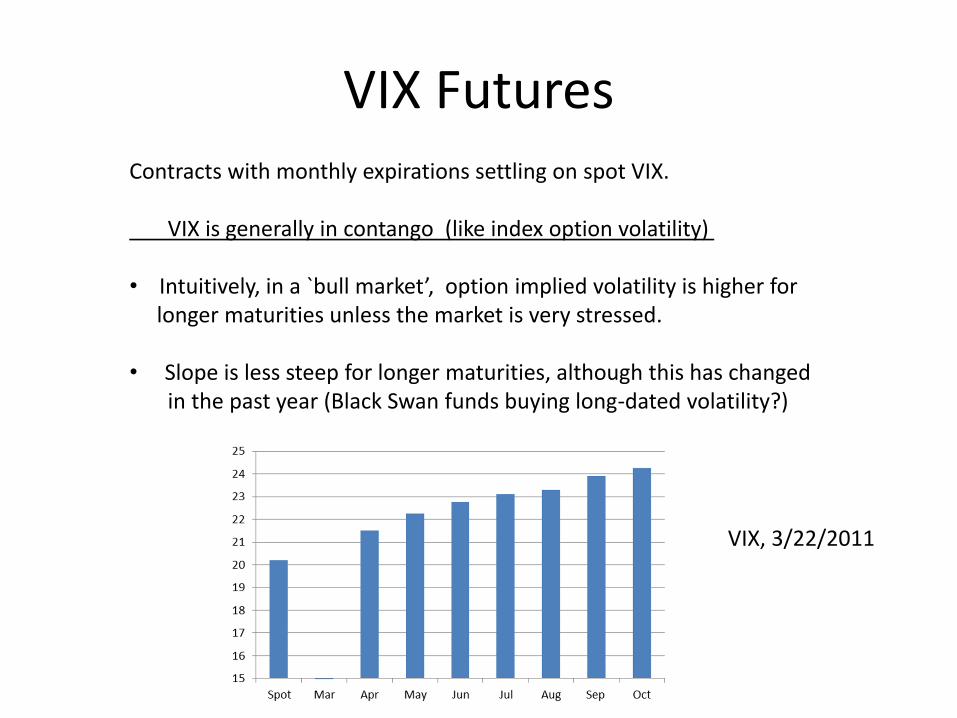
VIX Futures Contracts with monthly expirations settling on spot VIX. VIX is generally in contango (like index option volatility) • Intuitively, in a `bull market’, option implied volatility is higher for longer maturities unless the market is very stressed. • Slope is less steep for longer maturities, although this has changed in the past year (Black Swan funds buying long-dated volatility?)
VIX, 3/22/2011

The VXX and VXZ ETNs
VXX: iShares ETN which tracks short term VIX futures (months 1 and 2) target maturity 30 days; continuous roll VXZ: iShares ETN, tracks mid-term VIX futures (months 4 through 7); target maturity 120 days; continuous roll Both securities have negative drift and are correlated to the same underlying asset. This gives rise to the possibility of arbitrage by building a long-short position
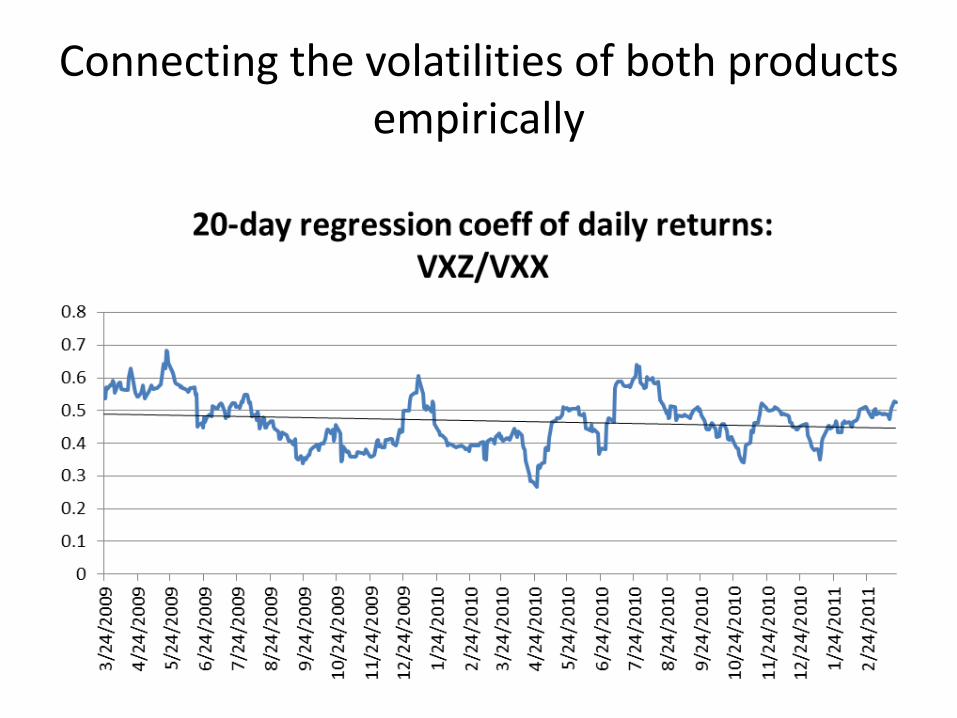
Connecting the volatilities of both products empirically
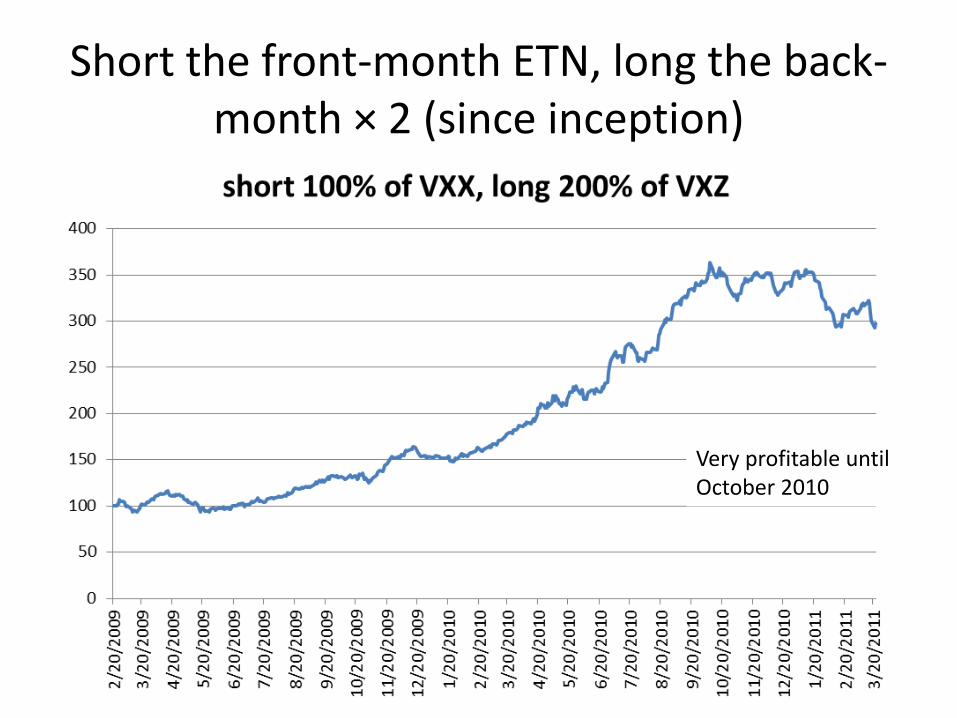
Short the front-month ETN, long the back-month × 2 (since inception)
Very profitable until October 2010
Arbitrage Strategies with Leveraged ETFs
• Leveraged ETFs must rebalance daily their position in the underlying asset to maintain fixed market exposure (2X, 3X) • Even though this is done via total return swaps, the hedging of the swaps will induce a market impact unfavorable to the fund • Volatility plays against LETFs • Borrow costs of LETFs diminish, but not eliminate, arbitrage opportunities
• A structural arbitrage : short LETFs and hedge market exposure
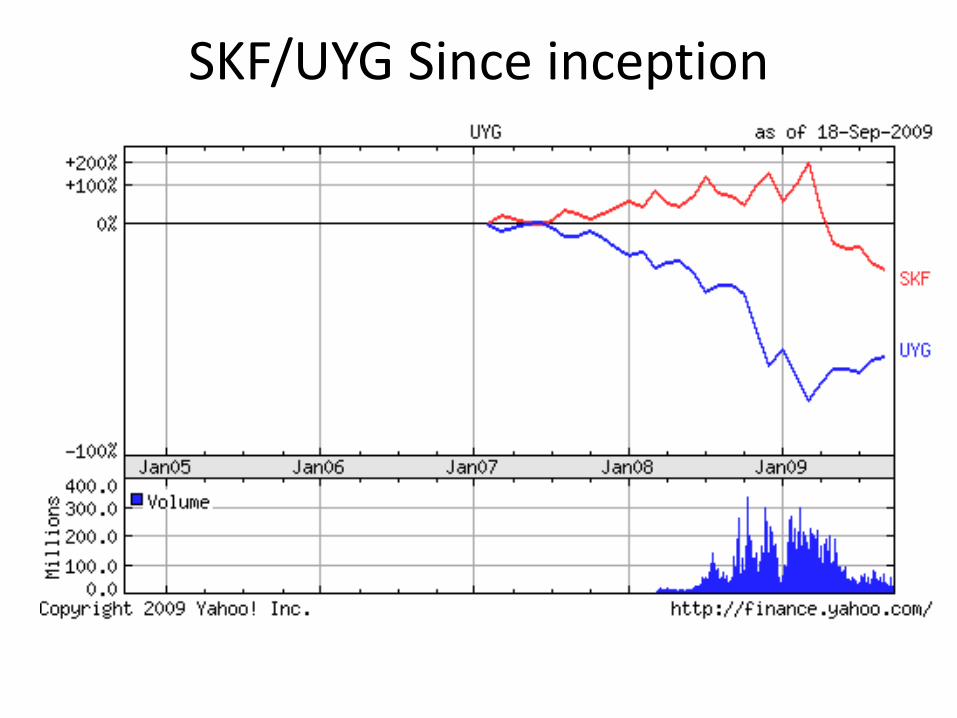
SKF/UYG Since inception
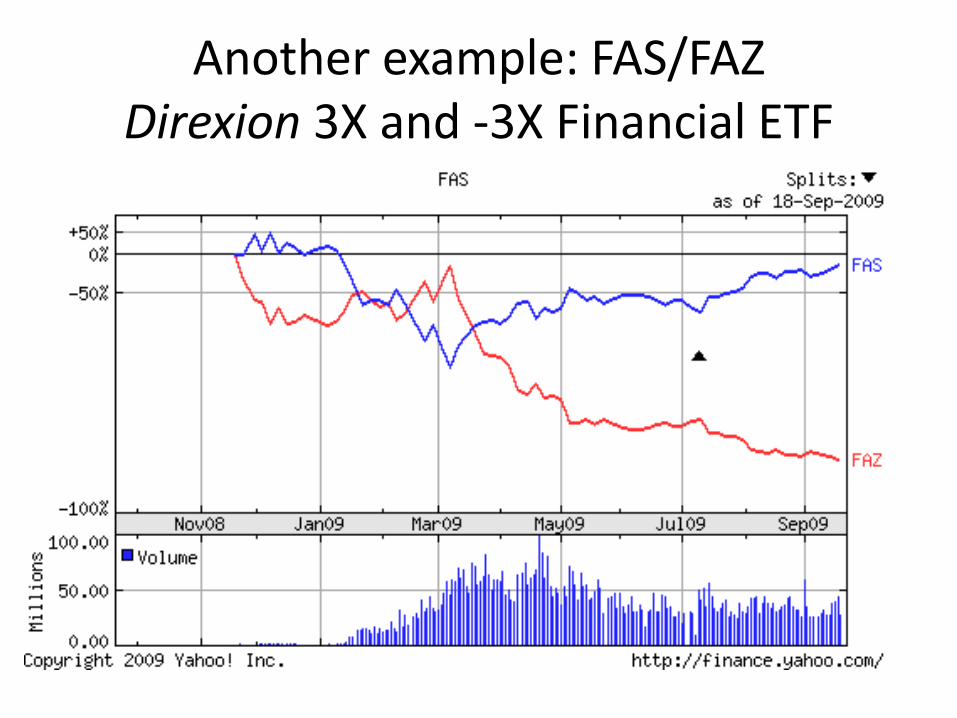
Another example: FAS/FAZ Direxion 3X and -3X Financial ETF
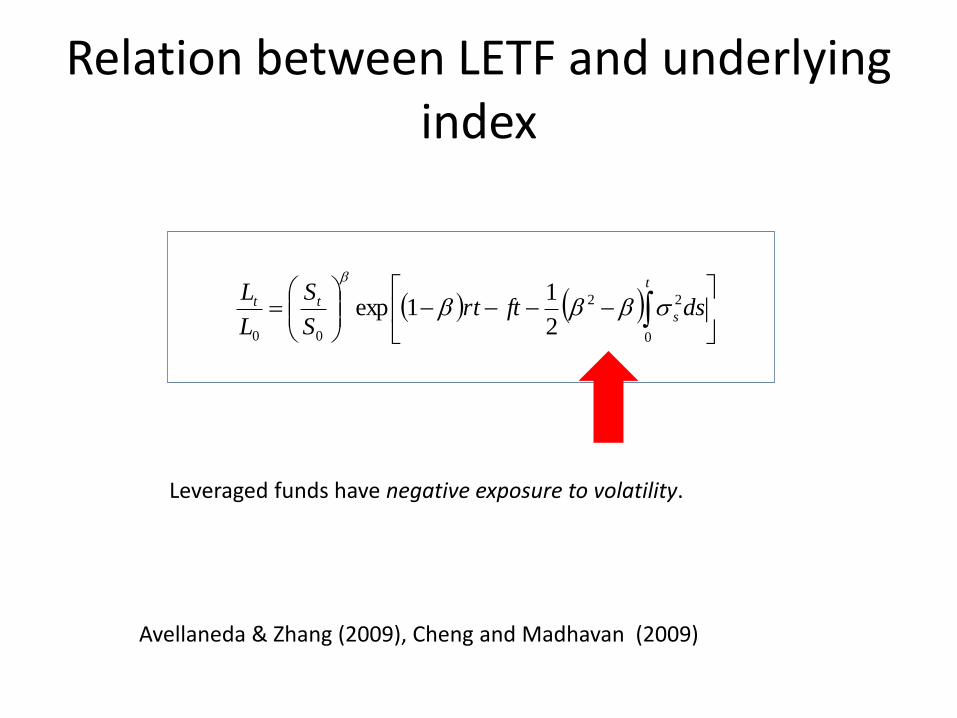
Relation between LETF and underlying index
t
stt dsftrt
S
S
L
L
0
22
00 2
11exp
Avellaneda & Zhang (2009), Cheng and Madhavan (2009)
Leveraged funds have negative exposure to volatility.
Analysis of Borrow costs
• In the current market, LETFs trade at a negative borrow rate.
• However, LETFs typically underperform their benchmark over a single trading date due to market impact (slippage). • The rate of return of this trade excluding shorting costs can exceed 10% per year (4 bps per day). • Except for the case of EEM, a study based on data from June 2009 until now suggests that the borrowing costs charged by one major brokerage (Interactive Brokers) typically offset the gains from slippage in the LETFs.
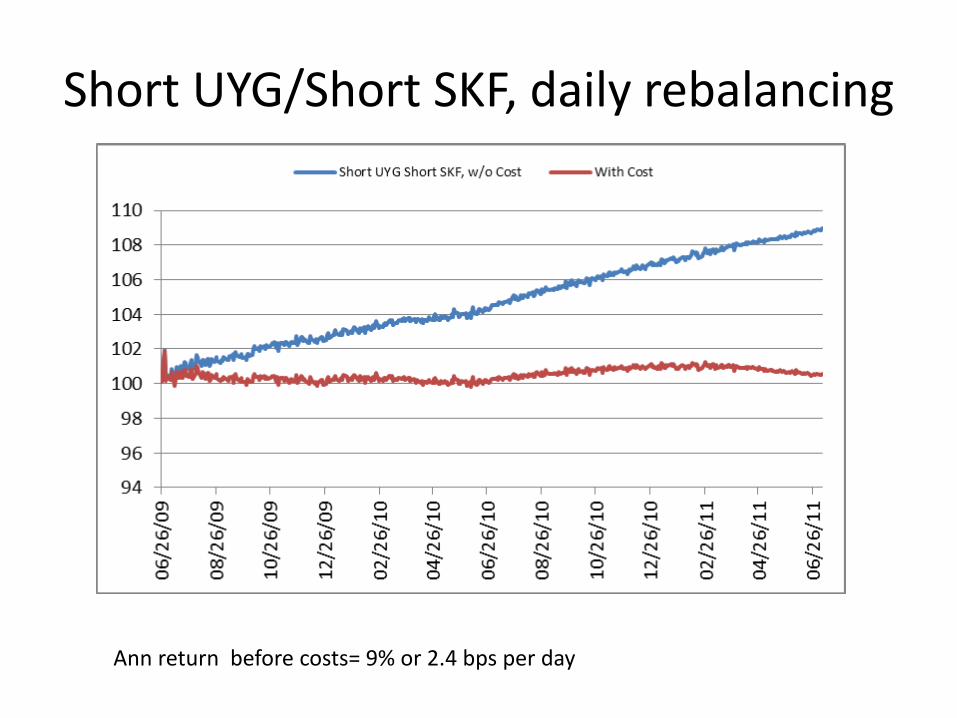
Short UYG/Short SKF, daily rebalancing
Ann return before costs= 9% or 2.4 bps per day
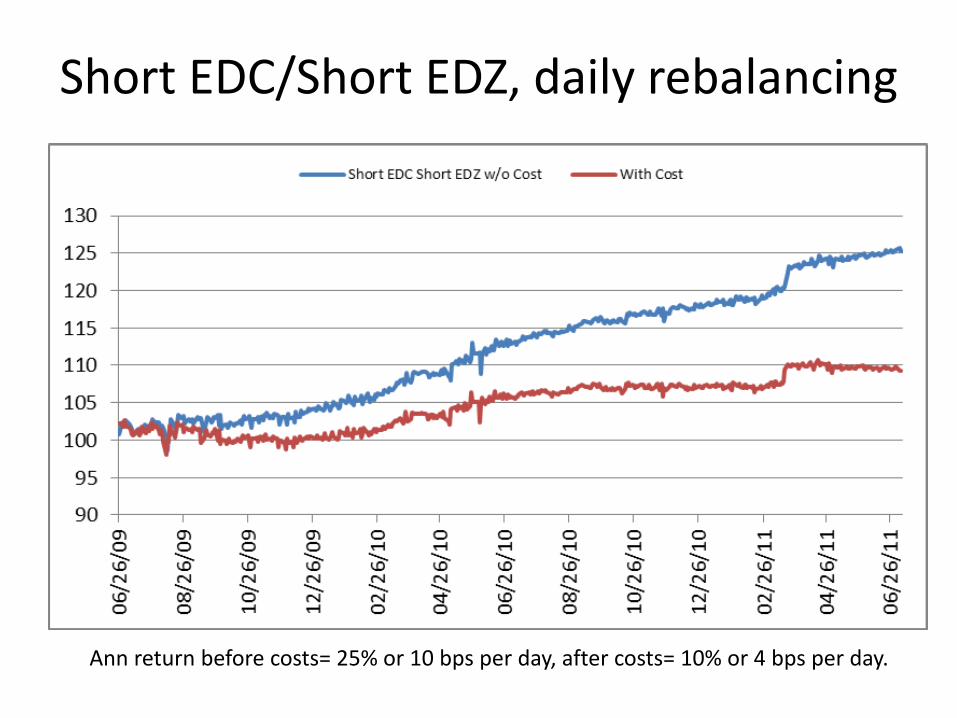
Short EDC/Short EDZ, daily rebalancing
Ann return before costs= 25% or 10 bps per day, after costs= 10% or 4 bps per day.
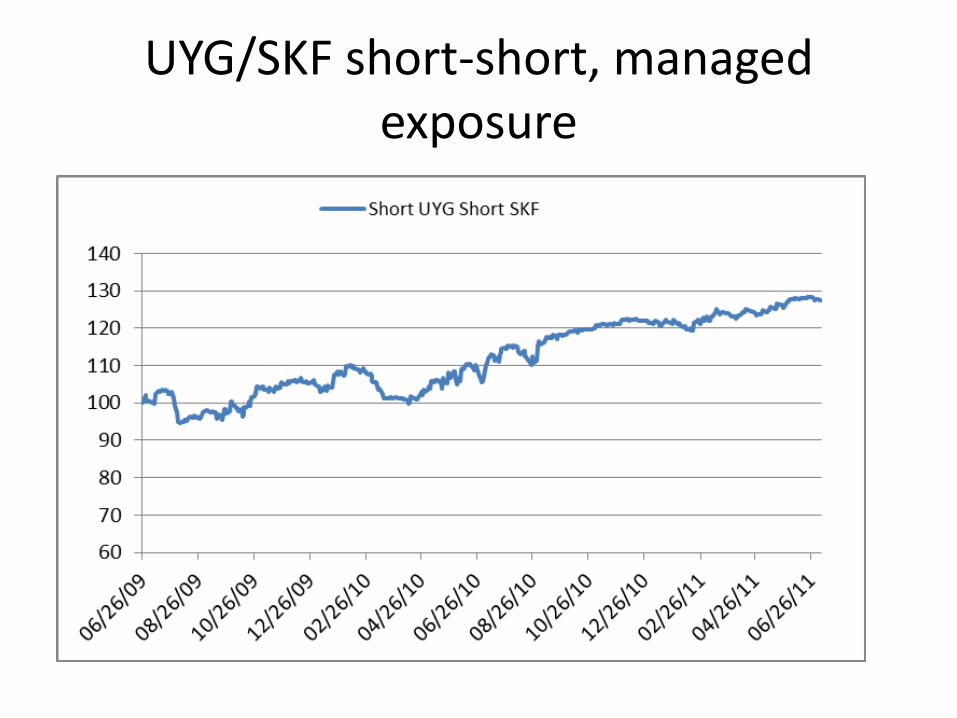
UYG/SKF short-short, managed exposure
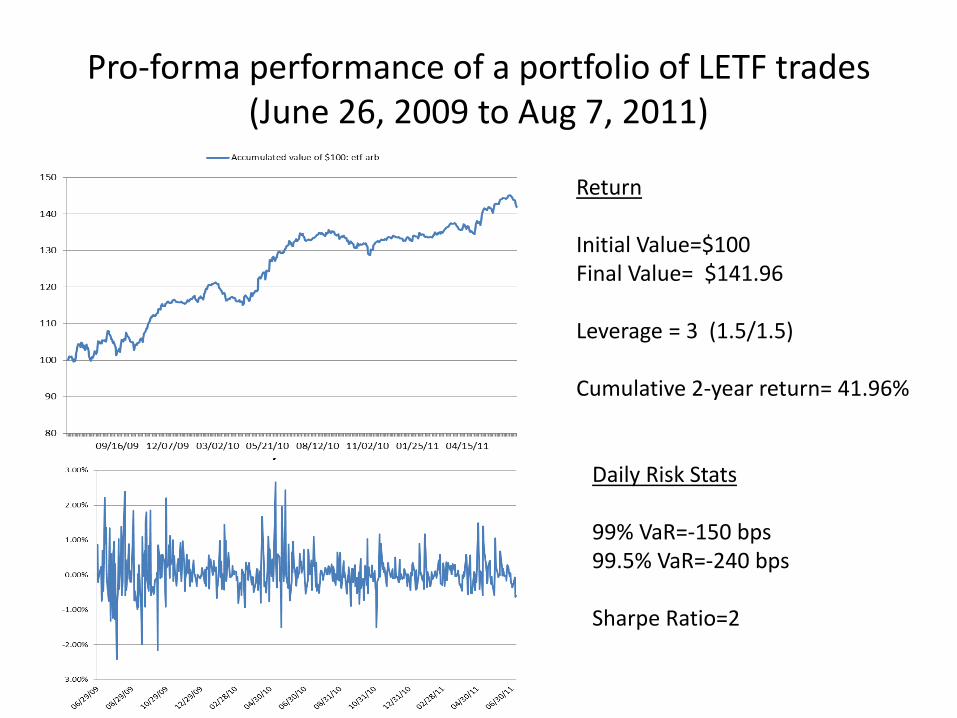
Pro-forma performance of a portfolio of LETF trades (June 26, 2009 to Aug 7, 2011)
Return Initial Value=$100 Final Value= $141.96 Leverage = 3 (1.5/1.5) Cumulative 2-year return= 41.96%
Daily Risk Stats 99% VaR=-150 bps 99.5% VaR=-240 bps Sharpe Ratio=2
Conclusions
• Present market conditions favor quant strategies which are market neutral and/or positioned to capitalize on excess realized volatility A few promising themes: • Intraday index/etf/letf/futures arbitrage -- they require HFT technology (Market making also)
• Price-forecasting based on order book imbalance • Intermediate-frequency trading based on mean-reversion
• Contango/backwardation trades in commodities and VIX
• Leveraged-etf trades to capitalize on high realized volatility