Embed Size (px)
Citation preview

The Grade 9 Cohort of Fall 2000:The Grade 9 Cohort of Fall 2000:
Graduation and Graduation and Post-secondary PathwaysPost-secondary Pathways
Montreal, November 2009
Paul Anisef York UniversityRobert S. Brown Toronto DSB/York
Robert Sweet Lakehead

Evolution & Connections:Evolution & Connections:
1999: Survey of Approaches to Educational Planning--
Preparing for PSE: New Roles for Governments and Families
(2005), McGill Queens
2003: pan Canadian feasibility study in 3 provinces- Academic
Performance and Mobility of Youth of Immigrant Children in
Canada: What can we learn from provincial data banks?( 2005)
2007: Funding by CCL and CIC for Pan-Canadian study---
Educational Pathways and Academic Performance of Youth of
Immigrant Origin: Montreal, Toronto and Vancouver
2008: Funding received from Higher Education Quality Council of Ontario 2008: Funding received from Higher Education Quality Council of Ontario
& Social Science & Humanities Council of Canada to employ TDSB & & Social Science & Humanities Council of Canada to employ TDSB &
linked administrative data to explore PSE pathways & engage in linked administrative data to explore PSE pathways & engage in
knowledge exchange with school board researchersknowledge exchange with school board researchers

1.1. About the (TDSB)About the (TDSB)
Created on January 1, 1998, following the amalgamation
of 7 individual boards.
Largest school board in Canada.
592 schools serving 270,000 students.
Diverse student population in one of the world’s most
diverse cities.

TDSB- Key LanguagesTDSB- Key Languages


Copyright © August 2009 Toronto District School Board 6
Low Income Rates (City of Toronto)

Copyright © August 2009 Toronto District School Board 7
Family Income by Race, 2009 (2008 Parent Census, JK-Gr.6)
4%
4%
7%
8%
4%
13%
7%
30%
52%
4%
6%
8%
7%
7%
12%
10%
13%
14%
13%
15%
13%
21%
19%
21%
29%
19%
15%
23%
30%
31%
26%
34%
26%
27%
18%
11%
55%
45%
40%
39%
37%
28%
27%
20%
9%
0% 50% 100%
Middle Eastern
Black
Aboriginal
Latin American
South Asian
East Asian
Southeast Asian
Mixed
White
$100,000+ $75,000 - $99,999 $50,000 - $74,999 $30,000 - $49,999 Less than $30,000

Copyright © August 2009 Toronto District School Board 8

Copyright © August 2009 Toronto District School Board 9
Grade 9 Credit Accumulation by SES
2006-07 Grade 9 Credit Accumulation (% Highly At-risk with 6 or fewer credits)
20%
16%
11%
8%
4%
0%
15%
30%
No income Unskilled clerical Skilled clerical Semi-professional Professional

Source: City of Toronto

II. What do we mean by the Grade 9 cohort?II. What do we mean by the Grade 9 cohort?
Cohort rates, looking at how one group of
students did over a period of time.
In Ontario, this has traditionally looked at how
Grade 9 students have fared over a five year
period, from when they started their first year of
high school in Grade 9 until after they finished their
fifth year).

Only way to provide the full (or at least fuller) picture of
long-term student progress.
Both at-risk and resilient students take longer to complete
high school.
‘Dropout’ status changes from year to year; the longer the
study the more definitive the outcome.
Why Do Cohort Studies?Why Do Cohort Studies?

54.5% graduated in 2003-4 (Year 4)
14.2% graduated in 2004-5 (Year 5)
3.0% graduated in 2005-6 (Year 6)
by the end of Year 6, 26.1% had dropped out
by the end of Year 6, 2.3% were still in the TDSB in the
Year 7 of secondary.
Most students had either graduated or dropped out by Fall 2007
(end of Year 6/beginning of Year 7):

Students 1) Apply to post-secondary; they 2) confirm an offer of
admission and 3) register (attend) the institution.
We looked at five years of postsecondary applications and
confirmations (registration data available only in 2004):
2003-4 (Year 4 of this cohort; known by universities and
colleges as the 2004 applications cycle)
2004-5 (Year 5)
2005-6 (Year 6)
2006-7 (Year 7)
2007-8 (Year 8 if this cohort; the 2008 applications cycle)
IV.IV. Post-secondary Access: Post-secondary Access: This Grade 9 Cohort of Fall 2000This Grade 9 Cohort of Fall 2000

The Direct TransitionThe Direct Transition
The Direct Transition Students will apply to post-secondary directly from high school,
or within a year or two of graduation. These students are the
'direct transition'.
Students will apply as adult students in the 'indirect transition'.
The boundaries between the two are fluid.
We will be looking at the direct transition, according to
student records.

Almost all students who graduated (87%) then applied to post-
secondary, over a period of 5 years. The proportion has
increased amongst more recent cohorts.
Thus, ‘graduation’ and ‘post-secondary access’ are merging.
Over three quarters of University confirmations happened in
2004, the first year of Grade 12; a fifth happened in 2005.
However, little over a third (38%) of College confirmations
happened 2004, the first year of Grade 12.
The majority of College confirmations occurred in 2005 (50%)
and 2006 (9%).
When did students apply to post-secondary?


We put the 5 years of confirmations data, and the six year cohort
study, together in a variable that combines outcomes from when
the students started in Grade 9 in Fall 2000, until the final year of
applications in the 'direct transition' in 2007-8:
43.1% confirmed an offer of acceptance from university;
13.9% confirmed an offer of acceptance from college;
17.3% applied to post-secondary but did not confirm any offer;
or graduated, but did not apply to post-secondary;
24.0% dropped out, and did not apply to post-secondary.
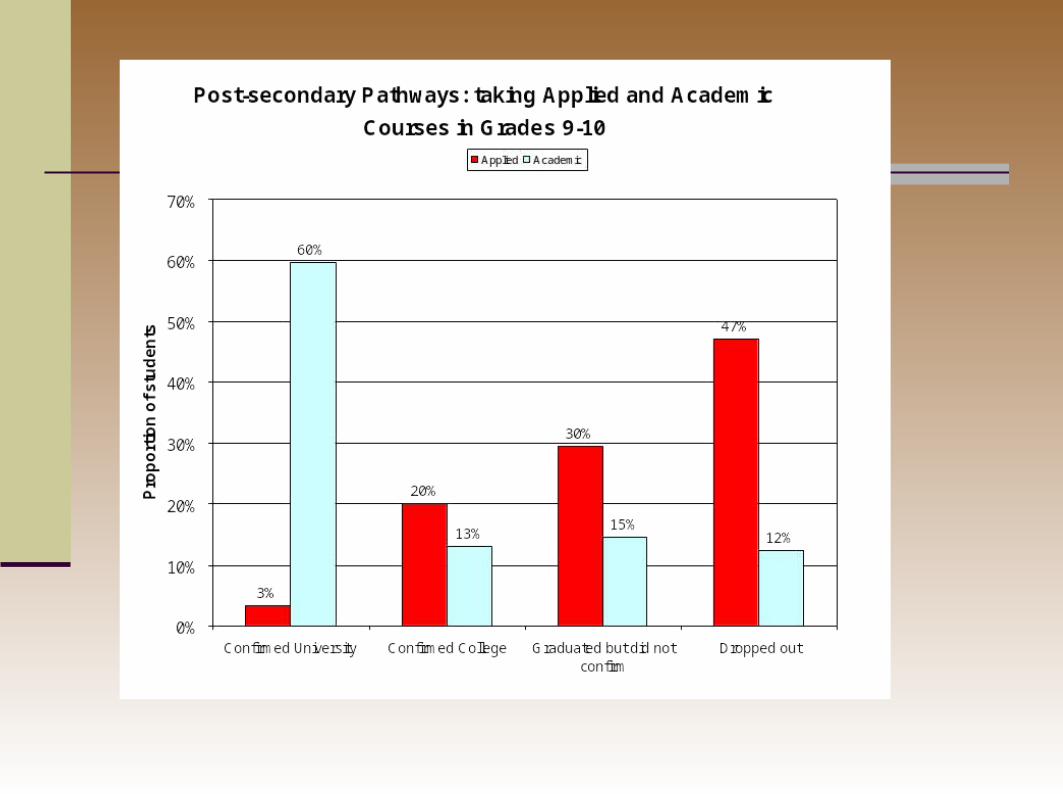
Putting Confirmations and Graduation Putting Confirmations and Graduation
Patterns Together: Post-secondary PathwaysPatterns Together: Post-secondary Pathways

A Few Key Points:
Speaking English and being born in and out of Canada in
themselves are not especially important (similar to what we
found in the earlier study) although the lower-achieving
categories are a bit more likely to be born in Canada and
speaking English only.
The two extremes are confirmation to university on one side,
and dropout on the other.
The key differences are gender, streaming, Grade 9
performance, and SES.
Post-secondary PathwaysPost-secondary Pathways