Embed Size (px)
Citation preview
12/07/06
- DISCUSSION TEXT -
The Fiscal Load in
Brazil
- 1996 -
ELABORATION: SECRETARIAT OF THE FEDERAL REVENUE GENERAL COORDINATING STAFF OF ECONOMIC-TAX AND STRATEGIC STUDIES DIVISION OF STATISTICAL DATA ANALYSIS Esplanada dos Ministérios Edifício Sede do Ministério da Fazenda 7º andar, sala 705 Brasília – DF CEP – 70.048-900 Phone: Voice: (061) 314-4199 Fax: (061) 233-7103 AFTN in Charge: Jefferson José Rodrigues Selma Santos Reis
FISCAL LOAD – 1996
1. INITIAL CONSIDERATIONS
The purpose of this study is to provide an indicator of the volume of revenues of an obligatory nature originating in the private sector (businesses and family units) and utilized to finance the federal, state and municipal public sectors in the performance of their functions. This sectoral transfer of resources is measured by the Fiscal Load, an expression utilized herein in the place of Tax Load, thus avoiding a discussion regarding inclusion of social, labor and economic contributions in the concept of tax.
Therefore, aside from the items cited under CTM (taxes and contributions targeted at specific improvements), utilization of the term Gross Fiscal Load (CFB) seeks to encompass social and economic contributions within this analysis, as well as contributions to the Employment Compensation Fund. Furthermore, in order to ensure standardization with other already published data series, Net Fiscal Load (CFL) was defined as CFB less FGTS withdrawals and fiscal incentives, refunds and rectifications involving taxes administered by the Federal Revenue Bureau.
With this in mind, the 1996 Gross Fiscal Load was calculated at 28.17% of GDP, 0.51 p.p. below the 1995 level, and the Net Fiscal Load was calculated at 26.18% of GDP, 0.71% below the previous year's CFL. These results clearly ratify a trend evident since 1994 toward stabilization of the Gross and Net Fiscal Load at levels of 29% and 27% of GDP, respectively.
R$ millions % CFB % GDP
GROSS FISCAL LOAD 219.363,03 100,00 29,15 (-) Fiscal Incentives 1.517,66 0,69 0,20 (-) Refunds 2.679,27 1,22 0,36 (-) Rectifications 118,37 0,00 0,00 (-) FGTS Withdrawals 11.159,58 5,06 1,49 NET FISCAL LOAD 203.888,15 93,03 27,10
According to the Brazilian Institute of Geography and Statistics (IBGE), 1996
Gross Domestic Product totaled R$ 778,820,035,000.00. With this in mind, we will now present a brief analysis of the factors that
contributed directly or indirectly to the 1996 Fiscal Load, together with their classification according to the various relevant approaches. Finally, a series of tables and graphs will provide an overview of the evolution of CFB and CFL in the 1990-1996 period. 2. ECONOMIC ASPECTS
The process of recovery in the pace of economic activity that began toward the end of 1995 continued through 1996, resulting in 2.91% GDP growth. This result was generated by a monetary policy that gradually but steadily reduced interest rates, coupled with substantial improvement in credit conditions and expansion of payment terms, with evident impacts on domestic sales, mainly involving consumer durables and semidurables. In this context of moderate growth, price indices continued on a downward trajectory, tending toward convergence since July 1994 (Real Plan). Average
price indices pointed to cumulative inflation of approximately 9.5% in 1996. Exchange policy remained unchanged, though repeated balance of trade deficits
led the government to adopt measures, primarily of a tax nature, aimed at stimulating export sector activities. In this framework, a decision was taken not to levy the ICMS on primary and semimanufactured products targeted to the international market and to make use of the ICMS credit mechanism for goods utilized in output of industrialized export products. Despite these incentives, the trade balance continued in a deficit position, closing December 1996 with a cumulative negative balance of US$ 5.5 billion. 3. TAX ASPECTS
Revenues administered by the Federal Revenue Bureau, corresponding to
approximately 41% of the Gross Fiscal Load, expanded 2% in real terms compared to the previous year. Despite various measures taken over the course of the year with the explicit purpose of reducing the tax burden, the result was a new tax collection record. In order to exemplify these initiatives, one could cite reduction in IOF rates on credit operations, an income tax exemption on profits distributed to partners or stockholders, reduction of the CSLL from 10% to 8% for corporate taxpayers in general and from 23% to 18% for financial institutions, together with a cutback in corporate income tax (IRPJ) rates.
Among the taxes administered by the SRF, the IRPJ turned in the best performance compared to 1995. Although Law 9,249/95 reduced IRPJ rates, possible growth in the tax base, coupled with a substantial revenue inflow resulting from the previous year’s corporate tax returns, efforts to convert judicial deposits into income and taking of inflationary profits in December, certainly contributed to the success achieved in collection of this tax.
The ICMS is the tax with the highest level of participation in the Fiscal Load, with approximately 25% of the total. Levied on the circulation of goods and services, collection of this tax is powerfully impacted by macroeconomic performance. The joint effects of growth in aggregate demand and state government efforts to recover their respective tax structures have resulted in 6% real growth in total ICMS, compared to the previous year's inflow.
Contributions to the Social Security system (20% of CFB) are administered by the INSS and expanded 12% in real terms. The factors underlying this growth include not only macroeconomic performance, but also efforts to simplify and modernize inspection and charging systems, together with labor market improvements. This is evident in the positive balance of job creation and higher average real wages for those employed in the formal job market.
An important fact that also deserves underscoring was the January 13, 1996 publication of Law no. 87. On altering ICMS legislation, this instrument sought to improve the competitive conditions of the Brazilian export sector, with positive repercussions on the trade balance. The major alterations that will most likely affect the Tax Load in coming years are as follows:
suspension of the ICMS on operations involving sales of primary goods and
semimanufactured industrialized products on the international market, effective as of 09/13/96;
right to a credit corresponding to the ICMS previously charged on
acquisitions of inputs utilized in the production of industrialized goods for export, including semimanufactured products, effective as of 09/13/96;
right to a credit corresponding to the ICMS previously charged on
acquisitions of goods to be incorporated into the fixed assets of the institution, effective as of 11/01/96;
right to a credit corresponding to the ICMS on electricity utilized or
consumed in that institution, effective as of 11/01/96; right to a credit corresponding to the ICMS previously charged on
acquisitions of goods to be used and consumed by the institution. 4. CLASSIFICATION
In order to better understand the Fiscal Load concept, we have included a breakdown according to legal nature (tax, fee or contribution), levying (direct or indirect) and budget destination (fiscal or Social Security). Some of these concepts are controversial and, for this reason, we consider it convenient to indicate the criteria used for purposes of classifying each tax according to its characteristics.
• LEGAL NATURE
Extending the definitions contained in the CTN and Federal Constitution in such a way as to encompass social and economic contributions, FGTS and the Education Wage, a classification of revenues used in the determining the net fiscal load was elaborated, separating them into taxes, contributions or fees.
Taxes are revenues in which the generating facts do not depend on a specific activity of the state in relation to the taxpayer. The Constitution prohibits earmarking of taxes to specific entities, funds or expenditure headings, with the exception of distribution of the product of these taxes to the three levels of government.
Contrary to taxes, fees are generated by facts tied to a specific state activity, in relation to the taxpayer. This activity refers to the effective or potential utilization of public services or police power.
Just as in the case of taxes, the generating fact underlying contributions is not tied to the rendering of specific activities to taxpayers, though the product of contribution collections may be targeted to specific cost headings. Currently, almost all contribution revenues are channeled into Social Security financing.
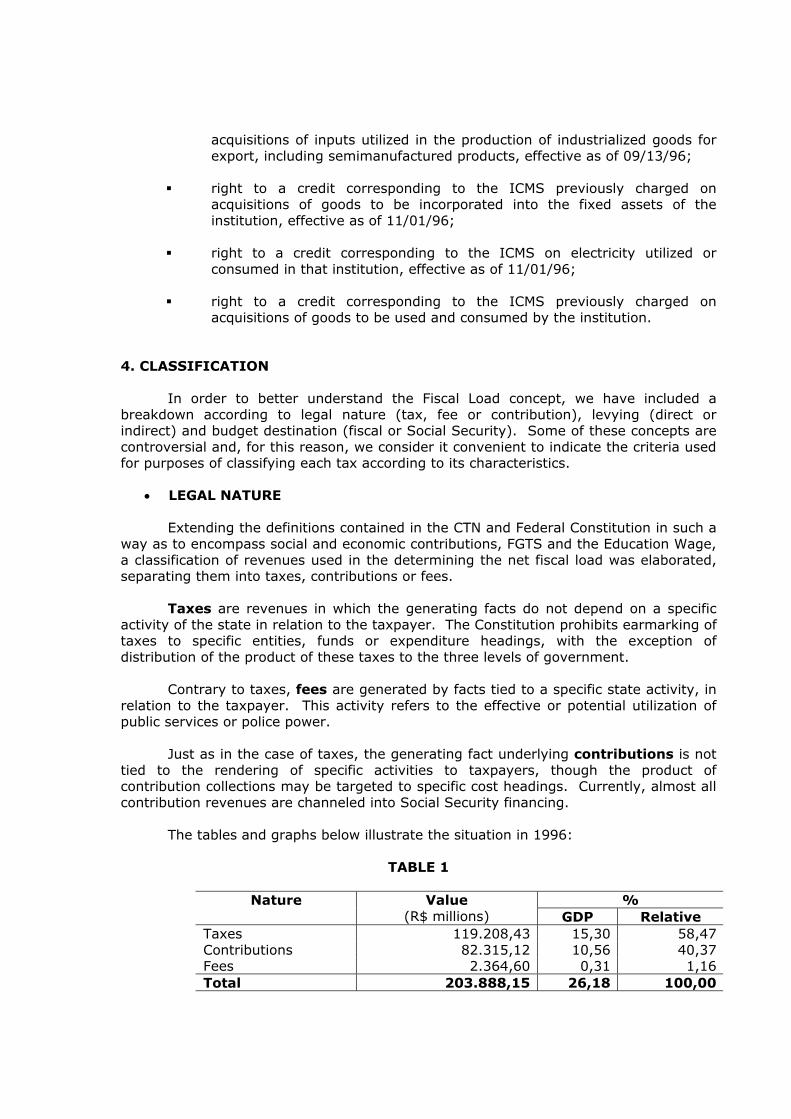
The tables and graphs below illustrate the situation in 1996:
TABLE 1
% Nature Value (R$ millions) GDP Relative
Taxes 119.208,43 15,30 58,47 Contributions 82.315,12 10,56 40,37 Fees 2.364,60 0,31 1,16 Total 203.888,15 26,18 100,00
N e t F i s c a l L o a d - L e g a l N a t u r e
• DIRECT X INDIRECT
Taxes and contributions can be classified as to whether they are levied directly on the income, proprietorship, property of the taxpayer or indirectly, on consumption, business operations and legal acts in general. In this concept, the taxes charged on merchandise and services (ICMS, IPI, ISS) are typically indirect. In contrast, we have the Income Tax, Social Contribution on Net Profits and taxes on property, considered direct taxation.
Even more subtle is the classification of COFINS and the contribution to PIS/PASEP which, since they are levied on revenues, sometimes have characteristics similar to those of the ICMS. In this study, both contributions were considered as indirect.
With these criteria, we have the following:
CLASSIFICATION OF THE CFL
ACCORDING TO TYPE OF LEVYING
DIRECT TAXES INDIRECT TAXES - INSS - ICMS - CSSL - IPI - IR - ISS - IPVA - Foreign Trade - IPTU - COFINS - ITBI - PIS/PASEP - Others - IOF
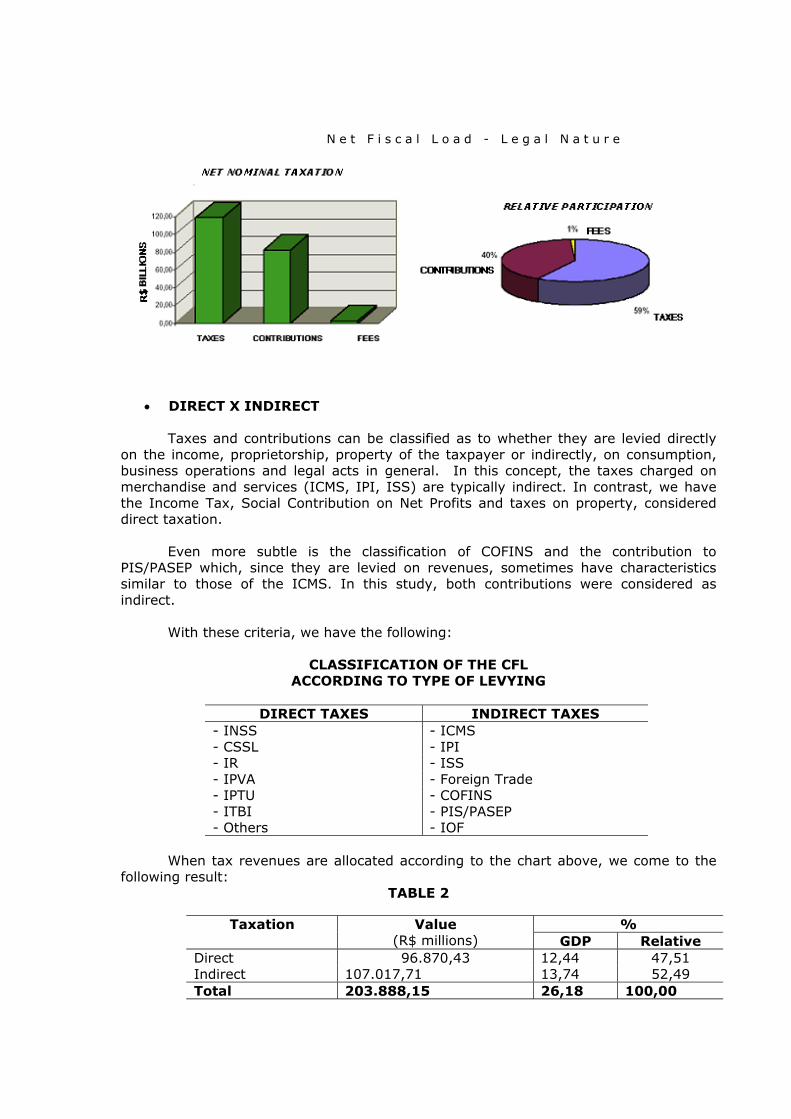
When tax revenues are allocated according to the chart above, we come to the
following result: TABLE 2
% Taxation Value
(R$ millions) GDP Relative Direct 96.870,43 12,44 47,51 Indirect 107.017,71 13,74 52,49 Total 203.888,15 26,18 100,00
DIRECT TAXATION X INDIRECT TAXATION
• FISCAL X SOCIAL SECURITY
According to the constitutional text, the Social Security System encompasses an
integrated set of actions taken at the initiative of the governing authority and society and designed to ensure the right to health, social security coverage and social assistance. The resources targeted to this end are composed basically of contribution revenues and must be individualized in the elaboration of the general budget.
Consequently, federal government revenues can also be included according to their budget objective or, in other words, fiscal or social security. Therefore, under the heading of the Social Security budget, we would separate contributions targeted to the system's costs, from tax revenues with no specific earmarking (with the exception of constitutional transfers), classified as fiscal budget components.
FEDERAL GOVERNMENT REVENUES - BUDGET DESTINATION
FISCAL SOCIAL SECURITY - IR - INSS - IPI - COFINS - Foreign Trade - CSSL - IOF - PIS -Other taxes - Other Contributions
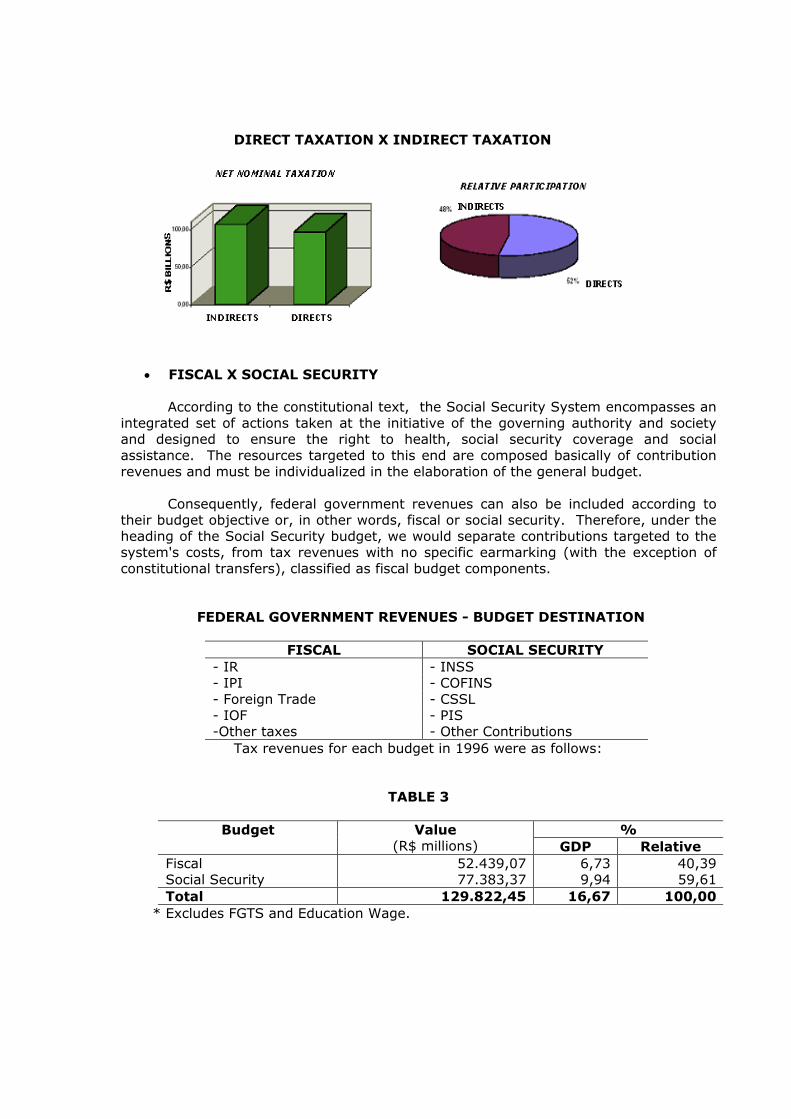
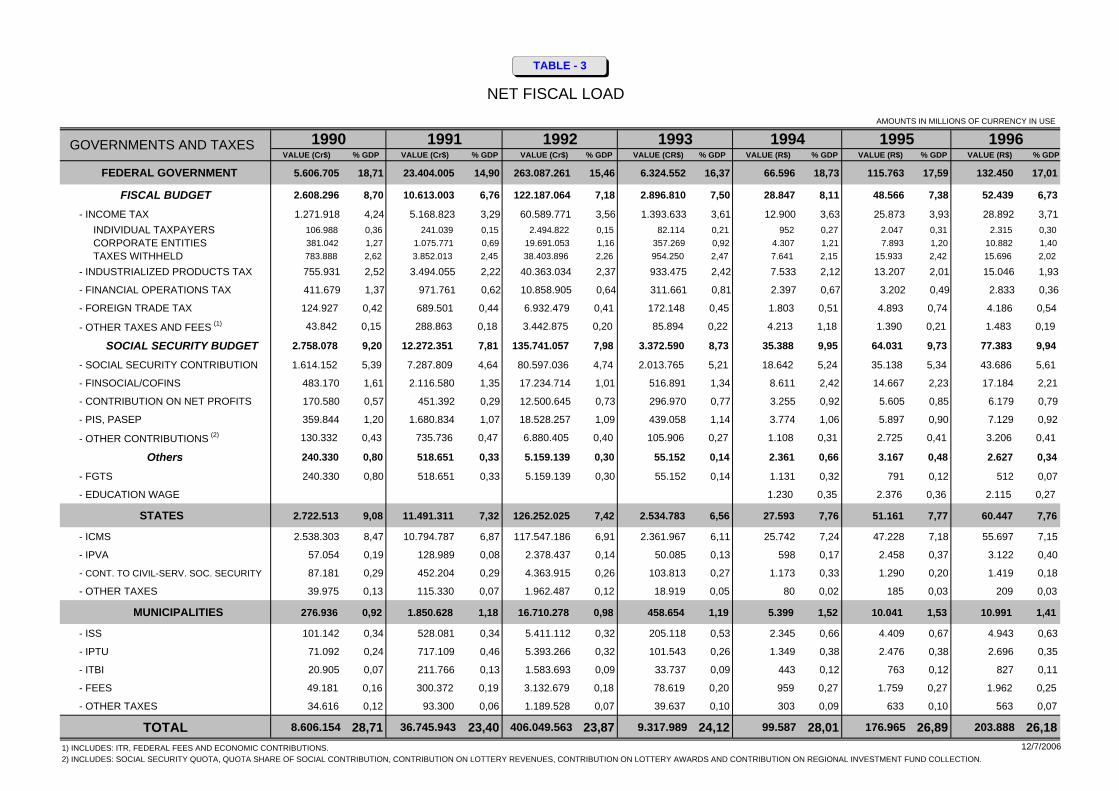
Tax revenues for each budget in 1996 were as follows:
TABLE 3
% Budget Value
(R$ millions) GDP Relative Fiscal 52.439,07 6,73 40,39 Social Security 77.383,37 9,94 59,61 Total 129.822,45 16,67 100,00
* Excludes FGTS and Education Wage.
FEDERAL GOVERNMENT REVENUES – BUDGET CLASSIFICATION
STATES AND MUNICIPALITIES
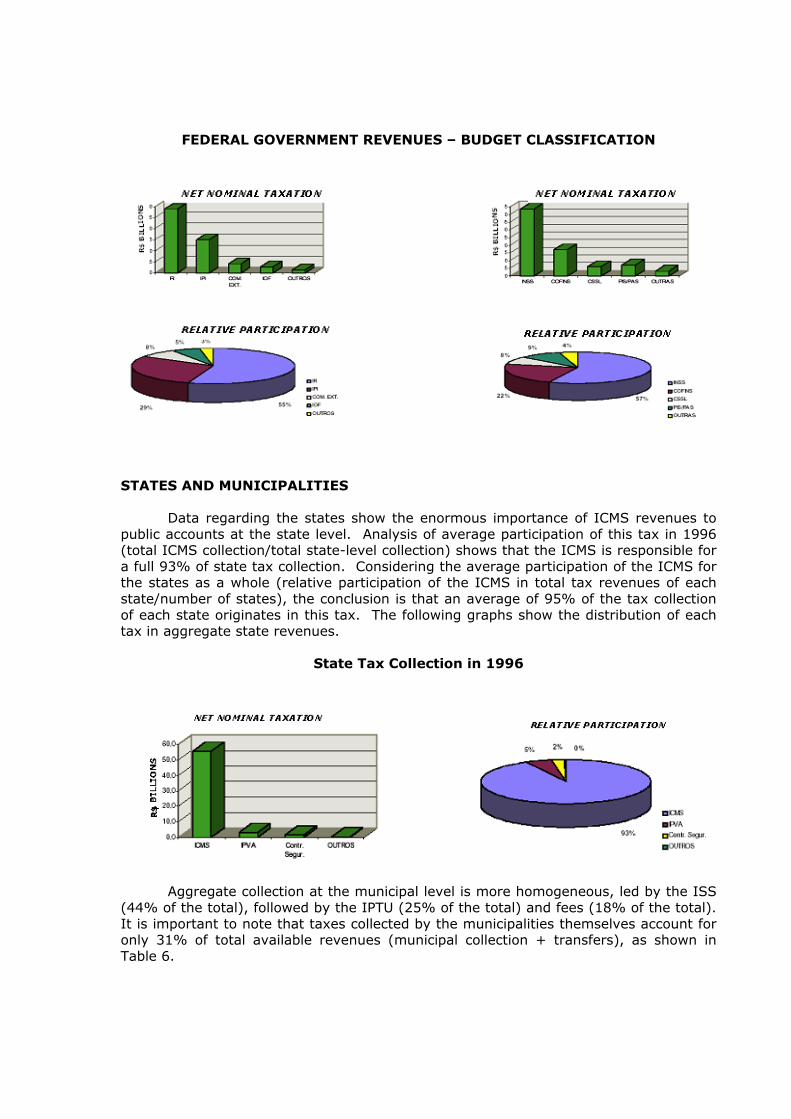
Data regarding the states show the enormous importance of ICMS revenues to public accounts at the state level. Analysis of average participation of this tax in 1996 (total ICMS collection/total state-level collection) shows that the ICMS is responsible for a full 93% of state tax collection. Considering the average participation of the ICMS for the states as a whole (relative participation of the ICMS in total tax revenues of each state/number of states), the conclusion is that an average of 95% of the tax collection of each state originates in this tax. The following graphs show the distribution of each tax in aggregate state revenues.
State Tax Collection in 1996
Aggregate collection at the municipal level is more homogeneous, led by the ISS
(44% of the total), followed by the IPTU (25% of the total) and fees (18% of the total). It is important to note that taxes collected by the municipalities themselves account for only 31% of total available revenues (municipal collection + transfers), as shown in Table 6.
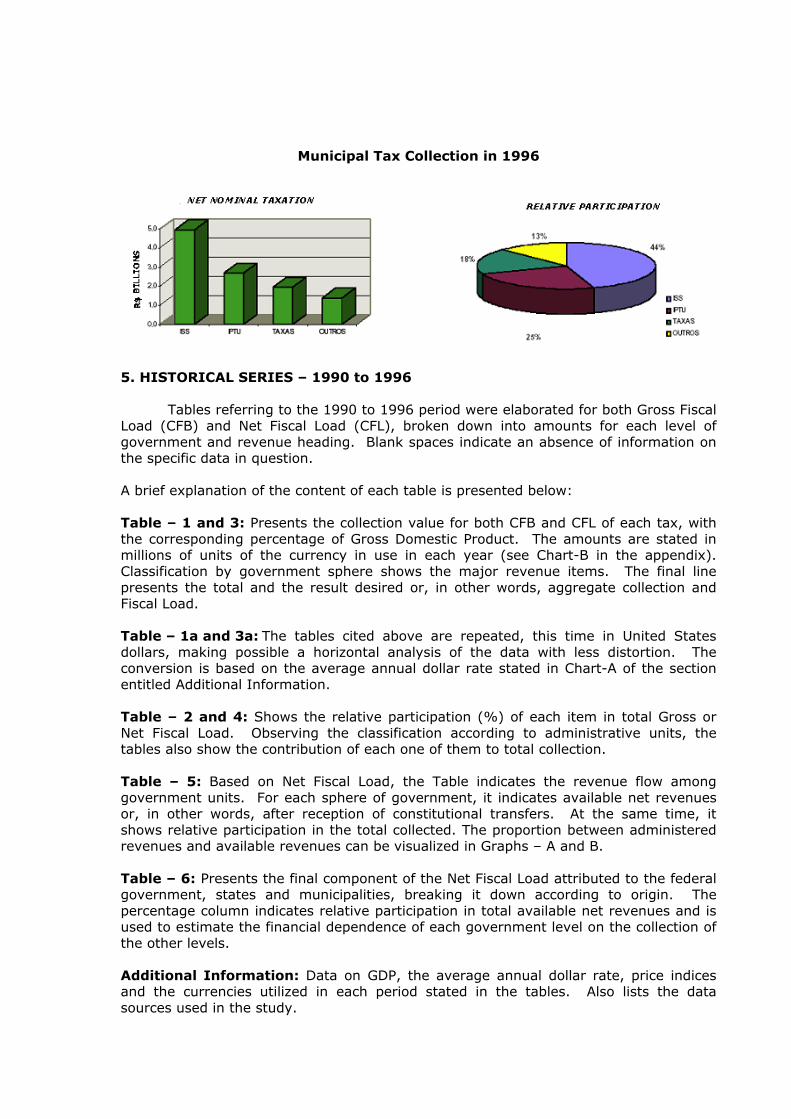
Municipal Tax Collection in 1996
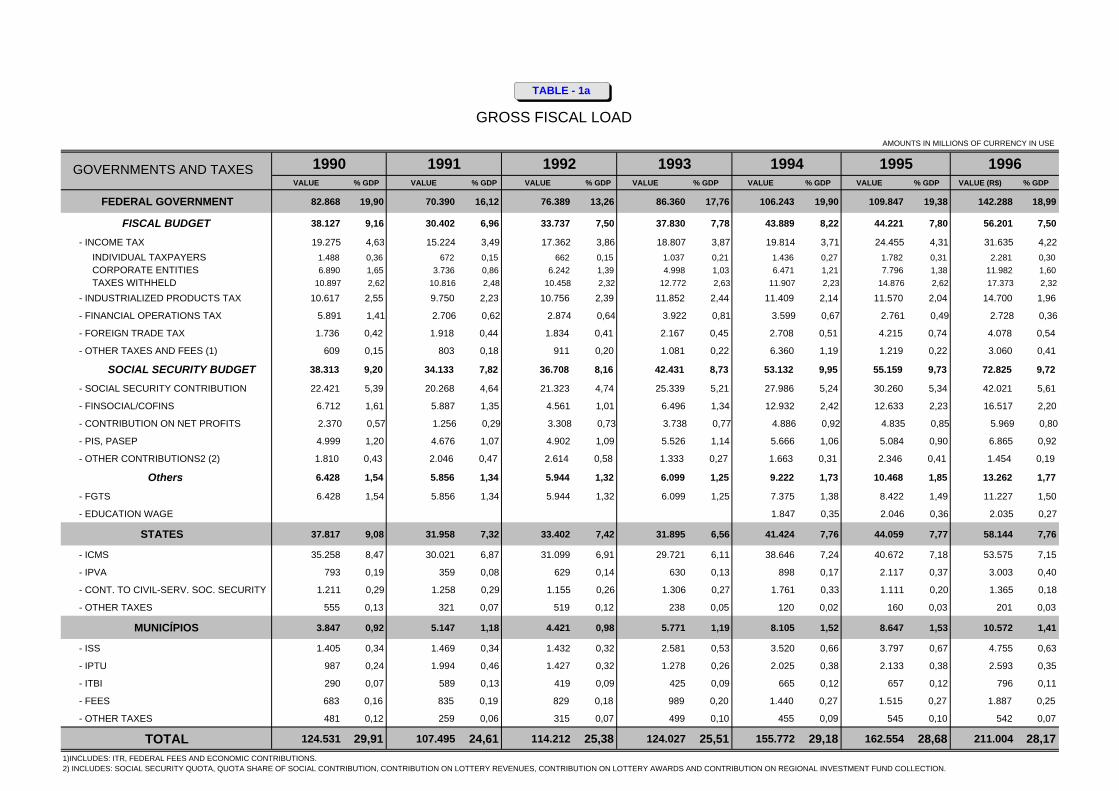
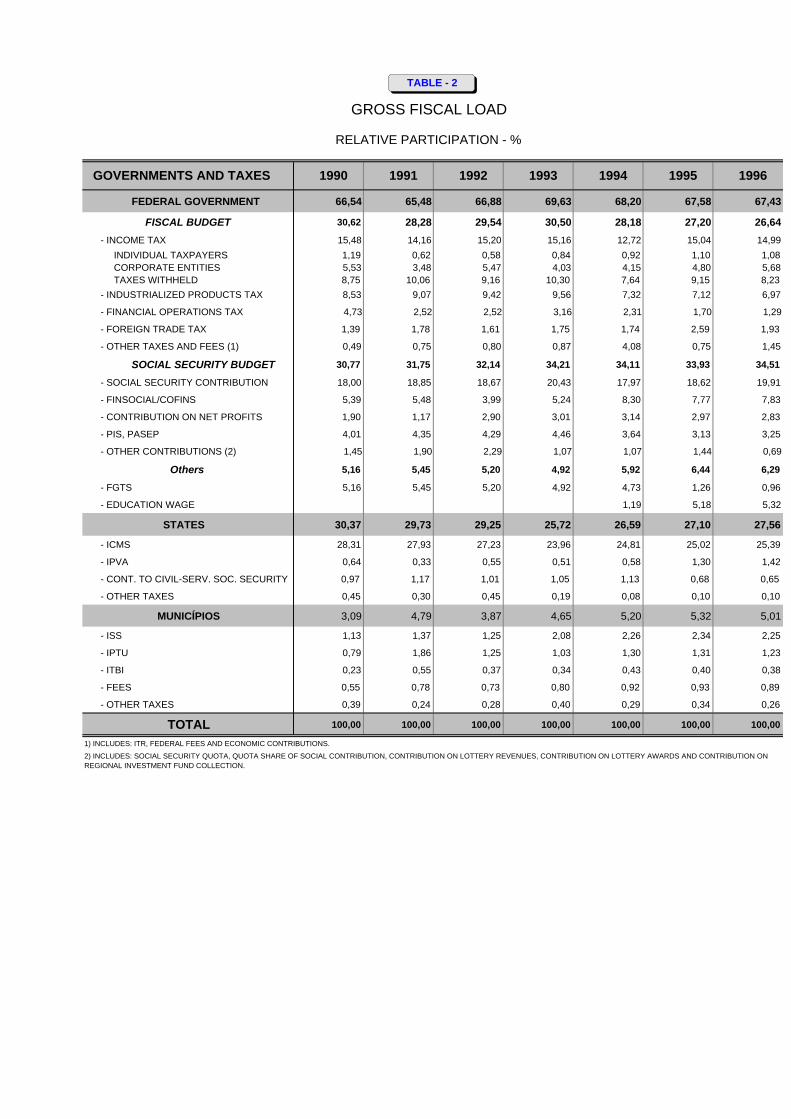
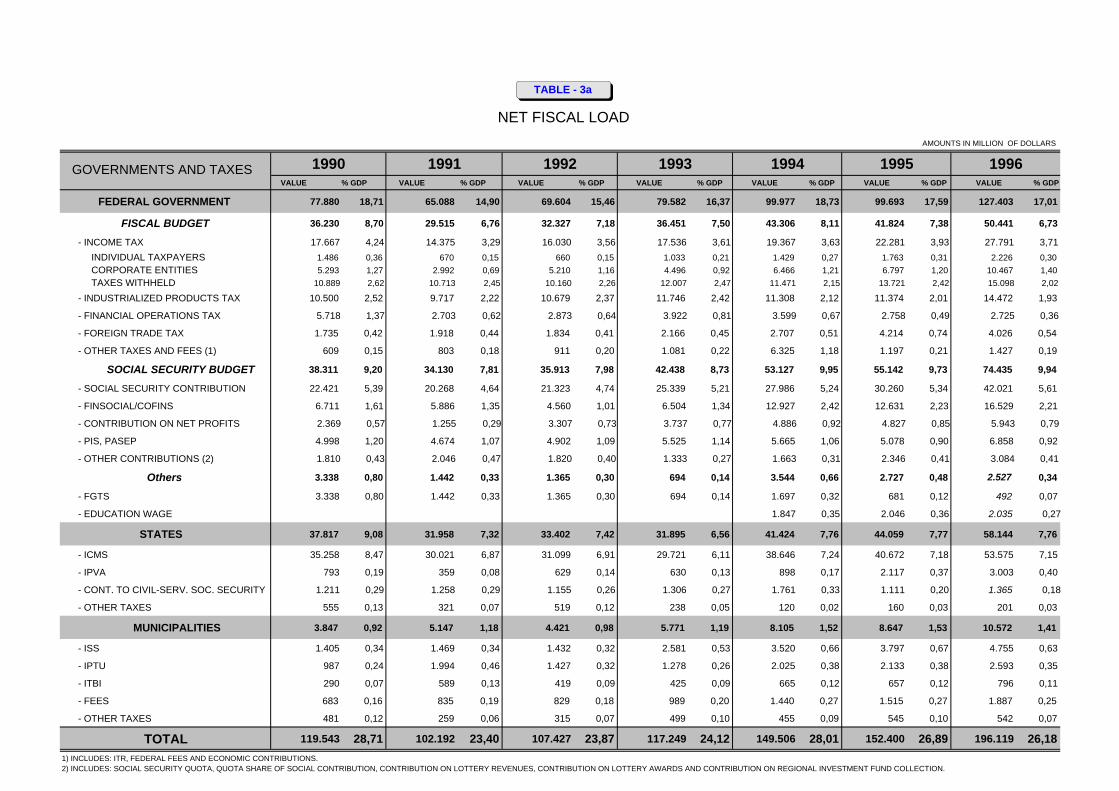
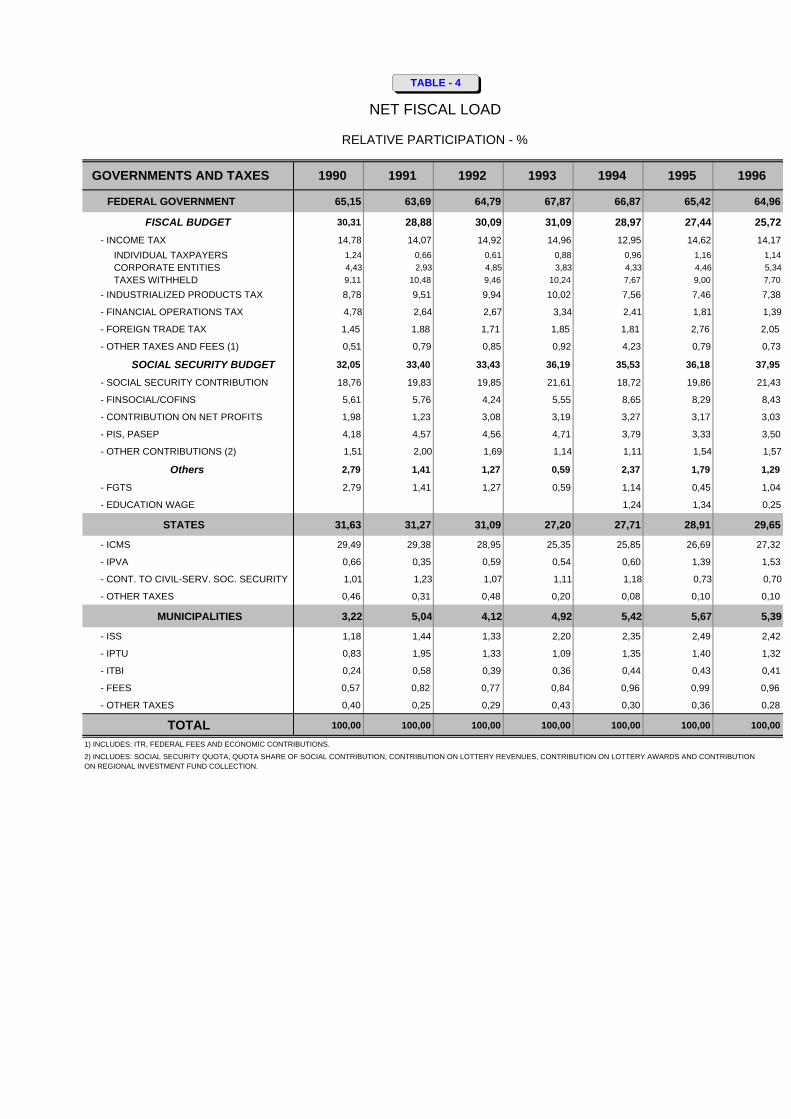
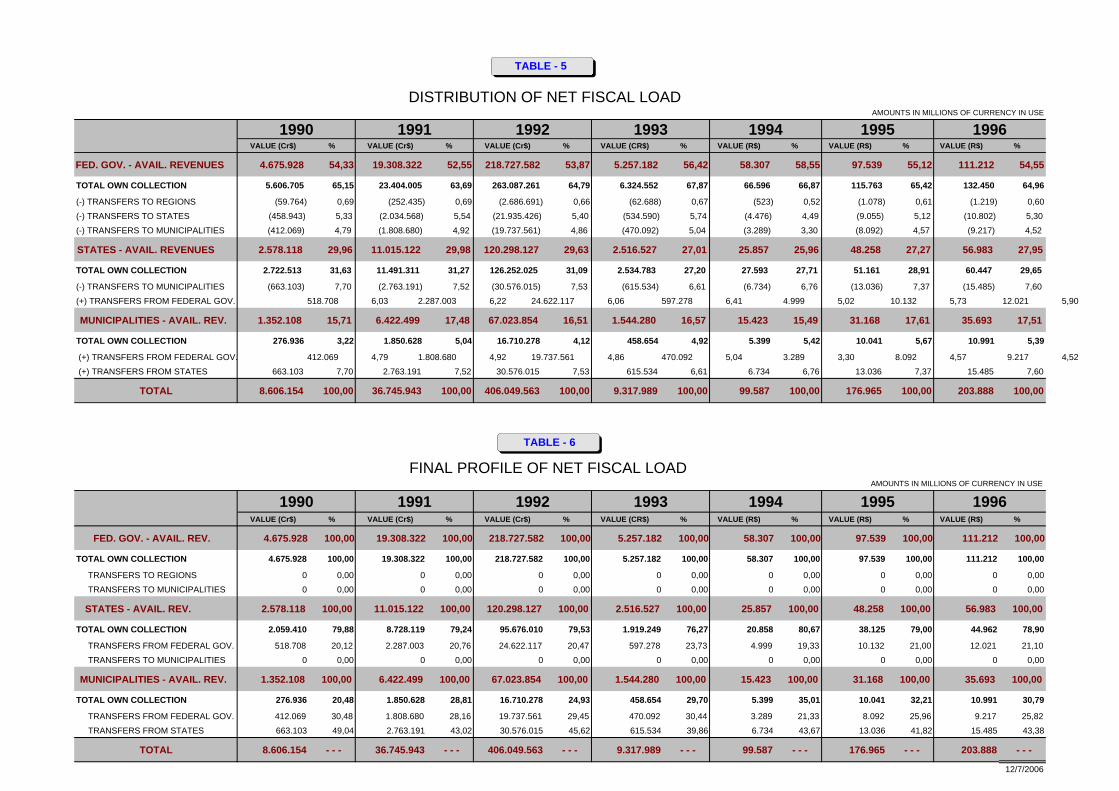
5. HISTORICAL SERIES – 1990 to 1996
Tables referring to the 1990 to 1996 period were elaborated for both Gross Fiscal Load (CFB) and Net Fiscal Load (CFL), broken down into amounts for each level of government and revenue heading. Blank spaces indicate an absence of information on the specific data in question. A brief explanation of the content of each table is presented below: Table – 1 and 3: Presents the collection value for both CFB and CFL of each tax, with the corresponding percentage of Gross Domestic Product. The amounts are stated in millions of units of the currency in use in each year (see Chart-B in the appendix). Classification by government sphere shows the major revenue items. The final line presents the total and the result desired or, in other words, aggregate collection and Fiscal Load. Table – 1a and 3a: The tables cited above are repeated, this time in United States dollars, making possible a horizontal analysis of the data with less distortion. The conversion is based on the average annual dollar rate stated in Chart-A of the section entitled Additional Information. Table – 2 and 4: Shows the relative participation (%) of each item in total Gross or Net Fiscal Load. Observing the classification according to administrative units, the tables also show the contribution of each one of them to total collection. Table – 5: Based on Net Fiscal Load, the Table indicates the revenue flow among government units. For each sphere of government, it indicates available net revenues or, in other words, after reception of constitutional transfers. At the same time, it shows relative participation in the total collected. The proportion between administered revenues and available revenues can be visualized in Graphs – A and B. Table – 6: Presents the final component of the Net Fiscal Load attributed to the federal government, states and municipalities, breaking it down according to origin. The percentage column indicates relative participation in total available net revenues and is used to estimate the financial dependence of each government level on the collection of the other levels. Additional Information: Data on GDP, the average annual dollar rate, price indices and the currencies utilized in each period stated in the tables. Also lists the data sources used in the study.

Notes: 1. Due to the difficulties involved in obtaining information on municipal tax
collection for financing of Social Security and on the income tax withheld by the states, municipalities and Federal District, as well as by their semiautonomous agencies and foundations, Fiscal Load does not include these revenues.
2. For the 1993-1996 period, the appendix includes the State Tax Load and a comparative table of state collection with federal taxes collected in the respective state.
Appendix - State Tax Load 1993 to 1996. - State Collection x Federal Collection.
- TABLES AND GRAPHS -
Gross Fiscal Load 1990 – 1996
- TABLE 1 Gross Tax Load in Currency in Use - TABLE 1a Gross Tax Load in American Dollars - TABLE 2 Relative Participation (%) - GRAPH I Gross Tax Load
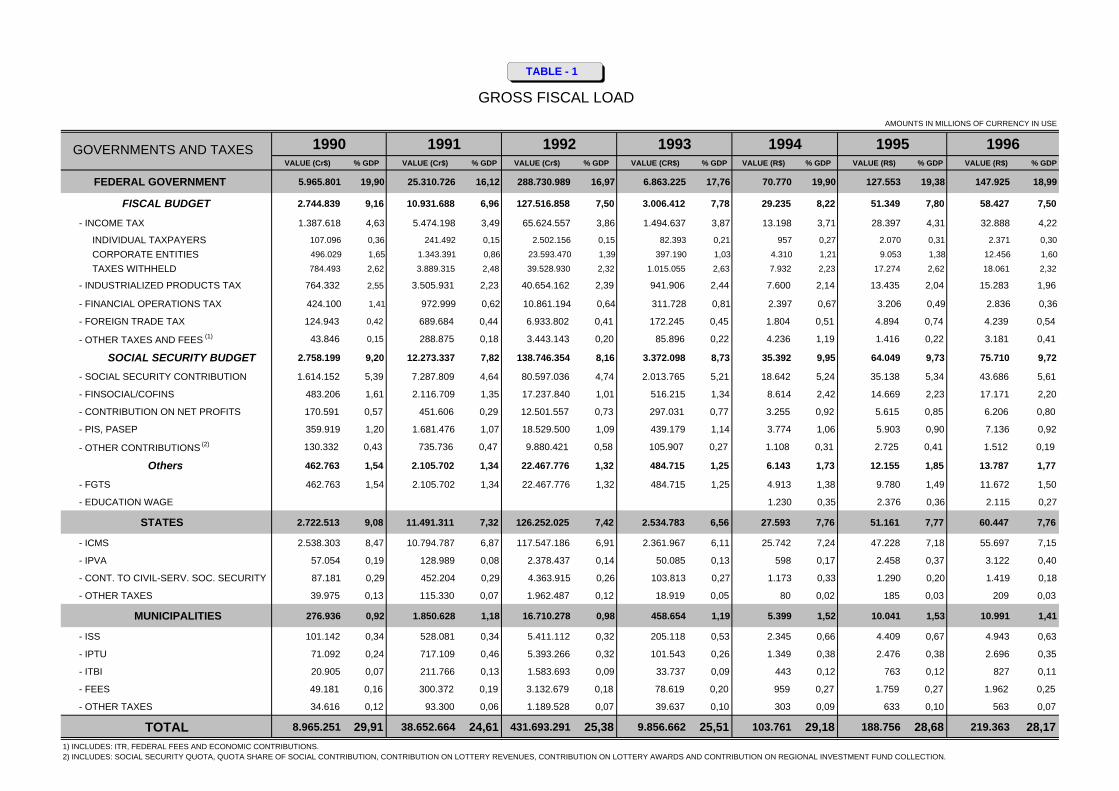
GROSS FISCAL LOAD
AMOUNTS IN MILLIONS OF CURRENCY IN USE
1990 1991 1992 1993 1994 1995 1996VALUE (Cr$) % GDP VALUE (Cr$) % GDP VALUE (Cr$) % GDP VALUE (CR$) % GDP VALUE (R$) % GDP VALUE (R$) % GDP VALUE (R$) % GDP
FEDERAL GOVERNMENT 5.965.801 19,90 25.310.726 16,12 288.730.989 16,97 6.863.225 17,76 70.770 19,90 127.553 19,38 147.925 18,99
FISCAL BUDGET 2.744.839 9,16 10.931.688 6,96 127.516.858 7,50 3.006.412 7,78 29.235 8,22 51.349 7,80 58.427 7,50
- INCOME TAX 1.387.618 4,63 5.474.198 3,49 65.624.557 3,86 1.494.637 3,87 13.198 3,71 28.397 4,31 32.888 4,22
INDIVIDUAL TAXPAYERS 107.096 0,36 241.492 0,15 2.502.156 0,15 82.393 0,21 957 0,27 2.070 0,31 2.371 0,30
CORPORATE ENTITIES 496.029 1,65 1.343.391 0,86 23.593.470 1,39 397.190 1,03 4.310 1,21 9.053 1,38 12.456 1,60
TAXES WITHHELD 784.493 2,62 3.889.315 2,48 39.528.930 2,32 1.015.055 2,63 7.932 2,23 17.274 2,62 18.061 2,32
- INDUSTRIALIZED PRODUCTS TAX 764.332 2,55 3.505.931 2,23 40.654.162 2,39 941.906 2,44 7.600 2,14 13.435 2,04 15.283 1,96
- FINANCIAL OPERATIONS TAX 424.100 1,41 972.999 0,62 10.861.194 0,64 311.728 0,81 2.397 0,67 3.206 0,49 2.836 0,36
- FOREIGN TRADE TAX 124.943 0,42 689.684 0,44 6.933.802 0,41 172.245 0,45 1.804 0,51 4.894 0,74 4.239 0,54
- OTHER TAXES AND FEES (1) 43.846 0,15 288.875 0,18 3.443.143 0,20 85.896 0,22 4.236 1,19 1.416 0,22 3.181 0,41
SOCIAL SECURITY BUDGET 2.758.199 9,20 12.273.337 7,82 138.746.354 8,16 3.372.098 8,73 35.392 9,95 64.049 9,73 75.710 9,72
- SOCIAL SECURITY CONTRIBUTION 1.614.152 5,39 7.287.809 4,64 80.597.036 4,74 2.013.765 5,21 18.642 5,24 35.138 5,34 43.686 5,61
- FINSOCIAL/COFINS 483.206 1,61 2.116.709 1,35 17.237.840 1,01 516.215 1,34 8.614 2,42 14.669 2,23 17.171 2,20
- CONTRIBUTION ON NET PROFITS 170.591 0,57 451.606 0,29 12.501.557 0,73 297.031 0,77 3.255 0,92 5.615 0,85 6.206 0,80
- PIS, PASEP 359.919 1,20 1.681.476 1,07 18.529.500 1,09 439.179 1,14 3.774 1,06 5.903 0,90 7.136 0,92
- OTHER CONTRIBUTIONS (2) 130.332 0,43 735.736 0,47 9.880.421 0,58 105.907 0,27 1.108 0,31 2.725 0,41 1.512 0,19
Others 462.763 1,54 2.105.702 1,34 22.467.776 1,32 484.715 1,25 6.143 1,73 12.155 1,85 13.787 1,77
- FGTS 462.763 1,54 2.105.702 1,34 22.467.776 1,32 484.715 1,25 4.913 1,38 9.780 1,49 11.672 1,50
- EDUCATION WAGE 1.230 0,35 2.376 0,36 2.115 0,27
STATES 2.722.513 9,08 11.491.311 7,32 126.252.025 7,42 2.534.783 6,56 27.593 7,76 51.161 7,77 60.447 7,76
- ICMS 2.538.303 8,47 10.794.787 6,87 117.547.186 6,91 2.361.967 6,11 25.742 7,24 47.228 7,18 55.697 7,15
- IPVA 57.054 0,19 128.989 0,08 2.378.437 0,14 50.085 0,13 598 0,17 2.458 0,37 3.122 0,40
- CONT. TO CIVIL-SERV. SOC. SECURITY 87.181 0,29 452.204 0,29 4.363.915 0,26 103.813 0,27 1.173 0,33 1.290 0,20 1.419 0,18
- OTHER TAXES 39.975 0,13 115.330 0,07 1.962.487 0,12 18.919 0,05 80 0,02 185 0,03 209 0,03
MUNICIPALITIES 276.936 0,92 1.850.628 1,18 16.710.278 0,98 458.654 1,19 5.399 1,52 10.041 1,53 10.991 1,41
- ISS 101.142 0,34 528.081 0,34 5.411.112 0,32 205.118 0,53 2.345 0,66 4.409 0,67 4.943 0,63
- IPTU 71.092 0,24 717.109 0,46 5.393.266 0,32 101.543 0,26 1.349 0,38 2.476 0,38 2.696 0,35
- ITBI 20.905 0,07 211.766 0,13 1.583.693 0,09 33.737 0,09 443 0,12 763 0,12 827 0,11
- FEES 49.181 0,16 300.372 0,19 3.132.679 0,18 78.619 0,20 959 0,27 1.759 0,27 1.962 0,25
- OTHER TAXES 34.616 0,12 93.300 0,06 1.189.528 0,07 39.637 0,10 303 0,09 633 0,10 563 0,07
TOTAL 8.965.251 29,91 38.652.664 24,61 431.693.291 25,38 9.856.662 25,51 103.761 29,18 188.756 28,68 219.363 28,171) INCLUDES: ITR, FEDERAL FEES AND ECONOMIC CONTRIBUTIONS.2) INCLUDES: SOCIAL SECURITY QUOTA, QUOTA SHARE OF SOCIAL CONTRIBUTION, CONTRIBUTION ON LOTTERY REVENUES, CONTRIBUTION ON LOTTERY AWARDS AND CONTRIBUTION ON REGIONAL INVESTMENT FUND COLLECTION.
GOVERNMENTS AND TAXES
TABLE - 1
GROSS FISCAL LOAD
AMOUNTS IN MILLIONS OF CURRENCY IN USE
1990 1991 1992 1993 1994 1995 1996VALUE % GDP VALUE % GDP VALUE % GDP VALUE % GDP VALUE % GDP VALUE % GDP VALUE (R$) % GDP
FEDERAL GOVERNMENT 82.868 19,90 70.390 16,12 76.389 13,26 86.360 17,76 106.243 19,90 109.847 19,38 142.288 18,99
FISCAL BUDGET 38.127 9,16 30.402 6,96 33.737 7,50 37.830 7,78 43.889 8,22 44.221 7,80 56.201 7,50
- INCOME TAX 19.275 4,63 15.224 3,49 17.362 3,86 18.807 3,87 19.814 3,71 24.455 4,31 31.635 4,22 INDIVIDUAL TAXPAYERS 1.488 0,36 672 0,15 662 0,15 1.037 0,21 1.436 0,27 1.782 0,31 2.281 0,30 CORPORATE ENTITIES 6.890 1,65 3.736 0,86 6.242 1,39 4.998 1,03 6.471 1,21 7.796 1,38 11.982 1,60 TAXES WITHHELD 10.897 2,62 10.816 2,48 10.458 2,32 12.772 2,63 11.907 2,23 14.876 2,62 17.373 2,32
- INDUSTRIALIZED PRODUCTS TAX 10.617 2,55 9.750 2,23 10.756 2,39 11.852 2,44 11.409 2,14 11.570 2,04 14.700 1,96
- FINANCIAL OPERATIONS TAX 5.891 1,41 2.706 0,62 2.874 0,64 3.922 0,81 3.599 0,67 2.761 0,49 2.728 0,36
- FOREIGN TRADE TAX 1.736 0,42 1.918 0,44 1.834 0,41 2.167 0,45 2.708 0,51 4.215 0,74 4.078 0,54
- OTHER TAXES AND FEES (1) 609 0,15 803 0,18 911 0,20 1.081 0,22 6.360 1,19 1.219 0,22 3.060 0,41
SOCIAL SECURITY BUDGET 38.313 9,20 34.133 7,82 36.708 8,16 42.431 8,73 53.132 9,95 55.159 9,73 72.825 9,72
- SOCIAL SECURITY CONTRIBUTION 22.421 5,39 20.268 4,64 21.323 4,74 25.339 5,21 27.986 5,24 30.260 5,34 42.021 5,61
- FINSOCIAL/COFINS 6.712 1,61 5.887 1,35 4.561 1,01 6.496 1,34 12.932 2,42 12.633 2,23 16.517 2,20
- CONTRIBUTION ON NET PROFITS 2.370 0,57 1.256 0,29 3.308 0,73 3.738 0,77 4.886 0,92 4.835 0,85 5.969 0,80
- PIS, PASEP 4.999 1,20 4.676 1,07 4.902 1,09 5.526 1,14 5.666 1,06 5.084 0,90 6.865 0,92
- OTHER CONTRIBUTIONS2 (2) 1.810 0,43 2.046 0,47 2.614 0,58 1.333 0,27 1.663 0,31 2.346 0,41 1.454 0,19
Others 6.428 1,54 5.856 1,34 5.944 1,32 6.099 1,25 9.222 1,73 10.468 1,85 13.262 1,77
- FGTS 6.428 1,54 5.856 1,34 5.944 1,32 6.099 1,25 7.375 1,38 8.422 1,49 11.227 1,50
- EDUCATION WAGE 1.847 0,35 2.046 0,36 2.035 0,27
STATES 37.817 9,08 31.958 7,32 33.402 7,42 31.895 6,56 41.424 7,76 44.059 7,77 58.144 7,76
- ICMS 35.258 8,47 30.021 6,87 31.099 6,91 29.721 6,11 38.646 7,24 40.672 7,18 53.575 7,15
- IPVA 793 0,19 359 0,08 629 0,14 630 0,13 898 0,17 2.117 0,37 3.003 0,40
- CONT. TO CIVIL-SERV. SOC. SECURITY 1.211 0,29 1.258 0,29 1.155 0,26 1.306 0,27 1.761 0,33 1.111 0,20 1.365 0,18
- OTHER TAXES 555 0,13 321 0,07 519 0,12 238 0,05 120 0,02 160 0,03 201 0,03
MUNICÍPIOS 3.847 0,92 5.147 1,18 4.421 0,98 5.771 1,19 8.105 1,52 8.647 1,53 10.572 1,41
- ISS 1.405 0,34 1.469 0,34 1.432 0,32 2.581 0,53 3.520 0,66 3.797 0,67 4.755 0,63
- IPTU 987 0,24 1.994 0,46 1.427 0,32 1.278 0,26 2.025 0,38 2.133 0,38 2.593 0,35
- ITBI 290 0,07 589 0,13 419 0,09 425 0,09 665 0,12 657 0,12 796 0,11
- FEES 683 0,16 835 0,19 829 0,18 989 0,20 1.440 0,27 1.515 0,27 1.887 0,25
- OTHER TAXES 481 0,12 259 0,06 315 0,07 499 0,10 455 0,09 545 0,10 542 0,07
TOTAL 124.531 29,91 107.495 24,61 114.212 25,38 124.027 25,51 155.772 29,18 162.554 28,68 211.004 28,171)INCLUDES: ITR, FEDERAL FEES AND ECONOMIC CONTRIBUTIONS. 2) INCLUDES: SOCIAL SECURITY QUOTA, QUOTA SHARE OF SOCIAL CONTRIBUTION, CONTRIBUTION ON LOTTERY REVENUES, CONTRIBUTION ON LOTTERY AWARDS AND CONTRIBUTION ON REGIONAL INVESTMENT FUND COLLECTION.
GOVERNMENTS AND TAXES
TABLE - 1a
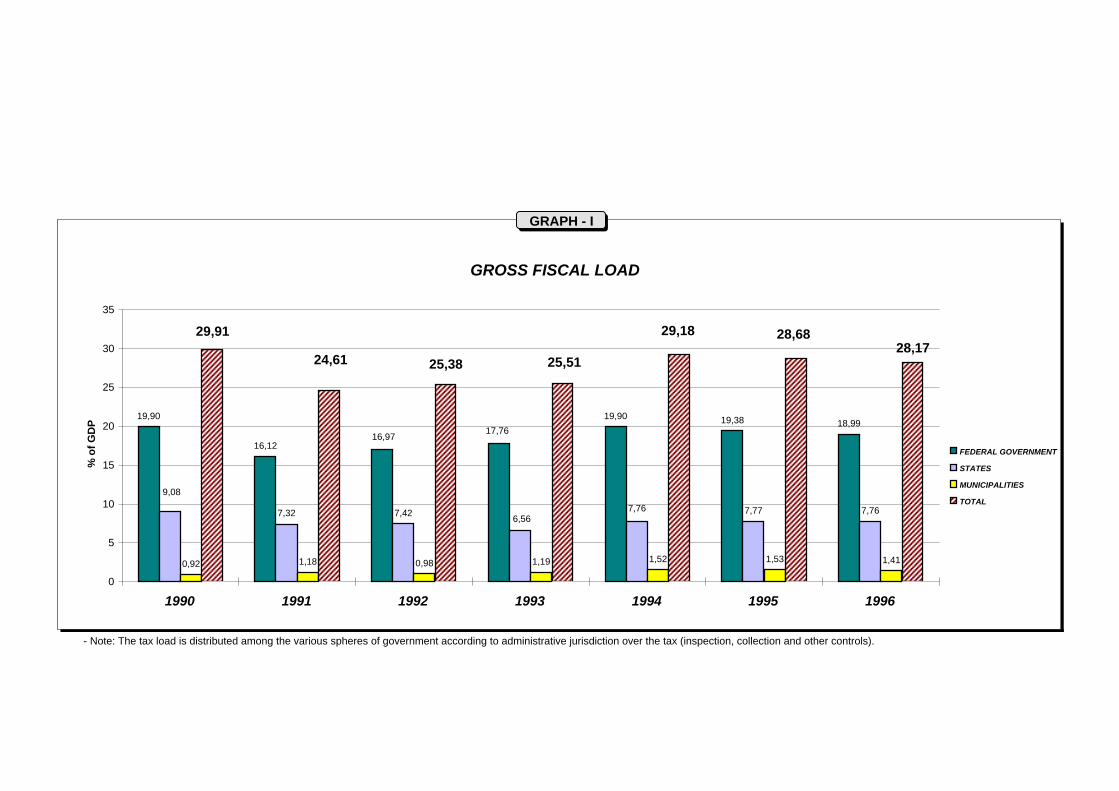
- Note: The tax load is distributed among the various spheres of government according to administrative jurisdiction over the tax (inspection, collection and other controls).
GROSS FISCAL LOAD
19,90
16,12
19,90 19,38 18,99
7,42 7,77 7,76
0,92 1,18 0,98 1,19 1,52 1,53 1,41
28,17
16,97 17,76
9,08
7,767,32 6,56
28,6829,18
24,61 25,38 25,51
29,91
0
5
10
15
20
25
30
35
1990 1991 1992 1993 1994 1995 1996
% o
f G
DP
FEDERAL GOVERNMENT
STATES
MUNICIPALITIES
TOTAL
GRAPH - I
GROSS FISCAL LOAD
RELATIVE PARTICIPATION - %
GOVERNMENTS AND TAXES 1990 1991 1992 1993 1994 1995 1996
FEDERAL GOVERNMENT 66,54 65,48 66,88 69,63 68,20 67,58 67,43
FISCAL BUDGET 30,62 28,28 29,54 30,50 28,18 27,20 26,64 - INCOME TAX 15,48 14,16 15,20 15,16 12,72 15,04 14,99 INDIVIDUAL TAXPAYERS 1,19 0,62 0,58 0,84 0,92 1,10 1,08 CORPORATE ENTITIES 5,53 3,48 5,47 4,03 4,15 4,80 5,68 TAXES WITHHELD 8,75 10,06 9,16 10,30 7,64 9,15 8,23 - INDUSTRIALIZED PRODUCTS TAX 8,53 9,07 9,42 9,56 7,32 7,12 6,97
- FINANCIAL OPERATIONS TAX 4,73 2,52 2,52 3,16 2,31 1,70 1,29
- FOREIGN TRADE TAX 1,39 1,78 1,61 1,75 1,74 2,59 1,93
- OTHER TAXES AND FEES (1 ) 0,49 0,75 0,80 0,87 4,08 0,75 1,45
SOCIAL SECURITY BUDGET 30,77 31,75 32,14 34,21 34,11 33,93 34,51
- SOCIAL SECURITY CONTRIBUTION 18,00 18,85 18,67 20,43 17,97 18,62 19,91
- FINSOCIAL/COFINS 5,39 5,48 3,99 5,24 8,30 7,77 7,83
- CONTRIBUTION ON NET PROFITS 1,90 1,17 2,90 3,01 3,14 2,97 2,83
- PIS, PASEP 4,01 4,35 4,29 4,46 3,64 3,13 3,25
- OTHER CONTRIBUTIONS (2) 1,45 1,90 2,29 1,07 1,07 1,44 0,69
Others 5,16 5,45 5,20 4,92 5,92 6,44 6,29
- FGTS 5,16 5,45 5,20 4,92 4,73 1,26 0,96
- EDUCATION WAGE 1,19 5,18 5,32
STATES 30,37 29,73 29,25 25,72 26,59 27,10 27,56
- ICMS 28,31 27,93 27,23 23,96 24,81 25,02 25,39
- IPVA 0,64 0,33 0,55 0,51 0,58 1,30 1,42
- CONT. TO CIVIL-SERV. SOC. SECURITY 0,97 1,17 1,01 1,05 1,13 0,68 0,65
- OTHER TAXES 0,45 0,30 0,45 0,19 0,08 0,10 0,10
MUNICÍPIOS 3,09 4,79 3,87 4,65 5,20 5,32 5,01
- ISS 1,13 1,37 1,25 2,08 2,26 2,34 2,25
- IPTU 0,79 1,86 1,25 1,03 1,30 1,31 1,23
- ITBI 0,23 0,55 0,37 0,34 0,43 0,40 0,38
- FEES 0,55 0,78 0,73 0,80 0,92 0,93 0,89
- OTHER TAXES 0,39 0,24 0,28 0,40 0,29 0,34 0,26
TOTAL 100,00 100,00 100,00 100,00 100,00 100,00 100,00
1) INCLUDES: ITR, FEDERAL FEES AND ECONOMIC CONTRIBUTIONS.
2) INCLUDES: SOCIAL SECURITY QUOTA, QUOTA SHARE OF SOCIAL CONTRIBUTION, CONTRIBUTION ON LOTTERY REVENUES, CONTRIBUTION ON LOTTERY AWARDS AND CONTRIBUTION ON REGIONAL INVESTMENT FUND COLLECTION.
TABLE - 2
- TABLES AND GRAPHS -
∗ TABLE 3 Net Fiscal Load in Currency in Use
∗ TABLE 3a Net Fiscal Load in American Dollars
∗ TABLE 4 Relative Participation (%)
∗ TABLE 5 Distribution of Net Fiscal Load (currency in use)
∗ TABLE 6 Profile of Available Net Revenues (currency in use
∗ GRAPH II Net Fiscal Load
∗ GRAPH III Administration of Net Fiscal Load
∗ GRAPH IV Allocation of Net Fiscal Load
Net Fiscal Load
1990 - 1996
NET FISCAL LOAD
AMOUNTS IN MILLIONS OF CURRENCY IN USE
1990 1991 1992 1993 1994 1995 1996VALUE (Cr$) % GDP VALUE (Cr$) % GDP VALUE (Cr$) % GDP VALUE (CR$) % GDP VALUE (R$) % GDP VALUE (R$) % GDP VALUE (R$) % GDP
FEDERAL GOVERNMENT 5.606.705 18,71 23.404.005 14,90 263.087.261 15,46 6.324.552 16,37 66.596 18,73 115.763 17,59 132.450 17,01
FISCAL BUDGET 2.608.296 8,70 10.613.003 6,76 122.187.064 7,18 2.896.810 7,50 28.847 8,11 48.566 7,38 52.439 6,73
- INCOME TAX 1.271.918 4,24 5.168.823 3,29 60.589.771 3,56 1.393.633 3,61 12.900 3,63 25.873 3,93 28.892 3,71 INDIVIDUAL TAXPAYERS 106.988 0,36 241.039 0,15 2.494.822 0,15 82.114 0,21 952 0,27 2.047 0,31 2.315 0,30 CORPORATE ENTITIES 381.042 1,27 1.075.771 0,69 19.691.053 1,16 357.269 0,92 4.307 1,21 7.893 1,20 10.882 1,40 TAXES WITHHELD 783.888 2,62 3.852.013 2,45 38.403.896 2,26 954.250 2,47 7.641 2,15 15.933 2,42 15.696 2,02
- INDUSTRIALIZED PRODUCTS TAX 755.931 2,52 3.494.055 2,22 40.363.034 2,37 933.475 2,42 7.533 2,12 13.207 2,01 15.046 1,93
- FINANCIAL OPERATIONS TAX 411.679 1,37 971.761 0,62 10.858.905 0,64 311.661 0,81 2.397 0,67 3.202 0,49 2.833 0,36
- FOREIGN TRADE TAX 124.927 0,42 689.501 0,44 6.932.479 0,41 172.148 0,45 1.803 0,51 4.893 0,74 4.186 0,54
- OTHER TAXES AND FEES (1) 43.842 0,15 288.863 0,18 3.442.875 0,20 85.894 0,22 4.213 1,18 1.390 0,21 1.483 0,19
SOCIAL SECURITY BUDGET 2.758.078 9,20 12.272.351 7,81 135.741.057 7,98 3.372.590 8,73 35.388 9,95 64.031 9,73 77.383 9,94
- SOCIAL SECURITY CONTRIBUTION 1.614.152 5,39 7.287.809 4,64 80.597.036 4,74 2.013.765 5,21 18.642 5,24 35.138 5,34 43.686 5,61
- FINSOCIAL/COFINS 483.170 1,61 2.116.580 1,35 17.234.714 1,01 516.891 1,34 8.611 2,42 14.667 2,23 17.184 2,21
- CONTRIBUTION ON NET PROFITS 170.580 0,57 451.392 0,29 12.500.645 0,73 296.970 0,77 3.255 0,92 5.605 0,85 6.179 0,79
- PIS, PASEP 359.844 1,20 1.680.834 1,07 18.528.257 1,09 439.058 1,14 3.774 1,06 5.897 0,90 7.129 0,92
- OTHER CONTRIBUTIONS (2) 130.332 0,43 735.736 0,47 6.880.405 0,40 105.906 0,27 1.108 0,31 2.725 0,41 3.206 0,41
Others 240.330 0,80 518.651 0,33 5.159.139 0,30 55.152 0,14 2.361 0,66 3.167 0,48 2.627 0,34
- FGTS 240.330 0,80 518.651 0,33 5.159.139 0,30 55.152 0,14 1.131 0,32 791 0,12 512 0,07
- EDUCATION WAGE 1.230 0,35 2.376 0,36 2.115 0,27
STATES 2.722.513 9,08 11.491.311 7,32 126.252.025 7,42 2.534.783 6,56 27.593 7,76 51.161 7,77 60.447 7,76
- ICMS 2.538.303 8,47 10.794.787 6,87 117.547.186 6,91 2.361.967 6,11 25.742 7,24 47.228 7,18 55.697 7,15
- IPVA 57.054 0,19 128.989 0,08 2.378.437 0,14 50.085 0,13 598 0,17 2.458 0,37 3.122 0,40
- CONT. TO CIVIL-SERV. SOC. SECURITY 87.181 0,29 452.204 0,29 4.363.915 0,26 103.813 0,27 1.173 0,33 1.290 0,20 1.419 0,18
- OTHER TAXES 39.975 0,13 115.330 0,07 1.962.487 0,12 18.919 0,05 80 0,02 185 0,03 209 0,03
MUNICIPALITIES 276.936 0,92 1.850.628 1,18 16.710.278 0,98 458.654 1,19 5.399 1,52 10.041 1,53 10.991 1,41
- ISS 101.142 0,34 528.081 0,34 5.411.112 0,32 205.118 0,53 2.345 0,66 4.409 0,67 4.943 0,63
- IPTU 71.092 0,24 717.109 0,46 5.393.266 0,32 101.543 0,26 1.349 0,38 2.476 0,38 2.696 0,35
- ITBI 20.905 0,07 211.766 0,13 1.583.693 0,09 33.737 0,09 443 0,12 763 0,12 827 0,11
- FEES 49.181 0,16 300.372 0,19 3.132.679 0,18 78.619 0,20 959 0,27 1.759 0,27 1.962 0,25
- OTHER TAXES 34.616 0,12 93.300 0,06 1.189.528 0,07 39.637 0,10 303 0,09 633 0,10 563 0,07
TOTAL 8.606.154 28,71 36.745.943 23,40 406.049.563 23,87 9.317.989 24,12 99.587 28,01 176.965 26,89 203.888 26,181) INCLUDES: ITR, FEDERAL FEES AND ECONOMIC CONTRIBUTIONS. 12/7/20062) INCLUDES: SOCIAL SECURITY QUOTA, QUOTA SHARE OF SOCIAL CONTRIBUTION, CONTRIBUTION ON LOTTERY REVENUES, CONTRIBUTION ON LOTTERY AWARDS AND CONTRIBUTION ON REGIONAL INVESTMENT FUND COLLECTION.
GOVERNMENTS AND TAXES
TABLE - 3
NET FISCAL LOAD
AMOUNTS IN MILLION OF DOLLARS
1990 1991 1992 1993 1994 1995 1996VALUE % GDP VALUE % GDP VALUE % GDP VALUE % GDP VALUE % GDP VALUE % GDP VALUE % GDP
FEDERAL GOVERNMENT 77.880 18,71 65.088 14,90 69.604 15,46 79.582 16,37 99.977 18,73 99.693 17,59 127.403 17,01
FISCAL BUDGET 36.230 8,70 29.515 6,76 32.327 7,18 36.451 7,50 43.306 8,11 41.824 7,38 50.441 6,73
- INCOME TAX 17.667 4,24 14.375 3,29 16.030 3,56 17.536 3,61 19.367 3,63 22.281 3,93 27.791 3,71 INDIVIDUAL TAXPAYERS 1.486 0,36 670 0,15 660 0,15 1.033 0,21 1.429 0,27 1.763 0,31 2.226 0,30 CORPORATE ENTITIES 5.293 1,27 2.992 0,69 5.210 1,16 4.496 0,92 6.466 1,21 6.797 1,20 10.467 1,40 TAXES WITHHELD 10.889 2,62 10.713 2,45 10.160 2,26 12.007 2,47 11.471 2,15 13.721 2,42 15.098 2,02
- INDUSTRIALIZED PRODUCTS TAX 10.500 2,52 9.717 2,22 10.679 2,37 11.746 2,42 11.308 2,12 11.374 2,01 14.472 1,93
- FINANCIAL OPERATIONS TAX 5.718 1,37 2.703 0,62 2.873 0,64 3.922 0,81 3.599 0,67 2.758 0,49 2.725 0,36
- FOREIGN TRADE TAX 1.735 0,42 1.918 0,44 1.834 0,41 2.166 0,45 2.707 0,51 4.214 0,74 4.026 0,54
- OTHER TAXES AND FEES (1) 609 0,15 803 0,18 911 0,20 1.081 0,22 6.325 1,18 1.197 0,21 1.427 0,19
SOCIAL SECURITY BUDGET 38.311 9,20 34.130 7,81 35.913 7,98 42.438 8,73 53.127 9,95 55.142 9,73 74.435 9,94
- SOCIAL SECURITY CONTRIBUTION 22.421 5,39 20.268 4,64 21.323 4,74 25.339 5,21 27.986 5,24 30.260 5,34 42.021 5,61
- FINSOCIAL/COFINS 6.711 1,61 5.886 1,35 4.560 1,01 6.504 1,34 12.927 2,42 12.631 2,23 16.529 2,21
- CONTRIBUTION ON NET PROFITS 2.369 0,57 1.255 0,29 3.307 0,73 3.737 0,77 4.886 0,92 4.827 0,85 5.943 0,79
- PIS, PASEP 4.998 1,20 4.674 1,07 4.902 1,09 5.525 1,14 5.665 1,06 5.078 0,90 6.858 0,92
- OTHER CONTRIBUTIONS (2) 1.810 0,43 2.046 0,47 1.820 0,40 1.333 0,27 1.663 0,31 2.346 0,41 3.084 0,41
Others 3.338 0,80 1.442 0,33 1.365 0,30 694 0,14 3.544 0,66 2.727 0,48 2.527 0,34
- FGTS 3.338 0,80 1.442 0,33 1.365 0,30 694 0,14 1.697 0,32 681 0,12 492 0,07
- EDUCATION WAGE 1.847 0,35 2.046 0,36 2.035 0,27
STATES 37.817 9,08 31.958 7,32 33.402 7,42 31.895 6,56 41.424 7,76 44.059 7,77 58.144 7,76
- ICMS 35.258 8,47 30.021 6,87 31.099 6,91 29.721 6,11 38.646 7,24 40.672 7,18 53.575 7,15
- IPVA 793 0,19 359 0,08 629 0,14 630 0,13 898 0,17 2.117 0,37 3.003 0,40
- CONT. TO CIVIL-SERV. SOC. SECURITY 1.211 0,29 1.258 0,29 1.155 0,26 1.306 0,27 1.761 0,33 1.111 0,20 1.365 0,18
- OTHER TAXES 555 0,13 321 0,07 519 0,12 238 0,05 120 0,02 160 0,03 201 0,03
MUNICIPALITIES 3.847 0,92 5.147 1,18 4.421 0,98 5.771 1,19 8.105 1,52 8.647 1,53 10.572 1,41
- ISS 1.405 0,34 1.469 0,34 1.432 0,32 2.581 0,53 3.520 0,66 3.797 0,67 4.755 0,63
- IPTU 987 0,24 1.994 0,46 1.427 0,32 1.278 0,26 2.025 0,38 2.133 0,38 2.593 0,35
- ITBI 290 0,07 589 0,13 419 0,09 425 0,09 665 0,12 657 0,12 796 0,11
- FEES 683 0,16 835 0,19 829 0,18 989 0,20 1.440 0,27 1.515 0,27 1.887 0,25
- OTHER TAXES 481 0,12 259 0,06 315 0,07 499 0,10 455 0,09 545 0,10 542 0,07
TOTAL 119.543 28,71 102.192 23,40 107.427 23,87 117.249 24,12 149.506 28,01 152.400 26,89 196.119 26,181) INCLUDES: ITR, FEDERAL FEES AND ECONOMIC CONTRIBUTIONS.2) INCLUDES: SOCIAL SECURITY QUOTA, QUOTA SHARE OF SOCIAL CONTRIBUTION, CONTRIBUTION ON LOTTERY REVENUES, CONTRIBUTION ON LOTTERY AWARDS AND CONTRIBUTION ON REGIONAL INVESTMENT FUND COLLECTION.
GOVERNMENTS AND TAXES
TABLE - 3a

- Note: The tax load is distributed among the various spheres of government according to administrative jurisdiction over the tax (inspection, collection and other controls).
NET FISCAL LOAD
14,90 15,4617,01
7,42 7,76
0,92 1,18 0,98 1,19 1,53 1,41
26,18
18,71
17,59
18,73
16,37
7,779,08
7,767,326,56
1,52
26,89
28,01
23,40 23,87 24,12
28,71
0
5
10
15
20
25
30
35
1990 1991 1992 1993 1994 1995 1996
% o
f G
DP
FEDERAL GOVERNMENT
STATES
MUNICIPALITIES
TOTAL
GRAPH - II
NET FISCAL LOAD
RELATIVE PARTICIPATION - %
GOVERNMENTS AND TAXES 1990 1991 1992 1993 1994 1995 1996
FEDERAL GOVERNMENT 65,15 63,69 64,79 67,87 66,87 65,42 64,96
FISCAL BUDGET 30,31 28,88 30,09 31,09 28,97 27,44 25,72 - INCOME TAX 14,78 14,07 14,92 14,96 12,95 14,62 14,17 INDIVIDUAL TAXPAYERS 1,24 0,66 0,61 0,88 0,96 1,16 1,14 CORPORATE ENTITIES 4,43 2,93 4,85 3,83 4,33 4,46 5,34 TAXES WITHHELD 9,11 10,48 9,46 10,24 7,67 9,00 7,70
- INDUSTRIALIZED PRODUCTS TAX 8,78 9,51 9,94 10,02 7,56 7,46 7,38
- FINANCIAL OPERATIONS TAX 4,78 2,64 2,67 3,34 2,41 1,81 1,39
- FOREIGN TRADE TAX 1,45 1,88 1,71 1,85 1,81 2,76 2,05
- OTHER TAXES AND FEES (1) 0,51 0,79 0,85 0,92 4,23 0,79 0,73
SOCIAL SECURITY BUDGET 32,05 33,40 33,43 36,19 35,53 36,18 37,95
- SOCIAL SECURITY CONTRIBUTION 18,76 19,83 19,85 21,61 18,72 19,86 21,43
- FINSOCIAL/COFINS 5,61 5,76 4,24 5,55 8,65 8,29 8,43
- CONTRIBUTION ON NET PROFITS 1,98 1,23 3,08 3,19 3,27 3,17 3,03
- PIS, PASEP 4,18 4,57 4,56 4,71 3,79 3,33 3,50
- OTHER CONTRIBUTIONS (2) 1,51 2,00 1,69 1,14 1,11 1,54 1,57
Others 2,79 1,41 1,27 0,59 2,37 1,79 1,29
- FGTS 2,79 1,41 1,27 0,59 1,14 0,45 1,04
- EDUCATION WAGE 1,24 1,34 0,25
STATES 31,63 31,27 31,09 27,20 27,71 28,91 29,65
- ICMS 29,49 29,38 28,95 25,35 25,85 26,69 27,32
- IPVA 0,66 0,35 0,59 0,54 0,60 1,39 1,53
- CONT. TO CIVIL-SERV. SOC. SECURITY 1,01 1,23 1,07 1,11 1,18 0,73 0,70
- OTHER TAXES 0,46 0,31 0,48 0,20 0,08 0,10 0,10
MUNICIPALITIES 3,22 5,04 4,12 4,92 5,42 5,67 5,39
- ISS 1,18 1,44 1,33 2,20 2,35 2,49 2,42
- IPTU 0,83 1,95 1,33 1,09 1,35 1,40 1,32
- ITBI 0,24 0,58 0,39 0,36 0,44 0,43 0,41
- FEES 0,57 0,82 0,77 0,84 0,96 0,99 0,96
- OTHER TAXES 0,40 0,25 0,29 0,43 0,30 0,36 0,28
TOTAL 100,00 100,00 100,00 100,00 100,00 100,00 100,00
1) INCLUDES: ITR, FEDERAL FEES AND ECONOMIC CONTRIBUTIONS.
2) INCLUDES: SOCIAL SECURITY QUOTA, QUOTA SHARE OF SOCIAL CONTRIBUTION, CONTRIBUTION ON LOTTERY REVENUES, CONTRIBUTION ON LOTTERY AWARDS AND CONTRIBUTION ON REGIONAL INVESTMENT FUND COLLECTION.
TABLE - 4
DISTRIBUTION OF NET FISCAL LOADAMOUNTS IN MILLIONS OF CURRENCY IN USE
1990 1991 1992 1993 1994 1995 1996VALUE (Cr$) % VALUE (Cr$) % VALUE (Cr$) % VALUE (CR$) % VALUE (R$) % VALUE (R$) % VALUE (R$) %
FED. GOV. - AVAIL. REVENUES 4.675.928 54,33 19.308.322 52,55 218.727.582 53,87 5.257.182 56,42 58.307 58,55 97.539 55,12 111.212 54,55
TOTAL OWN COLLECTION 5.606.705 65,15 23.404.005 63,69 263.087.261 64,79 6.324.552 67,87 66.596 66,87 115.763 65,42 132.450 64,96
(-) TRANSFERS TO REGIONS (59.764) 0,69 (252.435) 0,69 (2.686.691) 0,66 (62.688) 0,67 (523) 0,52 (1.078) 0,61 (1.219) 0,60
(-) TRANSFERS TO STATES (458.943) 5,33 (2.034.568) 5,54 (21.935.426) 5,40 (534.590) 5,74 (4.476) 4,49 (9.055) 5,12 (10.802) 5,30
(-) TRANSFERS TO MUNICIPALITIES (412.069) 4,79 (1.808.680) 4,92 (19.737.561) 4,86 (470.092) 5,04 (3.289) 3,30 (8.092) 4,57 (9.217) 4,52
STATES - AVAIL. REVENUES 2.578.118 29,96 11.015.122 29,98 120.298.127 29,63 2.516.527 27,01 25.857 25,96 48.258 27,27 56.983 27,95
TOTAL OWN COLLECTION 2.722.513 31,63 11.491.311 31,27 126.252.025 31,09 2.534.783 27,20 27.593 27,71 51.161 28,91 60.447 29,65
(-) TRANSFERS TO MUNICIPALITIES (663.103) 7,70 (2.763.191) 7,52 (30.576.015) 7,53 (615.534) 6,61 (6.734) 6,76 (13.036) 7,37 (15.485) 7,60
(+) TRANSFERS FROM FEDERAL GOV. 518.708 6,03 2.287.003 6,22 24.622.117 6,06 597.278 6,41 4.999 5,02 10.132 5,73 12.021 5,90
MUNICIPALITIES - AVAIL. REV. 1.352.108 15,71 6.422.499 17,48 67.023.854 16,51 1.544.280 16,57 15.423 15,49 31.168 17,61 35.693 17,51
TOTAL OWN COLLECTION 276.936 3,22 1.850.628 5,04 16.710.278 4,12 458.654 4,92 5.399 5,42 10.041 5,67 10.991 5,39
(+) TRANSFERS FROM FEDERAL GOV. 412.069 4,79 1.808.680 4,92 19.737.561 4,86 470.092 5,04 3.289 3,30 8.092 4,57 9.217 4,52
(+) TRANSFERS FROM STATES 663.103 7,70 2.763.191 7,52 30.576.015 7,53 615.534 6,61 6.734 6,76 13.036 7,37 15.485 7,60
TOTAL 8.606.154 100,00 36.745.943 100,00 406.049.563 100,00 9.317.989 100,00 99.587 100,00 176.965 100,00 203.888 100,00
FINAL PROFILE OF NET FISCAL LOADAMOUNTS IN MILLIONS OF CURRENCY IN USE
1990 1991 1992 1993 1994 1995 1996VALUE (Cr$) % VALUE (Cr$) % VALUE (Cr$) % VALUE (CR$) % VALUE (R$) % VALUE (R$) % VALUE (R$) %
FED. GOV. - AVAIL. REV. 4.675.928 100,00 19.308.322 100,00 218.727.582 100,00 5.257.182 100,00 58.307 100,00 97.539 100,00 111.212 100,00
TOTAL OWN COLLECTION 4.675.928 100,00 19.308.322 100,00 218.727.582 100,00 5.257.182 100,00 58.307 100,00 97.539 100,00 111.212 100,00
TRANSFERS TO REGIONS 0 0,00 0 0,00 0 0,00 0 0,00 0 0,00 0 0,00 0 0,00
TRANSFERS TO MUNICIPALITIES 0 0,00 0 0,00 0 0,00 0 0,00 0 0,00 0 0,00 0 0,00
STATES - AVAIL. REV. 2.578.118 100,00 11.015.122 100,00 120.298.127 100,00 2.516.527 100,00 25.857 100,00 48.258 100,00 56.983 100,00
TOTAL OWN COLLECTION 2.059.410 79,88 8.728.119 79,24 95.676.010 79,53 1.919.249 76,27 20.858 80,67 38.125 79,00 44.962 78,90
TRANSFERS FROM FEDERAL GOV. 518.708 20,12 2.287.003 20,76 24.622.117 20,47 597.278 23,73 4.999 19,33 10.132 21,00 12.021 21,10
TRANSFERS TO MUNICIPALITIES 0 0,00 0 0,00 0 0,00 0 0,00 0 0,00 0 0,00 0 0,00
MUNICIPALITIES - AVAIL. REV. 1.352.108 100,00 6.422.499 100,00 67.023.854 100,00 1.544.280 100,00 15.423 100,00 31.168 100,00 35.693 100,00
TOTAL OWN COLLECTION 276.936 20,48 1.850.628 28,81 16.710.278 24,93 458.654 29,70 5.399 35,01 10.041 32,21 10.991 30,79
TRANSFERS FROM FEDERAL GOV. 412.069 30,48 1.808.680 28,16 19.737.561 29,45 470.092 30,44 3.289 21,33 8.092 25,96 9.217 25,82
TRANSFERS FROM STATES 663.103 49,04 2.763.191 43,02 30.576.015 45,62 615.534 39,86 6.734 43,67 13.036 41,82 15.485 43,38
TOTAL 8.606.154 - - - 36.745.943 - - - 406.049.563 - - - 9.317.989 - - - 99.587 - - - 176.965 - - - 203.888 - - -
12/7/2006
TABLE - 5
TABLE - 6
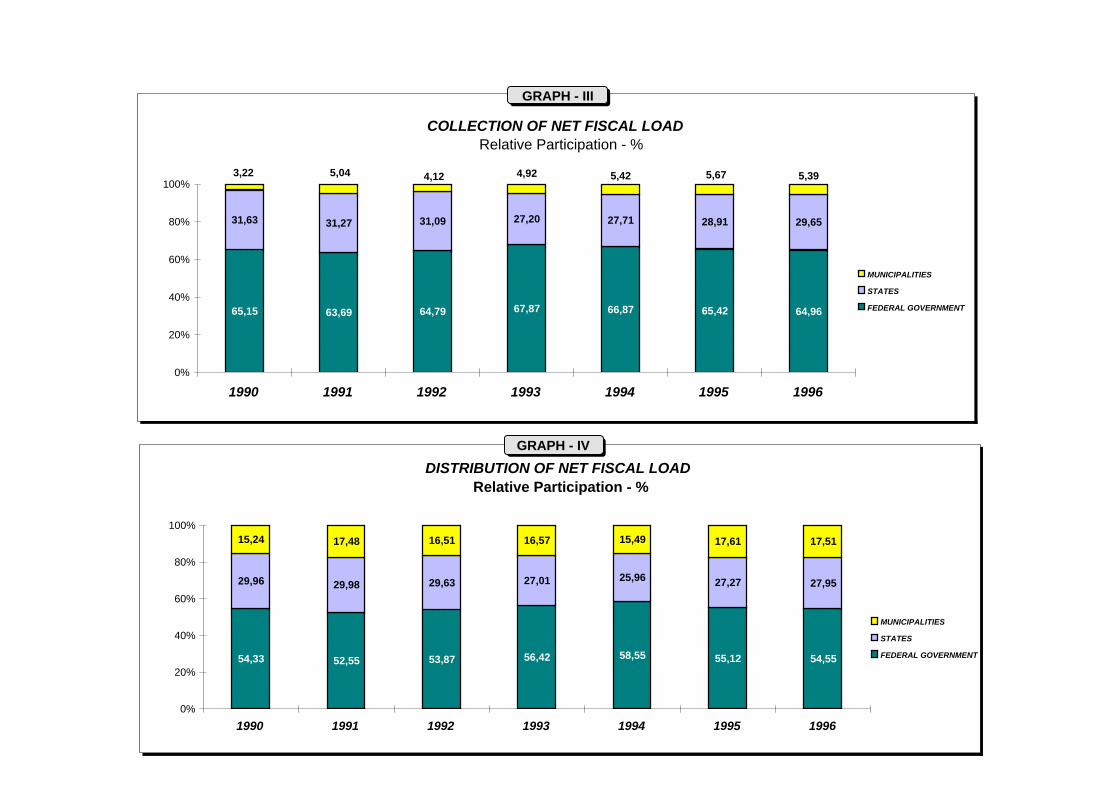
COLLECTION OF NET FISCAL LOADRelative Participation - %
65,15 63,69 64,79 67,87 66,87 65,42 64,96
31,63 31,27 31,09 27,20 27,71 28,91 29,65
5,675,424,924,125,043,22 5,39
0%
20%
40%
60%
80%
100%
1990 1991 1992 1993 1994 1995 1996
MUNICIPALITIES
STATES
FEDERAL GOVERNMENT
GRAPH - III
DISTRIBUTION OF NET FISCAL LOADRelative Participation - %
54,33 52,55 53,87 56,42 58,55 55,12 54,55
29,96 29,98 29,63 27,01 25,96 27,27 27,95
15,24 17,48 16,51 16,57 15,49 17,61 17,51
0%
20%
40%
60%
80%
100%
1990 1991 1992 1993 1994 1995 1996
MUNICIPALITIES
STATES
FEDERAL GOVERNMENT
GRAPH - IV
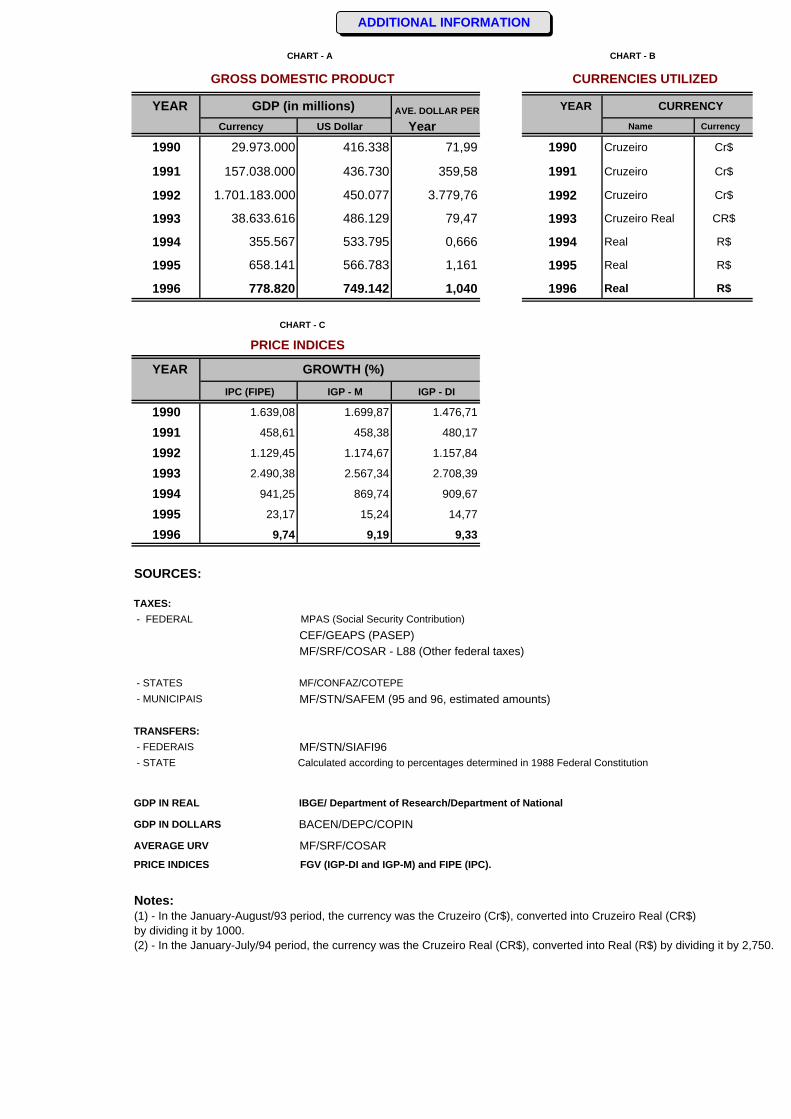
CHART - A CHART - B
GROSS DOMESTIC PRODUCT CURRENCIES UTILIZED
YEAR GDP (in millions) AVE. DOLLAR PER YEAR CURRENCY
Currency US Dollar Year Name Currency
1990 29.973.000 416.338 71,99 1990 Cruzeiro Cr$
1991 157.038.000 436.730 359,58 1991 Cruzeiro Cr$
1992 1.701.183.000 450.077 3.779,76 1992 Cruzeiro Cr$
1993 38.633.616 486.129 79,47 1993 Cruzeiro Real CR$
1994 355.567 533.795 0,666 1994 Real R$
1995 658.141 566.783 1,161 1995 Real R$
1996 778.820 749.142 1,040 1996 Real R$
CHART - C PRICE INDICES
YEAR GROWTH (%)IPC (FIPE) IGP - M IGP - DI
1990 1.639,08 1.699,87 1.476,71
1991 458,61 458,38 480,17
1992 1.129,45 1.174,67 1.157,84
1993 2.490,38 2.567,34 2.708,39
1994 941,25 869,74 909,67
1995 23,17 15,24 14,77
1996 9,74 9,19 9,33
SOURCES:
TAXES: - FEDERAL MPAS (Social Security Contribution)
CEF/GEAPS (PASEP)MF/SRF/COSAR - L88 (Other federal taxes)
- STATES MF/CONFAZ/COTEPE
- MUNICIPAIS MF/STN/SAFEM (95 and 96, estimated amounts)
TRANSFERS: - FEDERAIS MF/STN/SIAFI96 - STATE Calculated according to percentagesdetermined in 1988 Federal Constitution
GDP IN REAL IBGE/ Department of Research/Department of National
GDP IN DOLLARS BACEN/DEPC/COPIN
AVERAGE URV MF/SRF/COSARPRICE INDICES FGV (IGP-DI and IGP-M) and FIPE (IPC).
Notes:(1) - In the January-August/93 period, the currency was the Cruzeiro (Cr$), converted into Cruzeiro Real (CR$) by dividing it by 1000.(2) - In the January-July/94 period, the currency was the Cruzeiro Real (CR$), converted into Real (R$) by dividing it by 2,750.
ADDITIONAL INFORMATION