Embed Size (px)
Citation preview
The American Way to the Kyoto Protocol:An Economic Analysis to Reduce Carbon Pollution
A Study For:World Wildlife Fund
Alison BailieStephen Bernow
William DoughertyMichael Lazarus
Sivan Kartha
Tellus Institute and Stockholm Environment Institute – Boston Center
July 2001
i
Table of Contents
Acknowledgements......................................................................................................................... ii
1 Executive Summary ............................................................................................................... iii
2 Introduction............................................................................................................................. 1
3 Policies.................................................................................................................................... 6
3.1 Policies in the Buildings and Industrial Sectors ............................................................. 6
3.2 Policies in the Electric Sector ....................................................................................... 10
3.3 Policies in the Transport Sector .................................................................................... 13
4 Methods and Assumptions.................................................................................................... 15
5 Results................................................................................................................................... 17
5.1 Overview of Results...................................................................................................... 17
5.2 Sectoral Impacts............................................................................................................ 18
5.3 Air Pollution Reductions .............................................................................................. 22
5.4 Economic Impacts......................................................................................................... 23
6 Achieving Kyoto................................................................................................................... 26
6.1 Domestic options .......................................................................................................... 27
6.2 International options ..................................................................................................... 30
6.3 Combining the options.................................................................................................. 33
7 Conclusions........................................................................................................................... 35
8 List of References ................................................................................................................. 36
Appendix 1: Energy and Carbon Summaries................................................................................ 39
Appendix 2. Modeling Global Carbon Markets .......................................................................... 48

ii
Acknowledgements
We wish to thank Jennifer Morgan, Katherine Silverthorne and Freda Colbert of WWF for theirassistance on this report. We thank Hal Harvey, Marcus Schneider and Eric Heitz of EnergyFoundation for their help in supporting our modeling capabilities. The energy efficiency analysesand inputs to our modeling effort for buildings, industry and light duty vehicles were provided byACEEE (Steve Nadel, Howard Geller, Neal Elliott and Therese Langer) and John DeDicco ofEnvironmental Defense. Modifications to the NEMS model, particularly as related to renewablesin the electricity sector, were made at Tellus with important input from Alan Nogee, DeborahDonovan and Steve Clemmer of Union of Concerned Scientists, Laura Martin, Tom Petersik,Alan Beamon, Zia Haq, and Jeff Jones of EIA, and other experts including Walter Short ofNREL, Jack Cadogan of ORNL, Dan Entingh of Princeton Economic Research, Inc., EtanGummerman, Lawrence Berkeley Labs, Francis Wood of OnLocation, Inc., and MichaelBrower. We also wish to thank Francisco de la Chesnaye and Reid Harvey of USEPA, whoprovided important data on non-CO2 gases, and Kevin Gurney, who provided useful insights onland-based carbon.
iii
1 Executive Summary
This report presents a study of policies and measures that could dramatically reduce USgreenhouse gas emissions over the next two decades. It examines a broad set of national policiesto increase energy efficiency, accelerate the adoption of renewable energy technologies, and shiftenergy use to less carbon-intensive fuels. The policies address major areas of energy use inresidential and commercial buildings, industrial facilities, transportation, and power generation.
This portfolio of policies and measures would allow the United States to meet its obligationsunder the Kyoto Protocol Together when combined with steps to reduce the emissions of non-CO2 greenhouse gases and land-based CO2 emissions, and the acquisition of a limited amount ofallowances internationally. This package would bring overall economic benefits to the US, sincelower fuel and electricity bills would more than pay the costs of technology innovation andprogram implementation. In 2010, the annual savings would exceed costs by $50 billion, and by2020 by approximately $135 billion.
Currently, the Bush administration is promoting an energy strategy based on augmenting fossilfuel supplies. This strategy does not help the US shift away from diminishing fossil fuel supplies,it does not enhance US energy security, and it does not reduce the environmental impacts ofenergy use. America needs an energy policy that takes us forward into the 21st Century bymaking climate change mitigation an integrated part of the plan
Far from being the economically crippling burden that the Bush Administration alleges, ratifyingthe Kyoto Protocol and ambitiously reducing greenhouse gas emissions could initiate a nationaltechnological and economic renaissance for cleaner energy, industrial processes and products inthe coming decades. In the United States, we therefore face an important challenge. We canembrace the challenge of climate change as an opportunity to usher in this renaissance, providingworld markets with the advanced technologies needed to sustain this century’s economic growth.Or we can be followers, leaving other more forward-looking countries to assume the globalleadership in charting a sustainable path and capturing the energy markets of the future.
Policies and measures
The climate protection strategy adopts policies and measures that are broadly targeted across thefour main economic sectors: buildings, electricity generation, transportation, and industry. Thepolicies considered for residential and commercial buildings include strengthened codes forbuilding energy consumption, new appliance efficiency standards, tax incentives and a nationalpublic benefits fund to support investments in high efficiency products, and expanded researchand development into energy efficient technologies. For the electric sector, policies included amarket-oriented “renewable portfolio standard”, a cap on pollutant emissions (for sulfur andnitrogen), and a carbon emissions permit auction. In the transport sector, policies are adopted toimprove the fuel economy of passenger vehicles, freight trucks, and aircraft through research,incentives, and a strengthened vehicle fuel efficiency standards. Policies are also modeled to seta fuel-cycle greenhouse gas standard for motor fuels, reduce road travel through land use andinfrastructure investments and pricing reforms, and increase access to high speed rail as analternative to short distance air travel. In the industry sector, policies are adopted to exploit moreof the vast potential for cogeneration of heat and power, and to improve energy efficiencies atindustrial facilities through technical assistance, financial incentives, expanded research, anddemonstration programs to encourage cost-effective emissions reductions.
iv
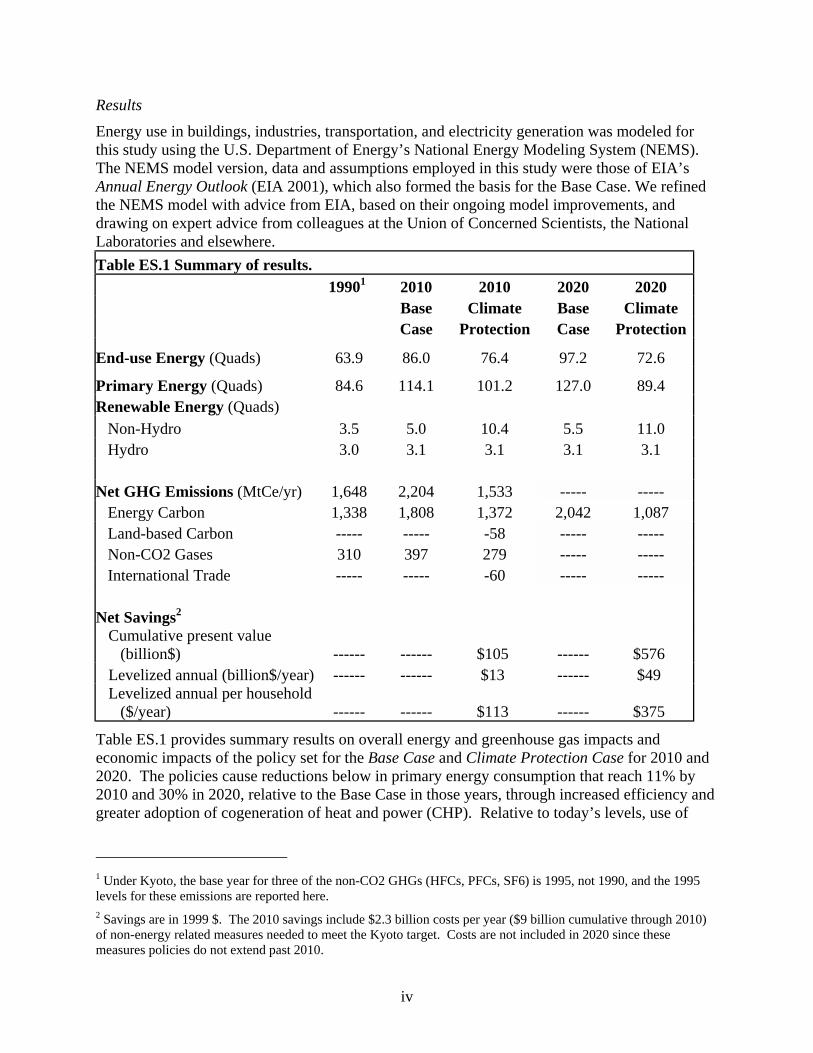
Results
Energy use in buildings, industries, transportation, and electricity generation was modeled forthis study using the U.S. Department of Energy’s National Energy Modeling System (NEMS).The NEMS model version, data and assumptions employed in this study were those of EIA’sAnnual Energy Outlook (EIA 2001), which also formed the basis for the Base Case. We refinedthe NEMS model with advice from EIA, based on their ongoing model improvements, anddrawing on expert advice from colleagues at the Union of Concerned Scientists, the NationalLaboratories and elsewhere.Table ES.1 Summary of results.
19901 2010 2010 2020 2020 Base Climate Base Climate Case Protection Case Protection
End-use Energy (Quads) 63.9 86.0 76.4 97.2 72.6
Primary Energy (Quads) 84.6 114.1 101.2 127.0 89.4Renewable Energy (Quads) Non-Hydro 3.5 5.0 10.4 5.5 11.0 Hydro 3.0 3.1 3.1 3.1 3.1 Net GHG Emissions (MtCe/yr) 1,648 2,204 1,533 ----- ----- Energy Carbon 1,338 1,808 1,372 2,042 1,087 Land-based Carbon ----- ----- -58 ----- ----- Non-CO2 Gases 310 397 279 ----- ----- International Trade ----- ----- -60 ----- ----- Net Savings2
Cumulative present value(billion$) ------ ------ $105 ------ $576
Levelized annual (billion$/year) ------ ------ $13 ------ $49 Levelized annual per household
($/year) ------ ------ $113 ------ $375
Table ES.1 provides summary results on overall energy and greenhouse gas impacts andeconomic impacts of the policy set for the Base Case and Climate Protection Case for 2010 and2020. The policies cause reductions below in primary energy consumption that reach 11% by2010 and 30% in 2020, relative to the Base Case in those years, through increased efficiency andgreater adoption of cogeneration of heat and power (CHP). Relative to today’s levels, use of
1 Under Kyoto, the base year for three of the non-CO2 GHGs (HFCs, PFCs, SF6) is 1995, not 1990, and the 1995levels for these emissions are reported here.2 Savings are in 1999 $. The 2010 savings include $2.3 billion costs per year ($9 billion cumulative through 2010)of non-energy related measures needed to meet the Kyoto target. Costs are not included in 2020 since thesemeasures policies do not extend past 2010.
v
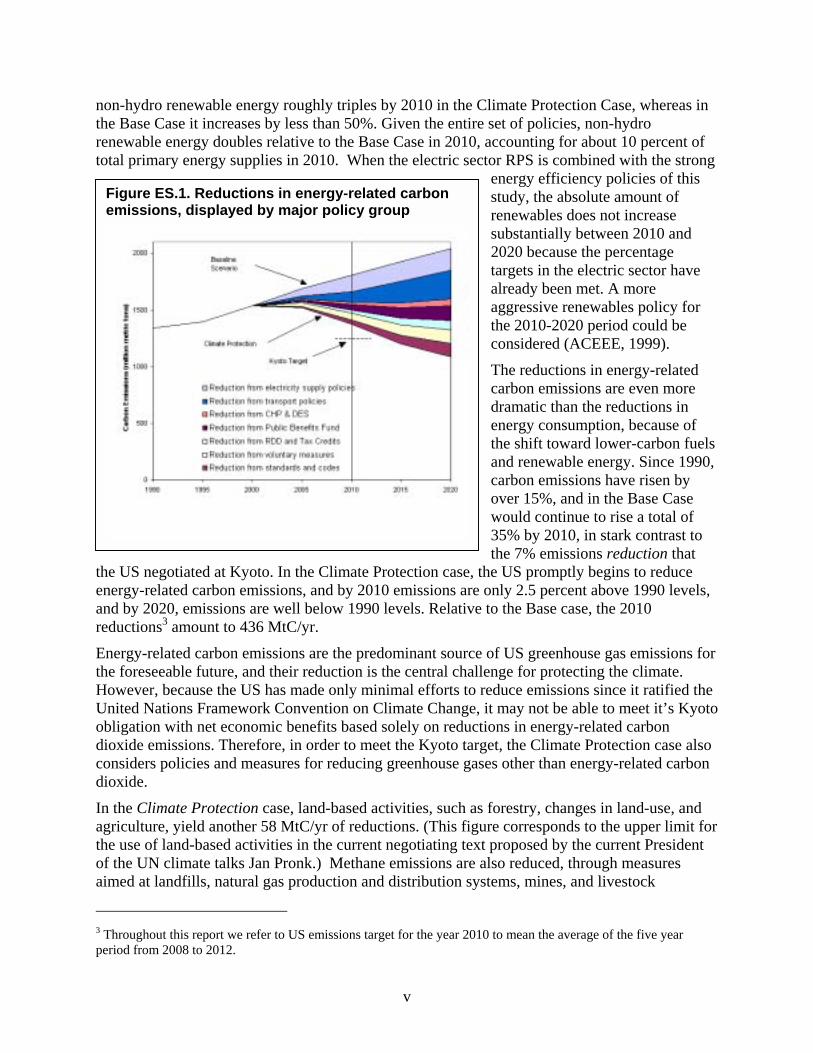
non-hydro renewable energy roughly triples by 2010 in the Climate Protection Case, whereas inthe Base Case it increases by less than 50%. Given the entire set of policies, non-hydrorenewable energy doubles relative to the Base Case in 2010, accounting for about 10 percent oftotal primary energy supplies in 2010. When the electric sector RPS is combined with the strong
energy efficiency policies of thisstudy, the absolute amount ofrenewables does not increasesubstantially between 2010 and2020 because the percentagetargets in the electric sector havealready been met. A moreaggressive renewables policy forthe 2010-2020 period could beconsidered (ACEEE, 1999).
The reductions in energy-relatedcarbon emissions are even moredramatic than the reductions inenergy consumption, because ofthe shift toward lower-carbon fuelsand renewable energy. Since 1990,carbon emissions have risen byover 15%, and in the Base Casewould continue to rise a total of35% by 2010, in stark contrast tothe 7% emissions reduction that
the US negotiated at Kyoto. In the Climate Protection case, the US promptly begins to reduceenergy-related carbon emissions, and by 2010 emissions are only 2.5 percent above 1990 levels,and by 2020, emissions are well below 1990 levels. Relative to the Base case, the 2010reductions3 amount to 436 MtC/yr.
Energy-related carbon emissions are the predominant source of US greenhouse gas emissions forthe foreseeable future, and their reduction is the central challenge for protecting the climate.However, because the US has made only minimal efforts to reduce emissions since it ratified theUnited Nations Framework Convention on Climate Change, it may not be able to meet it’s Kyotoobligation with net economic benefits based solely on reductions in energy-related carbondioxide emissions. Therefore, in order to meet the Kyoto target, the Climate Protection case alsoconsiders policies and measures for reducing greenhouse gases other than energy-related carbondioxide.
In the Climate Protection case, land-based activities, such as forestry, changes in land-use, andagriculture, yield another 58 MtC/yr of reductions. (This figure corresponds to the upper limit forthe use of land-based activities in the current negotiating text proposed by the current Presidentof the UN climate talks Jan Pronk.) Methane emissions are also reduced, through measuresaimed at landfills, natural gas production and distribution systems, mines, and livestock
3 Throughout this report we refer to US emissions target for the year 2010 to mean the average of the five yearperiod from 2008 to 2012.
Figure ES.1. Reductions in energy-related carbonemissions, displayed by major policy group
husbandry. The potent fluorine-containing greenhouse gases can be reduced by substituting withnon-greenhouse substitutes, implementing alternative cleaning processes in the semiconductorindustry, reducing leaks, and investing in more efficient gas-using equipment. In total, theClimate Protection case adopts reductions of these other greenhouse gases equivalent to 118MtC/yr by 2010.
All together the reduction measures for energy-related carbon (436 MtC/yr), land-based carbon(58 MtC/yr), and non-carbon gases (118 MtCe/yr) amount to 612 MtCe/yr of reductions in 2010.Through these measures, the United States is able to accomplish the vast majority of itsemissions reduction obligation under the Kyoto Protocol through domestic actions. This leavesthe United States slightly shy of its Kyoto target, with only 60 MtC/yr worth of emissionsallowances to procure from other countries though the “flexibility mechanisms” of the KyotoProtocol – (Emissions Trading, Joint Implementation, and the Clean Development Mechanism).The Climate Protection case assumes that the US will take steps to ensure that allowancesprocured through these flexibility mechanisms reflect legitimate mitigation activity. In particular,we assume that US restrains its use of so-called “hot air” allowances, i.e, allowances sold bycountries that received Kyoto Protocol targets well above their current emissions.
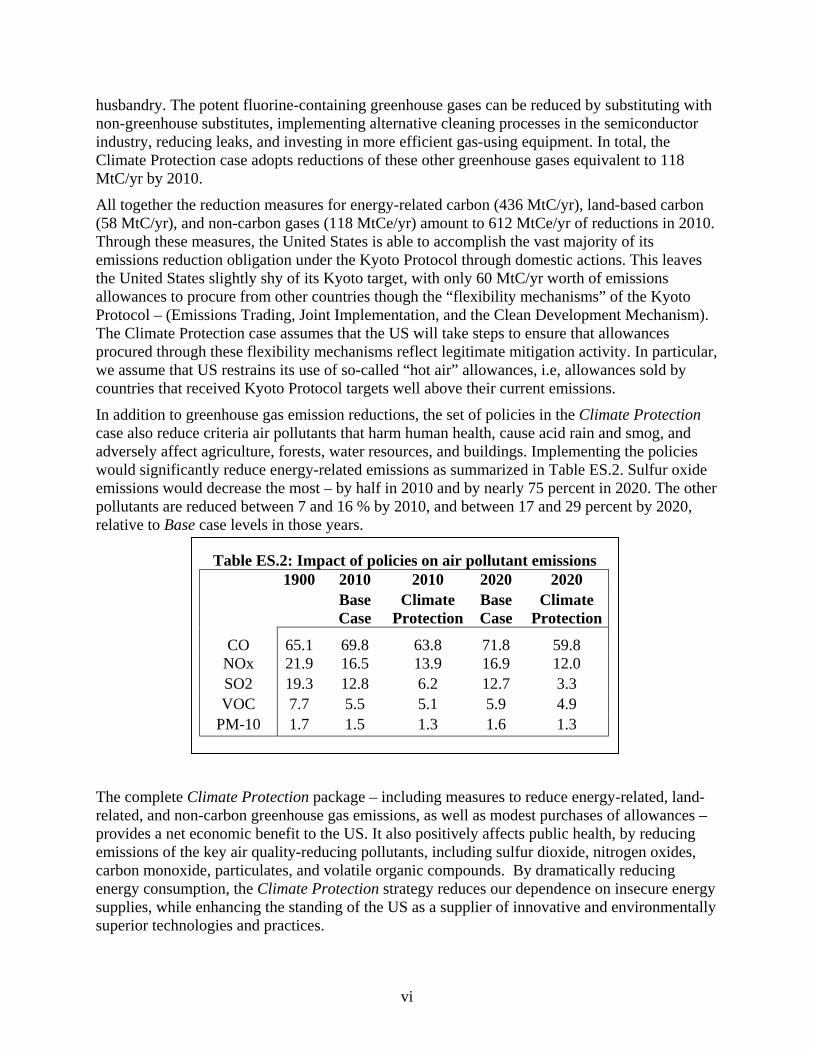
In addition to greenhouse gas emission reductions, the set of policies in the Climate Protectioncase also reduce criteria air pollutants that harm human health, cause acid rain and smog, andadversely affect agriculture, forests, water resources, and buildings. Implementing the policieswould significantly reduce energy-related emissions as summarized in Table ES.2. Sulfur oxideemissions would decrease the most – by half in 2010 and by nearly 75 percent in 2020. The otherpollutants are reduced between 7 and 16 % by 2010, and between 17 and 29 percent by 2020,relative to Base case levels in those years.
The complete Clirelated, and non-provides a net ecemissions of the carbon monoxideenergy consumptsupplies, while ensuperior technolo
Table ES.2: Impact of policies on air pollutant emissions1900 2010 2010 2020 2020
BaseCase
ClimateProtection
BaseCase
ClimateProtection
CO 65.1 69.8 63.8 71.8 59.8NOx 21.9 16.5 13.9 16.9 12.0SO2 19.3 12.8 6.2 12.7 3.3VOC 7.7 5.5 5.1 5.9 4.9
PM-10 1.7 1.5 1.3 1.6 1.3
vi
mate Protection package – including measures to reduce energy-related, land-carbon greenhouse gas emissions, as well as modest purchases of allowances –onomic benefit to the US. It also positively affects public health, by reducingkey air quality-reducing pollutants, including sulfur dioxide, nitrogen oxides,, particulates, and volatile organic compounds. By dramatically reducingion, the Climate Protection strategy reduces our dependence on insecure energyhancing the standing of the US as a supplier of innovative and environmentallygies and practices.
1
2 Introduction
The earth’s atmosphere now contains more carbon dioxide than at anytime over the past severalhundred millennia. This precipitous rise in the major greenhouse gas, due to the combustion offossil fuels since the dawn of the industrial age and the clearing of forests, has warmed the globeand produced climatic changes. What further changes will occur over the coming decadesdepends on how society chooses to respond to the threat of a dangerously disrupted climate. Aconcerted global effort to shift to energy-efficient technologies, carbon-free sources of energyand sustainable land-use practices, could keep future climate change to relatively modest levels.If, on the other hand, nations continue to grow and consume without limiting GHG emissions,future climate change could be catastrophic.
Dramatic climate change could unleash a range of dangerous physical, ecological, economic andsocial disruptions that would seriously undermine the natural environment and human societiesfor generations to come. Fortunately, a variety of effective policies, which have already beendemonstrated, would mobilize current and new technologies, practices and resources to meet thechallenge of climate protection. Strong and sustained action to reduce the risk of climate changecould also reap additional benefits, such as reducing other air pollutants and saving money, plushelp to usher in a new technological and institutional renaissance consistent with the goals ofsustainable development. Here we focus on the U.S., which emits almost one-fourth of globalcarbon dioxide emissions. As a nation, we have both the responsibility and the capability to takethe lead in climate protection, and can directly benefit from actions taken. Recently, however, theBush Administration has gravely disappointed the international community, proposing an energystrategy that is devoid of significant steps to protect the climate.
This report presents a study of policies and measures through which the U.S. could dramaticallyreduce its greenhouse gas emissions over the next two decades, while spurring technologicalinnovation, reducing pollution, and improving energy security. The study is the latest in a seriesto which Tellus Institute has contributed, dating back to 1990, which have shown the economicand environmental benefits of energy efficiency and renewable energy resources. It updates andrefines America’s Global Warming Solutions (1999), which found that annual carbon emissionscould be reduced to 14 percent below 1990 levels by 2010, with net economic benefits andreductions in air pollution.
Unfortunately, since that study, and indeed over the past decade since the FrameworkConvention on Climate Change was ratified by the U.S., the promise of these technologies andresources has gone largely unfulfilled, and little has been done to stem the tide of rapidlygrowing energy use and carbon emissions. This delay and paucity of action has rendered evenmore difficult the goal of reaching our Kyoto Protocol emissions target of 7 percent below 1990levels by 2010. Nonetheless, the present study shows the substantial carbon reduction and otherbenefits that could still be achieved by 2010 with sensible policies and measures, even with thisdelayed start, and even greater benefits over the following decade. The policy and technologicalmomentum established through 2020 would set the stage for the further reductions needed overthe longer term to ensure climate stabilization.
2
The Risk of Climate Change
The world’s community of climate scientists has reached the consensus that human activities aredisrupting the Earth’s climate (WGI, SPM, 2001; NAS, 2001; Int’l Academies of Science, 2001).Global emissions of CO2 have steadily risen since the dawn of the industrial age, and nowamount to about 6 billion tons of carbon released annually from fossil fuel combustion and 1billion tons annually from land-use changes (mainly burning and decomposition of forestbiomass). Without concerted efforts to curb emissions, atmospheric carbon dioxide levels wouldbe driven inexorably higher by a growing global population pursuing a conventional approach toeconomic development.
While it is impossible to predict with precision how much carbon dioxide we will be emitting inthe future, in a business-as-usual scenario annual emissions would roughly triple by the end ofthe century. By that time, the atmospheric concentration of carbon dioxide would have risen tothree times pre-industrial levels (IPCC WGI, 2001). The climatic impacts of these risingemissions could be dramatic. Across a range of different plausible emissions futures explored bythe IPCC, global average temperatures are calculated to rise between 3 to 10 degrees Fahrenheit(1.5 to 6 degrees Centigrade), with even greater increases in some regions (IPCC 2001). Suchtemperature changes would reflect a profound transformation of the Earth’s climate system, ofthe natural systems that depend upon it and, potentially, of the human societies that caused thechanges.
The potential consequences of such climate change are myriad and far-reaching. Sea level couldrise between 3.5 to 35 inches (9 - 88 centimeters) (IPCC WGI, 2001), with severe implicationsfor coastal and island ecosystems and their human communities. Hundreds of millions of peoplein the US and abroad live in coastal regions that would be inundated by a 17 inch (44 cm) rise insea level. Most of these regions are in developing countries that can scarcely afford to expendresources on building dikes and resettling communities. Climate disruption would also entailmore frequent, prolonged, and intense extreme weather events, including storms and droughts,the timing, conditions and character of which would remain unpredictable.
Under the stresses courted by continuing current energy practices, climate and ecologicalsystems could undergo very large and irreversible changes, such as a shift in the major oceancurrents. Global warming itself could increase the rate of greenhouse gas accumulation,uncontrollably accelerating global warming and its impacts. For example, a thawing of the arctictundra could release methane at rates far beyond today’s anthropogenic rates, and a warming ofthe oceans could shift them from a net sink to a net source of carbon dioxide.
Moreover, large and irreversible changes could occur very rapidly. Recent scientific evidencefrom pre-historic ice cores shows that major climate changes have occurred on the time scale ofabout a decade (Schneider 1998; Severinghaus et al. 1998). Rapid change could cause additionalecological and social disruptions, limiting our ability to adapt. This could render belated attemptsto mitigate climate change more hurried, more costly, less effective, or too late. Consequently,early and sustained action, across many fronts, is needed to effect the technological, institutionaland economic transitions to protect global climate and the ecological and social systems thatdepend on climate stability.
3
Protecting the Climate
The carbon dioxide already released by human activities will linger in the atmosphere for ahundred years or so. This carbon has already changed the climate, and will continue to do so aslong as it remains in the atmosphere. But the degree of climate change to which we’re alreadycommitted pales in comparison to the disruption that humankind would wreak if it continues torecklessly emit more carbon.
An aggressive strategy to curb emissions might limit warming to less than 2°F over the nextcentury (on top of the ~1.0° C that has already occurred over the past century). A temperatureincrease of about 0.2° F per decade would still exceed natural variability, but would occurgradually enough to allow many, though not all, ecosystems to adapt (Rijsberman and Swart,1990). To be sure, this goal would not entirely eliminate the risks of disruptive climate change.Warming in some areas would significantly exceed 2°F, the rising sea level would inundate somecoastal areas, and changing rainfall patterns could make some regions more prone to drought orfloods. A more ambitious stabilization target might well be warranted, but we suggest this goalas an illustration of what might be an environmentally acceptable and practically achievableclimate protection trajectory.
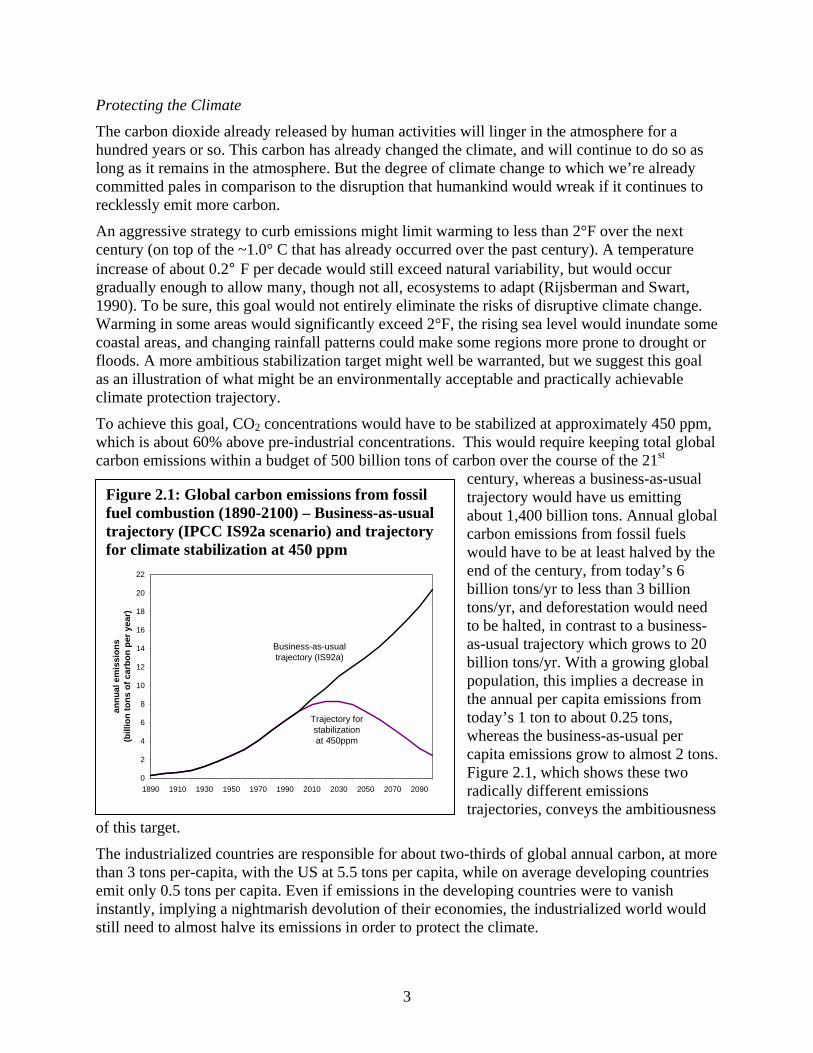
To achieve this goal, CO2 concentrations would have to be stabilized at approximately 450 ppm,which is about 60% above pre-industrial concentrations. This would require keeping total globalcarbon emissions within a budget of 500 billion tons of carbon over the course of the 21st
century, whereas a business-as-usualtrajectory would have us emittingabout 1,400 billion tons. Annual globalcarbon emissions from fossil fuelswould have to be at least halved by theend of the century, from today’s 6billion tons/yr to less than 3 billiontons/yr, and deforestation would needto be halted, in contrast to a business-as-usual trajectory which grows to 20billion tons/yr. With a growing globalpopulation, this implies a decrease inthe annual per capita emissions fromtoday’s 1 ton to about 0.25 tons,whereas the business-as-usual percapita emissions grow to almost 2 tons.Figure 2.1, which shows these tworadically different emissionstrajectories, conveys the ambitiousness
of this target.
The industrialized countries are responsible for about two-thirds of global annual carbon, at morethan 3 tons per-capita, with the US at 5.5 tons per capita, while on average developing countriesemit only 0.5 tons per capita. Even if emissions in the developing countries were to vanishinstantly, implying a nightmarish devolution of their economies, the industrialized world wouldstill need to almost halve its emissions in order to protect the climate.
Figure 2.1: Global carbon emissions from fossilfuel combustion (1890-2100) – Business-as-usualtrajectory (IPCC IS92a scenario) and trajectoryfor climate stabilization at 450 ppm
0
2
4
6
8
10
12
14
16
18
20
22
1890 1910 1930 1950 1970 1990 2010 2030 2050 2070 2090
annu
al e
mis
sion
s (b
illio
n to
ns o
f car
bon
per y
ear)
Business-as-usual trajectory (IS92a)
Trajectory for stabilization at 450ppm
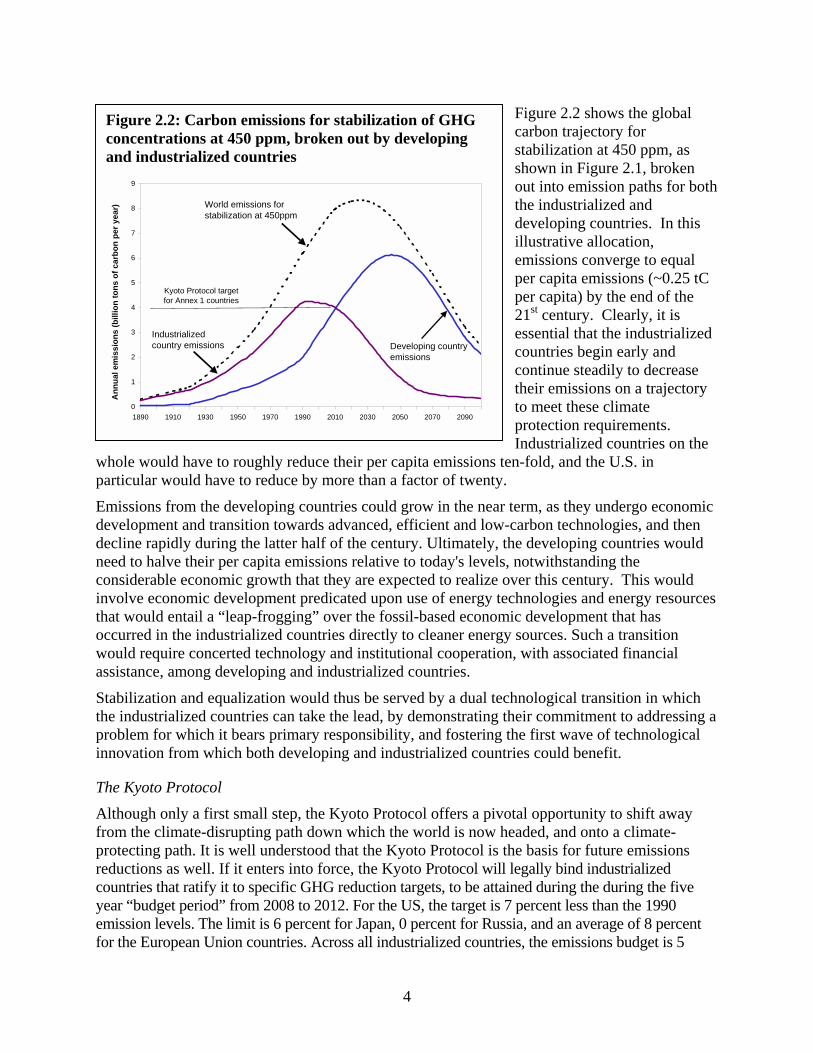
Figure 2.2 shows the globalcarbon trajectory forstabilization at 450 ppm, as
wp
Eddncitowa
Stpi
T
Afprcyef
Figure 2.2: Carbon emissions for stabilization of GHGconcentrations at 450 ppm, broken out by developingand industrialized countries
4
shown in Figure 2.1, brokenout into emission paths for boththe industrialized anddeveloping countries. In thisillustrative allocation,emissions converge to equalper capita emissions (~0.25 tCper capita) by the end of the21st century. Clearly, it isessential that the industrializedcountries begin early andcontinue steadily to decreasetheir emissions on a trajectoryto meet these climateprotection requirements.Industrialized countries on the
hole would have to roughly reduce their per capita emissions ten-fold, and the U.S. inarticular would have to reduce by more than a factor of twenty.
missions from the developing countries could grow in the near term, as they undergo economicevelopment and transition towards advanced, efficient and low-carbon technologies, and thenecline rapidly during the latter half of the century. Ultimately, the developing countries wouldeed to halve their per capita emissions relative to today's levels, notwithstanding theonsiderable economic growth that they are expected to realize over this century. This wouldnvolve economic development predicated upon use of energy technologies and energy resourceshat would entail a “leap-frogging” over the fossil-based economic development that hasccurred in the industrialized countries directly to cleaner energy sources. Such a transitionould require concerted technology and institutional cooperation, with associated financial
ssistance, among developing and industrialized countries.
tabilization and equalization would thus be served by a dual technological transition in whichhe industrialized countries can take the lead, by demonstrating their commitment to addressing aroblem for which it bears primary responsibility, and fostering the first wave of technologicalnnovation from which both developing and industrialized countries could benefit.
he Kyoto Protocol
lthough only a first small step, the Kyoto Protocol offers a pivotal opportunity to shift awayrom the climate-disrupting path down which the world is now headed, and onto a climate-rotecting path. It is well understood that the Kyoto Protocol is the basis for future emissionseductions as well. If it enters into force, the Kyoto Protocol will legally bind industrializedountries that ratify it to specific GHG reduction targets, to be attained during the during the fiveear “budget period” from 2008 to 2012. For the US, the target is 7 percent less than the 1990mission levels. The limit is 6 percent for Japan, 0 percent for Russia, and an average of 8 percentor the European Union countries. Across all industrialized countries, the emissions budget is 5
0
1
2
3
4
5
6
7
8
9
1890 1910 1930 1950 1970 1990 2010 2030 2050 2070 2090
Ann
ual e
mis
sion
s (b
illio
n to
ns o
f car
bon
per y
ear)
Developing country emissions
Industrialized country emissions
World emissions for stabilization at 450ppm
Kyoto Protocol target for Annex 1 countries
5
percent below 1990 emissions rate, whereas the business-as-usual emissions rate is projected toincrease by approximately 20 percent by 2010.
The Kyoto Protocol offers a number of options to lower the cost of meeting their targets. Many ofthese so-called “flexibility mechanisms” were included at the request of the US in Kyoto. Theyallow countries to carry out projects that reduce carbon emissions (or enhance carbon absorption)from biological stocks such as forests and possibly agricultural land, or can reduce emissions ofGHGs other than carbon4. Countries can also undertake GHG mitigation projects in other countries5
and acquire credits for the resulting reductions, or can simply purchase excess carbon allowancesfrom countries that surpass their targets6.
However, these flexibility mechanisms should be implemented with caution, lest they undermineeffectiveness of the Kyoto Protocol. Given its modest reduction targets relative to the muchdeeper reductions ultimately needed for climate protection, the main purpose of the Protocol is toreduce greenhouse gas emissions by launching a global transition in technologies andinfrastructure for energy production and use. The first budget period should end with a decisiveshift away from conventional energy investments, real progress in institutional learning andtechnological innovation, and momentum to deepen and expand these changes over the longerterm. An over-reliance on the flexibility mechanisms may permit too slow a start, and too weak asignal, to motivate this fundamental transition.
Excessive use of the flexibility mechanisms could undermine the needed transition in severalways. First, the emissions trading system is in danger of being severely diluted by cheap carbonallowances from the Russian Federation and Ukraine, whose negotiated targets are far above theemission levels they will reach by 2010 even without reduction efforts. Second, inadequate rulesfor credits from project-based mechanisms could generate “free-rider” credits that reflect inflatedestimates of their mitigation value, thereby undermining the Protocol’s targets. Third, mitigationactivities that rely on biological sequestration strain our current technical ability to reliablymeasure carbon changes, are based on uncertain science, and take pressure off of fossil fuelreduction. Perhaps more importantly, institutions are not yet in place to ensure that such projectsdo not harm biodiversity and human communities.
The attraction and rhetoric of solutions that lie outside the borders of the industrialized countries ismisguided at this time. To be sure, there are important opportunities to help developing countriesadvance along a sustainable, low carbon path. But unfettered use overseas options, justified bylower short-term costs for the industrialized countries, would be a head-in-the-sand approach to thelong-term responsibility of climate protection. The quantity of such offsets should be limited andtheir quality guaranteed. Procedures should be established to help ensure that the variousflexibility mechanisms help protect the climate and advance sustainable development. Theseinclude consistency with local ecological, cultural, economic conditions and constraints,guaranteed public participation in project design, certification and review, strong ecological andsocial criteria, human and institutional capacity-building goals, strong and equitable relationships
4 The GHGs that are covered by the Kyoto Protocol include carbon dioxide (CO2), methane (CH4), nitrous oxide(N2O), hydroflourocarbons (HFCs), perflourocarbons (PFCs), and sulfur hexaflouride (SF6).5 “Joint Implementation” (JI) is the relevant mechanism if the host country is an industrialized country with a target,and “Clean Development Mechanism” (CDM) if the host country is a developing country. 6 Purchase of allowances is known as “Emissions Trading”.
6
for technology cooperation, and acceptable procedures for monitoring, verification andaccreditation of offset actions and transactions. Until then it is premature to rely on the CDM formore than a very small part of the required emissions reductions.
If the U.S. relies too heavily on the flexibility mechanisms, it could forego opportunities to reapthe co-benefits of decreasing carbon emissions at home. These include the reduced health andecological damages resulting from decreased emissions of mercury, fine particulates and otherpollutants, and the improvements in technologies, skills and productivity accompanyingdeployment and use of more advanced technologies and practices. It could also find itself in apoorer position to meet the stricter emissions reduction commitments expected for subsequentbudget periods. The nation could become a follower rather than a leader in advancedtechnologies in domestic and world markets. Thus, it could miss the opportunity provided by theKyoto Protocol for a national technological and economic “renaissance” with cleaner energy,processes and products in the coming decades.
3 Policies This study examines a broad set of national policies that would increase energy efficiency,accelerate the adoption of renewable energy technologies, and shift to less carbon-intensivefossil fuels. This policy package contrasts sharply with the Bush Administration’s energystrategy, which heavily focuses on fossil fuels and lacks any significant effort to protect theclimate. The policies address major areas of energy use in the buildings, industrial, transport,and electrical sectors. Analyses of the investment costs and energy savings of policies to promoteenergy efficiency and co-generation in the residential, commercial, and industrial sectors weretaken primarily from the American Council for an Energy Efficient Economy (1999; 2001).
Below we group these policies into the particular sector where they take effect, and describe thekey assumptions made concerning the technological impacts of the individual policies. Unlessotherwise indicated, each of the policies is assumed to start in 2003.
As explained further in the methodology discussion in the next section, we adapted the EnergyInformation Administration’s 2001 Reference Case Forecast (EIA 2001) to create a slightlyrevised “base case.” Our policies and assumptions build on those included in this base caseforecast (i.e., we avoid taking credit for emissions reductions, costs, or savings already includedin the EIA 2001 Reference Case). When taken together, the policies described in this sectionrepresent a Climate Protection Scenario that the US could pursue to achieve significant carbonreductions.
3.1 Policies in the Buildings and Industrial Sectors
Carbon emissions from fuel combustion in the buildings (including both residential andcommercial) sector account for about 10 percent of US greenhouse gas emissions, whileemissions from the industrial sector account for another 20 percent. When emissions associatedwith the electricity consumed are counted, these levels reaches over 35% for buildings and 30%for industry. We analyzed a set of policies that include new building codes, new appliancestandards, tax incentives for the purchase of high efficiency products, a national public benefitsfund, expanded research and development, voluntary agreements and support for combined heatand power.
7
Building codes
Building energy codes require all new residential and commercial buildings to be built to aminimum level of energy efficiency that is cost-effective and technically feasible. “Goodpractice” residential energy codes, defined as the 1992 (or a more recent) version of the ModelEnergy Code (now known as the International Energy Conservation Code), have been adoptedby 32 states (BCAP 1999). “Good practice” commercial energy codes, defined as the ASHRAE90.1 model standard, have been adopted by 29 states (BCAP 1999). However, the Energy PolicyAct of 1992 (EPAct) requires all states to adopt a commercial building code that meets orexceeds ASHRAE 90.1, and requires all states to consider upgrading their residential code tomeet or exceed the 1992 Model Energy Code.
This policy assumes that DOE enforces the commercial building code requirement in EPAct andthat states comply. We also assume that relevant states upgrade their residential energy code toeither the 1995 or 1998 Model Energy Code either voluntarily or through the adoption of a newfederal requirement. Furthermore, we assume that the model energy codes are significantlyimproved during the next decade and that all states adopt mandatory codes that go beyondcurrent “good practice” by 2010. To quantify the impact of these changes, we assume a 20%energy savings in heating and cooling in buildings in half of new homes and commercialbuildings.
New Appliance and Equipment Efficiency Standards
The track record for electricity efficiency standards is impressive, starting with the NationalAppliance Energy Conservation Act of 1987 and continuing through the various updates thatwere enacted in early 2001 for washers, water heaters, and central air conditioners. Thesestandards have removed the most inefficient models from the market, while still leavingconsumers with a diversity of products. An analysis of Department of Energy figures by theAmerican Council for an Energy Efficient Economy, estimates nearly 8% of annual electricityconsumption will be saved in 2020 due to standards already enacted (Geller et al. 2001).However, many appliance efficiency standards haven’t kept pace with either legal updatingrequirements or technological advances. The Department of Energy is many years behind itslegal obligation to regularly upgrade standards for certain appliances to the “maximum level ofenergy efficiency that is technically feasible and economically justified.”
In this study, we assume that the government upgrades existing standards or introduces newstandards for several key appliances and equipment types: distribution transformers, commercialair conditioning systems, residential heating systems, commercial refrigerators, exit signs, trafficlights, torchiere lighting fixtures, ice makers, and standby power consumption for consumerelectronics. We also assume the higher energy efficiency standards for residential central airconditioning and heat pumps than was allowed by the Bush Administration. These are allmeasures that can be taken in the near term, based on technologies that are available and cost-effective.
Tax incentives
A wide range of advanced energy-efficient products have been proven and commercialized, buthave not yet become firmly established in the marketplace. A major reason for this is thatconventional technologies get “locked-in”; they benefit from economies of scale, consumerawareness and familiarity, and already existing infrastructure that make them more able to attract
8
consumers, while alternatives are overlooked though they could be financially viable once mass-produced and widely demonstrated. Initial, temporary tax incentives can help usher advancedalternatives into the market place, which – once established – can proceed to gain significantmarket share without further subsidy.
In this study, we consider initial tax incentives for a number of products. For consumerappliances, we considered a tax incentive of $50 to $100 per unit. For new homes that are at least30% more efficient that the Model Energy Code, we considered an incentive of up to $2,000 perhome; for commercial buildings with at least 50% reduction in heating and cooling costs relativeto applicable building codes, we applied an incentive equal to $2.25 per square foot. Regardingbuilding equipment such as efficient furnaces, fuel cell power systems, gas-fired heat pumps, andelectric heat pump water heaters, we considered a 20% investment tax credit. Each of theseincentives would be introduced with a sunset clause, terminating them or phasing them out inapproximately five years, so as to avoid their becoming permanent subsidies. Versions of all ofthe tax incentives considered here have already been introduced into bills before the Senateand/or House7.
National Public Benefits Fund
Electric utilities have historically funded programs to encourage more efficient energy-usingequipment, assist low-income families with home weatherization, commercialize renewables,and undertake research and development (R&D). Such programs have typically achievedelectricity bill savings for households and businesses that are roughly twice the program costs(Nadel and Kushler, 2000). Despite the proven effectiveness of such technologies and programs,increasing price competition and restructuring have caused utilities to reduce these “publicbenefit” expenditures over the past several years. In order to preserve such programs, fifteenstates have instituted public benefits funds that are financed by a small surcharge on all powerdelivered to consumers.
This study’s policy package includes a national level public benefits fund (PBF) fashioned afterthe proposal introduced by Sen. Jeffords (S. 1369) and Rep. Pallone (H. 2569) in the the 106th
Congress. The PBF would levy a surcharge of 0.2 cents per kilowatt-hour on all electricity sold,costing the typical residential consumer about $1 per month. This federal fund would providematching funds for states for approved public benefits expenditures. In this study, the PBF isallocated to several different programs directed at improvements in lighting, air conditioning,motors, and other cost-effective energy efficiency improvements in electricity-using equipment.
Expand Federal funding for Research and Development in Energy Efficient Technologies
Federal R&D funding for energy efficiency has been a spectacularly cost-effective investment.The DOE has estimated that the energy savings from 20 of its energy efficiency R&D programshas been roughly $30 billion so far – more than three times the federal appropriation for theentire energy efficiency and renewables R&D budget throughout the 1990s (EERE, 2000). At atime when energy issues are in the forefront of the national debates, such R&D efforts should beincreased and should be thought of as a remedy for the real energy crises engendered by
7 The bills include those introduced by Senators Murkowski and Lott (S.389); Bingaman and Daschle (S.596), Smith(S.207), Hatch (S.760), and Representative Nussle (H.R. 1316).
9
continued fossil fuel dependence – climate change, environmental damage, and diminishingfossil fuel supplies.
Tremendous opportunities exist for further progress in material-processing technologies,manufacturing processing, electric motors, windows, building shells, lighting, heating/coolingsystems, and super-insulation, for example. The EPA’s Energy Star programs have also savedlarge amounts of energy, building on the achievements of R&D efforts and ushering efficientproducts into the marketplace. By certifying and labeling efficient lighting, office equipment,homes and offices, Energy Star has helped foster a market transformation toward much moreefficient products and buildings. Currently, roughly 80 percent of personal computers, 95 percentof monitors, 99 percent of printers, and 65 percent of copiers sold are Energy Star certified(EPA, 2001; Brown et al, 2001). In light of these successes, EPA should be allocated the fundsto broaden the scope of its Energy Star program, expanding to other products (refrigerators,motors) and building sectors (hotels, retailers), and the vast market of existing buildings thatcould be retrofitted. In this study, we assume that increased funding to expand research anddevelopment efforts in industry (e.g., motors) buildings (e.g., advanced heating/cooling), andtransport (e.g., more fuel efficient cars and trucks) will lead to more energy-savings productsbecoming commercially available.
Industrial Energy Efficiency through Intensity Targets
There is remarkable quantity of untapped, cost-effective energy efficiency potential in today’sindustrial facilities (Elliott 1994), and some corporate managers have shown impressive initiativein moving to realize that potential. In 1995, Johnson and Johnson set a goal of reducing itsenergy costs 10% by 2000 through adoption of “best practices” in its 96 U.S. facilities. Buildingon this work, in 2000 Johnson & Johnson pledged to reduce global warming gases by sevenpercent below 1990 levels by the year 2010, with an interim goal of four percent below 1990levels by 2005.
In 1998, British Petroleum announced it would voluntarily reduce its carbon emissions to 10percent below 1990 levels by 2010, representing almost a 40 percent reduction from projectedemissions levels in 2010 given “business-as-usual” emissions growth (Romm 1999). And inSeptember 1999, DuPont announced it would reduce its GHG emissions worldwide by 65percent relative to 1990 levels, while holding total energy flat and increasing renewable energyresources to 10 percent of total energy inputs, by 2010. DuPont appears to be on track forachieving earlier commitments to reduce energy intensity 15 percent and total GHG emissions50 percent, relative to 1990 levels, by 2000 (Romm 1999). Companies as diverse as Alcoa,Kodak, Polaroid, IBM and Royal Dutch Shell also find it cost-effective to establish worldwidegreenhouse gas reduction targets. The practices these companies are developing make thembetter prepared for an economy that places a value on carbon reductions.
There is substantial potential for cost-effective efficiency improvement in both energy-intensiveand non-energy intensive industries (Elliott 1994). For example, an in-depth analysis of 49specific energy efficiency technologies for the iron and steel industry found a total cost-effectiveenergy savings potential of 18% (Worrell, Martin, and Price 1999).
We consider in this study federal initiatives to motivate and assist industry to identify and exploitenergy efficiency opportunities. Government agencies can support industry by providingtechnical and financial assistance, and by expanding federal R&D and demonstration programs.
10
In addition to these carrots, government may need to brandish a stick in order to induce a largefraction of industries to make serious energy efficiency commitments. If industry does notrespond to the federal initiatives at a level sufficient to meet certain energy efficiency targets, amandatory, binding energy intensity standard should be triggered to ensure the required targetsare attained.
Support for Co-generation
Cogeneration (or, combined heat and power – CHP) is a super-efficient means of co-producingtwo energy-intensive products that are usually produced separately – heat and power. Thetechnical and economical value of CHP has been widely demonstrated, and some Europeancountries rely heavily on CHP for producing power and providing heat to industries, businesses,and households. The thermal energy produced in co-generation can also be used for (buildingand process) cooling or to provide mechanical power.
While CHP already provides about 9 percent of all electricity in the US, there are considerablebarriers to its wider cost-effective implementation (Elliott and Spurr, 1999). Environmentalstandards should be refined to recognize the greater overall efficiency of CHP systems, forexample by assessing facility emissions on the basis of fuel input, rather than useful energyoutput. Non-uniform tax standards discourage CHP implementation in certain facilities.Moreover, utility practices are generally highly hostile to prospective CHP operators, throughdiscriminatory pricing and burdensome technical requirements and costs for connecting to thegrid.
In this study, we consider the impact of introducing policies that would establish a standardpermitting process, uniform tax treatment, accurate environmental standards, and fair access toelectricity consumers through the grid. Such measures would help to unleash a significantportion of the enormous potential for CHP. In this study we assumed 50 GW of new CHPcapacity by 2010, and an additional 95 GW between 2011 and 2020. With electricity demandreduced by the various energy efficiency policies adopted in this study, co-generated electricityreaches 8% percent of total remaining electricity requirements in 2010 and 36% percent in 2020.
3.2 Policies in the Electric Sector
A major goal of US energy and climate policy will be to dramatically reduce carbon and otherpollutant emissions from the electric sector, which is responsible for more than one-third of allUS greenhouse gas emissions. We analyzed a set of policies in the electric sector that includestandards and mechanisms to help overcome existing market barriers to investments intechnologies that can reduce emissions. Three major policies -- a renewable portfolio standard, acap on pollutant emissions, and a carbon cap and trade system -- were considered as describedbelow.
Renewable Portfolio Standard
A Renewable Portfolio Standard (RPS) is a flexible, market-oriented policy for accelerating theintroduction of renewable resources and technologies into the electric sector. An RPS sets aschedule for establishing a minimum amount of renewable electricity as a fraction of totalgeneration, and requires each generator that sells electricity to meet the minimum either by
11
producing that amount of renewable electricity in its mix or acquiring credits from generatorsthat exceed the minimum. The market determines the portfolio of technologies and geographicdistribution of facilities that meet the target at least cost. This is achieved by a trading systemthat awards credits to generators for producing renewable electricity and allows them to sell orpurchase these credits. Thirteen states – Arizona, Connecticut, Hawaii, Iowa, Maine,Massachusetts, Minnesota, Nevada, New Jersey, New Mexico, Pennsylvania, Texas, andWisconsin – already have RPSs, and Senator Jeffords introduced a bill in the 106th Congress (S.1369) to establish a national RPS.
The RPS provides strong incentives for suppliers to design the lowest cost, most reliablerenewable electricity projects, and to identify niche applications and consumers where theprojects will have the greatest value. It also provides assurance and stability to renewabletechnology vendors, by guaranteeing markets for renewable power, allowing them to capture thefinancial and administrative advantages that come with planning in a more stable marketenvironment. Yet it still maintains a competitive environment that encourages developers toinnovate. Finally, by accelerating the deployment of renewable technologies and resources, theRPS also accelerates the learning and economies of scale that allow renewables to becomeincreasingly competitive with conventional technologies. This is particularly important, as thedemands of climate stabilization in coming decades will require more renewable energy than wecan deploy in the next two decades.
In this study, we have applied an RPS that starts at a 2 percent requirement in 2002, grows to10% in 2010, and to 20% in 2020, after all efficiency policies are included. Wind, solar,geothermal, biomass, and landfill gas are eligible renewable sources of electricity, butenvironmental concerns exclude municipal solid waste (owing to concerns about toxic emissionsfrom waste-burning plants) and large-scale hydro (which also raises environmental concern andneed not be treated as an emerging energy technology as it already supplies nearly 10% of thenation’s electricity supply).
As a modest addition to the RPS we provide a subsidy to grid-connected solar photovoltaicelectricity generation. The purpose of this subsidy is to introduce a small amount of thistechnology so that it can play a role in the generation mix, seeking to induce technology learning,performance improvement and scale economies, and ultimately increased fuel diversity andanother zero emissions option for the longer term. The level is kept small so that costs and priceimpacts are minimal.
Tightening of SO2 and NOx Emission Regulations
Acid rain and urban air pollution remain serious problems in the US. The 1990 Clean Air ActAmendments attempted to address these problems, by introducing a cap-and-trade system toroughly halve the electric sector’s SO2 emissions by 2000, and imposing technology-specificstandards for NOx emissions. Compliance with the SO2 standard proved markedly cheaper thaninitially expected; initial estimates were mostly based on investments in “scrubbers” but thediscovery of large low-sulfur coal reserves in the Wyoming basins and a sharp decline in the costof rail transport resulted in lower costs.
Despite the improvements brought about by the Clean Air Act and its Amendments, recentstudies have confirmed that SO2 and NOx continue to harm lake and forest ecosystems, decreaseagricultural productivity and affect public health through its damaging affects on urban air
12
quality (Clean Air Task Force, 2000). The Clean Air Act only calls for minimal reductions inthe cap by 2010 and no reductions after that.
In this study, we tighten the SO2 cap so as to reduce sulfur emissions to roughly 40% of currentlevels by 2010 and one third of current levels by 2020. We also impose a cap-and-trade systemon NOx emissions in the summertime, when NOx contributes more severely to photochemicalsmog. This system expands the current cap and trade program, which calls on 19 states to meet atarget in 2003 that then remains constant, to include all states with a cap that is set first in 2003but decreases in 2010, relative to 1999 levels. The cap results in a 25% reduction of annual NOxemissions by 2003, and a 50% reduction by 2010.
Carbon Cap-And-Trade Permit System
This study introduces a cap-and-trade system for carbon in the electric sector; with the cap set toachieve progressively more stringent targets over time, starting in 2003 at 2% below currentlevels, increasing to 12% below current by 2010 and 30% below by 2020. Restricting carbonemissions from electricity generation has important co-benefits, including reduced emissions ofSO2 and NOx, as discussed above, fine particulate matter, which is a known cause of respiratoryailments, and mercury, which is a powerful nervous system toxin and already contaminates over50,000 lakes and streams in the US. A progressively more stringent target also reduces demandfor coal, and hence mining-related pollution of streams and degradation of landscapes andterrestrial habitats.
In the SO2, NOx, and CO2 trading systems, permits are distributed through an open auction, andthe resulting revenues can be returned to households (e.g., through a tax reduction or as a rebateback to households). Recent analyses suggest that an auction is the most economically efficientway to distribute permits, meeting emissions caps at lower cost than allocations based ongrandfather allowances or equal per kWh allowances (Burtraw, et al. 2001). Implementing suchauctions for the electric sector will also clear the way for an economy-wide approach in futureyears based on auctioning. In this study, the price of auctioned carbon permits reaches $100 permetric ton carbon.
While not specifically targeted by the trading programs, the operators of the 850 old “grand-fathered” coal plants built before the Clean Air Act of 1970, which emit 3-5 times as muchpollution per unit of power generated than newer coal power plants, will likely retire these plantsrather than face the cost of purchase the large amount of credits necessary to keep them running.When the Clean Air Act was adopted, it was expected that these dirty power plants wouldeventually be retired. However, utilities are continuing to operate these plants beyond theirdesign life, and have in fact increased their output over the last decade. By subjecting these oldplants to the same requirements as newer facilities, as has been done or is being considered inseveral states including Massachussetts and Texas, operators would be obliged to modernize theold plants or to retire them in favor of cleaner electric generation alternatives.
With a cap and trade system in place for CO2, SOx and NOx, this scenario reduces multipleemissions from power plants, in a manner similar to that adopted in the Four Pollutant Billcurrently before the House (H.R., 1256) and the Senate (S. 556). The reductions in these threepollutants are as deep as those imposed in the Four Pollutant bills, and are achieved within acomparable time frame. (The Department of Energy's NEMS model unfortunately does not
13
explicitly track mercury, making it impossible to compare the results of this study to the mercuryrequirement in the Four Pollutant Bill.8)
3.3 Policies in the Transport Sector
Another goal of US energy and climate policy will be to reduce carbon emissions from thetransport sector, which is responsible for about one-third of all US greenhouse gas emissions. Weanalyzed a set of policies in the transportation sector that include improved efficiency (light dutyvehicles, heavy duty trucks and aircraft), a full fuel-cycle GHG standard for motor fuels,measures to reduce road travel, and high speed rail.
Strengthened CAFE Standards
Today’s cars are governed by fuel economy standards that were set in the mid-1970s. Theefficiency gains made in meeting those standards have been entirely wiped out by increases inpopulation and driving, as well as the trend toward gas-guzzling SUVs. When the fuel economystandards were implemented, light duty trucks only accounted for about 20 percent of vehiclesales. Light trucks now account for nearly 50 percent of new vehicle sales; this has brought downthe overall fuel economy of the light duty vehicle fleet, which now stands at its lowest averagefuel economy since 1981. If the fuel economy of new vehicles had held at 1981 levels rather thantipping downward, American vehicle owners would be importing half a million fewer barrels ofoil each day.
We introduce in this study a strengthened Corporate Average Fuel Economy standard for carsand light trucks, along with complementary market incentive programs. Specifically, fueleconomy standards for new cars and light trucks rise from EIA’s projected 25.2 mpg for 2001 to36.5 mpg in 2010, continuing to 50.5 mpg by 2020. This increase in vehicle fuel economy wouldsave by 2020 approximately twice as much oil as could be pumped from Arctic NationalWildlife Refuge oil field over its entire 50-year lifespan (USGS, 2001).9 Based on assessments ofnear-term technologies for conventional vehicles, and advanced vehicle technologies for thelonger-term, we estimate that the 2010 CAFE target can be met with an incremental vehicle costof approximately $855, and the 2020 CAFE target with an incremental cost of $1,900. To putthese incremental costs in perspective, they are two to three times less than the fuel savings at thegasoline pump over the vehicle’s lifetime10.
Improving Efficiency of Freight Transport
We also consider policies to improve fuel economy for heavy duty truck freight transport, whichaccounts for approximately 16% of all transport energy consumption. A variety of improvementssuch as advanced diesel engines, drag reduction, rolling resistance, load reduction strategies, andlow friction drivetrains offer opportunities to increase the fuel economy of freight trucks. Manyof these technologies are available today while other technologies like advanced diesel andturbine engines have been technically demonstrated but are not yet commercially available.
8 On December 15, 2000, the EPA announced that mercury emissions need to be reduced, and that regulations willbe issued by 2004. 9 Assuming a mean value at a market price of oil of $20/barrel.10 Assuming a retail price of gasoline of $1.50/gallon, a 10-year life of the vehicle, and 12,000 miles per year.
14
To accelerate the improvement in heavy duty truck efficiency, we have considered measures thatexpand R&D for heavy duty diesel technology, vehicle labeling and promotion, financialincentives to stimulate the introduction of new technologies, efficiency standards for medium-and heavy-duty trucks, and fuel taxes and user-fees calibrated to eliminate the existing subsidiesfor freight trucking. Together, it is estimated that these policies could bring about a fuel economyimprovement of 6% by 2010, and 23% by 2020, relative to today’s trucks.
Improving Efficiency of Air Travel
Air travel is the quickest growing mode of travel, and far more energy intensive than vehicletravel. One passenger mile of air travel today requires about 1.7 times as much fuel as vehicletravel.11. We consider here policies for improving the efficiency of air travel, including R&D inefficient aircraft technologies, fuel consumption standards, and a revamping of policies thatsubsidize air travel through public investments.
We assume that air travel efficiency improves by 23% by 2010, and 53% by 2020. This is incontrast to the Base Case where efficiency increases by 9% by 2010 and 15% by 2020, owing toa combination of aircraft efficiency improvements (advanced engine types, lightweightcomposite materials, and advanced aerodynamics), increased load factor, and acceleration of airtraffic management improvements (Lee et el, 2001; OTA, 1994; Interlaboratory Working Group,2000). While we assume that air travel can reach 82 seat-miles per gallon by 2020 from itscurrent 51, it is technologically possible that far greater efficiencies approaching 150 seat-miles/gal could be achieved, if not in that time period then over the longer term. (Alliance toSave Energy et al, 1991).
Greenhouse Gas Standards for Motor Fuels
Transportation in the US relies overwhelmingly on petroleum-based fuels, making it a majorsource of GHG emissions. We introduce here a full fuel-cycle GHG standard for motor fuels,similar in concept to the RPS for the electric sector. The standard is a cap on the average GHGemissions from gasoline, and would be made progressively more stringent over time. Fuelsuppliers would have the flexibility to meet the standard on their own or by buying tradablecredits from other producers of renewable or low-GHG fuel.
The policy adopted in this study requires a 3 percent reduction in the average national GHGemission factor of fuels used in light duty vehicles in 2010, increasing to a 7 percent reduction by2020. The policy would be complemented by expanded R&D, market creation programs, andfinancial incentives. Such a program would stimulate the production of low-GHG fuels such ascellulosic ethanol and biomass- or solar-based hydrogen.
For this modeling study, we assume that most of the low-GHG fuel is provided as cellulosicethanol, which can be produced from agricultural residues, forest and mill wastes, urban woodwastes, and short rotation woody crops (Walsh et al 1998; Walsh, 1999). As cellulosic ethanolcan be co-produced along with electricity, in this study we assume that electricity output reaches10 percent of ethanol output by 2010 and 40 percent by 2020 (Lynd, 1997). Due to theaccelerated development of the production technology for cellulosic ethanol, we estimate that the
11 Assuming typical load factors of 0.33 for autos and 0.6 for air
15
price falls to $1.4 per gallon of gasoline equivalent by 2010 and remains at that price thereafter(Interlaboratory Working Group, 2000).
Improving Alternative Modes to reduce Vehicle Miles Traveled
The amount of travel in cars and light duty trucks continues to grow due to increasing populationand low vehicle occupancy. Between 1999 and 2020, the rate of growth in vehicle miles traveledis projected to increase in the Base Case by about 2% per year. The overall efficiency of thepassenger transportation system can be significantly improved through measures that contain thegrowth in vehicle miles traveled through land-use and infrastructure investments and pricingreforms to remove implicit subsidies for cars, which are very energy intensive.
We assume that these measures will primarily affect urban passenger transportation and result ina shift to higher occupancy vehicles, including carpooling, vanpooling, public transportation, andtelecommuting. We consider that the level of reductions of vehicle miles traveled that can beachieved by these measures relative to the Base Case are 8% by 2010 and 11% by 2020.
High Speed Rail
High speed rail offers an attractive alternative to intercity vehicle travel and short distance airtravel. In both energy cost and travel time, high speed rail may be competitive with air travel fortrips of roughly 600 miles or less, which account for about one-third of domestic air passengermiles traveled. Investments in rail facilities for key inter-city routes (such as the Northeastcorridor between Washington and Boston, the East cost of Florida between Miami and Tampa,and the route linking Los Angeles and San Francisco) could provide an acceptable alternativeand reduce air travel in some of the busiest flight corridors (USDOT, 1997).
High speed rail can achieve practical operating speeds of up to 200 mph. Prominent examplesinclude the French TGV, the Japanese Shinkansen, and the German Intercity Express. Anemerging advanced transport technology is the maglev system in which magnetic forces lift andguide a vehicle over a specially designed guideway. Both Germany and Japan are activedevelopers of this technology.
In this analysis we have taken the DOT’s recent estimates of the potential high speed railridership which, based on projected mode shifts from air and automobile travel in several majorcorridors of the US, reaches about 2 billion passenger miles by 2020 (DOT, 1997). While thislevel of HRS ridership provides relatively small energy and carbon benefits by 2020, it can beviewed as the first phase of a longer-term transition to far greater ridership and more advanced,faster and efficient electric and MAGLEV systems in the ensuing decades.
4 Methods and Assumptions
The modeling for this study was based primarily on the National Energy Modeling System(NEMS) of the U.S. Department of Energy, Energy Information Administration (DOE/EIA)(EIA, 2001). The NEMS model version, data and assumptions employed in this study were thoseof EIA’s Annual Energy Outlook (EIA 2001), which also formed the basis for the Base Case. Werefined the NEMS model with advice from EIA, based on their ongoing model improvements,
16
and drawing on expert advice from colleagues at ACEEE and the Union of Concerned Scientists,the National Laboratories and elsewhere.12
The NEMS model takes account of the interactions between electricity supply and demand(aggregated residential, commercial and industrial), taking account of the mix of competitive andstill regulated pricing in the US. It accounts for the feedback effects between electricity marketand power plant construction decisions, as well as the links between fuel demands, supplies andprices.
Our use of NEMS for this project focused on the Electricity Market Module (EMM),complemented by the Oil and Gas Supply Module (OGSM). The EMM starts with the detailedfleet of existing power plants in the thirteen electric sector regions of the U.S, and also representspower imports from neighboring Canadian regions. It makes dispatch, construction, inter-regional purchase and retirement decisions based upon the regional electricity demands and thecost and performance characteristics of existing and new electric supply options, adhering tonational pollutant caps and any state-level RPS requirements. It also takes account of costreductions of new power plants with increased units in operation (learning and scale economies).The OGSM tracks changes in prices of natural gas and petroleum fuels based on changes in theirdemand.
Analyses of the costs and demand impacts of policies to promote energy efficiency and co-generation in the residential, commercial, and industrial sectors were taken primarily fromAmerican Council for an Energy Efficient Economy (ACEEE, 1999; ACEEE, 2001). Theelectric generation, fuel, emissions and monetary savings from these policies were obtainedusing NEMS, to take account of all of the interactive and feedback effects described above.NEMS was used also to obtain the interactive effects of the policies affecting electricity demandand those, such as renewable, carbon and emission standards, which affect the electricity supplymix.
For example, we used information from ACEEE to lower the fuel and electricity demand withinNEMS based on policies in the demand sectors. We ran NEMS to determine the new mix ofelectricity generation (based on changes in both electricity demand and the electricity sectorpolicies). This resulted in decreased demand for oil and gas, leading to lower prices. NEMSiterates internally between energy supply and demand to seek a consistent solution.
Analyses of the policy impacts in the transportation sector took account of vehicle stockturnover, fuel-efficiencies and travel indices, and were benchmarked to the structure, data andbaseline projections of the AEO2001. Following assumptions for light duty vehicle efficiency inACEEE (2001) and other sources (DeCicco, Ross and An, 2001), we accounted for bothautonomous and policy-induced vehicle efficiency improvement, shifts between transport modes,and changes in demand for transport services.
12 More detailed discussions of the approach taken for sectoral policy analyses upon which this study was based canbe found in Energy Innovations (EI 1997), the Energy Policy, Special Issue on Climate Strategy for the UnitedStates (1998), and Bernow et al. (1998 and 1999).
17
5 Results
Carbon dioxide emissions in the United States have been rising over the past decade, and nowexceed by more than 15 percent the 1990 emission rate of 1338 MtC/yr (EIA, 2001b). The USDepartment of Energy (EIA, 2001a) business-as-usual scenario projects that these emissions willto continue to rise to 1808 MtC/yr in 2010 – a 35 percent increase above 1990 levels. This is instark contrast to the emissions limit that the US negotiated at Kyoto – a 7 percent decrease below1990 levels.
5.1 Overview of Results
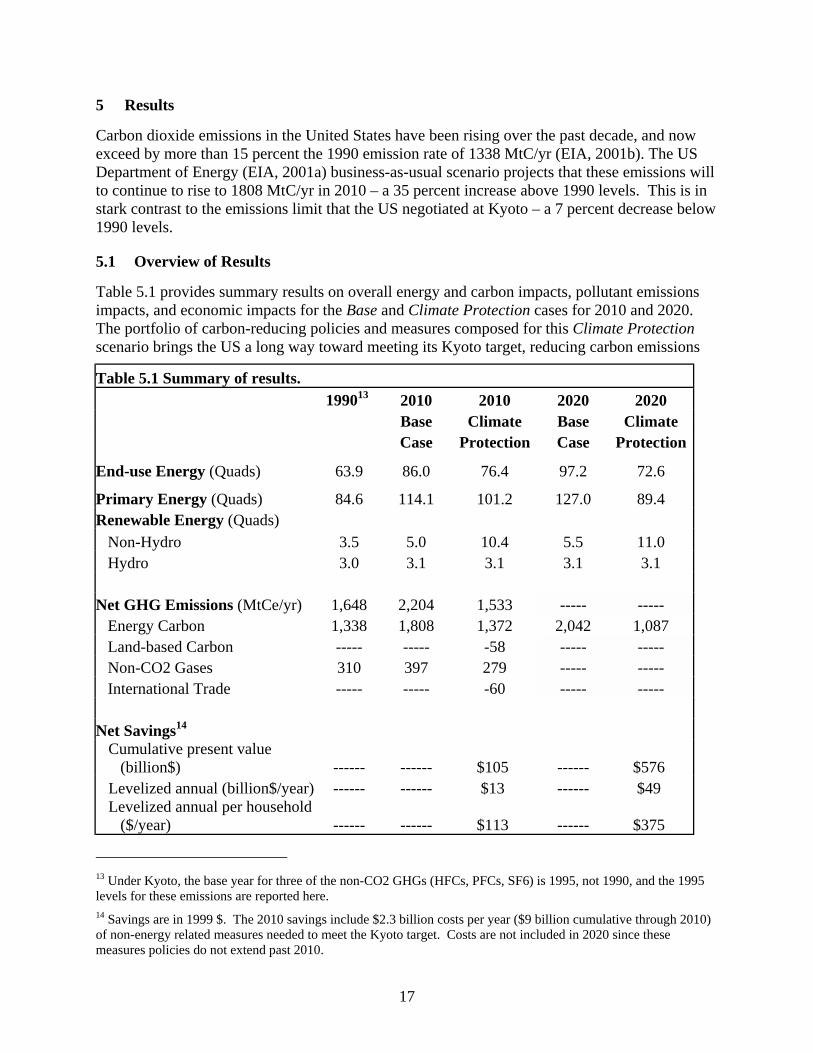
Table 5.1 provides summary results on overall energy and carbon impacts, pollutant emissionsimpacts, and economic impacts for the Base and Climate Protection cases for 2010 and 2020.The portfolio of carbon-reducing policies and measures composed for this Climate Protectionscenario brings the US a long way toward meeting its Kyoto target, reducing carbon emissions
Table 5.1 Summary of results. 199013 2010 2010 2020 2020 Base Climate Base Climate Case Protection Case Protection
End-use Energy (Quads) 63.9 86.0 76.4 97.2 72.6
Primary Energy (Quads) 84.6 114.1 101.2 127.0 89.4Renewable Energy (Quads) Non-Hydro 3.5 5.0 10.4 5.5 11.0 Hydro 3.0 3.1 3.1 3.1 3.1 Net GHG Emissions (MtCe/yr) 1,648 2,204 1,533 ----- ----- Energy Carbon 1,338 1,808 1,372 2,042 1,087 Land-based Carbon ----- ----- -58 ----- ----- Non-CO2 Gases 310 397 279 ----- ----- International Trade ----- ----- -60 ----- ----- Net Savings14
Cumulative present value(billion$) ------ ------ $105 ------ $576
Levelized annual (billion$/year) ------ ------ $13 ------ $49 Levelized annual per household
($/year) ------ ------ $113 ------ $375
13 Under Kyoto, the base year for three of the non-CO2 GHGs (HFCs, PFCs, SF6) is 1995, not 1990, and the 1995levels for these emissions are reported here.14 Savings are in 1999 $. The 2010 savings include $2.3 billion costs per year ($9 billion cumulative through 2010)of non-energy related measures needed to meet the Kyoto target. Costs are not included in 2020 since thesemeasures policies do not extend past 2010.
from today’s level to 1372 MtC/yr by 2010 – but still 2.5 percent above 1990 levels. Reductionscontinue beyond 2010, and national emissions are reduced to 1087 MtC/yr in 2020, well below1990 levels.
Overall, the national policies and measures were estimated to achieve an 11 percent reduction inprimary energy use by 2010, and a nearly 30% reduction by 2020, while maintaining the samelevel of energy services to consumers. The use of renewable energy is doubled in 2010 relativeto the Base case and remains roughly at that level through 2020.15
The policies would also produce reductions in air pollutant emissions owing to reduced fossilfuel consumption and greater use of renewable energy. This is most evident for SO2 for which2010 levels in the Climate Protection case are almost half of Base case levels, due in great partto the effect of the more stringent cap in the electric sector.
The analysis showed that national savings in energy bills would exceed the net incrementalinvestments in more efficient technologies and expenditures for low carbon fuels. By 2010, theaverage savings exceed the additional costs of new equipment by $13 billion per year, or nearly$113 per household.
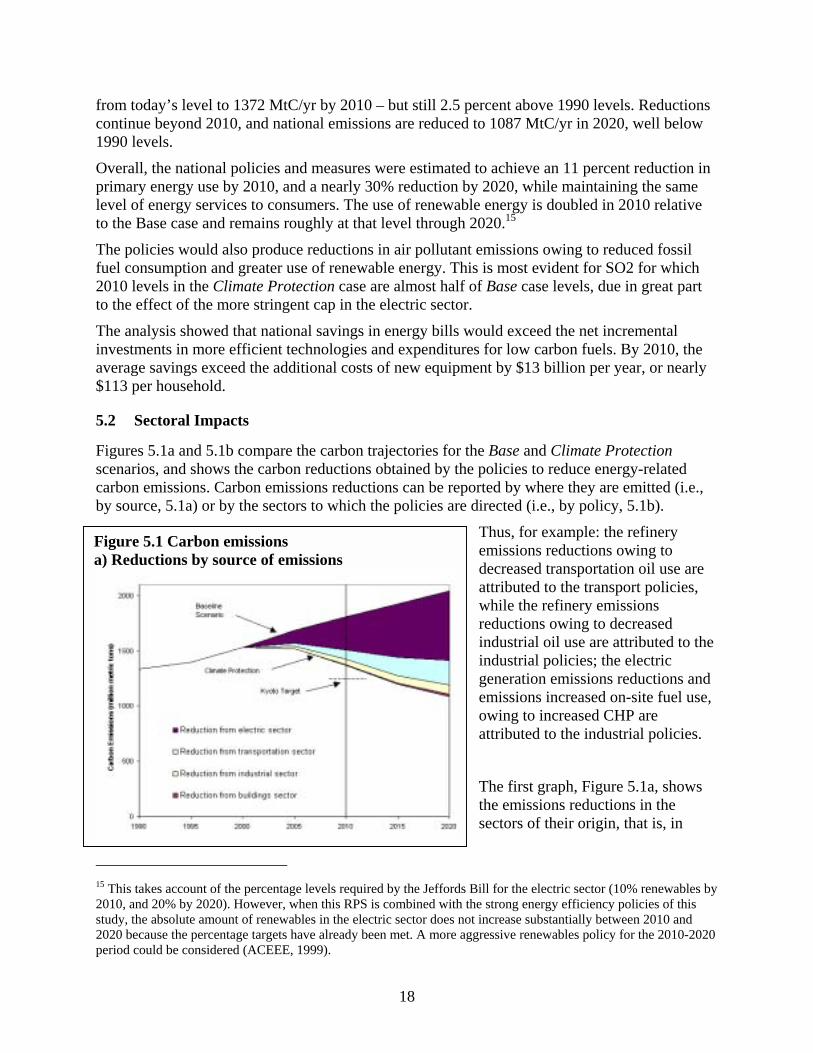
5.2 Sectoral Impacts
Figures 5.1a and 5.1b compare the carbon trajectories for the Base and Climate Protectionscenarios, and shows the carbon reductions obtained by the policies to reduce energy-relatedcarbon emissions. Carbon emissions reductions can be reported by where they are emitted (i.e.,by source, 5.1a) or by the sectors to which the policies are directed (i.e., by policy, 5.1b).
Thus, for example: the refineryemissions reductions owing to
Figure 5.1 Carbon emissionsa) Reductions by source of emissions
18
decreased transportation oil use areattributed to the transport policies,while the refinery emissionsreductions owing to decreasedindustrial oil use are attributed to theindustrial policies; the electricgeneration emissions reductions andemissions increased on-site fuel use,owing to increased CHP areattributed to the industrial policies.
The first graph, Figure 5.1a, showsthe emissions reductions in thesectors of their origin, that is, in
15 This takes account of the percentage levels required by the Jeffords Bill for the electric sector (10% renewables by2010, and 20% by 2020). However, when this RPS is combined with the strong energy efficiency policies of thisstudy, the absolute amount of renewables in the electric sector does not increase substantially between 2010 and2020 because the percentage targets have already been met. A more aggressive renewables policy for the 2010-2020period could be considered (ACEEE, 1999).
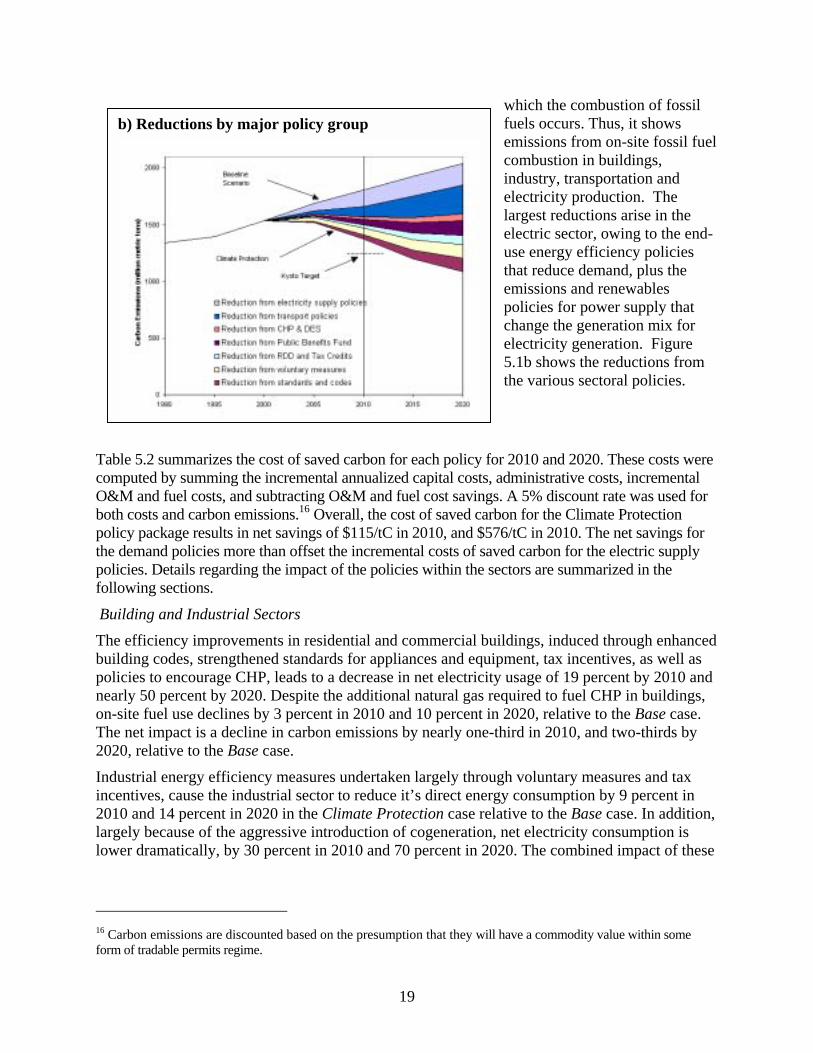
which the combustion of fossilfuels occurs. Thus, it shows
TacoO&bopothepofol
B
ThbuponeonTh20
Ininc20larlow
16 Cfor
b) Reductions by major policy group
19
emissions from on-site fossil fuelcombustion in buildings,industry, transportation andelectricity production. Thelargest reductions arise in theelectric sector, owing to the end-use energy efficiency policiesthat reduce demand, plus theemissions and renewablespolicies for power supply thatchange the generation mix forelectricity generation. Figure5.1b shows the reductions fromthe various sectoral policies.
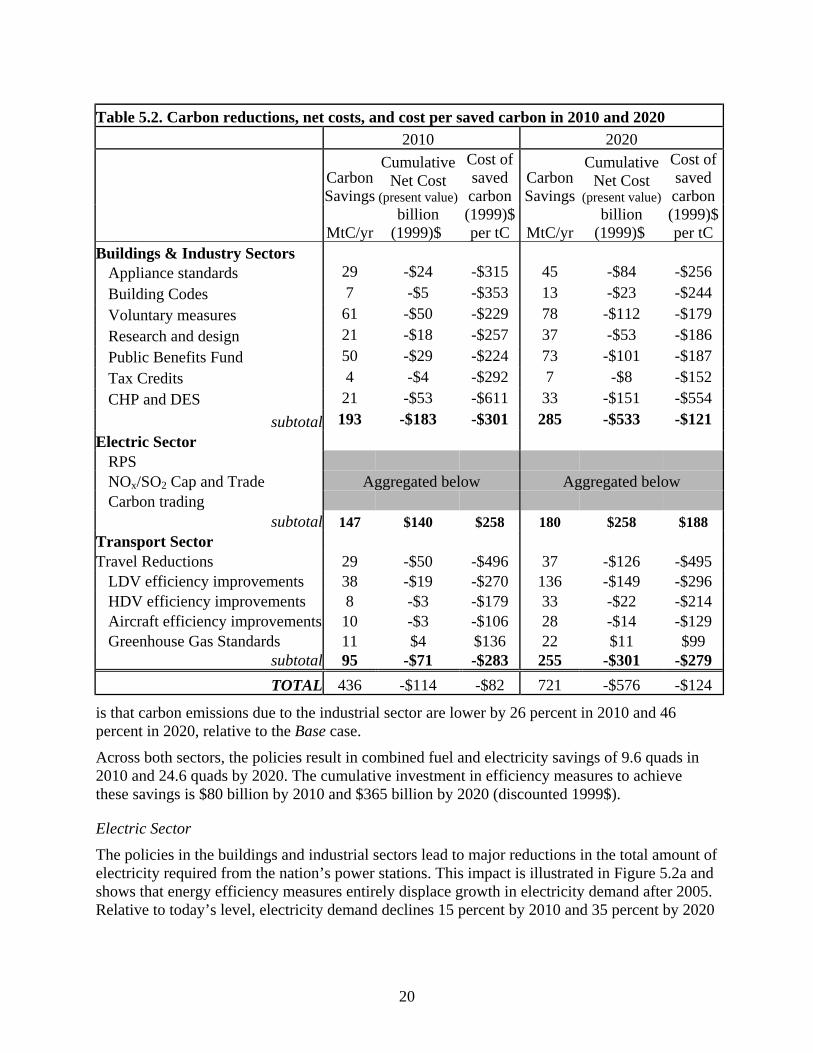
ble 5.2 summarizes the cost of saved carbon for each policy for 2010 and 2020. These costs weremputed by summing the incremental annualized capital costs, administrative costs, incremental
M and fuel costs, and subtracting O&M and fuel cost savings. A 5% discount rate was used forth costs and carbon emissions.16 Overall, the cost of saved carbon for the Climate Protectionlicy package results in net savings of $115/tC in 2010, and $576/tC in 2010. The net savings for demand policies more than offset the incremental costs of saved carbon for the electric supplylicies. Details regarding the impact of the policies within the sectors are summarized in thelowing sections.
uilding and Industrial Sectors
e efficiency improvements in residential and commercial buildings, induced through enhancedilding codes, strengthened standards for appliances and equipment, tax incentives, as well aslicies to encourage CHP, leads to a decrease in net electricity usage of 19 percent by 2010 andarly 50 percent by 2020. Despite the additional natural gas required to fuel CHP in buildings,-site fuel use declines by 3 percent in 2010 and 10 percent in 2020, relative to the Base case.e net impact is a decline in carbon emissions by nearly one-third in 2010, and two-thirds by20, relative to the Base case.
dustrial energy efficiency measures undertaken largely through voluntary measures and taxentives, cause the industrial sector to reduce it’s direct energy consumption by 9 percent in10 and 14 percent in 2020 in the Climate Protection case relative to the Base case. In addition,gely because of the aggressive introduction of cogeneration, net electricity consumption iser dramatically, by 30 percent in 2010 and 70 percent in 2020. The combined impact of these
arbon emissions are discounted based on the presumption that they will have a commodity value within some
m of tradable permits regime.
20
is that carbon emissions due to the industrial sector are lower by 26 percent in 2010 and 46percent in 2020, relative to the Base case.
Across both sectors, the policies result in combined fuel and electricity savings of 9.6 quads in2010 and 24.6 quads by 2020. The cumulative investment in efficiency measures to achievethese savings is $80 billion by 2010 and $365 billion by 2020 (discounted 1999$).
Electric Sector
The policies in the buildings and industrial sectors lead to major reductions in the total amount ofelectricity required from the nation’s power stations. This impact is illustrated in Figure 5.2a andshows that energy efficiency measures entirely displace growth in electricity demand after 2005.Relative to today’s level, electricity demand declines 15 percent by 2010 and 35 percent by 2020
Table 5.2. Carbon reductions, net costs, and cost per saved carbon in 2010 and 2020 2010 2020
CarbonSavings
CumulativeNet Cost
(present value)
Cost ofsavedcarbon
CarbonSavings
CumulativeNet Cost
(present value)
Cost ofsavedcarbon
MtC/yrbillion
(1999)$ (1999)$per tC MtC/yr
billion(1999)$
(1999)$per tC
Buildings & Industry SectorsAppliance standards 29 -$24 -$315 45 -$84 -$256Building Codes 7 -$5 -$353 13 -$23 -$244Voluntary measures 61 -$50 -$229 78 -$112 -$179Research and design 21 -$18 -$257 37 -$53 -$186Public Benefits Fund 50 -$29 -$224 73 -$101 -$187Tax Credits 4 -$4 -$292 7 -$8 -$152CHP and DES 21 -$53 -$611 33 -$151 -$554
subtotal 193 -$183 -$301 285 -$533 -$121Electric Sector
RPSNOx/SO2 Cap and Trade Aggregated below Aggregated belowCarbon trading
subtotal 147 $140 $258 180 $258 $188Transport SectorTravel Reductions 29 -$50 -$496 37 -$126 -$495
LDV efficiency improvements 38 -$19 -$270 136 -$149 -$296HDV efficiency improvements 8 -$3 -$179 33 -$22 -$214Aircraft efficiency improvements 10 -$3 -$106 28 -$14 -$129Greenhouse Gas Standards 11 $4 $136 22 $11 $99
subtotal 95 -$71 -$283 255 -$301 -$279TOTAL 436 -$114 -$82 721 -$576 -$124
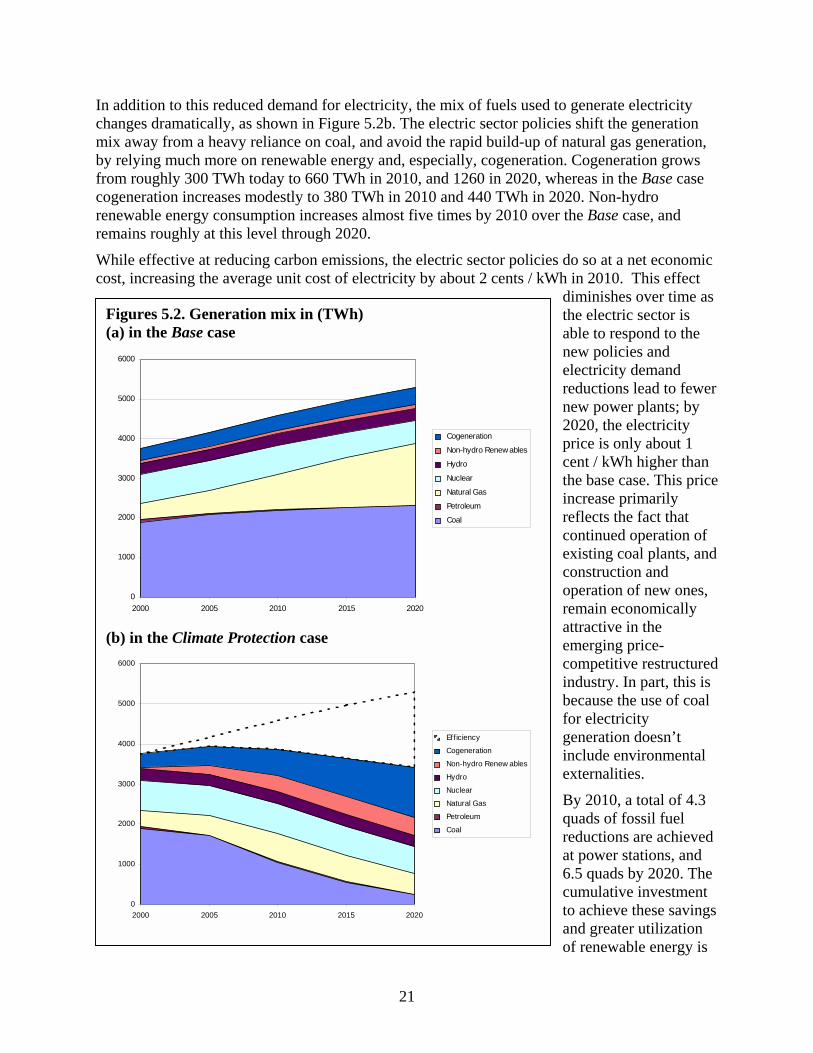
21
In addition to this reduced demand for electricity, the mix of fuels used to generate electricitychanges dramatically, as shown in Figure 5.2b. The electric sector policies shift the generationmix away from a heavy reliance on coal, and avoid the rapid build-up of natural gas generation,by relying much more on renewable energy and, especially, cogeneration. Cogeneration growsfrom roughly 300 TWh today to 660 TWh in 2010, and 1260 in 2020, whereas in the Base casecogeneration increases modestly to 380 TWh in 2010 and 440 TWh in 2020. Non-hydrorenewable energy consumption increases almost five times by 2010 over the Base case, andremains roughly at this level through 2020.
While effective at reducing carbon emissions, the electric sector policies do so at a net economiccost, increasing the average unit cost of electricity by about 2 cents / kWh in 2010. This effect
diminishes over time asthe electric sector isable to respond to thenew policies andelectricity demandreductions lead to fewernew power plants; by2020, the electricityprice is only about 1cent / kWh higher thanthe base case. This priceincrease primarilyreflects the fact thatcontinued operation ofexisting coal plants, andconstruction andoperation of new ones,remain economicallyattractive in theemerging price-competitive restructuredindustry. In part, this isbecause the use of coalfor electricitygeneration doesn’tinclude environmentalexternalities.
By 2010, a total of 4.3quads of fossil fuelreductions are achievedat power stations, and6.5 quads by 2020. Thecumulative investmentto achieve these savingsand greater utilizationof renewable energy is
Figures 5.2. Generation mix in (TWh)(a) in the Base case
0
1000
2000
3000
4000
5000
6000
2000 2005 2010 2015 2020
Cogeneration
Non-hydro Renew ables
Hydro
Nuclear
Natural Gas
Petroleum
Coal
(b) in the Climate Protection case
0
1000
2000
3000
4000
5000
6000
2000 2005 2010 2015 2020
Eff iciency
Cogeneration
Non-hydro Renew ables
Hydro
Nuclear
Natural Gas
Petroleum
Coal
22
$166 billion by 2010 and $333 billion by 2020 (discounted 1999$). Although the costs per unitof electricity increase, measures for demand-side efficiency lead to an overall decrease in end-users’ electricity bills, and in the overall costs of electricity services.
Transportation
The vehicle efficiency and transportation demand management initiatives in the ClimateProtection case result in energy savings of 4.6 quads in 2010, and 12.6 quads by 2020 (12percent in 2010 and 28 percent in 2020, respectively, relative to the Base case). Carbonemissions fall slightly more relative to the base case (13 percent in 2010 and 31 percent in 2020)due to the small shift to less carbon-intensive fuels (specifically, cellulosic ethanol). By 2010,ethanol is contributing about 2 percent of transport fuel demand, and 4 percent in 2020. As inother biomass-intensive industries, this enables the co-production of electricity, therebyincreasing the carbon benefits of this measure to the extent that it displaces fossil-fuel derivedelectricity. Reduced fuel production also adds to the carbon benefits, because it reducesemissions from refineries.
The cumulative investment to achieve these savings and greater utilization of renewable energyis $52 billion by 2010 and $213 billion by 2020 (discounted 1999$). The transport efficiencymeasures result in net savings, because fuel cost savings offset the slight increase in investmentcosts. These net savings more than offset the cost of the transportation fuel carbon contentstandard – which is the only net-cost transportation policy considered here. The overall neteconomic benefit achieved by the entire set of transportation policies provides an opportunity topursue the carbon content standard, which begins a process of progressive technologicalimprovement that is a critical element of obtaining the much deeper carbon emissions reductionsin the transport sector needed later.
5.3 Air Pollution Reductions
A variety of air pollutants, associated with the use of fossil fuels, can cause or exacerbate healthproblems and damage the environment. Reducing use of fossil fuels would reap important localhealth benefits by lowering the amount of air pollutants inhaled. Recent scientific findingsconfirm that pollutants such as fine particulates, carbon monoxide, ozone (formed by a mix ofvolatile organic compounds and nitrogen oxides in presence of sunlight) can lead to healthdamages, including premature death. Research shows that small children and the elderly areparticularly at risk from these emissions (Dockery et al., 1993; Schwartz and Dockery, 1992).
The policies would reduce national, regional and local pollution, owing to reduced fossil fueluse, providing important environmental benefits and health benefits, especially for small childrenand the elderly. Table 5.3 summarizes the impacts of the policies on criteria air pollutantemissions. Sulfur-dioxide emissions are about 52 percent lower in 2010 than the Base case, andabout 68 percent below 1990 levels. Nitrogen oxides are 16 percent lower in 2010, and about 37percent below 1990 levels. Particulates are about 13 percent lower in 2010, and about 24 percentbelow 1990 levels. Carbon monoxide emissions are about 9 percent lower in 2010, and about 2percent below 1990 levels. Finally, volatile organic compounds are about 7 percent lower in2010, and about 33% below 1990 levels.
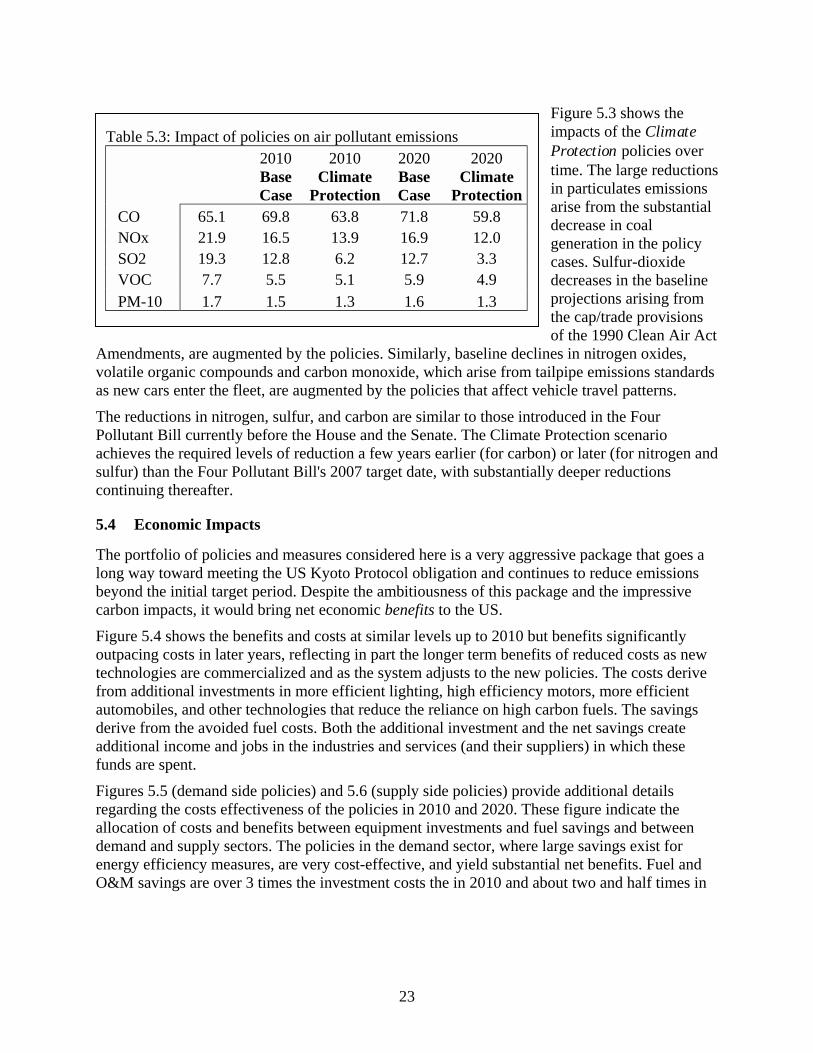
Figure 5.3 shows theimpacts of the ClimateProtection policies overtime. The large reductionsin particulates emissionsarise from the substantialdecrease in coalgeneration in the policycases. Sulfur-dioxidedecreases in the baselineprojections arising from
Ava
TPasc
5
Tlbc
Fotfadaf
FradeO
Table 5.3: Impact of policies on air pollutant emissions2010 2010 2020 2020BaseCase
ClimateProtection
BaseCase
ClimateProtection
CO 65.1 69.8 63.8 71.8 59.8 NOx 21.9 16.5 13.9 16.9 12.0 SO2 19.3 12.8 6.2 12.7 3.3 VOC 7.7 5.5 5.1 5.9 4.9 PM-10 1.7 1.5 1.3 1.6 1.3
23
the cap/trade provisionsof the 1990 Clean Air Act
mendments, are augmented by the policies. Similarly, baseline declines in nitrogen oxides,olatile organic compounds and carbon monoxide, which arise from tailpipe emissions standardss new cars enter the fleet, are augmented by the policies that affect vehicle travel patterns.
he reductions in nitrogen, sulfur, and carbon are similar to those introduced in the Fourollutant Bill currently before the House and the Senate. The Climate Protection scenariochieves the required levels of reduction a few years earlier (for carbon) or later (for nitrogen andulfur) than the Four Pollutant Bill's 2007 target date, with substantially deeper reductionsontinuing thereafter.
.4 Economic Impacts
he portfolio of policies and measures considered here is a very aggressive package that goes aong way toward meeting the US Kyoto Protocol obligation and continues to reduce emissionseyond the initial target period. Despite the ambitiousness of this package and the impressivearbon impacts, it would bring net economic benefits to the US.
igure 5.4 shows the benefits and costs at similar levels up to 2010 but benefits significantlyutpacing costs in later years, reflecting in part the longer term benefits of reduced costs as newechnologies are commercialized and as the system adjusts to the new policies. The costs deriverom additional investments in more efficient lighting, high efficiency motors, more efficientutomobiles, and other technologies that reduce the reliance on high carbon fuels. The savingserive from the avoided fuel costs. Both the additional investment and the net savings createdditional income and jobs in the industries and services (and their suppliers) in which theseunds are spent.
igures 5.5 (demand side policies) and 5.6 (supply side policies) provide additional detailsegarding the costs effectiveness of the policies in 2010 and 2020. These figure indicate thellocation of costs and benefits between equipment investments and fuel savings and betweenemand and supply sectors. The policies in the demand sector, where large savings exist fornergy efficiency measures, are very cost-effective, and yield substantial net benefits. Fuel and&M savings are over 3 times the investment costs the in 2010 and about two and half times in
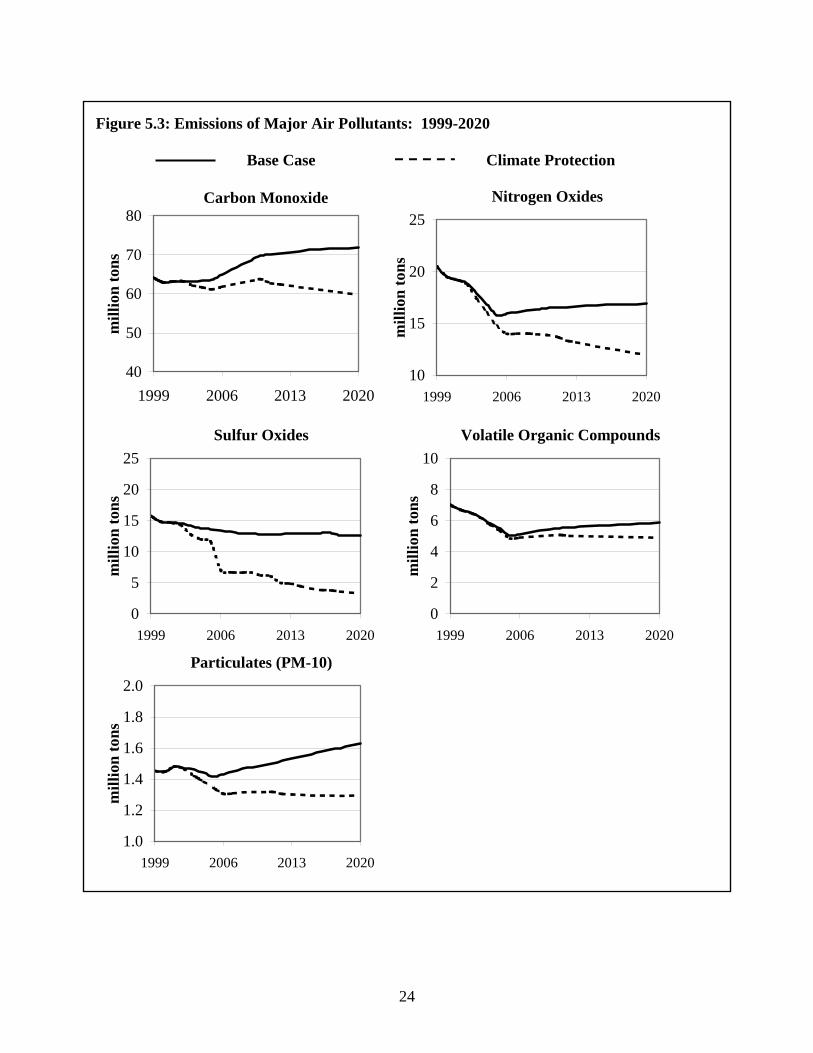
24
Figure 5.3: Emissions of Major Air Pollutants: 1999-2020
Base Case Climate Protection
Carbon Monoxide
40
50
60
70
80
1999 2006 2013 2020
mill
ion
tons
Nitrogen Oxides
10
15
20
25
1999 2006 2013 2020m
illio
n to
ns
Sulfur Oxides
0
5
10
15
20
25
1999 2006 2013 2020
mill
ion
tons
Volatile Organic Compounds
0
2
4
6
8
10
1999 2006 2013 2020
mill
ion
tons
Particulates (PM-10)
1.0
1.2
1.4
1.6
1.8
2.0
1999 2006 2013 2020
mill
ion
tons
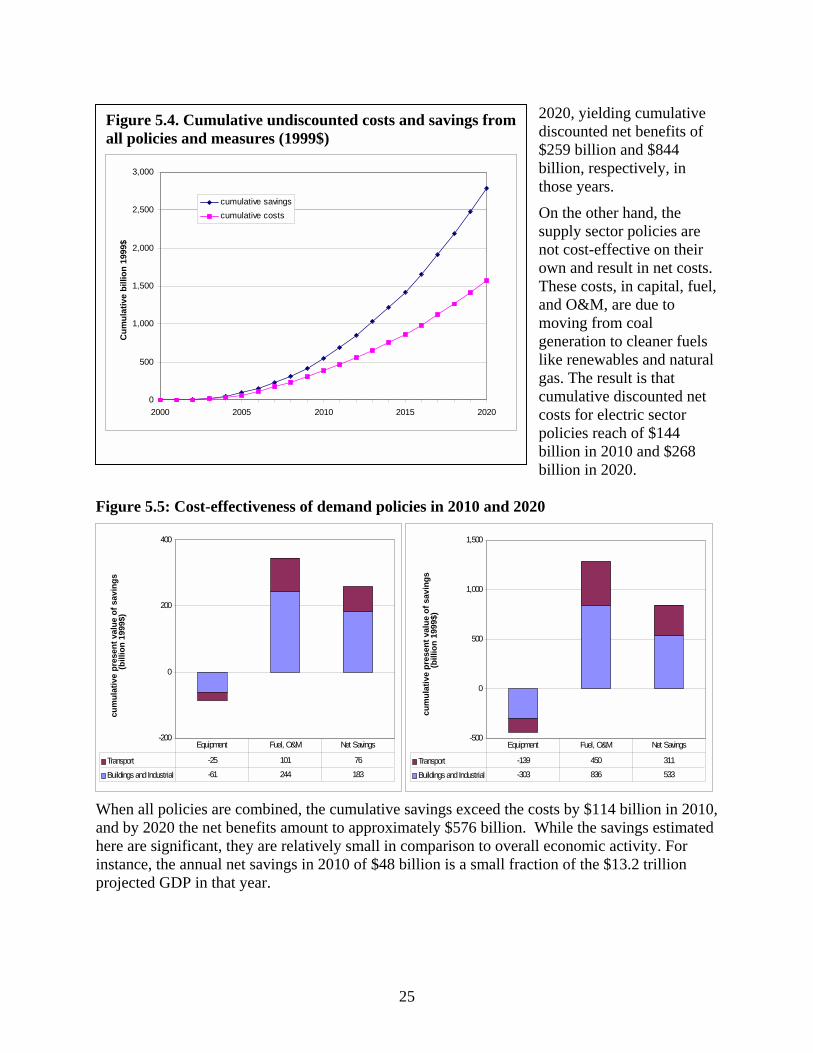
25
2020, yielding cumulativediscounted net benefits of$259 billion and $844billion, respectively, inthose years.
On the other hand, thesupply sector policies arenot cost-effective on theirown and result in net costs.These costs, in capital, fuel,and O&M, are due tomoving from coalgeneration to cleaner fuelslike renewables and naturalgas. The result is thatcumulative discounted netcosts for electric sectorpolicies reach of $144billion in 2010 and $268billion in 2020.
Figure 5.5: Cost-effectiveness of demand policies in 2010 and 2020
-200
0
200
400
cum
ulat
ive
pres
ent v
alue
of s
avin
gs
(bill
ion
1999
$)
Transport -25 101 76
Buildings and Industrial -61 244 183
Equipment Fuel, O&M Net Savings
-500
0
500
1,000
1,500
cum
ulat
ive
pres
ent v
alue
of s
avin
gs
(bill
ion
1999
$)
Transport -139 450 311
Buildings and Industrial -303 836 533
Equipment Fuel, O&M Net Savings
When all policies are combined, the cumulative savings exceed the costs by $114 billion in 2010,and by 2020 the net benefits amount to approximately $576 billion. While the savings estimatedhere are significant, they are relatively small in comparison to overall economic activity. Forinstance, the annual net savings in 2010 of $48 billion is a small fraction of the $13.2 trillionprojected GDP in that year.
Figure 5.4. Cumulative undiscounted costs and savings fromall policies and measures (1999$)
0
500
1,000
1,500
2,000
2,500
3,000
2000 2005 2010 2015 2020
Cum
ulat
ive
billi
on 1
999$
cumulative savingscumulative costs
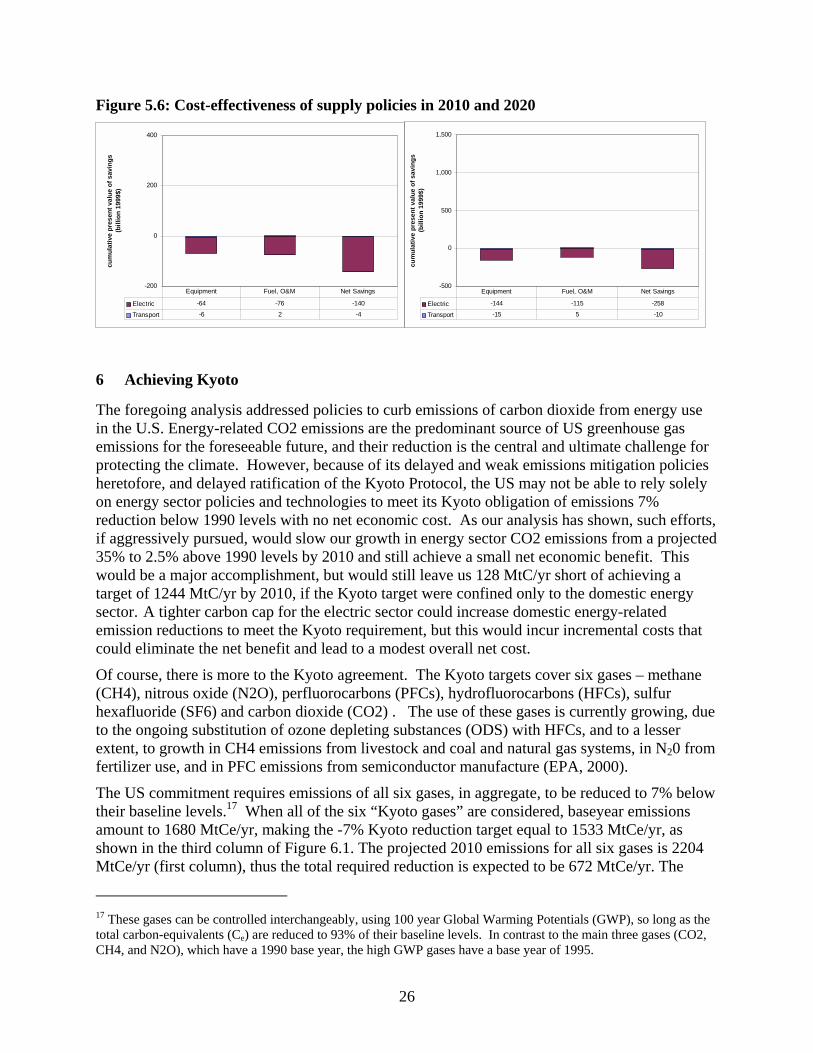
26
Figure 5.6: Cost-effectiveness of supply policies in 2010 and 2020
-200
0
200
400
cum
ulat
ive
pres
ent v
alue
of s
avin
gs
(bill
ion
1999
$)
Electric -64 -76 -140
Transport -6 2 -4
Equipment Fuel, O&M Net Savings-500
0
500
1,000
1,500
cum
ulat
ive
pres
ent v
alue
of s
avin
gs
(bill
ion
1999
$)
Electric -144 -115 -258
Transport -15 5 -10
Equipment Fuel, O&M Net Savings
6 Achieving Kyoto
The foregoing analysis addressed policies to curb emissions of carbon dioxide from energy usein the U.S. Energy-related CO2 emissions are the predominant source of US greenhouse gasemissions for the foreseeable future, and their reduction is the central and ultimate challenge forprotecting the climate. However, because of its delayed and weak emissions mitigation policiesheretofore, and delayed ratification of the Kyoto Protocol, the US may not be able to rely solelyon energy sector policies and technologies to meet its Kyoto obligation of emissions 7%reduction below 1990 levels with no net economic cost. As our analysis has shown, such efforts,if aggressively pursued, would slow our growth in energy sector CO2 emissions from a projected35% to 2.5% above 1990 levels by 2010 and still achieve a small net economic benefit. Thiswould be a major accomplishment, but would still leave us 128 MtC/yr short of achieving atarget of 1244 MtC/yr by 2010, if the Kyoto target were confined only to the domestic energysector. A tighter carbon cap for the electric sector could increase domestic energy-relatedemission reductions to meet the Kyoto requirement, but this would incur incremental costs thatcould eliminate the net benefit and lead to a modest overall net cost.
Of course, there is more to the Kyoto agreement. The Kyoto targets cover six gases – methane(CH4), nitrous oxide (N2O), perfluorocarbons (PFCs), hydrofluorocarbons (HFCs), sulfurhexafluoride (SF6) and carbon dioxide (CO2) . The use of these gases is currently growing, dueto the ongoing substitution of ozone depleting substances (ODS) with HFCs, and to a lesserextent, to growth in CH4 emissions from livestock and coal and natural gas systems, in N20 fromfertilizer use, and in PFC emissions from semiconductor manufacture (EPA, 2000).
The US commitment requires emissions of all six gases, in aggregate, to be reduced to 7% belowtheir baseline levels.17 When all of the six “Kyoto gases” are considered, baseyear emissionsamount to 1680 MtCe/yr, making the -7% Kyoto reduction target equal to 1533 MtCe/yr, asshown in the third column of Figure 6.1. The projected 2010 emissions for all six gases is 2204MtCe/yr (first column), thus the total required reduction is expected to be 672 MtCe/yr. The
17 These gases can be controlled interchangeably, using 100 year Global Warming Potentials (GWP), so long as thetotal carbon-equivalents (Ce) are reduced to 93% of their baseline levels. In contrast to the main three gases (CO2,CH4, and N2O), which have a 1990 base year, the high GWP gases have a base year of 1995.
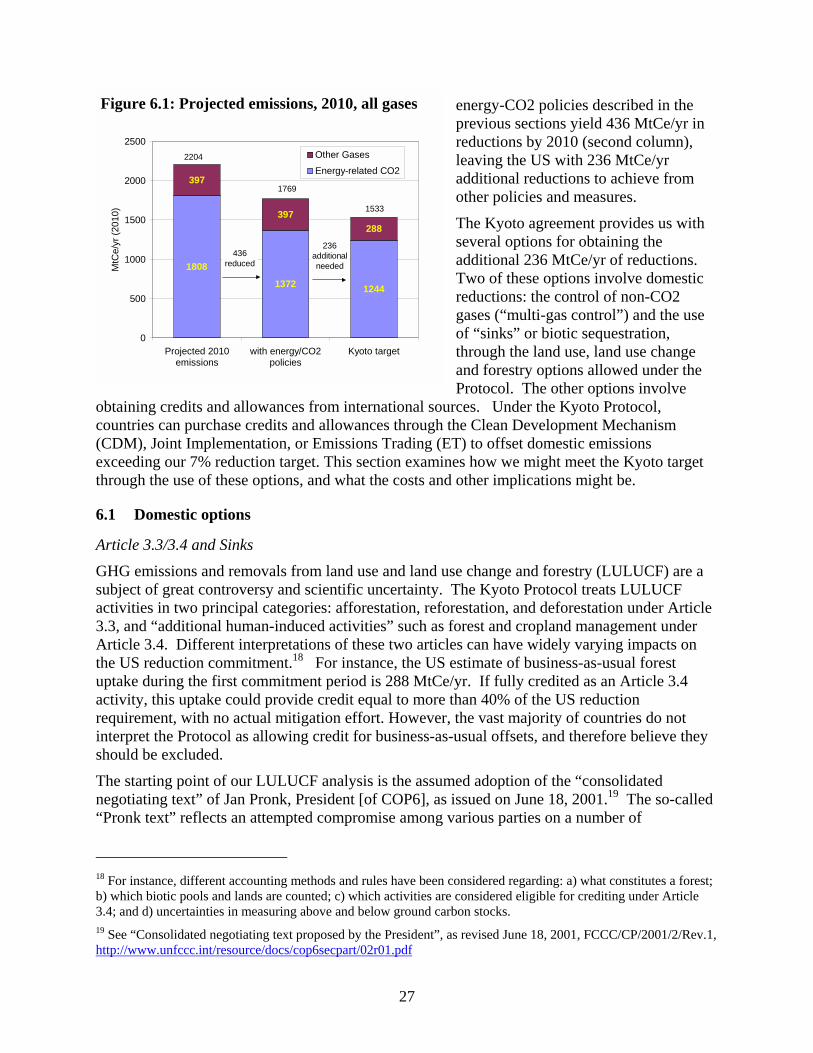
nergy-CO2 policies described in therevious sections yield 436 MtCe/yr inductions by 2010 (second column),aving the US with 236 MtCe/yr
dditional reductions to achieve fromther policies and measures.
he Kyoto agreement provides us withveral options for obtaining the
dditional 236 MtCe/yr of reductions.wo of these options involve domesticductions: the control of non-CO2
ases (“multi-gas control”) and the usef “sinks” or biotic sequestration,rough the land use, land use change
nd forestry options allowed under therotocol. The other options involve
c
is
Figure 6.1: Projected emissions, 2010, all gases
1808
1372 1244
397
397288
0
500
1000
1500
2000
2500
Projected 2010emissions
with energy/CO2policies
Kyoto target
MtC
e/yr
(201
0)
Other GasesEnergy-related CO2
436 reduced
2204
1769
1533
236 additional needed
epreleao
TseaTregothaP
27
obtaining credits and allowances from international sources. Under the Kyoto Protocol,ountries can purchase credits and allowances through the Clean Development Mechanism
(CDM), Joint Implementation, or Emissions Trading (ET) to offset domestic emissionsexceeding our 7% reduction target. This section examines how we might meet the Kyoto targetthrough the use of these options, and what the costs and other implications might be.
6.1 Domestic options
Article 3.3/3.4 and Sinks
GHG emissions and removals from land use and land use change and forestry (LULUCF) are asubject of great controversy and scientific uncertainty. The Kyoto Protocol treats LULUCFactivities in two principal categories: afforestation, reforestation, and deforestation under Article3.3, and “additional human-induced activities” such as forest and cropland management underArticle 3.4. Different interpretations of these two articles can have widely varying impacts onthe US reduction commitment.18 For instance, the US estimate of business-as-usual forestuptake during the first commitment period is 288 MtCe/yr. If fully credited as an Article 3.4activity, this uptake could provide credit equal to more than 40% of the US reductionrequirement, with no actual mitigation effort. However, the vast majority of countries do notnterpret the Protocol as allowing credit for business-as-usual offsets, and therefore believe theyhould be excluded.
The starting point of our LULUCF analysis is the assumed adoption of the “consolidatednegotiating text” of Jan Pronk, President [of COP6], as issued on June 18, 2001.19 The so-called“Pronk text” reflects an attempted compromise among various parties on a number of
18 For instance, different accounting methods and rules have been considered regarding: a) what constitutes a forest;b) which biotic pools and lands are counted; c) which activities are considered eligible for crediting under Article3.4; and d) uncertainties in measuring above and below ground carbon stocks.19 See “Consolidated negotiating text proposed by the President”, as revised June 18, 2001, FCCC/CP/2001/2/Rev.1,http://www.unfccc.int/resource/docs/cop6secpart/02r01.pdf
28
contentious issues. The most relevant here is the proposal for Articles 3.3 and 3.4.20 In short,the Pronk text would cap total US crediting from Article 3.4 activities and afforestation andreforestation projects in the CDM and JI at roughly 58 MtCe/yr.21 Domestic forest managementactivities would be subject to an 85% discount. Thus, if one assumes the US estimate above, thePronk rules would result in 42 MtCe/yr of essentially zero-cost credit for forest managementactivities that are expected to occur anyway.22 In addition, agricultural management (e.g. no-tillagriculture, grazing land management, revegetation) would be allowed under a net-netaccounting approach that would allow the US to count another expected 10 MtCe/yr of business-as-usual, i.e. zero-cost, credit towards the cap. In sum, the Pronk proposal translates to 52MtCe/yr of “free” carbon removals, and another 6 MtCe/yr that could be accrued through newdomestic forest or agricultural management activities.23 Based on a recent summary of LULUCFcost estimates, we assume that this relatively small amount of offsets could be purchased for$10/tCe.24 A total of 58 MtCe/yr of LULUCF credit would therefore be available to help meetthe reduction requirement of 236 MtCe/yr remaining after having adopted the energy-relatedCO2 policies described above.
20 Our assumption of Pronk conditions is a matter of “what if” analysis, rather than a tacit approval. The Pronk textmay be insufficient in a number of ways, but the analysis and critique of the Pronk text is not the focus of this report.21 The Pronk text would prohibit first commitment period crediting of CDM projects that avoid deforestation. It also
22 This figure is drawn from the Annex Table 1 of the April 9 draft of the Pronk text, which adopts Pronk adopts theaccounting approach for Article 3.3. activities suggested by the IPCC Special Report of LULUCF. This approachyields an Article 3.3 debit of 7 MtCe/yr from net afforestation, reforestation, and deforestation activity, which underthe Pronk approach could be offset fully by undiscounted forest management activities. Thus the 42 MtCe/yrestimate is based on 85% x (288 – 7) MtCe/yr.23 The Pronk proposal also allows this cap to be filled through afforestation and deforestation activities in the CDM.24 Missfeldt and Haites (2001) use a central estimate of 50 MtCe/year at $7.50/tCe for CDM afforestation andreforestation projects. They also assume the availability of 150 MtCe/year at $15/tCe for Article 3.4 sinks in AnnexB countries. Note however that the Pronk 85% discount on forest management projects would, in principle, increasetheir cost accordingly (by 1/.15 or 6.7 times). However, given the relatively small quantity (6 MtCe) that could bepurchased, lower cost opportunities in cropland management or the CDM should more than suffice.
29
Multi-gas control
Multi-gas control is a fundamental aspect of the Protocol, and its potential for lowering theoverall cost of achieving Kyoto targets has been the subject of several prominent studies (Reillyet al, 1999 and 2000). Table 6.1 shows baseline and projected emission levels for the non-CO2gases.25
Table 6.1: Baseline and Projected Emissions for the non-CO2 Kyoto Gases (MtCe/yr)
GasBase Year(1990/95)
7% BelowBase Year
Projected2010
ReductionsRequired(a) Sources
Methane 170 158 186 28 (EPA 1999)
Nitrous Oxide 111 103 121 18 (Reilly et al 1999b; EPA 2001a)
High GWP Gases(HFC, PFC, SF6) 29 27 90 63 (EPA 2000)
Total 310 288 397 109 (a) These are the reductions that would be needed if each gas were independently required to be 7% below its baseyear level.
Methane emissions are expected to grow by only 10% from 1990 to 2010, largely because ofincreased natural gas leakage and venting (due to increased consumption), enteric fermentationand anaerobic decomposition of manure (due to increased livestock and dairy production).Methane from landfills, which accounted for 37% of total methane emissions in 1990, areexpected to decline slightly as a consequence of the Landfill Rule of the Clean Air Act (EPA,1999), which requires all large landfills to collect and burn landfill gases.
Several measures could reduce methane emissions well below projected levels. USEPAestimates that capturing the methane from landfills not covered by the Landfill Rule, and using itto generate electricity, is economically attractive at enough sites to reduce projected landfillemissions by 21% (USEPA, 1999). At a cost of $30/tCe, the number of economically attractivesites increases sufficiently that 41% of landfill emissions can be reduced. Similarly, USEPA hasconstructed methane reduction cost curves for reducing leaks and venting in natural gas systems,recovering methane from underground mines, using anaerobic digesters to capture methane frommanure. and reducing enteric fermentation by changing how livestock are fed and managed.
We have used a similar USEPA study to estimate the emissions reductions available for the highGWP gases (USEPA, 2000). Table 1 shows that the high-GWP gases, while only a small fractionof baseline emissions (first column), are expected to rise so rapidly that they will account formajority of net growth in non-CO2 emissions relative to the 7% reduction target (last column). Inmany applications, other gases can be substituted for HFCs and PFCs, new industrial process canimplemented, leaks can be reduced, and more efficient gas-using equipment can be installed.For instance, minor repairs of air conditioning and refrigeration equipment could save anestimated 6.5 MtCe/yr in HFC emissions by 2010 at cost of about $2/tCe. New cleaningprocesses for semiconductor manufacture could reduce PFC emissions by 8.6 MtCe/yr by 2010
25 USEPA (1999, 2000) expects voluntary Climate Change Action Plan (CCAP) activities to reduce 2010 methaneand high GWP gas emissions by about 10% and 15%, respectively, reductions that are not included in their 2010projections shown in Table 1. Instead these reductions are embodied in both their and our cost curves.
30
at an estimated cost of about $17/tCe. In all, USEPA identified 37 measures for reducing highGWP gases, a list which is likely to be far from exhaustive given the limited experience with anddata on abatement methods for these gases.
The major source of nitrous oxide in the US is the application of nitrogen fertilizers, whichresults in about 70% of current emissions. Given the tendency of farmers to apply excessfertilizer to ensure good yields, effective strategies for N2O abatement from cropping practiceshas thus far been elusive. Thus, aside from measures to reduce N2O from adipic and nitric acidproduction (amounting to less than one MtCe/yr), and from mobile sources as a result oftransportation policies (see below), we have not included a full analysis of N2O reductionopportunities (USEPA, 2001).
Relying largely on recent USEPA abatement studies (1999, 2000, 2001b), we developed the costcurve for reducing non-CO2 gases depicted in Figure 2 below.26 In addition to what is coveredin the USEPA studies, we assumed that:
• Only 75% of the 2010 technical potential found in the USEPA studies would actually beachieved, and that policies and programs needed to promote these measures would add atransaction cost of $5/tCe.
• The savings in 2010 fossil fuel use resulting from the policies and measures implementedin the energy sector will yield corresponding benefits for several categories of non-CO2emissions. In particular, we assumed that a) reduced oil use in the transport sector (down14%) will lead to a proportional decrease in N2O emissions from mobile sources27; b)reduced natural gas demand (down 13%) will result in proportionately fewer methaneemissions from leaks and venting; and c) reduced coal production (down 49%) will leadto decreased underground mining and its associated emissions. 28
Figure 6.2 shows that domestic options, taken together, are insufficient to reaching the Kyototarget. The line on the left is the “supply curve” of non-CO2 abatement options, and the line onthe right is the reduction requirement after both energy-related and Article 3.3/3.4 sinks areaccounted for. Under current conditions (only 9 years left until 2010), the supply of remainingdomestic options appears insufficient to satisfy demand. This gap ranges from 107 MtCe/yr at$10/tCe to 60 MtCe/yr at $100/tCe as shown. Therefore, to meet our Kyoto obligations, we arenow in a situation of looking to the international market to fill this gap.
6.2 International options
The Kyoto Protocol creates are two principal types of greenhouse gas offsets in the internationalmarket: the purchase of surplus allowances from countries that are below their Kyoto targets andthe creation of carbon credits through project-based mechanisms, CDM and JI.
26 The result is a cost curve that is similar and more up-to-date than that used in widely cited multiple gas studies(Reilly et al, 1999a; Reilly et al, 1999b; EERE, 2000). 27 A similar assumption is used by European Commission (1998). Approximately fifteen percent of N2O emissionsare a byproduct of fuel combustion, largely by vehicles equipped with catalytic converters (USEPA, 2001a). 28 We assume that coal production is a proportional to coal use (i.e. we ignore net imports/exports). USEPA expectsthat the marginal methane emissions rate will increase with production as an increasing fraction is expected to comefrom deeper underground mines (USEPA, 1999).
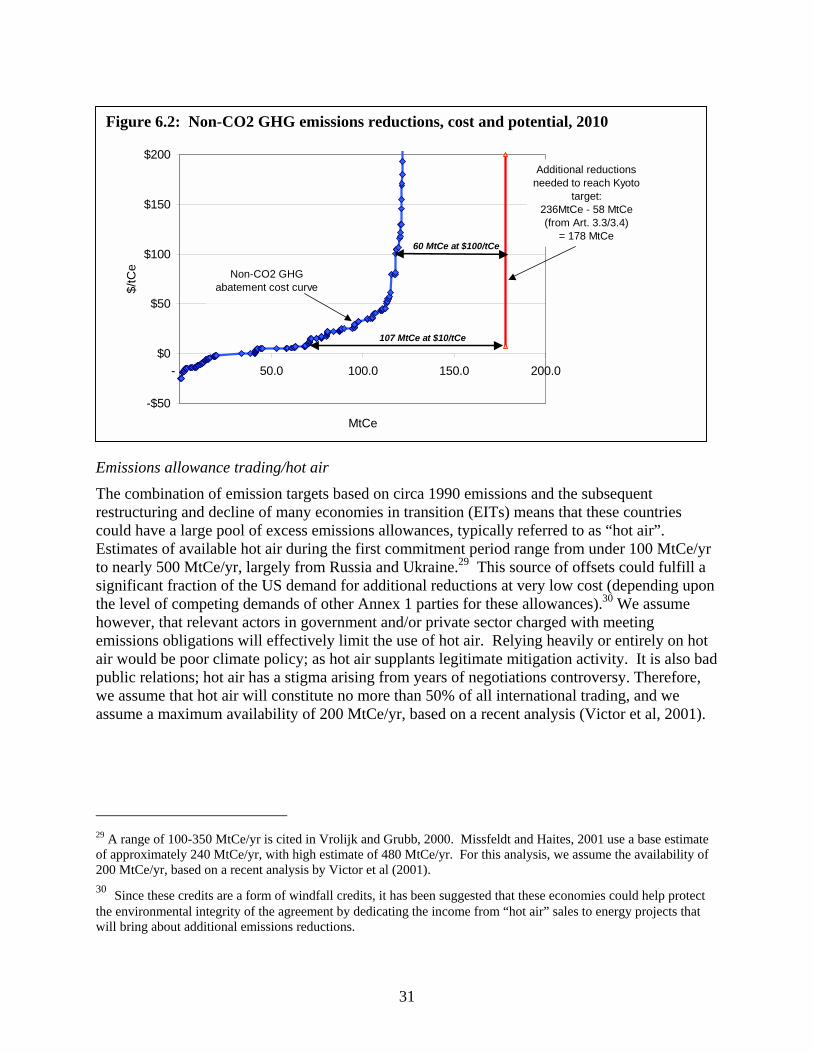
E
TrcEtstheapwa
2
o23
tw
Figure 6.2: Non-CO2 GHG emissions reductions, cost and potential, 2010
31
missions allowance trading/hot air
he combination of emission targets based on circa 1990 emissions and the subsequentestructuring and decline of many economies in transition (EITs) means that these countriesould have a large pool of excess emissions allowances, typically referred to as “hot air”.stimates of available hot air during the first commitment period range from under 100 MtCe/yr
o nearly 500 MtCe/yr, largely from Russia and Ukraine.29 This source of offsets could fulfill aignificant fraction of the US demand for additional reductions at very low cost (depending uponhe level of competing demands of other Annex 1 parties for these allowances).30 We assumeowever, that relevant actors in government and/or private sector charged with meetingmissions obligations will effectively limit the use of hot air. Relying heavily or entirely on hotir would be poor climate policy; as hot air supplants legitimate mitigation activity. It is also badublic relations; hot air has a stigma arising from years of negotiations controversy. Therefore,e assume that hot air will constitute no more than 50% of all international trading, and we
ssume a maximum availability of 200 MtCe/yr, based on a recent analysis (Victor et al, 2001).
9 A range of 100-350 MtCe/yr is cited in Vrolijk and Grubb, 2000. Missfeldt and Haites, 2001 use a base estimatef approximately 240 MtCe/yr, with high estimate of 480 MtCe/yr. For this analysis, we assume the availability of00 MtCe/yr, based on a recent analysis by Victor et al (2001). 0 Since these credits are a form of windfall credits, it has been suggested that these economies could help protecthe environmental integrity of the agreement by dedicating the income from “hot air” sales to energy projects thatill bring about additional emissions reductions.
-$50
$0
$50
$100
$150
$200
- 50.0 100.0 150.0 200.0
MtCe
$/tC
e
Additional reductions needed to reach Kyoto
target:236MtCe - 58 MtCe (from Art. 3.3/3.4)
= 178 MtCe
Non-CO2 GHG abatement cost curve
107 MtCe at $10/tCe
60 MtCe at $100/tCe
32
CDM and JI
CDM and JI projects, can be an important part of a comprehensive climate policy, providing theytruly contribute to sustainable development in the host countries and create genuine, additionalGHG benefits. It is reasonable to expect that the US government and other stakeholders willwant to develop the CDM and JI market in order to involve developing countries, engage intechnology transfer, develop competitive advantages, and prepare for future commitmentperiods.
With the rules yet to be established on critical issues like additionality and baselines for CDM31,and with a limited understanding of CDM/JI markets and transaction costs at high volumes ofactivity, cost and volume estimates for CDM and JI remain highly speculative. As with all GHGmitigation analysis exercises, both bottom-up and top-down methods can be used to developsuch estimates. We have examined the data and literature for both approaches in coming up witha rough, aggregate cost curve for CDM and JI.
A bottom-up CDM/JI cost assessments can examine emerging project-based GHG tradingmarkets – private broker transactions, the Prototype Carbon Fund (PCF), the Dutch ERUPTprogram, GEF activity, and so on – to get a sense of current “real-world” prices and transactioncosts. However, the size of this market remains very small in comparison with the total flowsthat are likely once CDM and JI are underway.32 The type of activities being undertaken today,such as the first PCF project, a landfill gas capture effort in Latvia, could well represent “low-hanging fruit” that would be unable to supply the several hundreds MtCe/yr of CDM and JIactivity that are expected under some Kyoto compliance scenarios (Missfeldt and Haites, 2001;Grubb and Vrolijk, 2000).
To get a better sense of the costs of projects available at higher volumes, these “early project”estimates can be combined with non-Annex B “country studies” – the many national GHGabatement studies performed with support from UNEP, UNDP, US Country Studies, and otherbilateral and national programs. A study by the Dutch Energy Foundation (ECN, et al ,1999)provides a good example of such an analysis. Extrapolating from GEF projects along with 25country studies, this study found that 440 MtCe/yr of non-Annex 1 reductions could be availableat less than $22/tCe.
However, the uncertainty related to these bottom-up studies is fundamentally quite high.National studies typically exclude a significant number of abatement options due to sheer lack ofdata, resources, or necessity. At the same time, abatement costing studies may understatetransaction and barrier removal costs, especially those specific to CDM and JI projects. Forinstance, transaction costs for project preparation, baselines, certification, and monitoring andevaluation could also change from current levels, once the CDM and JI markets take off and
31 CDM projects are required to be “additional” emissions reductions but rules have not been agreed to which woulddetermine what is additional. In addition, credits will be given based on reductions in comparison to a baseline. Amethodology for establishing baselines is also the subject of ongoing negotiations.32 For instance, anecdotal evidence suggests that the current international GHG emission credit market is at about$25 million in transactions per year. In addition the PCF and ERUPT have committed another $225 million over thenext few years. This figure compares with the $10-20 billion/year market (about 400-500 MtCe/year at $20-40/tCe)that some analysts project under CDM alone (Missfeldt and Haites, 2001).
33
clear rules are established. Finally, the ultimate approach adopted for deciding on projectadditionality and baselines could have a major impact on the size and shape of the market.
Similarly, the possibility of limited crediting lifetimes, or discounting of carbon reductions infuture projects years, as proposed by some, could increase the effective cost per tCe. In a recentanalysis, Bernow et al. (2000) illustrated how different approaches to standardizing baselinescould lead to differences in additional power sector activity (tCe) of a factor of 4. These typesof considerations are rarely included in CDM/JI analyses, either bottom-up or top-down.
Many climate policy assessments rely on CDM and JI cost curves developed by a handful of“top-down” modelers. Ellerman and Decaux (1998) applied the MIT-EPPA computable generalequilibrium model to develop parameterized cost curves for five non-Annex 1 regions, whichhave since been widely used (Reilly et al, 1999; Haites, 2000; Krause et al, 2001; Missfeldt andHaites, 2001; Grutter, 2001). Applications of the ABARE-GTEM model have been used in asimilar manner (Vrolijk and Grubb, 2000; Grutter, 2001; EMF, 1999). While compared withbottom-up studies, the EPPA and GTEM model runs provide more comprehensive assessmentsof reduction potential and cost from an economy-wide perspective, they do a poorer job ofreflecting the dynamics of project-based investments.
It turns out that the GTEM, EPPA, and bottom-up ECN studies, do yield rather similar results.At $20/tCe, the total CDM potential under the GTEM run is 470 MtCe/yr, while under EPPA itis 480 MtCe/yr, and as noted above, and for ECN et al (1999), the figure is closer to 440MtCe/yr.33 Given the small differences, we adopt the GTEM results, since they provide a fullerCDM curve, include multiple gases, and provide a cost curve for JI investments as well.
6.3 Combining the options
There are two ways to combine the available options to meet our Kyoto target. We can prioritizewhich options to rely on more heavily, based on their strategic advantages and co-benefits, as wehave done for energy/CO2 policies. Or we can simply seek lowest-cost solution for the near-term. A long-term climate policy perspective argues for the former approach. For example,rules and criteria for JI, and especially CDM, should be designed so that additionality,sustainability, and technology transfer are maximized. Ideally, our cost curves for CDM and JIwould reflect only investments that are consistent with those criteria. However, our currentability to reflect such criteria in quantitative estimates of CDM and JI potential is limited.34
It is possible to model priority investment in the domestic reductions of non-CO2 gases byimplementing some measures that are higher cost than the global market clearing carbon price.Just as energy/CO2 measures like a Renewable Portfolio Standard can be justified by the
33 The EPPA and GTEM figures are drawn from the CERT model described in Grutter, 2001. The EPPA scenarioused here includes only CO2, while the GTEM scenario includes all gases. All of these studies exclude sinks, whichis largely consistent with the implications of the Pronk proposal.34 We did briefly examine the potential contribution of a CDM fast track for renewables and efficiency, asembodied in the Pronk text. Applying the power sector CDM model developed by Bernow et al (2001), we foundthat a carbon price of $20/tCe would induce only 3 MtCe/yr of new renewable energy project activity by 2010. At aprice of $100/tCe, this amount rises to 18 MtCe/yr. Given that a large technical potential for energy efficiencyprojects exists at low or negative cost per tCe, fast track efficiency projects (under 5 MW useful energy equivalentsaccording to Pronk text) could significantly increase the amount available at lower costs.
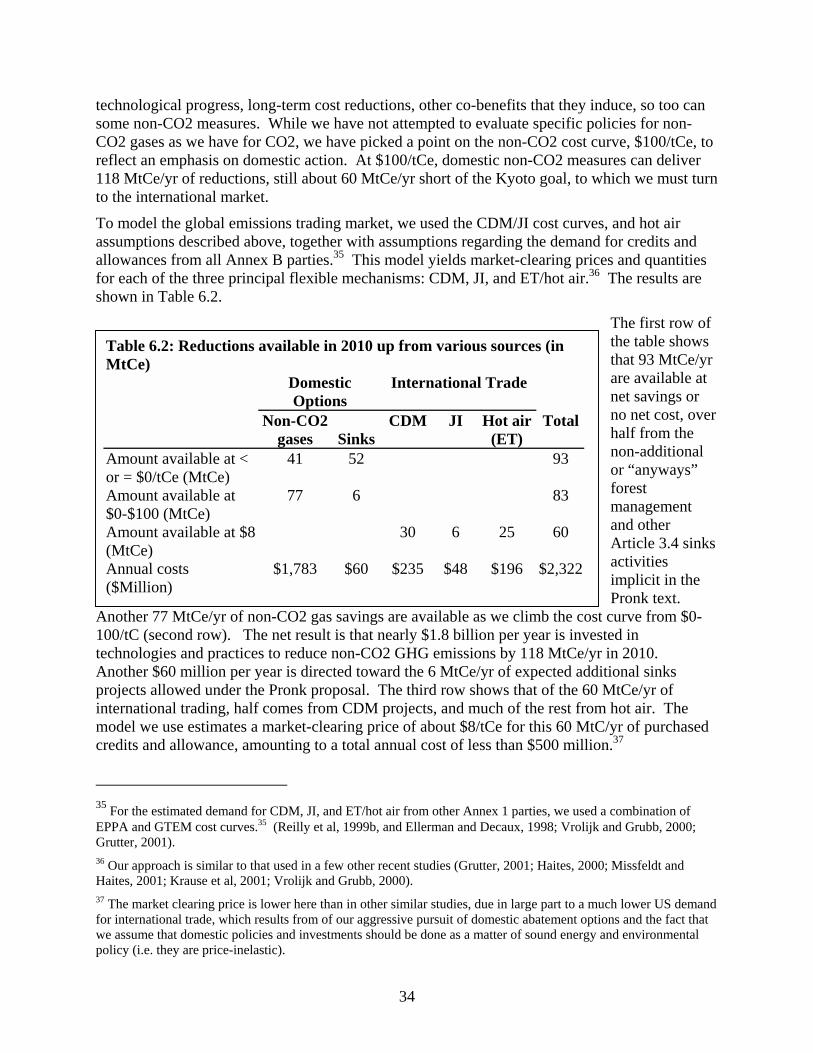
technological progress, long-term cost reductions, other co-benefits that they induce, so too cansome non-CO2 measures. While we have not attempted to evaluate specific policies for non-CO2 gases as we have for CO2, we have picked a point on the non-CO2 cost curve, $100/tCe, toreflect an emphasis on domestic action. At $100/tCe, domestic non-CO2 measures can deliver118 MtCe/yr of reductions, still about 60 MtCe/yr short of the Kyoto goal, to which we must turnto the international market.
To model the global emissions trading market, we used the CDM/JI cost curves, and hot airassumptions described above, together with assumptions regarding the demand for credits andallowances from all Annex B parties.35 This model yields market-clearing prices and quantitiesfor each of the three principal flexible mechanisms: CDM, JI, and ET/hot air.36 The results areshown in Table 6.2.
The first row ofthe table showsthat 93 MtCe/yrare available atnet savings orno net cost, overhalf from thenon-additionalor “anyways”forestmanagementand otherArticle 3.4 sinksactivities
A1tApimc
3
EG3
H3
fwp
Table 6.2: Reductions available in 2010 up from various sources (inMtCe)
DomesticOptions
International Trade
Non-CO2gases Sinks
CDM JI Hot air(ET)
Total
Amount available at <or = $0/tCe (MtCe)
41 52 93
Amount available at$0-$100 (MtCe)
77 6 83
Amount available at $8(MtCe)
30 6 25 60
Annual costs $1,783 $60 $235 $48 $196 $2,322
34
implicit in thePronk text.
nother 77 MtCe/yr of non-CO2 gas savings are available as we climb the cost curve from $0-00/tC (second row). The net result is that nearly $1.8 billion per year is invested inechnologies and practices to reduce non-CO2 GHG emissions by 118 MtCe/yr in 2010.nother $60 million per year is directed toward the 6 MtCe/yr of expected additional sinksrojects allowed under the Pronk proposal. The third row shows that of the 60 MtCe/yr ofnternational trading, half comes from CDM projects, and much of the rest from hot air. Theodel we use estimates a market-clearing price of about $8/tCe for this 60 MtC/yr of purchased
redits and allowance, amounting to a total annual cost of less than $500 million.37
5 For the estimated demand for CDM, JI, and ET/hot air from other Annex 1 parties, we used a combination ofPPA and GTEM cost curves.35 (Reilly et al, 1999b, and Ellerman and Decaux, 1998; Vrolijk and Grubb, 2000;rutter, 2001).
6 Our approach is similar to that used in a few other recent studies (Grutter, 2001; Haites, 2000; Missfeldt andaites, 2001; Krause et al, 2001; Vrolijk and Grubb, 2000).
7 The market clearing price is lower here than in other similar studies, due in large part to a much lower US demandor international trade, which results from of our aggressive pursuit of domestic abatement options and the fact thate assume that domestic policies and investments should be done as a matter of sound energy and environmentalolicy (i.e. they are price-inelastic).
($Million)
35
In summary, of the 672 MtCe/yr in total reductions needed to reach Kyoto by 2010, nearly 65%comes from energy sector CO2 reduction policies, 18% from domestic non-CO2 gas abatement,9% from domestic sinks, and 9% from the international market. The net economic benefitsderiving from the energy-related carbon reductions reach nearly $50 billion/yr in 2010. The totalannual cost for the 35% of 2010 reductions coming those last three options – non-CO2 control,sinks, and international trading – is estimated at approximately $2.3 billion, making the totalpackage a positive economic portfolio by a large margin. Had we taken the other approach notedat the beginning of the section – aiming for the lowest near-term compliance cost – we wouldrely more heavily on international trading. We modeled this scenario, and found that it wouldnearly double the amount of international trading, and lower the overall annual cost to $0.9billion, and reduce the amount of non-CO2 control by over 40%. This additional benefit is minorin comparison to the economic and environmental benefits of the entire policy portfolio.
7 Conclusions
This study shows that the United States can achieve its carbon reduction target under the KyotoProtocol – 7 percent below 1990 levels for the first budget period of the Protocol. Relying onnational policies and measures for greenhouse gas reductions, and accessing the flexibilitymechanisms of the Kyoto Protocol for a small portion of its total reductions, the US would enjoynet economic savings as a result of this Climate Protection package. In order to achieve thesereductions, policies should be implemented as soon as possible to accelerate the shift away fromcarbon-intensive fossil fuels and towards energy efficient equipment and renewable sources ofenergy. Such action would lead to carbon emission reductions of about 24 percent by 2010relative to the Base Case, bringing emissions to about 2.5 percent above 1990 levels.Furthermore, emissions of other pollutants would also be reduced, thus improving local airquality and public health.
Adopting these policies at the national level through legislation will not only help America meetits Kyoto targets but will also lead to economic savings for consumers, as households andbusinesses would enjoy annual energy bill reductions in excess of their investments. These netannual savings would increase over time, reaching nearly $113 per household in 2010 and $375in 2020. The cumulative net savings would be about $114 billion (present value 1999$) through2010 and $576 through 2020.
Greenhouse emissions in the US are now about 15% higher than they were in 1990. Togetherwith the looming proximity of the first budget period, and a realistic start date no earlier than2003 for the implementation of the national policies, reductions in energy-related carbon wouldhave to be augmented by other greenhouse gas reduction options in order to reach the Kyototarget. In total, the Climate Protection case in 2010 includes 436 Mtc/yr energy-related carbonreductions, 58 MtC/yr domestic land-based carbon reductions, 118 MtC/yr reductions indomestic non-carbon greenhouse gases, and 60 MtC/yr in allowances purchased through the“flexibility mechanisms” of the Kyoto Protocol.
While implementing this set of policies and additional non-energy related measures is anambitious undertaking, it represents an important transitional strategy to meet the long-termrequirements of climate protection. It builds the technological and institutional foundation formuch deeper long-term emission reductions needed for climate protection. Such actions wouldstimulate innovation and invention here in the U.S. while positioning the U.S. as a responsibleinternational leader in meeting the global challenge of climate change.
36
8 List of References
BCAP, 1999. Status of State Energy Codes. Washington, D.C.: Building Codes AssistanceProject, Sept./Oct.
Bernow, S., S. Kartha, M. Lazarus and T. Page, 2000. Free-Riders and the Clean DevelopmentMechanism. WWF. Gland, Switzerland.
Brown, Rich, Carrie Webber, and Jon Koomey, 2000. “Status and Future Directions of theENERGY STAR Program,” In Proceedings of the 2000 ACEEE Summer Study on EnergyEfficiency in Buildings, 6.33–43. Washington, D.C.: American Council for an Energy-Efficient Economy.
Clean Air Task Force, 2000. Death, Disease, & Dirty Power: Mortality and Health Damagesdue to Air Pollution from Power Plants, October.
DeCicco, John, Feng An, and Marc Ross, 2001. Technical Options for Improving the FuelEconomy of U.S. Cars and Light Trucks by 2010–2015, Washington, D.C.: AmericanCouncil for an Energy-Efficient Economy.
Dockery, D., Pope, C., Xu, X., Spengler, J., Ware, J., Fay, M., Ferris, B., and Speizer, F., 1993.An Association between Air Pollution and Mortality in Six U.S., Cities, The NewEngland Journal of Medicine 329 (24): 1753-9.
ECN, SEI-B, and AED, 1999. Potential and Cost of Clean Development Mechansim Options inthe Energy Sector. Inventory of options in the non-Annex I Countries to reduce GHGemissions. ECN, The Netherlands.
EERE, 2000. Scenarios for a Clean Energy Future, Prepared by the Interlaboratory WorkingGroup on Energy-Efficient and Clean-Energy Technologies, Washington, D.C.: U.S.Department of Energy, Office of Energy Efficiency and Renewable Energy.
EIA, 2001a. Annual Energy Outlook 2001 with Projections to 2020. US Department of Energy,Washington D.C.
EIA, 2001b. U.S. Carbon Dioxide Emissions from Energy Sources, 2000 Flash Estimate. USDepartment of Energy. http://www.eia.doe.gov/oiaf/1605/flash/sld001.htm
Ellerman, A.D. and A. Decaux, 1998. Analysis of Post-Kyoto Emissions Trading UsingMarginal Abatement Curves, MIT Joint Program on the Science and Policy of GlobalChange Report No. 40, October, Cambridge, MA.
EMF 1999. “The costs of the Kyoto Protocol: A multi-model evaluation.” 16th EnergyModeling Forum, The Energy Journal, Special Issue.
EPA, 2001. “The Power of Partnerships, Climate Protection Partnerships Division,Achievements for 2000—In Brief.” Washington, D.C.: U.S. Environmental ProtectionAgency.
European Commission, 1998. Options to Reduce Nitrous Oxide Emissions (Final Report): Areport produced for DGXI by AEA Technology Environment, November.http://www.europa.eu.int/comm/environment/enveco/climate_change/nitrous_oxide_emissions.pdf
37
Grütter, J. 2001. World Market for GHG Emission Reductions: An analysis of the World Marketfor GHG abatement, factors and trends that influence it based on the CERT model.Prepared for the World Bank’s National AIJ/JI/CDM Strategy Studies Program, March,2001.
Harvey, R. and F. de la Chesnaye, 2000. “The Potential for Cost-Effective Reductions of Non-Carbon Dioxide Greenhouse Gas Emissions in the United States” in J. van Ham, A.Baede, L. Meyer, R. Ybema, Eds., Second International Symposium on Non-CO2Greenhouse Gases (Kluwer Academic Pub., Dordrecht, the Netherlands, 2000).
IPCC 2001. Climate Change 2000, Economic and Social Dimensions of Climate Change,Contribution of Working Group III to the Third Assessment Report of theIntergovernmental Panel on Climate Change, Cambridge/New York.
Krause, F., Baer, P., DeCanio, S. 2001. Cutting Carbon Emissions at a Profit: Opportunities forthe U.S., International Project For Sustainable Energy Paths, El Cerrito, California,April. www.ipsep.org
Mark, Jason, 1999. Greener SUVs: A Blueprint for Cleaner, More Efficient Light Trucks,Cambridge, Mass.: Union of Concerned Scientists.
Missfeldt, F., and E. Haites. forthcoming 2001, The Potential Contribution of Sinks to MeetingKyoto Protocol Commitments
Nadel, Steven and Marty Kushler. 2000. “Public Benefit Funds: A Key Strategy for AdvancingEnergy Efficiency.” The Electricity Journal. Oct., pp. 74-84.
Reilly, J., M. Mayer, and J. Harnisch. 2000. Multiple Gas Control Under the Kyoto Agreement,MIT Joint Program on the Science and Policy of Global Change Report No. 58. March.
Reilly, J. et al, 1999a. Multi-Gas Assessment of the Kyoto Protocol , Nature 401, pp. 549-555(October 7, 1999).
Reilly, J., R.G. Prinn, J. Harnisch, J. Fitzmaurice, H.D. Jacoby, D. Kicklighter, P.H. Stone, A.P.Sokolov, and C. Wang, 1999b. Multi-Gas Assessment of the Kyoto Protocol , Report No.45, MIT Joint Program on the Science and Policy of Global Change, Boston, MA,January 1999. (at http://web.mit.edu/globalchange/www/rpt45.html)
Schwartz, J. and Dockery, D., 1992. Increased Mortality in Philadelphia Associated with DailyAir Pollution Concentrations, American Review of Respiratory Disease 145: 600-604.
USEPA, 1999. U.S. Methane Emissions 1990 – 2020: Inventories, Projections, andOpportunities for Reductions, U.S. Environmental Protection Agency, Office of Air andRadiation, September . http://www.epa.gov/ghginfo.
USEPA, 2000. Estimates of U.S. Emissions of High-Global Warming Potential Gases and theCosts of Reductions, Review Draft, Reid Harvey, U.S. Environmental Protection Agency,Office of Air and Radiation, March. http://www.epa.gov/ghginfo.
USEPA, 2001a. Draft Inventory of U.S. Greenhouse Gas Emissions and Sinks: 1990 – 1999.EPA, Washington, DC, September, 2001.
USEPA, 2001b. Draft U.S. Nitrous Oxide Emissions 1990-2020: Inventories, Projections, andOpportunities for Reductions. EPA, Washington, DC, September, 2001.
38
USEPA, 2001c. Draft Addendum to the U.S. Methane Emissions 1990-2020: Inventories,Projections, and Opportunities for Reductions Report. EPA, Washington, DC, October,2001.
Victor, David G., Nakicenovic, Nebojsa, and Victor, Nadejda, 2001, "The Kyoto ProtocolEmission Allocations: Windfall Surpluses for Russia and Ukraine," Climatic Change 49(3):263-277, May 2001
Vrolijk, C., Grubb, M. 2000. Quantifying Kyoto: How will COP-6 decisions affect the market?Report of a workshop organized by the Royal Institute of International Affairs, UK, inassociation with: Institute for Global Environmental Strategies, Japan; World BankNational Strategies Studies Program on JI and CDM; National Institute of Public Healthand the Environment, Netherlands; Erik Haites, Canada; and Mike Toman, US on 30–31August 2000, Chatham House, London.

39
Appendix 1: Energy and Carbon Summaries
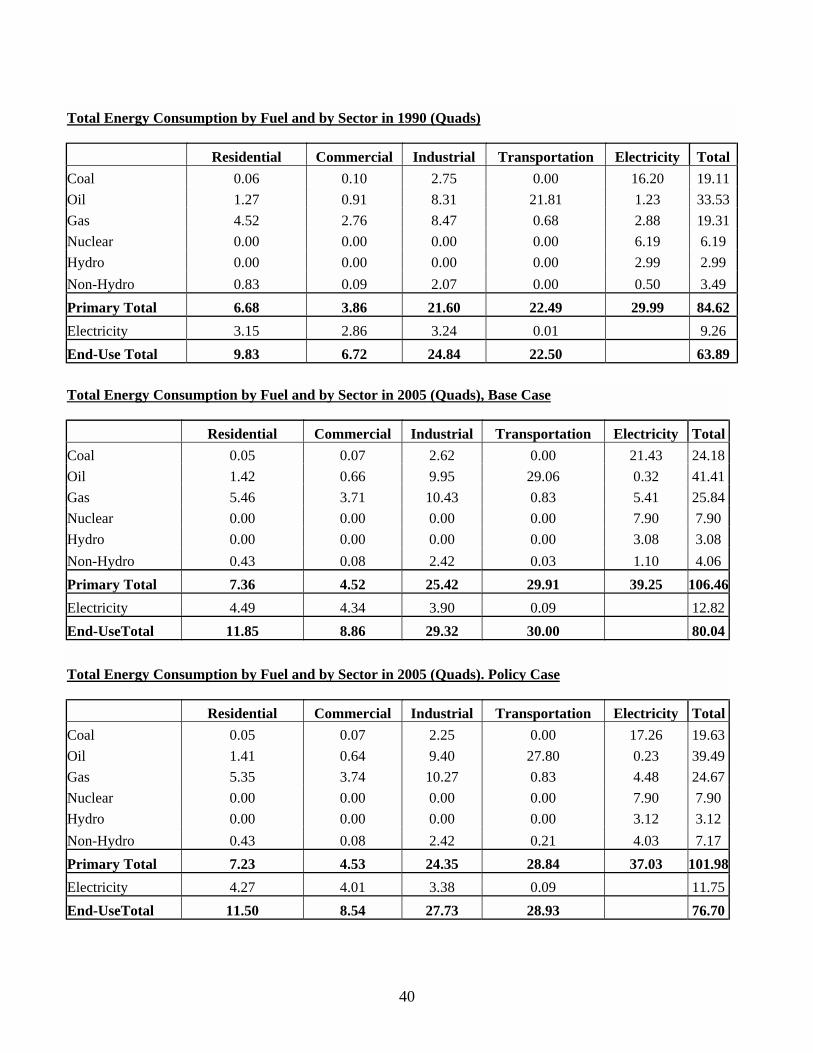
40
Total Energy Consumption by Fuel and by Sector in 1990 (Quads) Residential Commercial Industrial Transportation Electricity TotalCoal 0.06 0.10 2.75 0.00 16.20 19.11Oil 1.27 0.91 8.31 21.81 1.23 33.53Gas 4.52 2.76 8.47 0.68 2.88 19.31Nuclear 0.00 0.00 0.00 0.00 6.19 6.19Hydro 0.00 0.00 0.00 0.00 2.99 2.99Non-Hydro 0.83 0.09 2.07 0.00 0.50 3.49Primary Total 6.68 3.86 21.60 22.49 29.99 84.62Electricity 3.15 2.86 3.24 0.01 9.26End-Use Total 9.83 6.72 24.84 22.50 63.89
Total Energy Consumption by Fuel and by Sector in 2005 (Quads), Base Case Residential Commercial Industrial Transportation Electricity TotalCoal 0.05 0.07 2.62 0.00 21.43 24.18Oil 1.42 0.66 9.95 29.06 0.32 41.41Gas 5.46 3.71 10.43 0.83 5.41 25.84Nuclear 0.00 0.00 0.00 0.00 7.90 7.90Hydro 0.00 0.00 0.00 0.00 3.08 3.08Non-Hydro 0.43 0.08 2.42 0.03 1.10 4.06Primary Total 7.36 4.52 25.42 29.91 39.25 106.46Electricity 4.49 4.34 3.90 0.09 12.82End-UseTotal 11.85 8.86 29.32 30.00 80.04 Total Energy Consumption by Fuel and by Sector in 2005 (Quads). Policy Case Residential Commercial Industrial Transportation Electricity TotalCoal 0.05 0.07 2.25 0.00 17.26 19.63Oil 1.41 0.64 9.40 27.80 0.23 39.49Gas 5.35 3.74 10.27 0.83 4.48 24.67Nuclear 0.00 0.00 0.00 0.00 7.90 7.90Hydro 0.00 0.00 0.00 0.00 3.12 3.12Non-Hydro 0.43 0.08 2.42 0.21 4.03 7.17Primary Total 7.23 4.53 24.35 28.84 37.03 101.98Electricity 4.27 4.01 3.38 0.09 11.75End-UseTotal 11.50 8.54 27.73 28.93 76.70
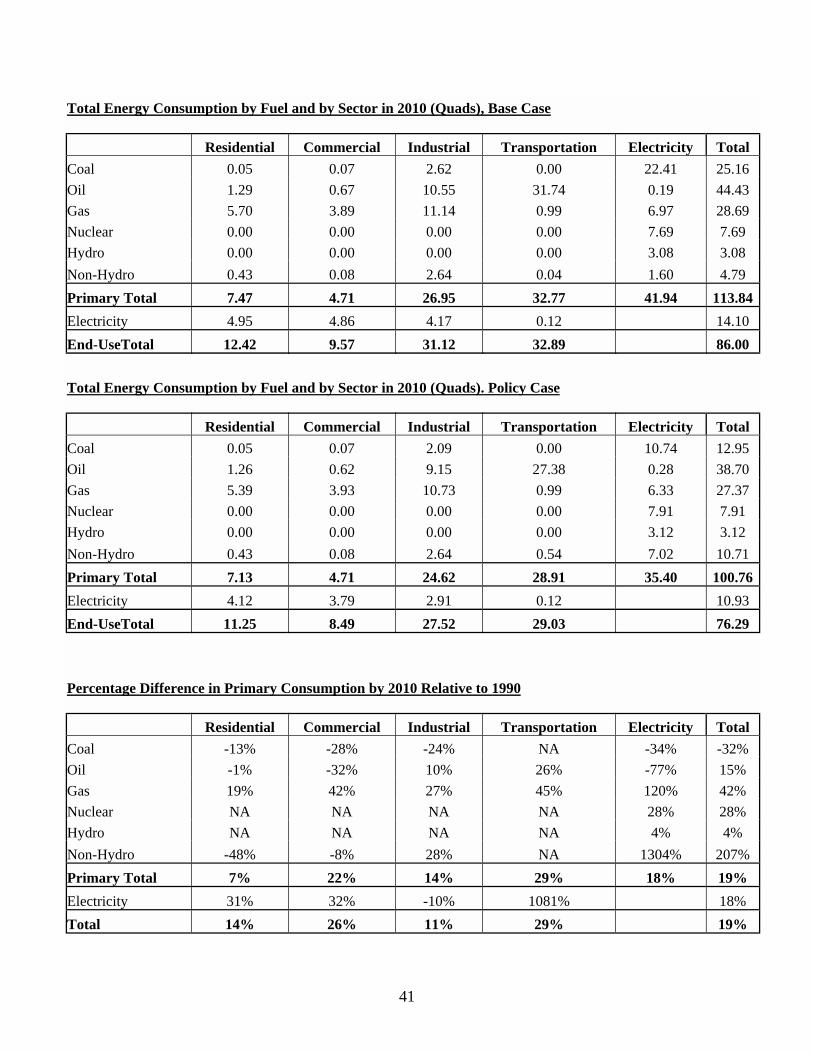
41
Total Energy Consumption by Fuel and by Sector in 2010 (Quads), Base Case Residential Commercial Industrial Transportation Electricity TotalCoal 0.05 0.07 2.62 0.00 22.41 25.16Oil 1.29 0.67 10.55 31.74 0.19 44.43Gas 5.70 3.89 11.14 0.99 6.97 28.69Nuclear 0.00 0.00 0.00 0.00 7.69 7.69Hydro 0.00 0.00 0.00 0.00 3.08 3.08Non-Hydro 0.43 0.08 2.64 0.04 1.60 4.79Primary Total 7.47 4.71 26.95 32.77 41.94 113.84Electricity 4.95 4.86 4.17 0.12 14.10End-UseTotal 12.42 9.57 31.12 32.89 86.00
Total Energy Consumption by Fuel and by Sector in 2010 (Quads). Policy Case Residential Commercial Industrial Transportation Electricity TotalCoal 0.05 0.07 2.09 0.00 10.74 12.95Oil 1.26 0.62 9.15 27.38 0.28 38.70Gas 5.39 3.93 10.73 0.99 6.33 27.37Nuclear 0.00 0.00 0.00 0.00 7.91 7.91Hydro 0.00 0.00 0.00 0.00 3.12 3.12Non-Hydro 0.43 0.08 2.64 0.54 7.02 10.71Primary Total 7.13 4.71 24.62 28.91 35.40 100.76Electricity 4.12 3.79 2.91 0.12 10.93End-UseTotal 11.25 8.49 27.52 29.03 76.29 Percentage Difference in Primary Consumption by 2010 Relative to 1990 Residential Commercial Industrial Transportation Electricity TotalCoal -13% -28% -24% NA -34% -32%Oil -1% -32% 10% 26% -77% 15%Gas 19% 42% 27% 45% 120% 42%Nuclear NA NA NA NA 28% 28%Hydro NA NA NA NA 4% 4%Non-Hydro -48% -8% 28% NA 1304% 207%Primary Total 7% 22% 14% 29% 18% 19%Electricity 31% 32% -10% 1081% 18%Total 14% 26% 11% 29% 19%
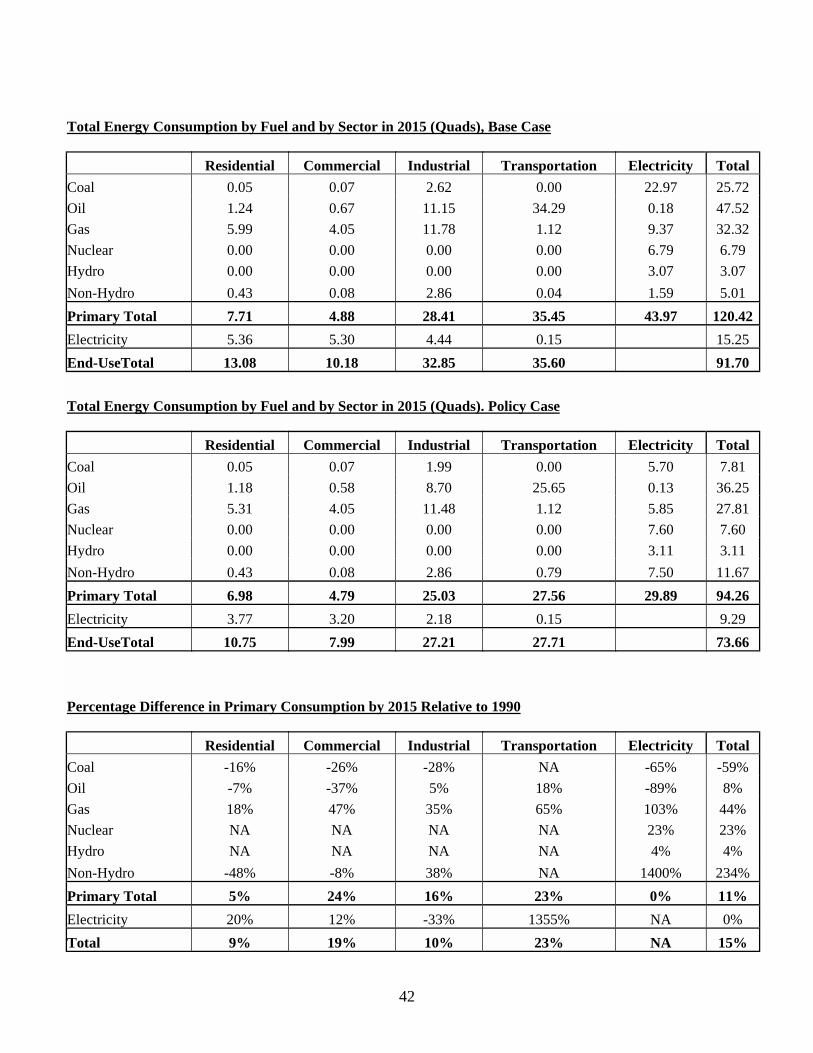
42
Total Energy Consumption by Fuel and by Sector in 2015 (Quads), Base Case Residential Commercial Industrial Transportation Electricity TotalCoal 0.05 0.07 2.62 0.00 22.97 25.72Oil 1.24 0.67 11.15 34.29 0.18 47.52Gas 5.99 4.05 11.78 1.12 9.37 32.32Nuclear 0.00 0.00 0.00 0.00 6.79 6.79Hydro 0.00 0.00 0.00 0.00 3.07 3.07Non-Hydro 0.43 0.08 2.86 0.04 1.59 5.01Primary Total 7.71 4.88 28.41 35.45 43.97 120.42Electricity 5.36 5.30 4.44 0.15 15.25End-UseTotal 13.08 10.18 32.85 35.60 91.70 Total Energy Consumption by Fuel and by Sector in 2015 (Quads). Policy Case Residential Commercial Industrial Transportation Electricity TotalCoal 0.05 0.07 1.99 0.00 5.70 7.81Oil 1.18 0.58 8.70 25.65 0.13 36.25Gas 5.31 4.05 11.48 1.12 5.85 27.81Nuclear 0.00 0.00 0.00 0.00 7.60 7.60Hydro 0.00 0.00 0.00 0.00 3.11 3.11Non-Hydro 0.43 0.08 2.86 0.79 7.50 11.67Primary Total 6.98 4.79 25.03 27.56 29.89 94.26Electricity 3.77 3.20 2.18 0.15 9.29End-UseTotal 10.75 7.99 27.21 27.71 73.66 Percentage Difference in Primary Consumption by 2015 Relative to 1990 Residential Commercial Industrial Transportation Electricity TotalCoal -16% -26% -28% NA -65% -59%Oil -7% -37% 5% 18% -89% 8%Gas 18% 47% 35% 65% 103% 44%Nuclear NA NA NA NA 23% 23%Hydro NA NA NA NA 4% 4%Non-Hydro -48% -8% 38% NA 1400% 234%Primary Total 5% 24% 16% 23% 0% 11%Electricity 20% 12% -33% 1355% NA 0%Total 9% 19% 10% 23% NA 15%
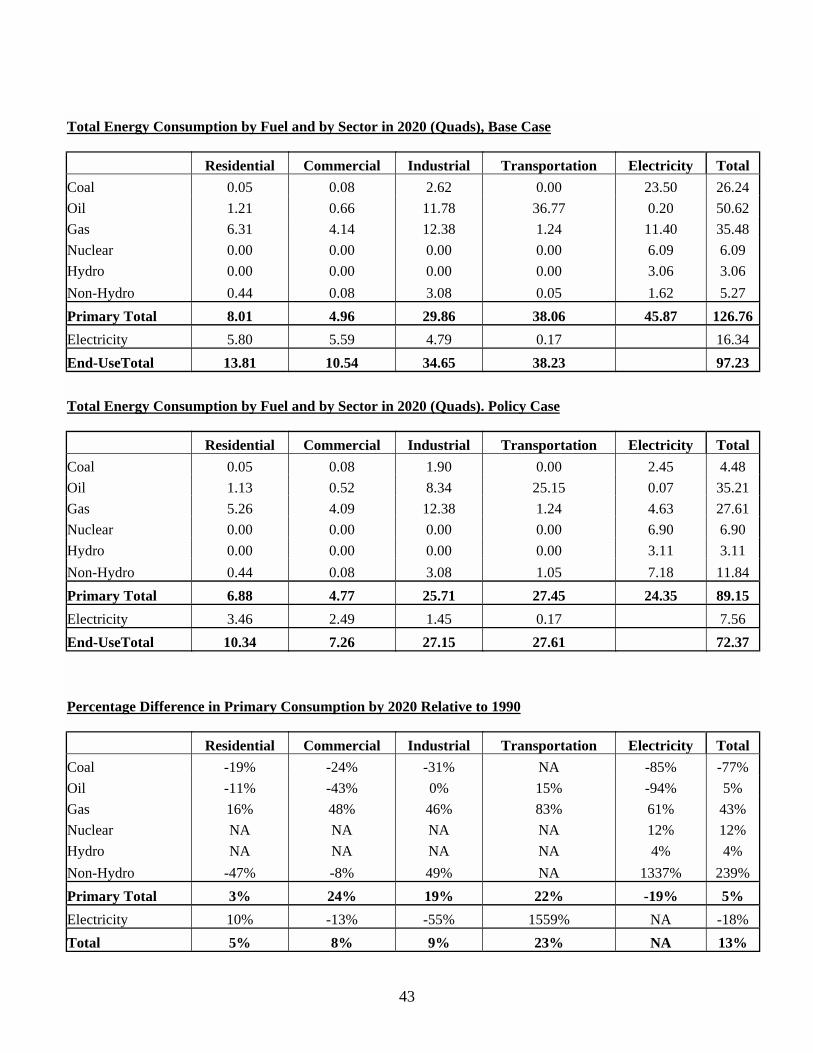
43
Total Energy Consumption by Fuel and by Sector in 2020 (Quads), Base Case Residential Commercial Industrial Transportation Electricity TotalCoal 0.05 0.08 2.62 0.00 23.50 26.24Oil 1.21 0.66 11.78 36.77 0.20 50.62Gas 6.31 4.14 12.38 1.24 11.40 35.48Nuclear 0.00 0.00 0.00 0.00 6.09 6.09Hydro 0.00 0.00 0.00 0.00 3.06 3.06Non-Hydro 0.44 0.08 3.08 0.05 1.62 5.27Primary Total 8.01 4.96 29.86 38.06 45.87 126.76Electricity 5.80 5.59 4.79 0.17 16.34End-UseTotal 13.81 10.54 34.65 38.23 97.23 Total Energy Consumption by Fuel and by Sector in 2020 (Quads). Policy Case Residential Commercial Industrial Transportation Electricity TotalCoal 0.05 0.08 1.90 0.00 2.45 4.48Oil 1.13 0.52 8.34 25.15 0.07 35.21Gas 5.26 4.09 12.38 1.24 4.63 27.61Nuclear 0.00 0.00 0.00 0.00 6.90 6.90Hydro 0.00 0.00 0.00 0.00 3.11 3.11Non-Hydro 0.44 0.08 3.08 1.05 7.18 11.84Primary Total 6.88 4.77 25.71 27.45 24.35 89.15Electricity 3.46 2.49 1.45 0.17 7.56End-UseTotal 10.34 7.26 27.15 27.61 72.37 Percentage Difference in Primary Consumption by 2020 Relative to 1990 Residential Commercial Industrial Transportation Electricity TotalCoal -19% -24% -31% NA -85% -77%Oil -11% -43% 0% 15% -94% 5%Gas 16% 48% 46% 83% 61% 43%Nuclear NA NA NA NA 12% 12%Hydro NA NA NA NA 4% 4%Non-Hydro -47% -8% 49% NA 1337% 239%Primary Total 3% 24% 19% 22% -19% 5%Electricity 10% -13% -55% 1559% NA -18%Total 5% 8% 9% 23% NA 13%
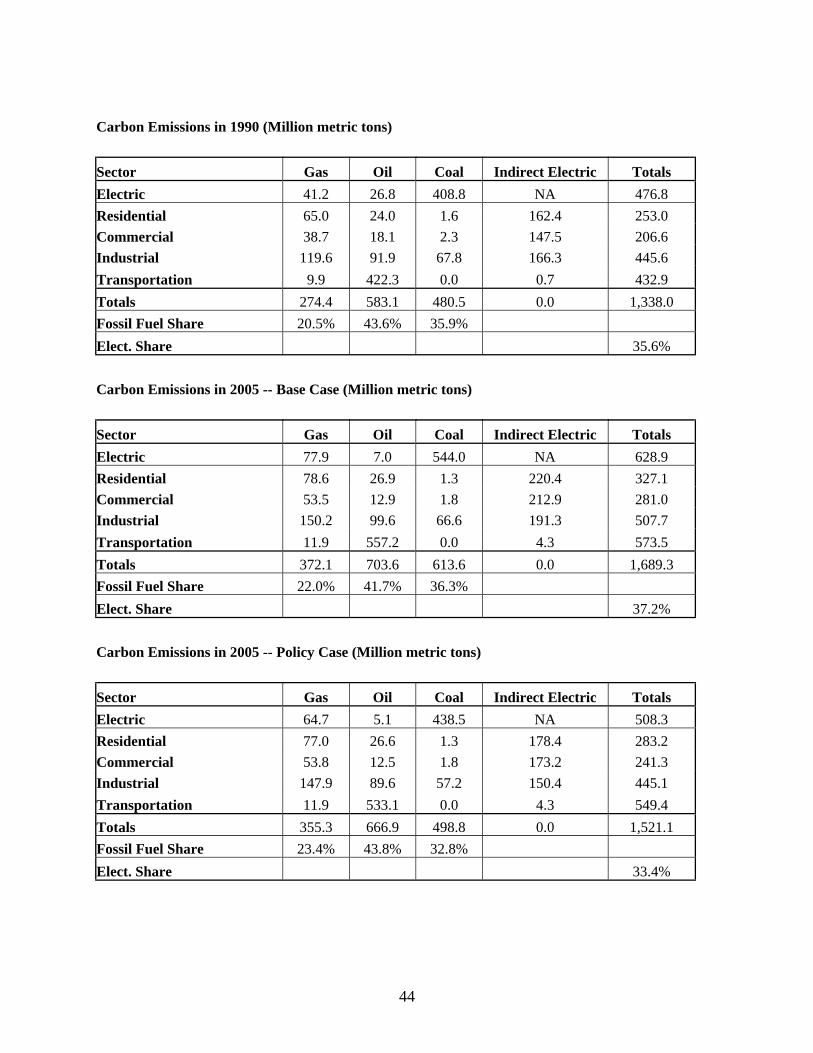
44
Carbon Emissions in 1990 (Million metric tons)
Sector Gas Oil Coal Indirect Electric TotalsElectric 41.2 26.8 408.8 NA 476.8Residential 65.0 24.0 1.6 162.4 253.0Commercial 38.7 18.1 2.3 147.5 206.6Industrial 119.6 91.9 67.8 166.3 445.6Transportation 9.9 422.3 0.0 0.7 432.9Totals 274.4 583.1 480.5 0.0 1,338.0Fossil Fuel Share 20.5% 43.6% 35.9% Elect. Share 35.6%
Carbon Emissions in 2005 -- Base Case (Million metric tons)
Sector Gas Oil Coal Indirect Electric TotalsElectric 77.9 7.0 544.0 NA 628.9Residential 78.6 26.9 1.3 220.4 327.1Commercial 53.5 12.9 1.8 212.9 281.0Industrial 150.2 99.6 66.6 191.3 507.7Transportation 11.9 557.2 0.0 4.3 573.5Totals 372.1 703.6 613.6 0.0 1,689.3Fossil Fuel Share 22.0% 41.7% 36.3% Elect. Share 37.2%
Carbon Emissions in 2005 -- Policy Case (Million metric tons)
Sector Gas Oil Coal Indirect Electric TotalsElectric 64.7 5.1 438.5 NA 508.3Residential 77.0 26.6 1.3 178.4 283.2Commercial 53.8 12.5 1.8 173.2 241.3Industrial 147.9 89.6 57.2 150.4 445.1Transportation 11.9 533.1 0.0 4.3 549.4Totals 355.3 666.9 498.8 0.0 1,521.1Fossil Fuel Share 23.4% 43.8% 32.8% Elect. Share 33.4%
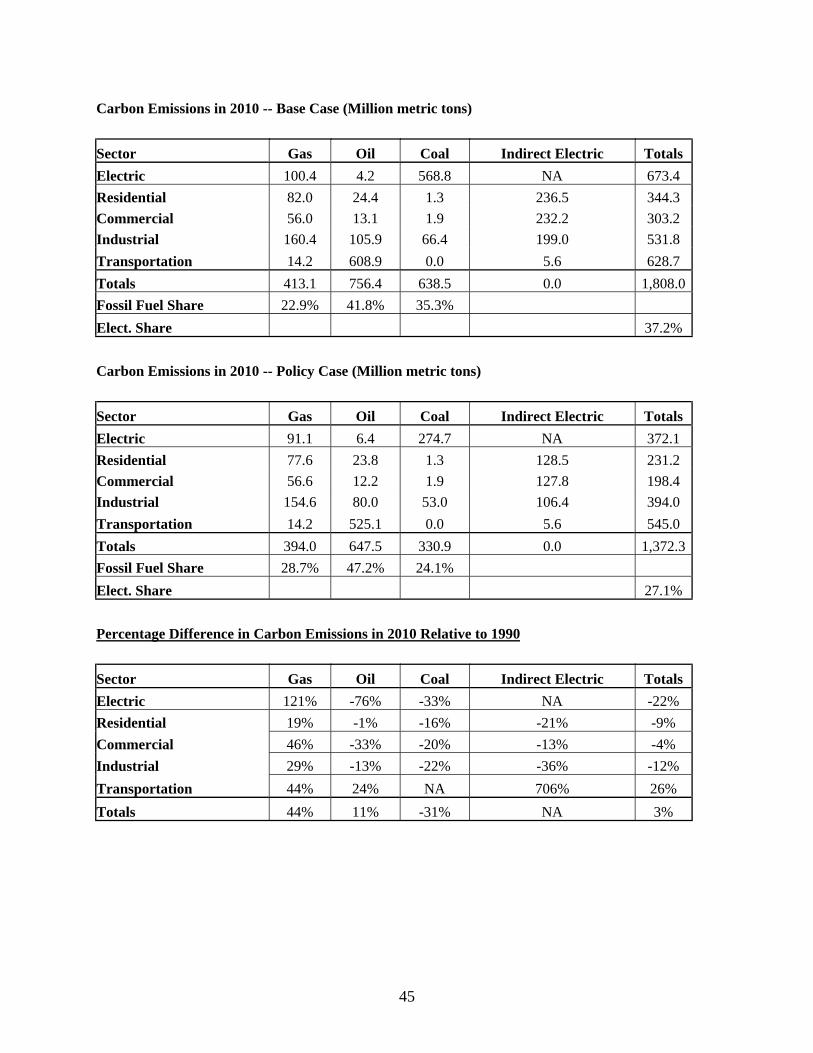
45
Carbon Emissions in 2010 -- Base Case (Million metric tons)
Sector Gas Oil Coal Indirect Electric TotalsElectric 100.4 4.2 568.8 NA 673.4Residential 82.0 24.4 1.3 236.5 344.3Commercial 56.0 13.1 1.9 232.2 303.2Industrial 160.4 105.9 66.4 199.0 531.8Transportation 14.2 608.9 0.0 5.6 628.7Totals 413.1 756.4 638.5 0.0 1,808.0Fossil Fuel Share 22.9% 41.8% 35.3% Elect. Share 37.2%
Carbon Emissions in 2010 -- Policy Case (Million metric tons)
Sector Gas Oil Coal Indirect Electric TotalsElectric 91.1 6.4 274.7 NA 372.1Residential 77.6 23.8 1.3 128.5 231.2Commercial 56.6 12.2 1.9 127.8 198.4Industrial 154.6 80.0 53.0 106.4 394.0Transportation 14.2 525.1 0.0 5.6 545.0Totals 394.0 647.5 330.9 0.0 1,372.3Fossil Fuel Share 28.7% 47.2% 24.1% Elect. Share 27.1%
Percentage Difference in Carbon Emissions in 2010 Relative to 1990
Sector Gas Oil Coal Indirect Electric TotalsElectric 121% -76% -33% NA -22%Residential 19% -1% -16% -21% -9%Commercial 46% -33% -20% -13% -4%Industrial 29% -13% -22% -36% -12%Transportation 44% 24% NA 706% 26%Totals 44% 11% -31% NA 3%
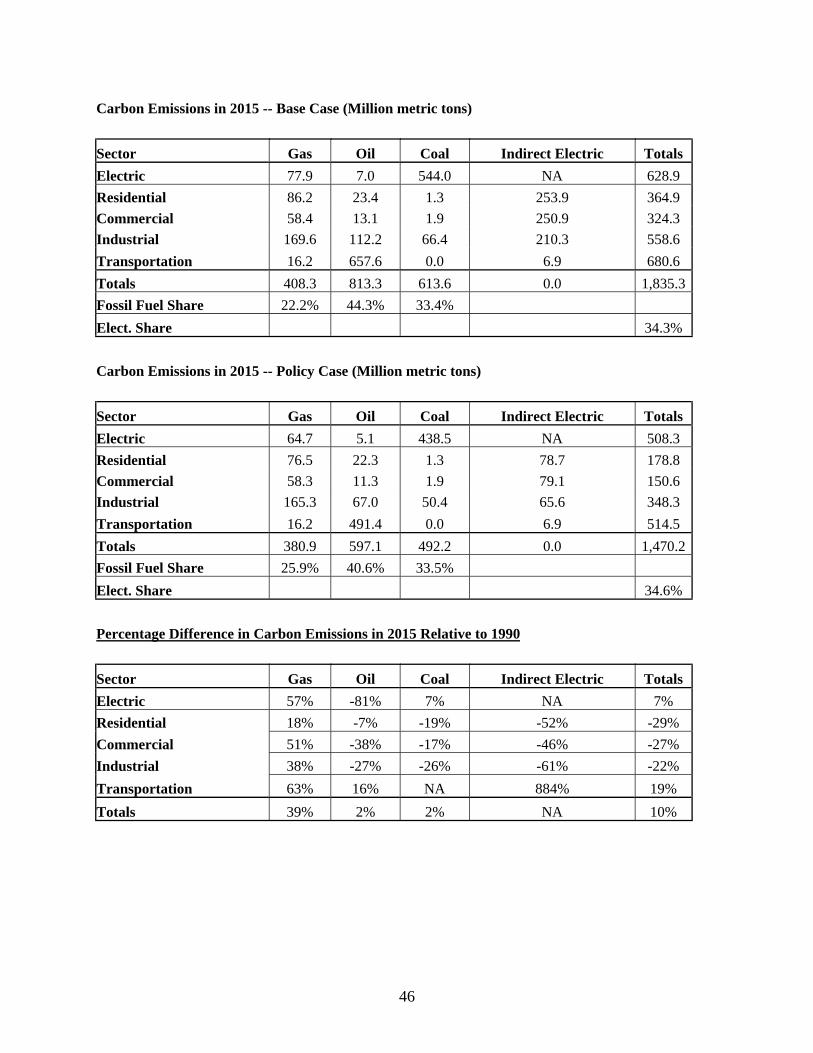
46
Carbon Emissions in 2015 -- Base Case (Million metric tons)
Sector Gas Oil Coal Indirect Electric TotalsElectric 77.9 7.0 544.0 NA 628.9Residential 86.2 23.4 1.3 253.9 364.9Commercial 58.4 13.1 1.9 250.9 324.3Industrial 169.6 112.2 66.4 210.3 558.6Transportation 16.2 657.6 0.0 6.9 680.6Totals 408.3 813.3 613.6 0.0 1,835.3Fossil Fuel Share 22.2% 44.3% 33.4% Elect. Share 34.3%
Carbon Emissions in 2015 -- Policy Case (Million metric tons)
Sector Gas Oil Coal Indirect Electric TotalsElectric 64.7 5.1 438.5 NA 508.3Residential 76.5 22.3 1.3 78.7 178.8Commercial 58.3 11.3 1.9 79.1 150.6Industrial 165.3 67.0 50.4 65.6 348.3Transportation 16.2 491.4 0.0 6.9 514.5Totals 380.9 597.1 492.2 0.0 1,470.2Fossil Fuel Share 25.9% 40.6% 33.5% Elect. Share 34.6%
Percentage Difference in Carbon Emissions in 2015 Relative to 1990
Sector Gas Oil Coal Indirect Electric TotalsElectric 57% -81% 7% NA 7%Residential 18% -7% -19% -52% -29%Commercial 51% -38% -17% -46% -27%Industrial 38% -27% -26% -61% -22%Transportation 63% 16% NA 884% 19%Totals 39% 2% 2% NA 10%
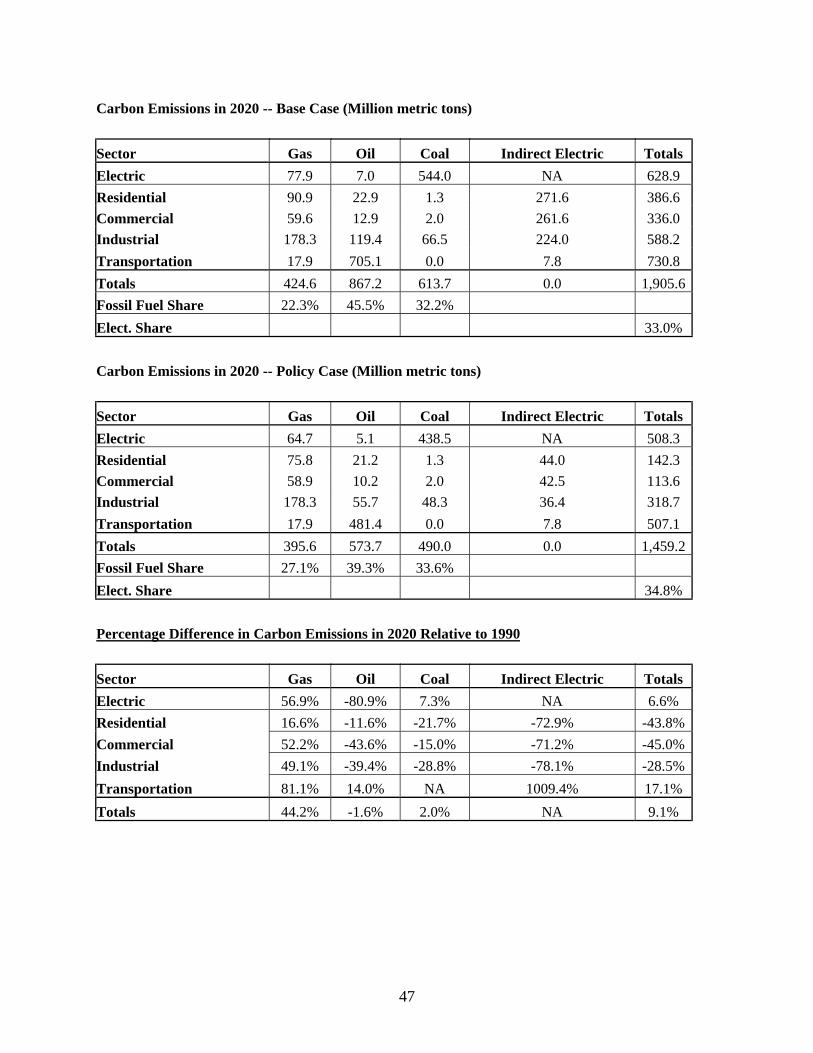
47
Carbon Emissions in 2020 -- Base Case (Million metric tons)
Sector Gas Oil Coal Indirect Electric TotalsElectric 77.9 7.0 544.0 NA 628.9Residential 90.9 22.9 1.3 271.6 386.6Commercial 59.6 12.9 2.0 261.6 336.0Industrial 178.3 119.4 66.5 224.0 588.2Transportation 17.9 705.1 0.0 7.8 730.8Totals 424.6 867.2 613.7 0.0 1,905.6Fossil Fuel Share 22.3% 45.5% 32.2% Elect. Share 33.0%
Carbon Emissions in 2020 -- Policy Case (Million metric tons)
Sector Gas Oil Coal Indirect Electric TotalsElectric 64.7 5.1 438.5 NA 508.3Residential 75.8 21.2 1.3 44.0 142.3Commercial 58.9 10.2 2.0 42.5 113.6Industrial 178.3 55.7 48.3 36.4 318.7Transportation 17.9 481.4 0.0 7.8 507.1Totals 395.6 573.7 490.0 0.0 1,459.2Fossil Fuel Share 27.1% 39.3% 33.6% Elect. Share 34.8%
Percentage Difference in Carbon Emissions in 2020 Relative to 1990
Sector Gas Oil Coal Indirect Electric TotalsElectric 56.9% -80.9% 7.3% NA 6.6%Residential 16.6% -11.6% -21.7% -72.9% -43.8%Commercial 52.2% -43.6% -15.0% -71.2% -45.0%Industrial 49.1% -39.4% -28.8% -78.1% -28.5%Transportation 81.1% 14.0% NA 1009.4% 17.1%Totals 44.2% -1.6% 2.0% NA 9.1%
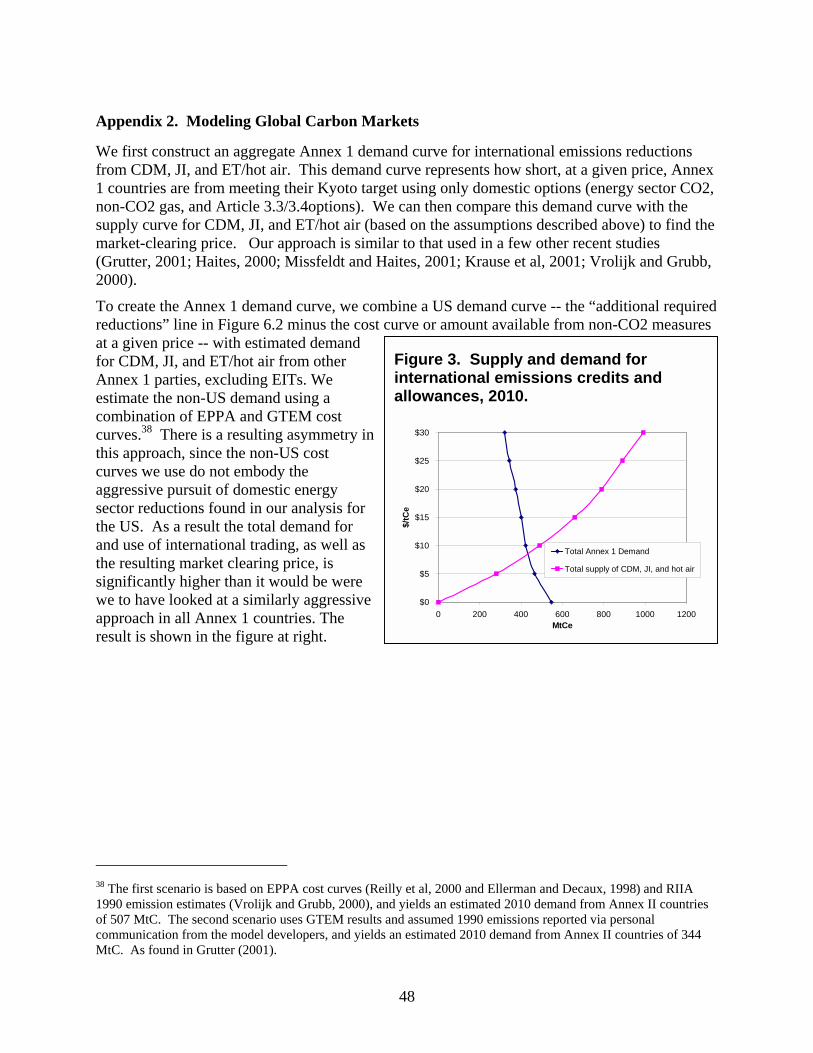
48
Appendix 2. Modeling Global Carbon Markets
We first construct an aggregate Annex 1 demand curve for international emissions reductionsfrom CDM, JI, and ET/hot air. This demand curve represents how short, at a given price, Annex1 countries are from meeting their Kyoto target using only domestic options (energy sector CO2,non-CO2 gas, and Article 3.3/3.4options). We can then compare this demand curve with thesupply curve for CDM, JI, and ET/hot air (based on the assumptions described above) to find themarket-clearing price. Our approach is similar to that used in a few other recent studies(Grutter, 2001; Haites, 2000; Missfeldt and Haites, 2001; Krause et al, 2001; Vrolijk and Grubb,2000).
To create the Annex 1 demand curve, we combine a US demand curve -- the “additional requiredreductions” line in Figure 6.2 minus the cost curve or amount available from non-CO2 measuresat a given price -- with estimated demandfor CDM, JI, and ET/hot air from otherAnnex 1 parties, excluding EITs. Weestimate the non-US demand using acombination of EPPA and GTEM costcurves.38 There is a resulting asymmetry inthis approach, since the non-US costcurves we use do not embody theaggressive pursuit of domestic energysector reductions found in our analysis forthe US. As a result the total demand forand use of international trading, as well asthe resulting market clearing price, issignificantly higher than it would be werewe to have looked at a similarly aggressiveapproach in all Annex 1 countries. Theresult is shown in the figure at right.
38 The first scenario is based on EPPA cost curves (Reilly et al, 2000 and Ellerman and Decaux, 1998) and RIIA1990 emission estimates (Vrolijk and Grubb, 2000), and yields an estimated 2010 demand from Annex II countriesof 507 MtC. The second scenario uses GTEM results and assumed 1990 emissions reported via personalcommunication from the model developers, and yields an estimated 2010 demand from Annex II countries of 344MtC. As found in Grutter (2001).
Figure 3. Supply and demand forinternational emissions credits andallowances, 2010.
$0
$5
$10
$15
$20
$25
$30
0 200 400 600 800 1000 1200MtCe
$/tC
e
Total Annex 1 Demand
Total supply of CDM, JI, and hot air


![Kyoto Protocol Durban Preparation[1]](https://img.pdfslide.us/doc/110x75/577d24821a28ab4e1e9c9bda/kyoto-protocol-durban-preparation1.jpg)