Embed Size (px)
Citation preview

Strategic PreStrategic Pre--emptive Strikes: emptive Strikes: Revisiting BOD AnalysisRevisiting BOD Analysis
Your Strike Team:
George Bowman, Ret.Rick MealyDNR, LabCertDNR, LabCert
The 411 on BOD LOD

Defining “depletion”Dear Rock & GonzoI have a question for you. With the following results from a cBOD run, how would the result be written down? Our samples make the requirement of at least 2 ppm, but once we subtract the seed correction factor it is under the 2ppm criterion.Thanks!Scooter Sample Size: 275 ml (Dilution factor: 1.09)
Initial DO: 8.65 Final DO: 6.59Depletion: 2.06
Seed Correction factor: 0.62Depletion After seed correction: 1.44
Result: 1.57 mg/LDo I record the result as 1.57 mg/L? Do I record the result as 1.57 mg/L? ……or do I record as <2?or do I record as <2?……or do I need more sample? Seed?or do I need more sample? Seed?
Defining Depletion
1. Is the depletion adequate?
So...the analyst can report < 2.2.The bigger issue is...the lab should use a full 300 mL bottle?
2. What to report?
Reporting has to be dealt with separately. We first have to decide whether we have a reportable value; and then –if we do– how do we deal with it?The bottom line here is: "Was there adequate depletion?"
Yes...but due to the supplement from the seed.The larger issue is...how much of the depletion was due to the seed (or, actually...how much of the depletion was due to sample). Here, the analyst has it: It's 1.57 ppm... which is below the LOD of 2.2.
...as long as the combined deletion of sample + seed is at least 2 mg/L

Throw all the seed at it you want…at the end of the day, it’s still “<“
A B C D E FSample Seed Depletion DF BOD
Sample BotL# mLs mLs DO_I DO_F B-C SCF 300/A F x (D-E) REPORTX 300 0 8.5 8.4 0.1U 300 0 8.5 8.4 0.1
A 5 8.5 6.2 2.3 0.46
B 10 8.5 4.4 4.1 0.41C 15 8.5 1.9 6.6 0.44
L 6 2 8.5 3.5 5 0.87 50 206.3T 6 2 8.5 3.5 5 0.87 50 206.3Z 6 2 8.5 3.6 4.9 0.87 50 201.3
VV 200 0 8.5 8.3 0.2 0 1.5 0.3
F 250 0 8.4 8.2 0.2 0 1.2 0.2AN 300 0 8.4 8.2 0.2 0 1 0.2
VV 250 2 8.4 7.5 0.9 0.87 1.2 0.0
VV 250 4 8.4 6.6 1.8 1.75 1.2 0.1VV 250 6 8.4 5.7 2.7 2.62 1.2 0.1VV 250 8 8.4 4.8 3.6 3.49 1.2 0.1
VV 250 10 8.4 3.9 4.5 4.37 1.2 0.2VV 250 12 8.4 3.1 5.3 5.24 1.2 0.1
VV 250 14 8.4 2.2 6.2 6.11 1.2 0.1VV 250 16 8.4 1.3 7.1 6.99 1.2 0.1
VV 250 18 8.4 0.5 7.9 7.86 1.2 0.0VV 250 20 8.4 0 8.4 8.73 1.2 -0.4
Seed Control
Dil’n Blank
The Pristine Sample II
The Pristine Sample
GGA 204.7
< 2 ??
< 2.4
UNDERUNDER
OVEROVER
GGA TROUBLES

GGA Troubleshooting
Like Goldilocks and the 3 BearsGoldilocks and the 3 Bears, GGA can only be Too Low, Too High, or Just Right.
Just Right is 198 + 30.5 mg/L (167.5-228.5)
Contaminated/Incorrect concentration GGAPoor Seed PrepToxic Seed
Not Enough Seed
The single greatest cause of low GGA results is insufficient (orinadequate) seed. Try running multiple bottles of GGA adding additional seed to each bottle. For example, if you typically use 2 mL of seed material, prepare 3 bottles of GGA: one with 2 mLs of seed, one with 4 mLs of seed, and one with 6 mLs of seed. If the seeding is the problem, you should see a rise in GGA with increasing seed volume until it passes.
GGA TOO LOW (< 180)
The single greatest cause of low GGA results is insufficient (orinadequate) seed
GGA TOO LOW (Corrective Action)
Bad/Wrong GGA
Poor Seed Prep
Toxic Seed: This should be a rare occurrence, and only associated with an externally obtained (non-synthetic) seed. Try a different seed material.
Not Enough
Seed
Bad/Wrong GGA: Re-prepare GGA or obtain fresh.
Poor Seed Prep: If using synthetic seed, check to be sure seed was prepared properly according to instructions. Allow to settle, carefully decant and pipet from that.
Toxic Seed
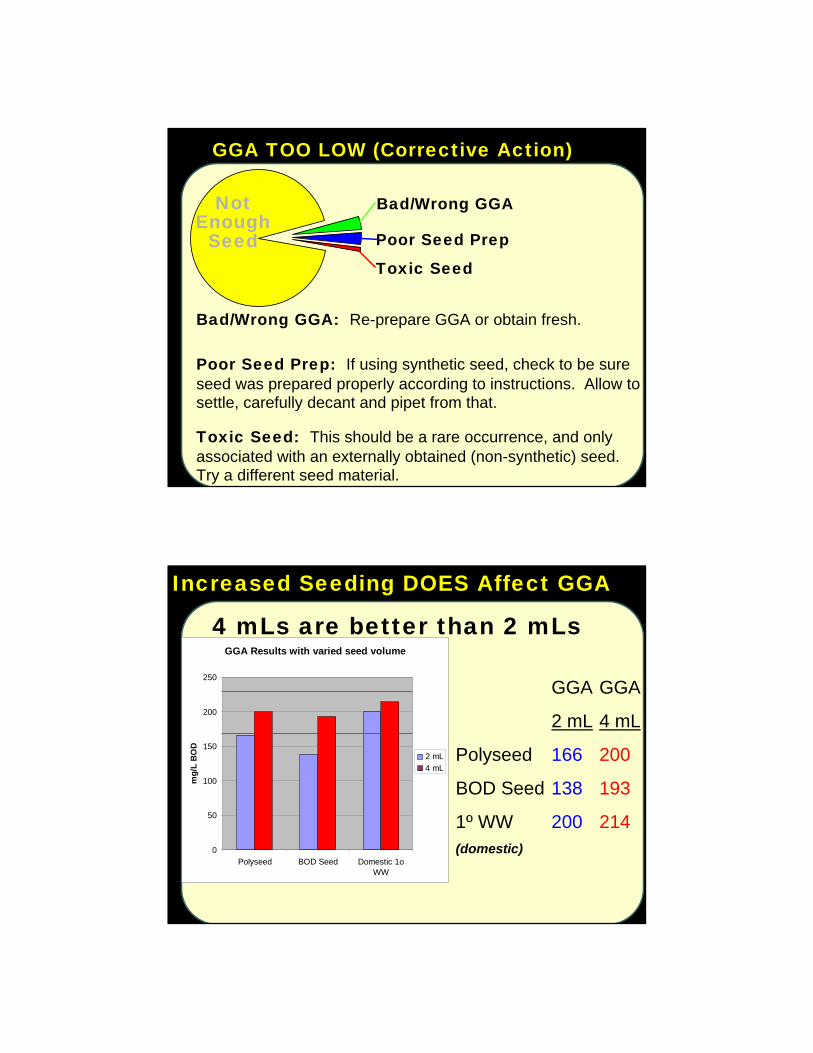
Increased Seeding DOES Affect GGA
GGA Results with varied seed volume
0
50
100
150
200
250
Polyseed BOD Seed Domestic 1oWW
mg
/L B
OD
2 mL
4 mL
GGA GGA
2 mL 4 mL
Polyseed 166 200
BOD Seed 138 193
1º WW 200 214(domestic)
4 mLs are better than 2 mLs
GGA & SEEDING – New Concept: DPMS
Many lab folks jump to the seed correction factor (SCF), which is the average DPMS. As with everything else, averages can be misleading. Look at the data that goes into the SCF!
DPMSDPMS: mg/L DO DDepletion PPer mmL of SSeed
Depletion per mL of seed: Monitor the depletion per mL of seed. Add enough seed to GGA which will result in a depletion of about 0.6 to 1.0 mg/L.
Consistency of seed controls: Most likely cause is drawing up settled seed. Consistency is critical. If you have 3 seed controls having depletions per mL of 0.2,0.4, and 0.6, two mL of seed will result in a depletion of between 0.4 and 1.2 mg/L. With a dilution factor of 50 for GGA, that’s a range of 20-60 in your GGA. That could kill you.
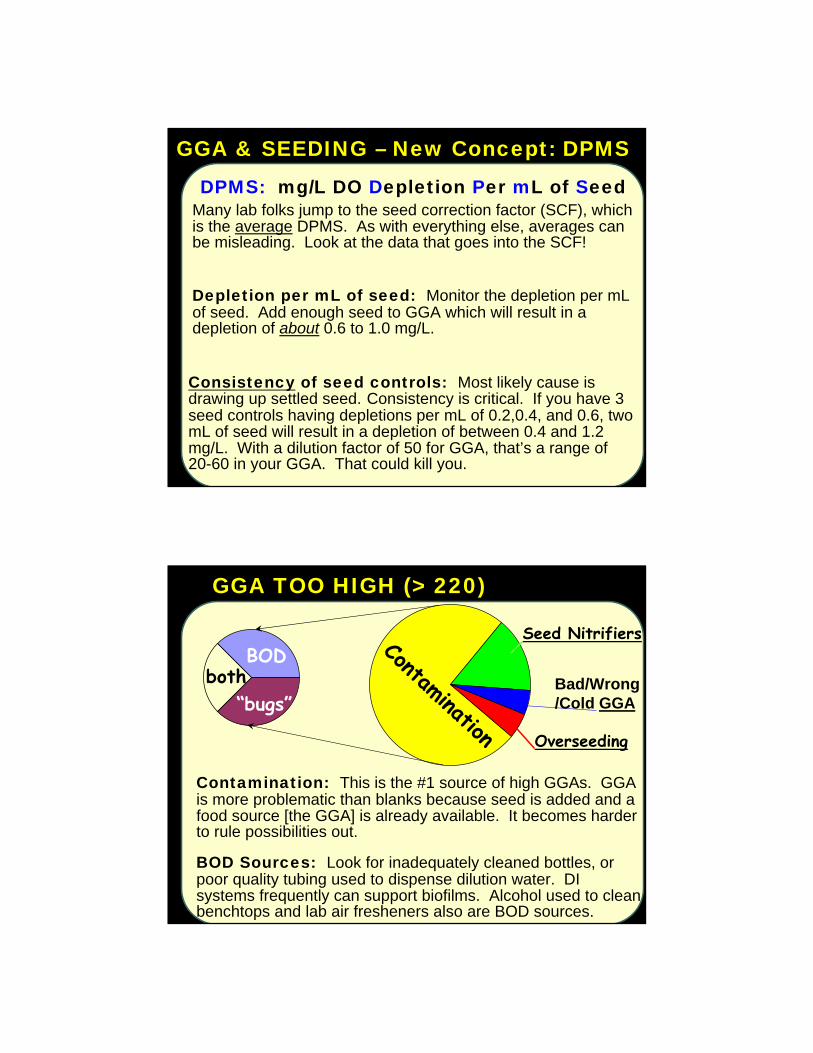
GGA TOO HIGH (> 220)
BOD
“bugs”both
Seed NitrifiersContamination
Bad/Wrong/Cold GGA
Overseeding
Contamination: This is the #1 source of high GGAs. GGA is more problematic than blanks because seed is added and a food source [the GGA] is already available. It becomes harder to rule possibilities out.
BOD Sources: Look for inadequately cleaned bottles, or poor quality tubing used to dispense dilution water. DI systems frequently can support biofilms. Alcohol used to clean benchtops and lab air fresheners also are BOD sources.

GGA Killers
GGA TOO HIGH (> 220)
BOD
“bugs”both
Seed NitrifiersContamination
Bad/Wrong/Cold GGA
Overseeding
OverSeeding: Literature sources cite this and it COULD happen, but as long as your SCF (DPMSDPMS!) is accurate, GGA should be fine.
Contamination (“Bugs”): Sources could be from the lab itself, or possibly from buildup in a lab reagent water system.
GGA prep: Contaminated GGA, incorrectly prepared GGA and use of GGA while cold can all cause high GGA bias..
Nitrifiers in Seed: Recall that there is ammonia in dilution water (294 mLs!) and GGA contains significant nitrogen.

SEEDING –A REVIEW
Seeding Review 1
A good quality seed has a DPMS of about 0.35-0.5 (BOD of 130-180) and is consistent.
A B C D E FSeed Depletion DF BOD
Sample BotL# mLs DO_I DO_F B-C DPMS 300/A F x (D-E) SCF
Example 1: Good, Consistent SeedA 5 8.5 6.2 2.3 0.46 60 138
B 10 8.5 4.3 4.2 0.42 30 126 0.44C 15 8.5 1.9 6.6 0.44 20 132
Seed Control
A variable (poor precision) seed affects accuracy of results. Would YOU feel comfortable averaging 100,160, and 222 to arrive at a BOD of 161 for a sample? See “Apparent toxicity in Example 6”
Example 2: Inconsistent (Variable) SeedA 6 8.5 6.5 2 0.33 50 100B 10 8.5 1.1 7.4 0.74 30 222 0.54C 12 8.5 2.1 6.4 0.53 25 160
Seed Control

Seeding Review 2
Example 3: Weak SeedA 5 8.5 7.9 0.6 0.12 60 36
B 10 8.5 7.1 1.4 0.14 30 42 0.14C 15 8.5 6.2 2.3 0.15 20 46
Seed Control
Example 4: Very Active SeedA 5 9.5 5.0 4.5 0.90 60 270
B 10 9.6 1.1 8.5 0.85 30 255 0.88C 15 9.5 << 1.0 over depletes 20 > 170
Seed Control
A B C D E FSeed Depletion DF BOD
Sample BotL# mLs DO_I DO_F B-C DPMS 300/A F x (D-E) SCF
A weak seed has a DPMS of <0.25 (BOD < 50). Too much seed volume is needed to pass GGA. Generally 2-4 mLs of seed should be enough.
On the flip side, a highly active seed can quickly deplete available BOD. Active seeds can cause GGA failures.
Seeding Review 3
Example 6: "Apparent" Seed ToxicityA 3 8.5 6.5 2 0.67 100 200
B 6 8.5 3.8 4.7 0.78 50 235 0.76C 9 8.5 1.0 7.5 0.83 33.333 250
Seed Control
Example 5: Seed ToxicityA 5 8.5 6.1 2.4 0.48 60 144
B 10 8.5 5.7 2.8 0.28 30 84 0.33C 15 8.5 5.2 3.3 0.22 20 66
Seed Control
A B C D E FSeed Depletion DF BOD
Sample BotL# mLs DO_I DO_F B-C DPMS 300/A F x (D-E) SCF
A toxic seed would look something like this. Leftover detergent or surfactant in a BOD bottle could cause this if not adequately rinsed and seeded added first.
Use of a single pipet for multiple additions of seed can result in settling between additions. This settling can appear to be toxicity.
Relationships
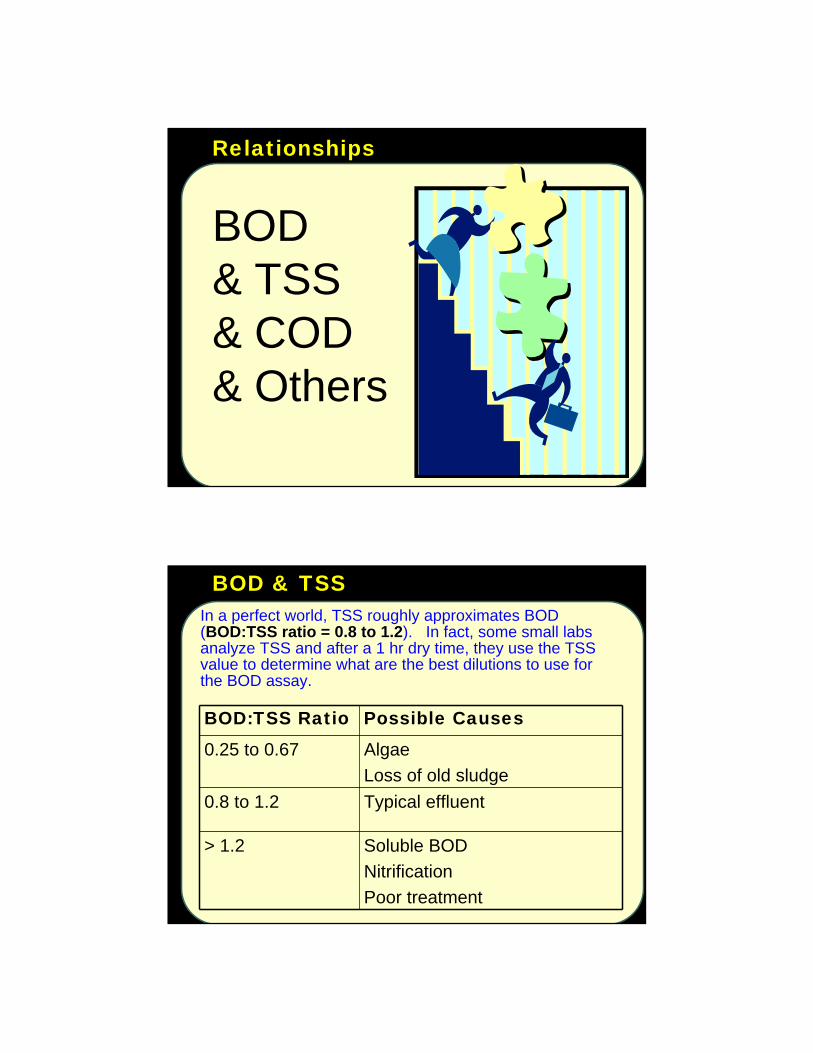
BOD & TSS& COD& Others
BOD & TSS
BOD:TSS Ratio Possible Causes
0.25 to 0.67 Algae
Loss of old sludge
0.8 to 1.2 Typical effluent
> 1.2 Soluble BOD
Nitrification
Poor treatment
In a perfect world, TSS roughly approximates BOD (BOD:TSS ratio = 0.8 to 1.2BOD:TSS ratio = 0.8 to 1.2). In fact, some small labs analyze TSS and after a 1 hr dry time, they use the TSS value to determine what are the best dilutions to use for the BOD assay.

Other ratiosOther ratios are often invaluable in performing detective work for a particular situation or facility.
BOD:COD ratios: BOD:COD ratios: Think of it as “available” carbon (BOD) vs. “total” carbon. COD is always greater than BOD. Without sufficient data and a fairly constant waste stream, COD provides a rapid estimate of BOD.
BOD:cBOD ratios: BOD:cBOD ratios: This is the most significant tool in detecting nitrification—but understand that cBOD will always be less than BOD. The extent to which it is less and other factors indicate nitrification.
Characteristics of some grab wastewater samples
OakfieldGreen Lake
Ashland CampbellsportGreen Bay
BOD mg/L 93 121 190 205 157COD mg/L 388 300 462 450 427
Source: http://www.dnr.state.wi.us/org/water/wm/ww/biophos/3bpr.htm
BOD/COD 0.24 0.40 0.41 0.46 0.370.24 0.40 0.41 0.46 0.37
BOD/COD ratios vary between wastes…

Source: Dairy Processing Methods to Reduce Water Useand Liquid Waste Load, K-State Research and ExtensionMarch 1997. http://www.oznet.ksu.edu/library/AGENG2/mf2071.pdf
Other Industry BOD/COD ratios
SLH experience: BOD/COD ratiosBOD vs COD (Airport runoff)
y = 0.5904x - 22.43
R2 = 0.9496
0
500
1000
1500
2000
2500
3000
3500
0 1000 2000 3000 4000 5000
COD (mg/L)
BO
D (
mg/
L)
r = 0.9745
# data points= 30Mean BOD/COD = 0.527 Median = 0.526Range= 0.327 to 0.829
BO
D m
g/L
COD mg/L
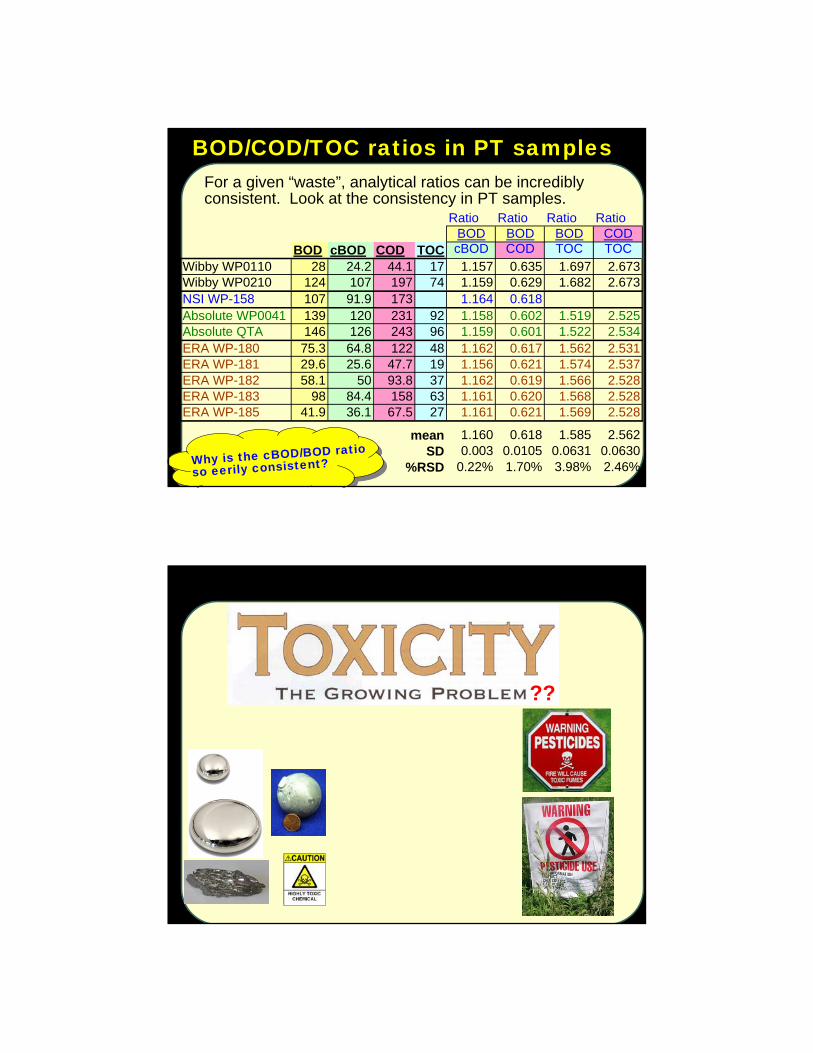
BOD/COD/TOC ratios in PT samplesFor a given “waste”, analytical ratios can be incredibly consistent. Look at the consistency in PT samples.
Why is the cBOD/BOD ratio
so eerily consistent?
Ratio Ratio Ratio RatioBOD BOD BOD COD
BOD cBOD COD TOC cBOD COD TOC TOCWibby WP0110 28 24.2 44.1 17 1.157 0.635 1.697 2.673Wibby WP0210 124 107 197 74 1.159 0.629 1.682 2.673NSI WP-158 107 91.9 173 1.164 0.618Absolute WP0041 139 120 231 92 1.158 0.602 1.519 2.525Absolute QTA 146 126 243 96 1.159 0.601 1.522 2.534ERA WP-180 75.3 64.8 122 48 1.162 0.617 1.562 2.531ERA WP-181 29.6 25.6 47.7 19 1.156 0.621 1.574 2.537ERA WP-182 58.1 50 93.8 37 1.162 0.619 1.566 2.528ERA WP-183 98 84.4 158 63 1.161 0.620 1.568 2.528ERA WP-185 41.9 36.1 67.5 27 1.161 0.621 1.569 2.528
mean 1.160 0.618 1.585 2.562SD 0.003 0.0105 0.0631 0.0630
%RSD 0.22% 1.70% 3.98% 2.46%
??

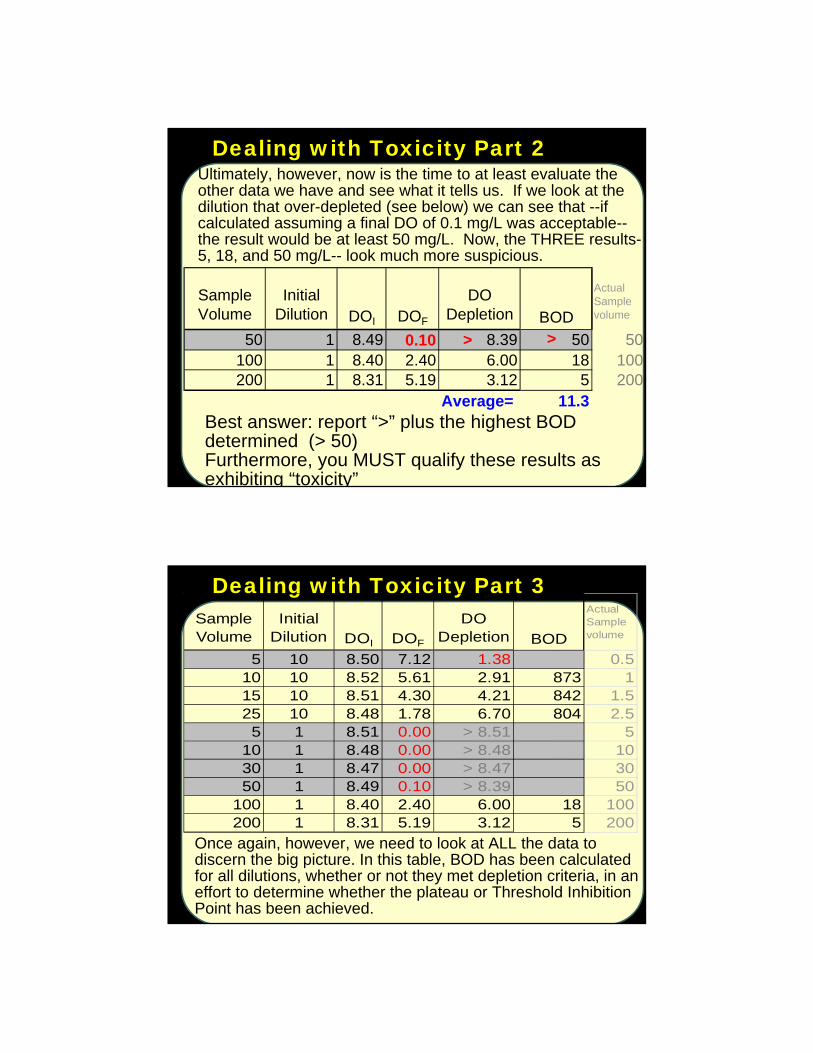
Often referred to as “sliding” BODsBOD drops as sample volume increases (less dilute)Occurs frequently in systems receiving industrial wasteAmounts to killing off (or severe shock to) “the bugs”Results in UNDER-reporting the BOD of a wasteFailure to mix sample b/w dilutions can APPEAR as
toxicity. (the opposite can happen as well!)Even pH adjustments can result in this effectPoor technique (pipetting, pouring samples)Sometimes we just can’t determine (isolated cases)
…as dilution , available NH3 ==> final BOD
Sliding BODs Sample Toxicity
If nitrification IS occurring(remember : dilution water contains NH3 )
Toxicity – a brief review
What is NOT sliding BOD
300 mLs 2 mg/L BOD
200 mLs 3 mg/L BOD
100 mLs 4 mg/L BOD
SM now says, “Identify samples in test reports when serial dilutions show more than 30% between high and low values.”
does NOT indicate sliding BODdoes NOT indicate sliding BOD

Toxicity Look-A-Likes: Sub-samplingWhen pouring, solids are also actively settling
during the entire transfer processPouring quickly favors an
aliquot containing an even mix of sample.
Pouring slowly favors an aliquot containing a significant portion of diluted supernatant. Solids settle.
T o x i c i t y L o o k -A-Likes: Pipet Problems
5
10
15
20
5
10
15
20
5
10
15
20
= 1 ug of “solids”
-- 1010
8 mLs =10 ug= 1.25 1.25
ug/mL
-- 1717
12 mLs =17 ug= 1.42 ug/m
-- 44
4 mLs =4 ug= 1.0 1.0
ug/mL

Q: Is TCMP toxic to the carbonaceous BOD reaction?
A: No scientific tests have shown any evidence of toxicity when TCMP is used properly, but the BOD Task Group recommends that all inhibited samples be seeded to reduce the possibility of interference.
Source: Jim Young, Midwest Environmental Laboratory Stakeholders Summit, Dec. 2005
Nitrification Inhibition & Toxicity
GGA CBOD with various seed volumes
0.025.050.075.0
100.0125.0150.0175.0200.0225.0250.0
4 mL 6 mL
Seed type and volume
CB
OD
mg
/L
BOD Seed
PolySeed
Min 167.5*
Max 228.5*
How else How else to explain to explain
lower lower results for results for inhibited inhibited
GGA?GGA?
WHAT DOES TOXICITY LOOK LIKE?
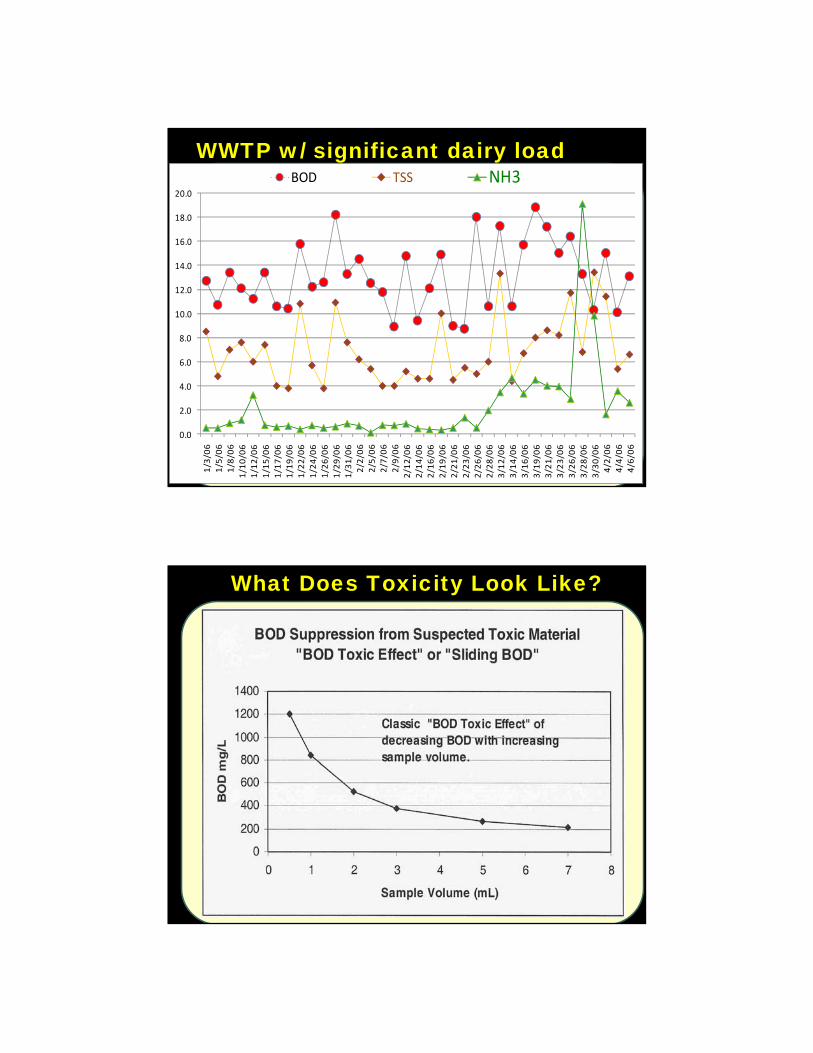
WWTP w/ significant dairy load
0.0
2.0
4.0
6.0
8.0
10.0
12.0
14.0
16.0
18.0
20.0
1/3/06
1/5/06
1/8/06
1/10/06
1/12/06
1/15/06
1/17/06
1/19/06
1/22/06
1/24/06
1/26/06
1/29/06
1/31/06
2/2/06
2/5/06
2/7/06
2/9/06
2/12/06
2/14/06
2/16/06
2/19/06
2/21/06
2/23/06
2/26/06
2/28/06
3/12/06
3/14/06
3/16/06
3/19/06
3/21/06
3/23/06
3/26/06
3/28/06
3/30/06
4/2/06
4/4/06
4/6/06
BOD TSS NH3
What Does Toxicity Look Like?

REAL toxicity data
01,000,0002,000,0003,000,0004,000,0005,000,0006,000,0007,000,0008,000,000
0.00
03
0.00
05
0.00
1
0.00
2
0.00
3
0.00
50.
010.
020.
030.
05 0.1
0.2
Proposed Runway De-Icer Candidate compound
Sample Volume (mL)
BO
D m
g/k
g
WSLH Sample # CAS # ACRP No Field # Product NameIS01777900 2163-42-0 71.12 1952952 2-METHYL-1,3-PROPANEDIOL
Dilution Volumeinitial DO
(mg/L)End DO (mg/L)
Dilution factor
BOD remark BOD mg/Kg Comment
0.0003 8.6 8.37 1000000 < 7,600,000.00 too little depletion0.0005 8.54 8.26 600000 < 4,524,000.00 too little depletion
0.001 8.58 7.27 300000 < 2,274,000.00 too little depletion0.002 8.55 0.56 150000 > 1,132,500.00 too much depletion0.003 8.61 0.04 100000 > 761,000.00 too much depletion0.005 8.59 0.06 60000 > 455,400.00 too much depletion0.01 8.51 0.06 30000 > 225,300.00 too much depletion0.02 8.57 0.07 15000 > 113,550.00 too much depletion0.03 8.56 0.1 10000 > 75,600.00 too much depletion0.05 8.67 0.05 6000 > 46,020.00 too much depletion
0.1 8.76 0.05 3000 > 23,280.00 too much depletion0.2 8.69 0.05 1500 > 11,535.00 too much depletion
Proposed Runway De-Icer Candidate compound
Using Dilutions to Eliminate Toxicity
Remember:If all is well, all dilutions for a sample should yield the same
BOD

Example of a WWTP Toxic plant upset
0
10
20
30
40
50
60
12/4/
08
12/7/
08
12/11
/08
12/14
/08
12/18
/08
12/21
/08
12/25
/08
12/28
/08
0
0.1
0.2
0.3
0.4
0.5
0.6
0.7BOD TSS BOD:TSS
Effluent TSS weekly limit failures for the first and second weeks of the month, as well as the monthly limit failure, were the result of a toxic discharge to the WWTP that upset the biological treatment system. Although no source was able to be determined, the plant was performing much better by the end of the month.
Dealing with Toxicity Part 1
SamplemLs
Initial Dilution DOI DOF
DODepletion BOD
Actual Sample
mLs
50 1 8.49 0.10 > 8.39Final DO <1.0
Too much depletion 50
100 1 8.40 2.40 6.00 18 100
200 1 8.31 5.19 3.12 5 200
Average= 11.3
Here we have is two dilutions--one with a BOD of 5 and the other with a BOD of 18. While this isn't the best precision in the world, many operators might be inclined to stop here and report the average of the two dilutions (11)
Dealing with Toxicity Part 2Ultimately, however, now is the time to at least evaluate the other data we have and see what it tells us. If we look at the dilution that over-depleted (see below) we can see that --if calculated assuming a final DO of 0.1 mg/L was acceptable--the result would be at least 50 mg/L. Now, the THREE results-5, 18, and 50 mg/L-- look much more suspicious.
Sample Volume
Initial Dilution DOI DOF
DO Depletion BOD
Actual Sample volume
50 1 8.49 0.10 8.39 50 50100 1 8.40 2.40 6.00 18 100200 1 8.31 5.19 3.12 5 200
Average= 11.3
> >
Best answer: report “>” plus the highest BOD determined (> 50)Furthermore, you MUST qualify these results as exhibiting “toxicity”
Dealing with Toxicity Part 3Sample Volume
Initial Dilution DOI DOF
DO Depletion BOD
Actual Sample volume
5 10 8.50 7.12 1.38 828 0.510 10 8.52 5.61 2.91 873 115 10 8.51 4.30 4.21 842 1.525 10 8.48 1.78 6.70 804 2.5
5 1 8.51 0.00 > 8.51 511 510 1 8.48 0.00 > 8.48 254 1030 1 8.47 0.00 > 8.47 85 3050 1 8.49 0.10 > 8.39 50 50
100 1 8.40 2.40 6.00 18 100200 1 8.31 5.19 3.12 5 200
Once again, however, we need to look at ALL the data to discern the big picture. In this table, BOD has been calculated for all dilutions, whether or not they met depletion criteria, in an effort to determine whether the plateau or Threshold Inhibition Point has been achieved.
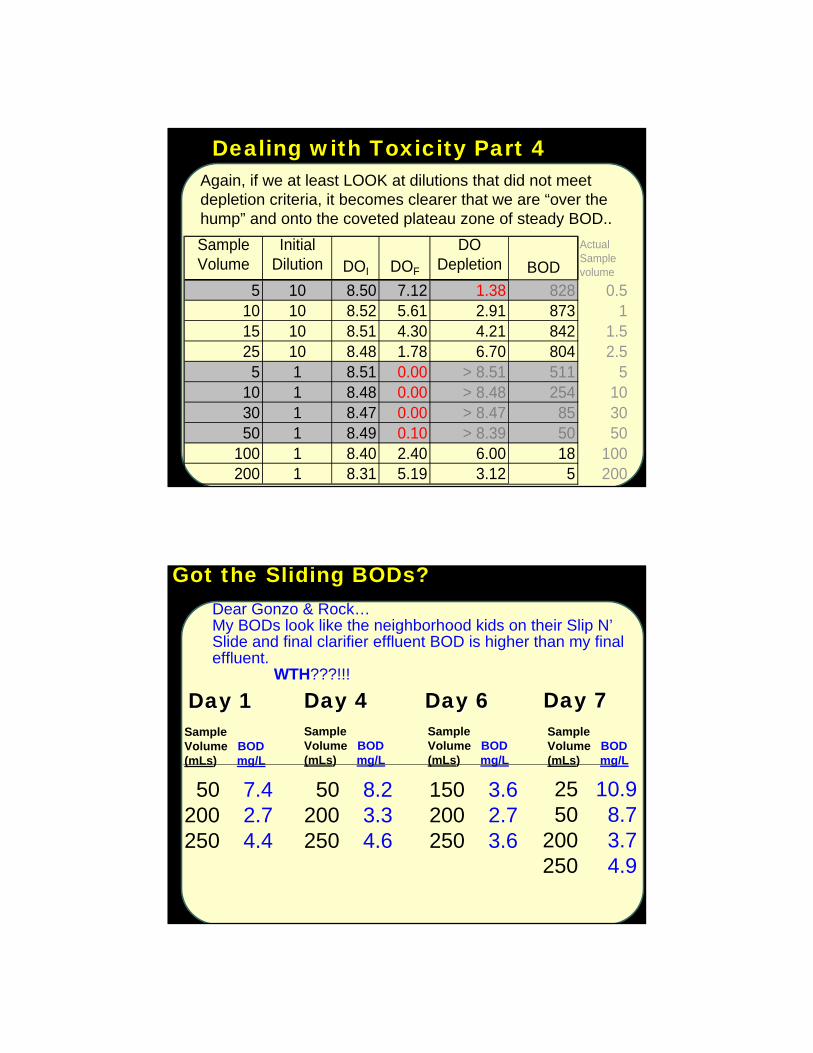
Dealing with Toxicity Part 4Again, if we at least LOOK at dilutions that did not meet depletion criteria, it becomes clearer that we are “over the hump” and onto the coveted plateau zone of steady BOD..
Sample Volume
Initial Dilution DOI DOF
DO Depletion BOD
Actual Sample volume
5 10 8.50 7.12 1.38 828 0.510 10 8.52 5.61 2.91 873 115 10 8.51 4.30 4.21 842 1.525 10 8.48 1.78 6.70 804 2.5
5 1 8.51 0.00 > 8.51 511 510 1 8.48 0.00 > 8.48 254 1030 1 8.47 0.00 > 8.47 85 3050 1 8.49 0.10 > 8.39 50 50
100 1 8.40 2.40 6.00 18 100200 1 8.31 5.19 3.12 5 200
Got the Sliding BODs?
50 7.4200 2.7250 4.4
50 8.2200 3.3250 4.6
150 3.6200 2.7250 3.6
25 10.950 8.7
200 3.7250 4.9
SampleVolume BOD(mLs) mg/L
SampleVolume BOD(mLs) mg/L
SampleVolume BOD(mLs) mg/L
SampleVolume BOD(mLs) mg/L
Day 1Day 1 Day 4Day 4 Day 6Day 6 Day 7Day 7
Dear Gonzo & Rock…My BODs look like the neighborhood kids on their Slip N’Slide and final clarifier effluent BOD is higher than my final effluent.
WTH???!!!

Help! I think I have toxicity!Let’s take a closer look at one of the data sets that seem to best suggest toxicity.
Sample VolumeInitial
D.O. mg/lFinal D.O.
mg/l Difference mg/l Multiplier
BOD5
mg/l AvgBlank 0 8.45 8.42 0.1 ***** ***** *****
Seed 20 8.47 5.21 3.46 ***** ***** *****Seed 25 8.47 4.83 4.51 ***** ***** *****STD 6 50 ******
Effluent 25 8.45 6.62 1.93 - .92 = .91 12 10.9
Effluent 50 8.45 6.08 2.37 - .92 = 1.4 6.0 8.7Effluent 200 8.46 5.05 3.41 - .92 = 2.4 1.5 3.7 5.8Effluent 250 8.47 3.48 4.99 - .92 = 4.0 1.2 4.9
Influent 6 8.4 5.74 2.66 50 133.0Influent 10 8.34 3.58 4.76 30 143.0 138Influent 15 8.29 1.46 6.93 20 137.0
Final Clar Eff 50 8.49 5.9 2.59 - .92 = 1.6 6.0 10.0Final Clar Eff 150 8.52 5.48 3.04 - .92 = 2.1 2.0 4.2 7.1
You need help…but you don’t have toxicity
SampleVolume (mLs)
DOI
mg/L
DOF
mg/L Depletion
seed correction
(6 mL)
Adjusted depletion DF
BOD5 mg/L
BOD Avg
Blank 0 8.45 8.42 0.1 ***** ***** *****
Seed 20 8.47 5.21 3.46 0.1630 DPMS ***** *****Seed 25 8.47 4.83 4.51 0.1456 DPMS ***** *****
Effluent 25 8.45 6.62 1.83 0.93 0.90 12 10.9
Effluent 50 8.45 6.08 2.37 0.93 1.44 6.0 8.7Effluent 200 8.46 5.05 3.41 0.93 2.48 1.5 3.7Effluent 250 8.47 3.48 4.99 0.93 4.06 1.2 4.9
Influent 6 8.4 5.74 2.66 0.00 2.66 50 133Influent 10 8.34 3.58 4.76 0.00 4.76 30 143 137Influent 15 8.29 1.46 6.83 0.00 6.83 20 137
Final Clar Eff 50 8.49 5.9 2.59 0.93 1.66 6.0 10Final Clar Eff 150 8.52 5.48 3.04 0.93 2.11 2.0 4.2
53
4.2
4.3
Average DPMS = 0.1543 mg/L per mL of seed6 mLs of seeded added to samples
Depletion due to seed=6 X 0.1543 mg/L = 0.93 mg/L

How did we do that!1. We fixed some errors in the
spreadsheet/benchsheet calculations.
• Slight error in seed correction• An ‘oops’ in calculated depletion• Errors in how dilutions are assessed• Errors are additive and all leads to a bad result.
2. We re-evaluated the seed in terms of “DPMS”
3. We looked at BOD of individual dilutions relative to the effective LOD for a particular dilution.
4. When all that is done, toxicity concerns disappear.
The Case of the Sliding BODs…Maybe Be wary of how you interpret data that hovers around the LOD. Remember: for a 25 mL dilution, the effective LOD for THAT ONE
dilution is 2 mg/L X 12 = 24 mg/L (consider EACH dilution). Because you have a dilution of 250 mL, you can report down to
2.4 mg/L In the Jan 13 th data look at it this way:
• 25 mL 12x BOD =10.9...but LOD is 24• 50 mL 6.0x BOD= 8.7...but LOD is 12• 150 mL 1.5x BOD=3.7...and LOD is 3.0...so this is a detect• 250 mL 1.2x BOD=4.9...and LOD is 2.4...so this is a detect• So report the average of (3.7,4.9) or 4.3...with LOD of 2.4
Now...neither of those values is above the LOQ...right? “LOQ” would be about 6-10 So the results of the dilutions fall in that "gray" area where
quantitation is much less accurate/reliable. Therefore...you cant make any real/valid statement about toxicity
because 2 of the 4 results are below the LOD The other 2 resultsare below the LOQ.
For toxicity, we're usually dealing with samples well over the LOQ
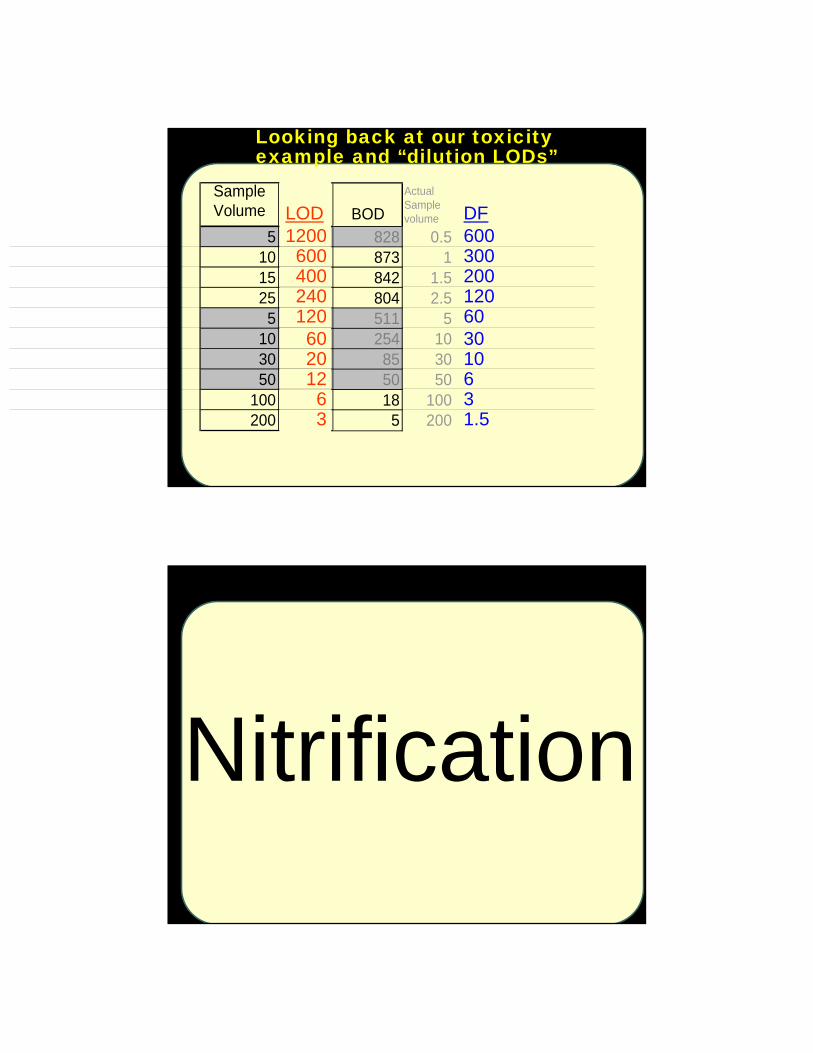
Looking back at our toxicity example and “dilution LODs”
Sample Volume
5101525
5103050
100200
BOD
Actual Sample volume
828 0.5873 1842 1.5804 2.5511 5254 10
85 3050 5018 100
5 200
LOD1200
60040024012060201263
DF600300200120603010631.5
Nitrification
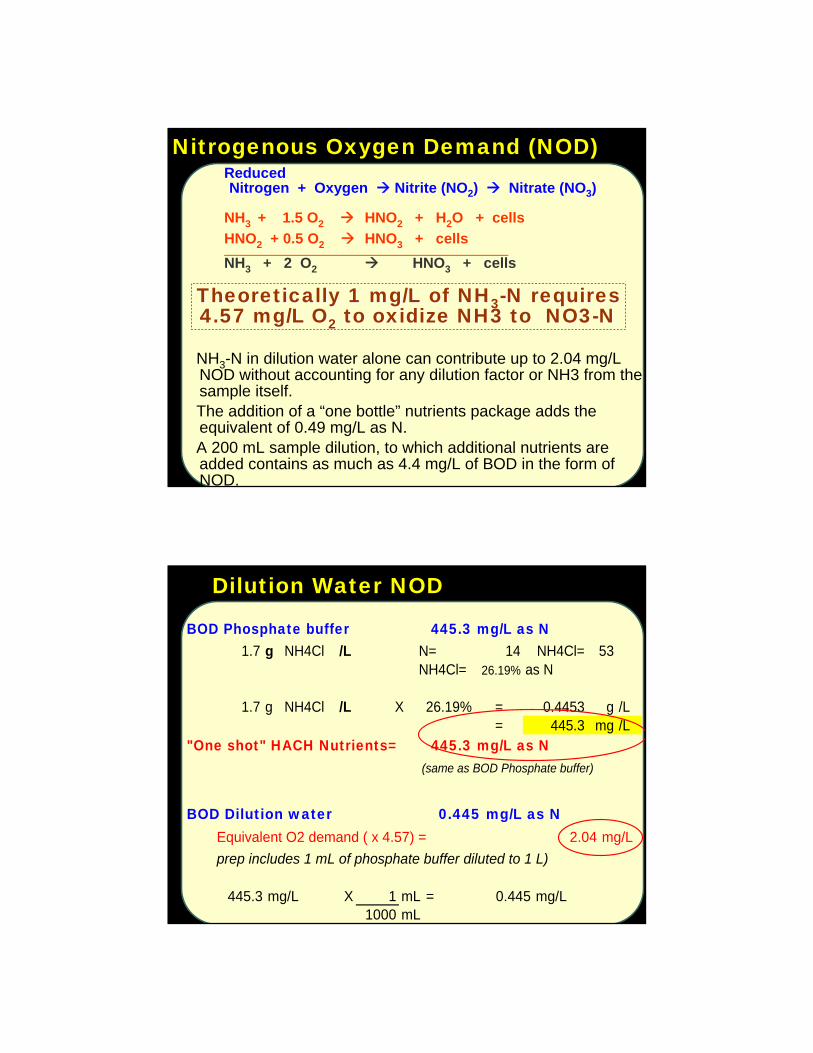
NH3-N in dilution water alone can contribute up to 2.04 mg/L NOD without accounting for any dilution factor or NH3 from the sample itself.The addition of a “one bottle” nutrients package adds the equivalent of 0.49 mg/L as N. A 200 mL sample dilution, to which additional nutrients are added contains as much as 4.4 mg/L of BOD in the form of NOD.
Nitrogenous Oxygen Demand (NOD)
Theoretically 1 mg/L of NHTheoretically 1 mg/L of NH33--N requires N requires 4.57 mg/L O4.57 mg/L O22 to oxidizeto oxidize NH3 to NO3NH3 to NO3--NN
Reduced Reduced Nitrogen + Oxygen Nitrogen + Oxygen Nitrite (NONitrite (NO22) ) Nitrate (NONitrate (NO33))
NH3 + 1.5 O2 HNO2 + H2O + cells
HNO2 + 0.5 O2 HNO3 + cells
NH3 + 2 O2 HNO3 + cells
Dilution Water NOD
BOD Dilution water 0.445 mg/L as NEquivalent O2 demand ( x 4.57) = 2.04 mg/L
prep includes 1 mL of phosphate buffer diluted to 1 L)
445.3 mg/L X 1 mL = 0.445 mg/L1000 mL
BOD Phosphate buffer 445.3 mg/L as N1.7 g NH4Cl /L N= 14 NH4Cl= 53
NH4Cl= 26.19% as N
1.7 g NH4Cl /L X 26.19% = 0.4453 g /L= 445.3 mg /L
"One shot" HACH Nutrients= 445.3 mg/L as N (same as BOD Phosphate buffer)
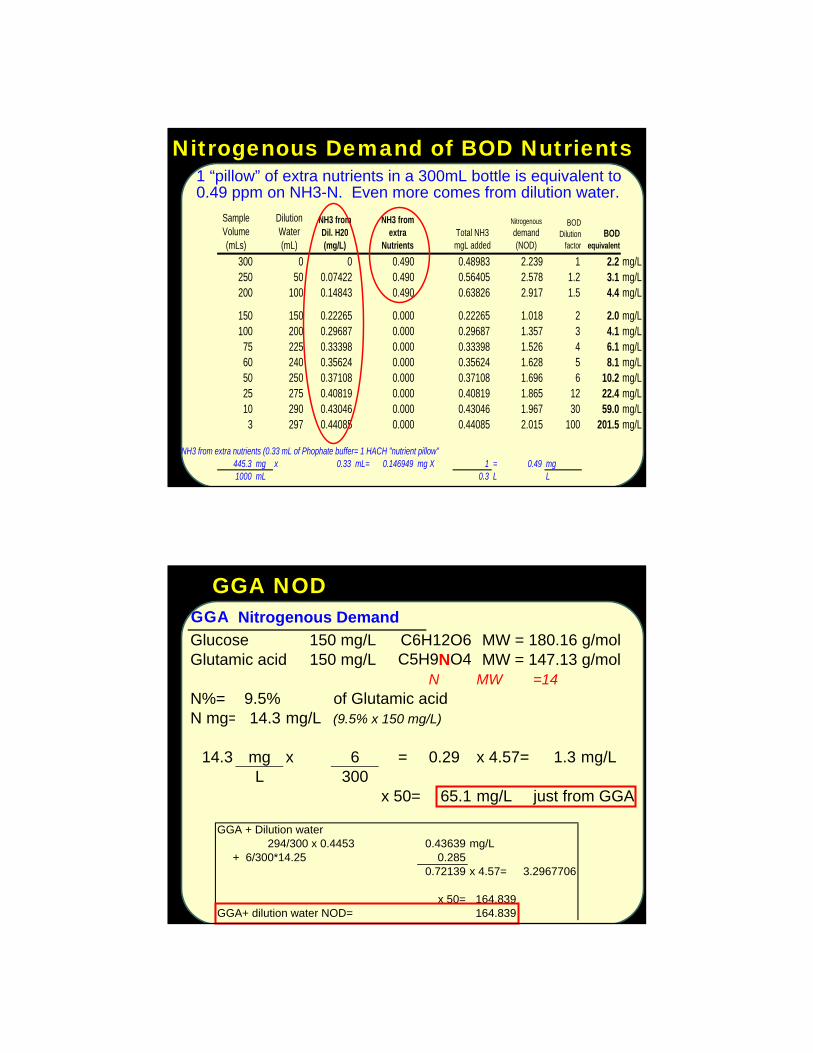
Nitrogenous Demand of BOD Nutrients
Sample Volume (mLs)
Dilution Water (mL)
NH3 from Dil. H20 (mg/L)
NH3 from extra
NutrientsTotal NH3 mgL added
Nitrogenous
demand (NOD)
BOD Dilution
factorBOD
equivalent
300 0 0 0.490 0.48983 2.239 1 2.2 mg/L250 50 0.07422 0.490 0.56405 2.578 1.2 3.1 mg/L200 100 0.14843 0.490 0.63826 2.917 1.5 4.4 mg/L
150 150 0.22265 0.000 0.22265 1.018 2 2.0 mg/L100 200 0.29687 0.000 0.29687 1.357 3 4.1 mg/L
75 225 0.33398 0.000 0.33398 1.526 4 6.1 mg/L60 240 0.35624 0.000 0.35624 1.628 5 8.1 mg/L50 250 0.37108 0.000 0.37108 1.696 6 10.2 mg/L25 275 0.40819 0.000 0.40819 1.865 12 22.4 mg/L10 290 0.43046 0.000 0.43046 1.967 30 59.0 mg/L3 297 0.44085 0.000 0.44085 2.015 100 201.5 mg/L
NH3 from extra nutrients (0.33 mL of Phophate buffer= 1 HACH "nutrient pillow"445.3 mg x 0.33 mL= 0.146949 mg X 1 = 0.49 mg1000 mL 0.3 L L
1 “pillow” of extra nutrients in a 300mL bottle is equivalent to 0.49 ppm on NH3-N. Even more comes from dilution water.
GGA NODGGA Nitrogenous Demand
Glucose 150 mg/L C6H12O6 MW = 180.16 g/molGlutamic acid 150 mg/L C5H9NO4 MW = 147.13 g/mol
N MW =14N%= 9.5% of Glutamic acidN mg= 14.3 mg/L (9.5% x 150 mg/L)
14.3 mg x 6 = 0.29 x 4.57= 1.3 mg/LL 300
x 50= 65.1 mg/L just from GGA
GGA + Dilution water294/300 x 0.4453 0.43639 mg/L
+ 6/300*14.25 0.2850.72139 x 4.57= 3.2967706
x 50= 164.839GGA+ dilution water NOD= 164.839
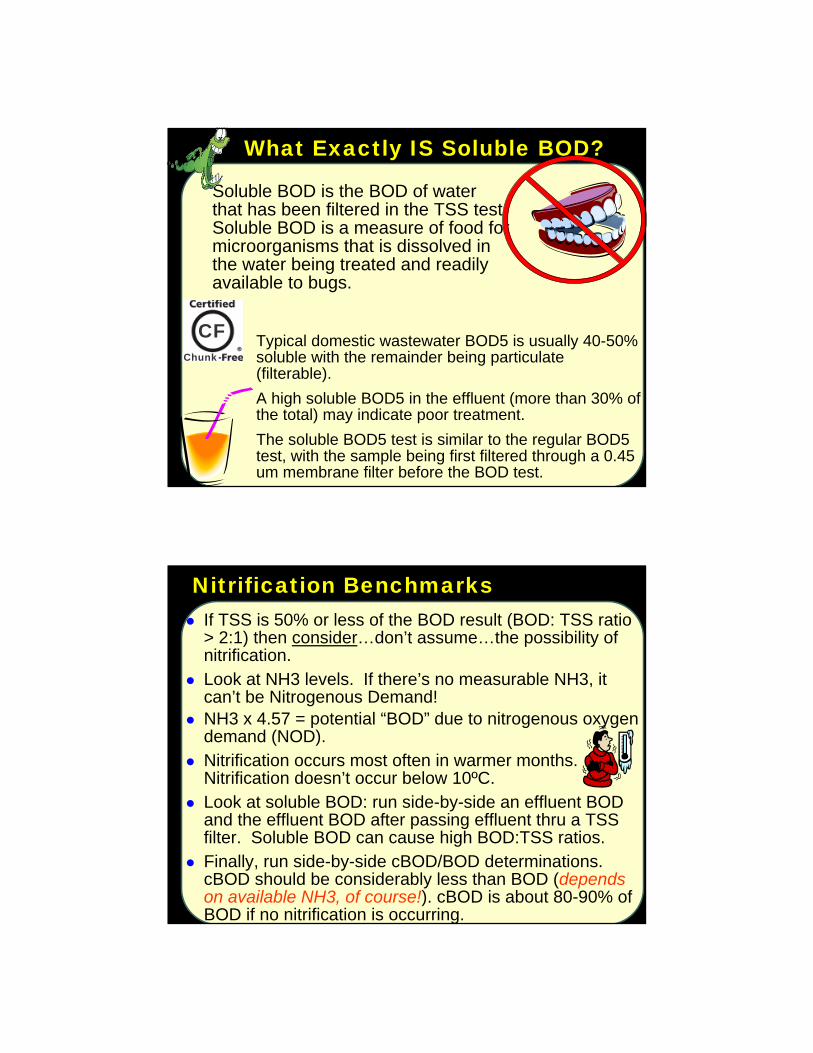
What Exactly IS Soluble BOD?
Soluble BOD is the BOD of water that has been filtered in the TSS test. Soluble BOD is a measure of food for microorganisms that is dissolved in the water being treated and readily available to bugs.
Typical domestic wastewater BOD5 is usually 40-50% soluble with the remainder being particulate (filterable).
A high soluble BOD5 in the effluent (more than 30% of the total) may indicate poor treatment.
The soluble BOD5 test is similar to the regular BOD5 test, with the sample being first filtered through a 0.45 um membrane filter before the BOD test.
CFChunk
Nitrification Benchmarks If TSS is 50% or less of the BOD result (BOD: TSS ratio
> 2:1) then consider…don’t assume…the possibility of nitrification.
Look at NH3 levels. If there’s no measurable NH3, it can’t be Nitrogenous Demand!
NH3 x 4.57 = potential “BOD” due to nitrogenous oxygen demand (NOD).
Nitrification occurs most often in warmer months. Nitrification doesn’t occur below 10ºC.
Look at soluble BOD: run side-by-side an effluent BOD and the effluent BOD after passing effluent thru a TSS filter. Soluble BOD can cause high BOD:TSS ratios.
Finally, run side-by-side cBOD/BOD determinations. cBOD should be considerably less than BOD (depends on available NH3, of course!). cBOD is about 80-90% of BOD if no nitrification is occurring.

Nitrification: 4 Legged Stool
BODNH3
TSS BODNH3
TSScBOD
Sure, a 3Sure, a 3--legged stool is sturdy enough, but a 4legged stool is sturdy enough, but a 4--legged stool is better!legged stool is better!
BOD, TSS and NH3 data will generally be enough to identify nitrification, but the clincher is having paired BOD:cBOD data in addition.
NO3NO3
Nitrification & Other Parameters
Ammonia N (NH3-N) – [Inf and eff] - If substantial nitrification is taking place you would see a significant decrease.
Nitrite(NO2) – [Eff] -generally <0.5 mg/L, anything greater would be considered high.
Nitrate (NO3) – [Eff] - Expect around zero if there is no nitrification taking place. If nitrification is occurring, expect nitrates anywhere from 3-15 mg/L or greater depending on NH3 levels.
Alkalinity (measured as CaCO3) [Inf and Eff] -Expect a significant decrease if nitrification is taking place. Effluent concentrations <50 mg/L indicates potential for pH problems.

Lower Isn’t Enough
Addition of cBOD nitrification inhibitor reagent will ALWAYSlower BOD.
Just having a cBOD that is less than BOD is not enough to make a claim that nitrification is occurring
Hello!…McFly!McFly! It’s a toxin!
It’s the EXTENT of the reduction (BOD:cBOD ratio) that tells the tale.
The Inhibitor DOES have an effectAdding inhibitor to a BOD bottle is like taking antibiotics….which is… you know…like the…
TCMP = =
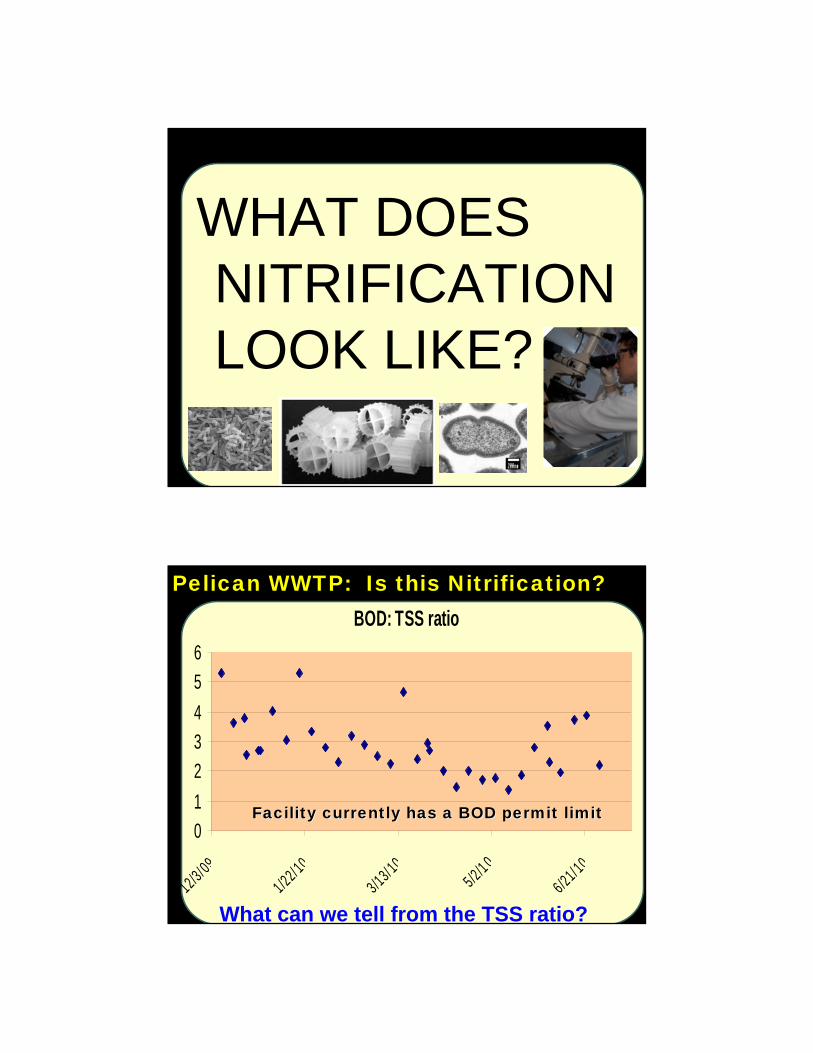
WHAT DOES NITRIFICATION LOOK LIKE?
Pelican WWTP: Is this Nitrification?BOD: TSS ratio
0
1
2
3
4
5
6
12/3/ 09
1/22/10
3/13/ 105/2/1 0
6/21/ 10
What can we tell from the TSS ratio?
Facility currently has a BOD permit limitFacility currently has a BOD permit limit

Pelican WWTP: Is this Nitrification?BOD vs. cBOD
01234567
0 2 4 6 8 10 12 14
mg
/LBOD cBOD
Does the BOD: cBOD ratio shed any light?
Facility currently has a BOD permit limitFacility currently has a BOD permit limit
We have some limited paired BOd-cBOD data
Pelican WWTP: Is this Nitrification?
0
2
4
6
8
10
12
14
16
12/01/2009 12/21/2009 12/29/2009 01/19/2010 02/09/2010 03/02/2010 03/23/2010 04/06/2010 04/27/2010 05/18/2010 06/02/2010 06/22/20100
0.02
0.04
0.06
0.08
0.1
0.12
0.14BOD TSS NH3
Complete picture. Candidate for cBOD limit?
BO
D &
TS
S m
g/L
NH
3 mg
/L
Facility currently has a BOD permit limitFacility currently has a BOD permit limit

Be Careful What You Wish For… Remember that if you switch from BOD to cBOD, your
permit limits do NOT stay the same. cBOD permit limits are lower than BOD limits. Some facilities get year-round reductions, others just
get reduced limits during warmer months (May –October).
Examples of real limits: BOD monthly avg.10 mg/L Nov-Apr; 6.8 mg/L May-Oct BOD monthly avg.10 mg/L Nov-Apr; 5 mg/L May-Oct
TSS 10 mg/L year-round cBOD rear-round 25 mg/L monthly; 40 mg/L avg
weekly (BOD would be 30/45)• TSS 30/45
Pelican WWTP: Is this Nitriification?
If the average NH3 level is about 0.03 ppm, that only explains about 2.4 ppm of “BOD”.
The difference between BOD and cBOD is less than the Nitrogenous demand of dilution water and sample NH3
NH3 levels increase on several occasions and BOD actually drops.
Sample contains some NH3 0.03 mg/L
Sample Volume (mLs)
Dilution Water (mL)
NH3 from DilH20 (mg/L)
NH3 from extra Nutrients
NH3 from
sampleTotal NH3 mgL added
Nitrogenous
demand (NOD) DF
BOD equivalent
300 0 0 0.490 0.030 0.51983 2.375623 1 2.4 mg/L150 150 0.22265 0.000 0.015 0.23765 1.086061 2 2.2 mg/L100 200 0.296867 0.000 0.010 0.3068667 1.402381 3 4.2 mg/L

Pine Stump WWTP Nitrification (Cold)
0
2
4
6
8
10
12
14
02/01
/199
9
02/03
/199
9
02/05
/199
9
02/07
/199
9
02/10
/199
9
02/12
/199
9
02/14
/199
9
02/17
/199
9
02/19
/199
9
02/21
/199
9
02/24
/199
9
02/26
/199
9
02/28
/199
9
0
1
2
3
4
5
6
7
8
BOD cBOD NH3 NO3 5d increase
0
2
4
6
8
10
12
14
0
1
2
3
4
5
6
7
8
BODcBOD
NH3NO3
Facility currently has a cBOD permit limitFacility currently has a cBOD permit limit
Facility had a cBOD permit limit until 2004Facility had a cBOD permit limit until 2004
Pine Stump WWTP Nitrification (Warm)
0
2
4
6
8
10
12
14
7/1/
99
7/3/
99
7/5/
99
7/7/
99
7/9/
99
7/11
/99
7/13
/99
7/15
/99
7/17
/99
7/19
/99
7/21
/99
7/23
/99
7/25
/99
7/27
/99
7/29
/99
7/31
/99
-2
-1
0
1
2
3
4
5
6
7
8BOD cBOD NH3 NO3 5d increase
0
2
4
6
8
10
12
14
7/1/
99
-2
-1
0
1
2
3
4
5
6
7
8
BODcBOD
NH3NO3
Facility had a cBOD permit limit until 2004
Facility currently has a cBOD permit limitFacility currently has a cBOD permit limit
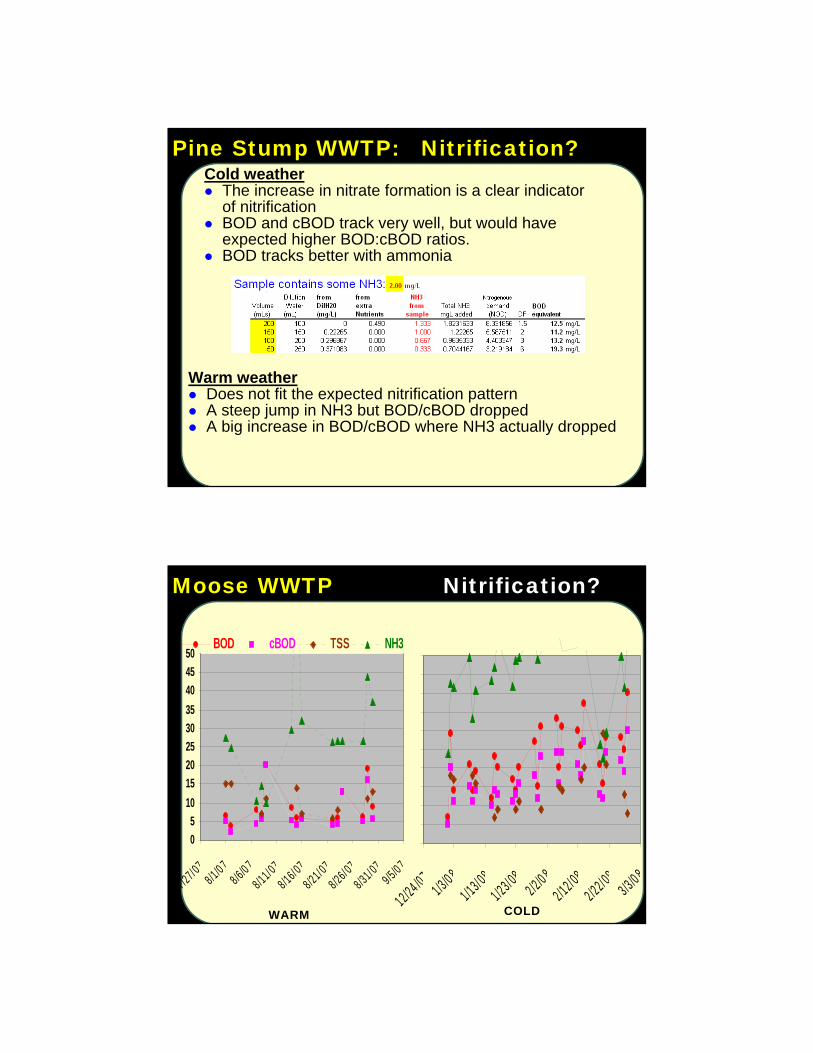
Pine Stump WWTP: Nitrification?Cold weather The increase in nitrate formation is a clear indicator
of nitrification BOD and cBOD track very well, but would have
expected higher BOD:cBOD ratios. BOD tracks better with ammonia
Warm weather Does not fit the expected nitrification pattern A steep jump in NH3 but BOD/cBOD dropped A big increase in BOD/cBOD where NH3 actually dropped
05
101520253035404550
12/24 /071/3/0 8
1/13/ 08
1/23/ 082/2/0 8
2/12/ 08
2/22/ 083/3 /0 8
Moose WWTP Nitrification?
0
5
10
15
20
25
30
35
40
45
50
7/27/ 078/1/0 7
8/6/0 7
8/11/ 07
8/16/ 07
8/21/ 07
8/26/ 07
8/31/ 079/5/0 7
BOD cBOD TSS NH3
WARM COLD

Moose WWTP - BOD: TSS ratios
0
1
2
3
4
5
6
1/2/0
8
1/9/0
8
1/16/
08
1/23/
08
1/30/
08
2/6/0
8
2/13/
08
2/20/
08
2/27/
08
0
1
2
3
4
5
6
Despite very high NH3 levels, BOD: TSS ratios only rarely exceed 2:1
Moose WWTP - BOD:cBOD ratios vs. NH3
0102030405060708090
8/1 /078 /9 /07
8 /15/07
8 /22/07
8 /29/07
1 /2 /08
1 /10/08
1 /16/08
1 /24/08
2 /7 /08
2 /13/08
2 /21/08
2 /27/08
0.00
0.50
1.00
1.50
2.00
NH3 BOD:cBOD ratio

0
5
10
15
20
25
30
35
40
Very small plant had cBOD; now does not
0
5
10
15
20
25
30
35
40 BOD TSS NH3
Mar-Jul 2008 Mar-Jul 2010
Very small plant; had cBOD; now does not
0
5
10
15
20
3 /5 /02
3 /12/02
3 /19/02
3 /26/024 /2 /02
4 /9 /02
4 /16/02
4 /23/02
4 /30/02
6 /6 /02
6 /13/02
6 /20/02
6 /27/02
0100200300400500600700cBOD TSS Chloride

“Hoover” WWTP Nitrification (BOD & cBOD)
0.0
10.0
20.0
30.0
40.0
50.0
60.0
70.0
7/30
/97
8/6/9
7
8/13
/97
8/20
/97
8/27
/97
9/3/9
7
9/10
/97
9/17
/97
9/24
/97
BOD cBODm
g/L
mg/
L
“Hoover” WWTP Nitrification (+ TSS & NH3)
0.0
10.0
20.0
30.0
40.0
50.0
60.0
70.0
7/30
/97
8/6/9
7
8/13
/97
8/20
/97
8/27
/97
9/3/9
7
9/10
/97
9/17
/97
9/24
/97
BOD cBOD TSS NH3
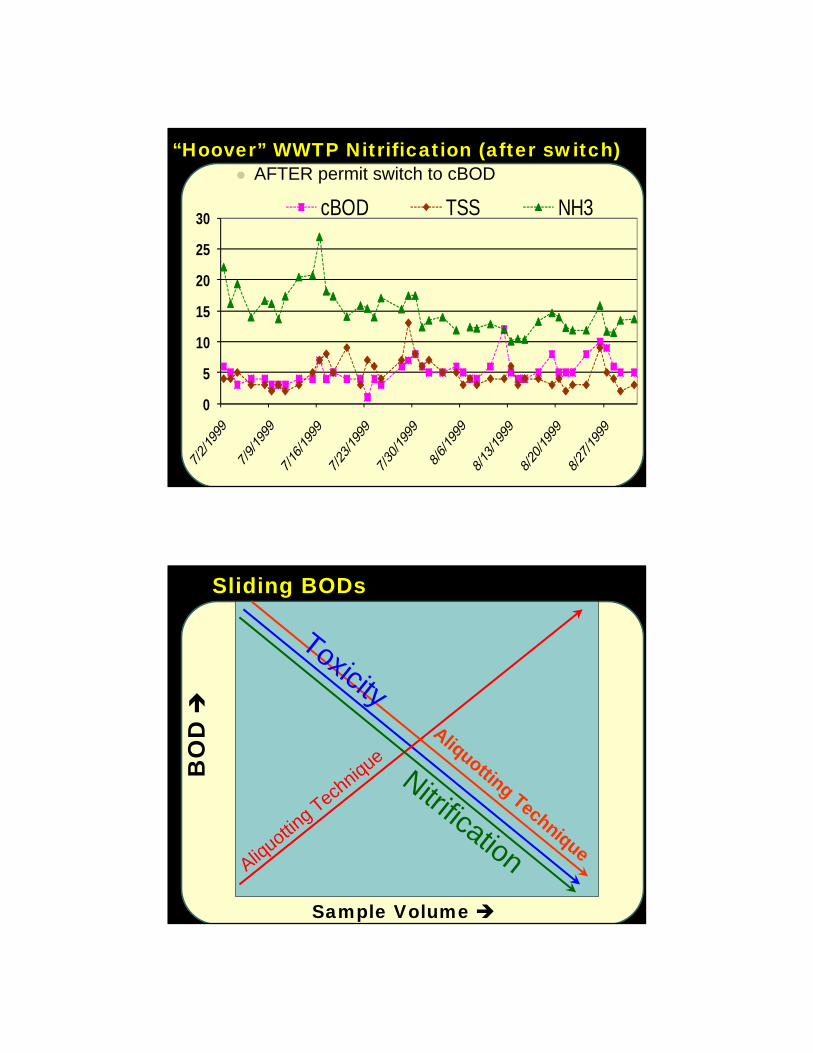
“Hoover” WWTP Nitrification (after switch) AFTER permit switch to cBOD
0
5
10
15
20
25
30cBOD TSS NH3
Sliding BODs
Sample Volume
BO
D
Aliquottin
g Tech
niqueNitrification
Aliquotting Technique
Toxicity

Q & A


![Assessment of surface water pollution in urban and ...€¦ · BOD COD DONO PO OPI BOD COD NO PO DO w here OPI is the organic pollution index , and BOD i, COD i, [NO 3] i, [PO 4]](https://img.pdfslide.us/doc/110x75/5f0587ae7e708231d4136b3e/assessment-of-surface-water-pollution-in-urban-and-bod-cod-dono-po-opi-bod-cod.jpg)