Embed Size (px)
Citation preview

REMOVAL EFFICIENCY AND KINETIC STUDY OF BOD AND COD
USING AEROBIC AND ANAEROBIC DIGESTION
LEE CHERN NAM
A project report submitted in partial fulfilment of the
requirements for the award of the degree of
Bachelor (Hons.) of Chemical Engineering
Faculty of Engineering and Science
Universiti Tunku Abdul Rahman
April 2011
ii
DECLARATION
I hereby declare that this project report is based on my original work except for
citations and quotations which have been duly acknowledged. I also declare that it
has not been previously and concurrently submitted for any other degree or award at
UTAR or other institutions.
Signature : _________________________
Name : _________________________
ID No. : _________________________
Date : _________________________
iii
APPROVAL FOR SUBMISSION
I certify that this project report entitled “REMOVAL EFFICIENCY AND
KINETIC STUDY OF BOD AND COD USING AEROBIC AND ANAEROBIC
DIGESTION” was prepared by LEE CHERN NAM has met the required standard
for submission in partial fulfilment of the requirements for the award of Bachelor of
Engineering (HONS) Chemical Engineering at Universiti Tunku Abdul Rahman.
Approved by,
Signature : _________________________
Supervisor : Dr. Lai Soon Onn
Date : _________________________
iv
The copyright of this report belongs to the author under the terms of the
copyright Act 1987 as qualified by Intellectual Property Policy of University Tunku
Abdul Rahman. Due acknowledgement shall always be made of the use of any
material contained in, or derived from, this report.
© 2010, Lee Chern Nam. All right reserved.
v
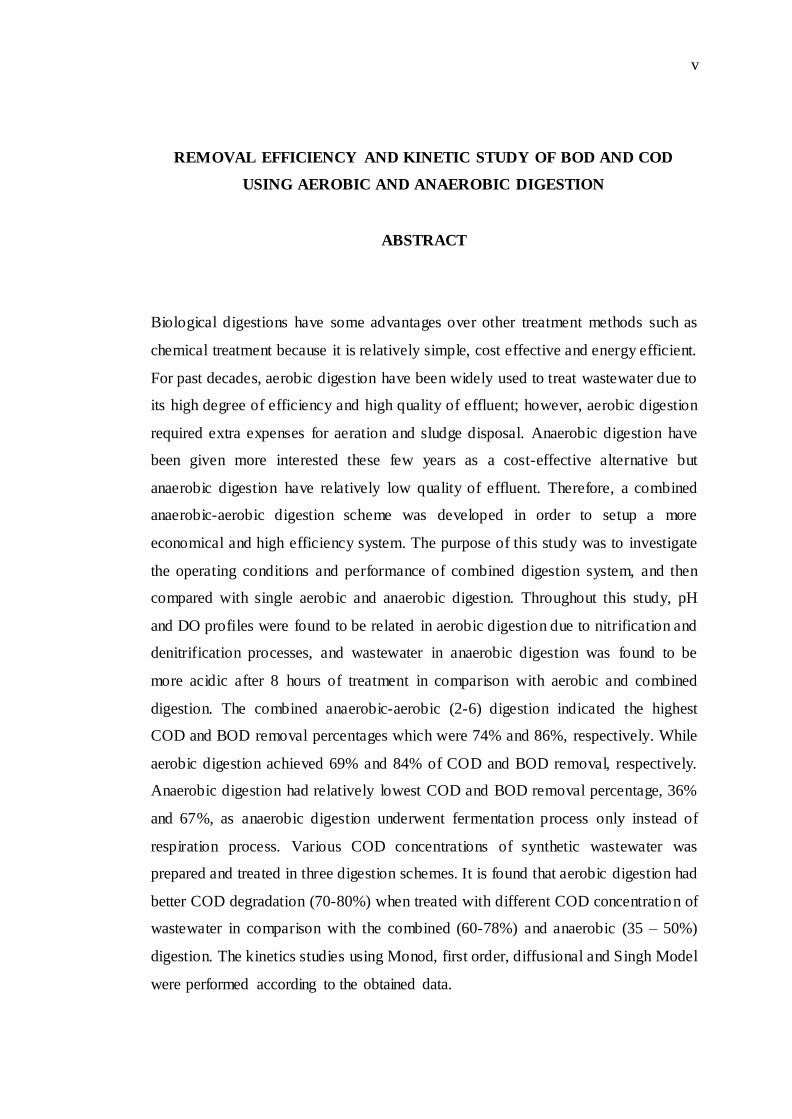
REMOVAL EFFICIENCY AND KINETIC STUDY OF BOD AND COD
USING AEROBIC AND ANAEROBIC DIGESTION
ABSTRACT
Biological digestions have some advantages over other treatment methods such as
chemical treatment because it is relatively simple, cost effective and energy efficient.
For past decades, aerobic digestion have been widely used to treat wastewater due to
its high degree of efficiency and high quality of effluent; however, aerobic digestion
required extra expenses for aeration and sludge disposal. Anaerobic digestion have
been given more interested these few years as a cost-effective alternative but
anaerobic digestion have relatively low quality of effluent. Therefore, a combined
anaerobic-aerobic digestion scheme was developed in order to setup a more
economical and high efficiency system. The purpose of this study was to investigate
the operating conditions and performance of combined digestion system, and then
compared with single aerobic and anaerobic digestion. Throughout this study, pH
and DO profiles were found to be related in aerobic digestion due to nitrification and
denitrification processes, and wastewater in anaerobic digestion was found to be
more acidic after 8 hours of treatment in comparison with aerobic and combined
digestion. The combined anaerobic-aerobic (2-6) digestion indicated the highest
COD and BOD removal percentages which were 74% and 86%, respectively. While
aerobic digestion achieved 69% and 84% of COD and BOD removal, respectively.
Anaerobic digestion had relatively lowest COD and BOD removal percentage, 36%
and 67%, as anaerobic digestion underwent fermentation process only instead of
respiration process. Various COD concentrations of synthetic wastewater was
prepared and treated in three digestion schemes. It is found that aerobic digestion had
better COD degradation (70-80%) when treated with different COD concentration of
wastewater in comparison with the combined (60-78%) and anaerobic (35 – 50%)
digestion. The kinetics studies using Monod, first order, diffusional and Singh Model
were performed according to the obtained data.

vi
TABLE OF CONTENTS
DECLARATION ii
APPROVAL FOR SUBMISSION iii
ABSTRACT v
TABLE OF CONTENTS vi
LIST OF TABLES ix
LIST OF FIGURES x
LIST OF SYMBOLS / ABBREVIATIONS xii
LIST OF APPENDICES xiv
CHAPTER
1 INTRODUCTION 1
1.1 Background 1
1.2 Problem Statement 2
1.3 Objectives 3
1.4 Scope of Study 3
1.5 Hypotheses 4
2 LITERATURE REVIEW 5
2.1 Background 5
2.2 Biological Digestion 6
2.2.1 Aerobic Digestion 6
2.2.2 Anaerobic Digestion 8
2.3 Aerobic versus Anaerobic Digestion 10
2.4 Combined Anaerobic-Aerobic Digestion 12
2.4.1 Type of Combination 13
2.5 Case Study 18

vii
2.5.1 Paper Mill Wastewater Treatment (References:
Lerner et al., 2007) 18
2.5.2 Grey Wastewater Treatment (References: Zeeman,
2009) 19
3 METHODOLOGY 21
3.1 Experimental Setup and Procedure 21
3.1.1 Wastewater and microbial culture 21
3.1.2 Safety and Precautions 22
3.1.3 Experiment A: Batch Aerobic Digestion 22
3.1.4 Experiment B: Anaerobic Digestion 23
3.1.5 Experiment C: Anaerobic-aerobic Digestion 24
3.2 Analysis Setup and Procedure 25
3.2.1 Biochemical Oxygen Demand (BOD) Test 25
3.2.2 Chemical Oxygen Demand (COD) Test 26
3.3 Kinetics Model Formulation 27
3.3.1 Monod Model 27
3.3.2 First Order Model 28
3.3.3 Diffusional Model 28
3.3.4 Singh Model 29
4 RESULTS AND DISCUSSION 30
4.1 Comparison of pH and DO in Three Systems 30
4.2 Reduction of COD and BOD in Three Systems 32
4.3 Effect of Initial COD Concentrations in Three Systems 37
4.4 Kinetics Studies 39
4.4.1 Monod Model 39
4.4.2 First Order Model 40
4.4.3 Diffusional Model 42
4.4.4 Singh Model 43

viii
5 CONCLUSIONS AND RECOMMENDATIONS 45
5.1 Conclusions 45
5.2 Recommendations and Future Studies 46
REFERENCES 48
APPENDICES 54

ix
LIST OF TABLES
TABLE TITLE PAGE
2.1 Comparison Between Aerobic and Anaerobic Digestions (References: Yeoh, 1995 ; Leslie, 1999 ; Eckenfelder Et Al.) 10
2.2 Wastewater Treatment Plant Main Expenses 19
2.3 Performance of Biological Treatment in Grey Wastewater 20
3.1 Composition of Synthetic Wastewater (Reference: Kocadagistan Et Al, 2005) 21
4.1 COD Removal Rate and Efficiency for Three Systems 34
4.2 Characteristics of Grey Water (Reference: Leal, 2010) 35
4.3 COD Removal (%) for Different Initial
Concentration In Three Systems 38
4.4 Kinetic Parameters for The Monod Model in Three Systems 40
4.5 Kinetic Parameters for The First Order Model in Three Systems 41
4.6 Kinetic Parameters for The Diffusional Model in Three Systems 42
4.7 Kinetic Parameters for The Singh Model in Three Systems 44

x
LIST OF FIGURES
FIGURE TITLE PAGE
2.1 The Path of Aerobic Digestion 8
2.2 Pictures of Different Bacteria in Anaerobic Digestion (Reference: Alexander And Diamantis, 2005) 9
2.3 Schematic of Reaction in Anaerobic Digestion (Reference: Salsabil, 2008) 9
2.4 Type of Combine Anaerobic-Aerobic System (Adapted From Chan Et Al., 2009) 14
2.5 Aerated Lagoons 15
2.6 Schematic Diagram of UASB Reactor (Reference: Sperling, 2005) 15
2.7 Schematic Diagram of AFB Reactor (Reference: Sperling, 2005) 16
2.8 Schematic Diagram for Anaerobic-Aerobic FFBs (Pozo & Diez, 2005) 16
2.9 Bubble Column with Draught Tube (Reference: Hano Et Al., 2005) 17
2.10 UA/AFB Integrated Reactor (Reference: Moosavi
Et Al., 2004) 17
2.11 COD and BOD Removal in Aerobic And Combine Treatment 18
2.12 Apparatus Setup in Grey Wastewater Treatment 19
3.1 LS-26101 Aerobic Digester 23
3.2 LS-26102 Anaerobic Digester 24
3.3 Anaerobic-Aerobic Process Scheme 25

xi
4.1 Ph And DO Profiles for Three Systems 30
4.2 COD Concentration of Synthetic Wastewater for Three Systems 33
4.3 BOD5 Concentration of Synthetic Wastewater for Three Systems 36
4.4 Effect of Initial COD Concentration In (a) Aerobic Digestion, (b) Anaerobic Digestion, (c) 2-6 Combined Digestion 38
4.5 Monod Model in (a) Aerobic Digestion, (b) Anaerobic Digestion, (c) 2-6 Combined Digestion 39
4.6 First Order Model in (a) Aerobic Digestion, (b) Anaerobic Digestion, (c) 2-6 Combined Digestion 41
4.7 Diffusional Model in (a) Aerobic Digestion, (b) Anaerobic Digestion, (c) 2-6 Combined Digestion 42
4.8 Singh Model in (a) Aerobic Digestion, (b) Anaerobic Digestion, (c) 2-6 Combined Digestion 44
xii
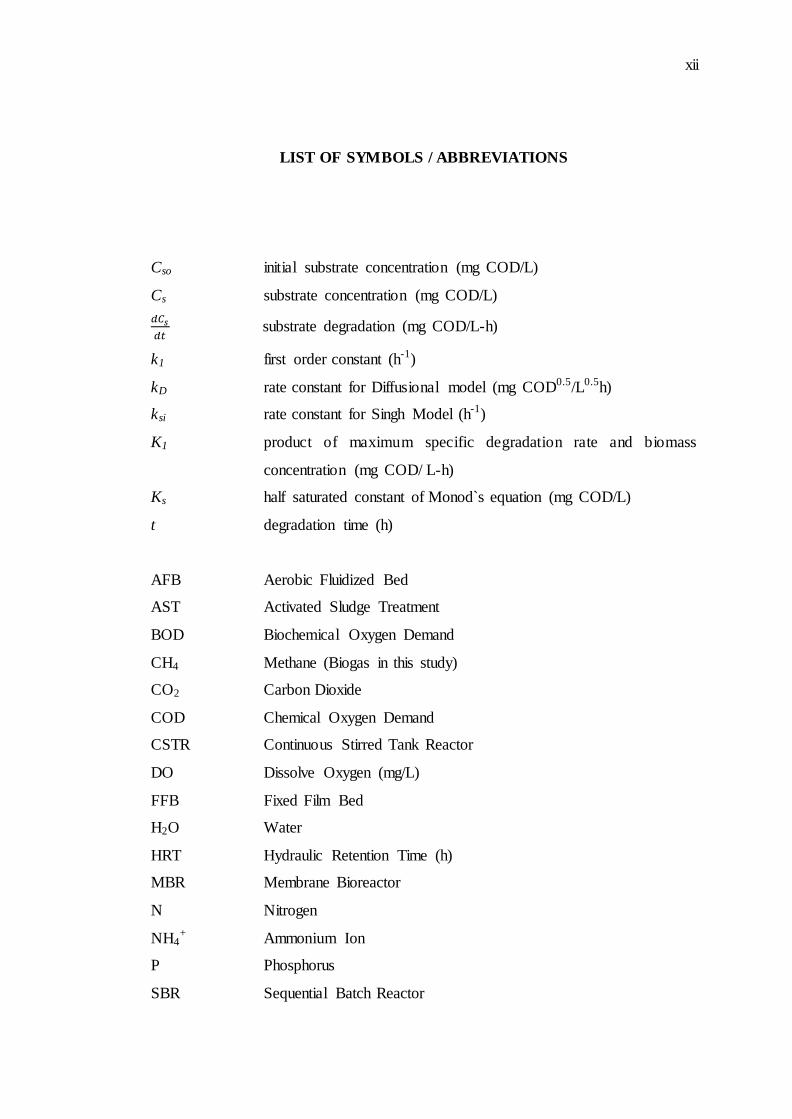
LIST OF SYMBOLS / ABBREVIATIONS
Cso initial substrate concentration (mg COD/L)
Cs substrate concentration (mg COD/L)
substrate degradation (mg COD/L-h)
k1 first order constant (h-1)
kD rate constant for Diffusional model (mg COD0.5/L0.5h)
ksi rate constant for Singh Model (h-1)
K1 product of maximum specific degradation rate and biomass
concentration (mg COD/ L-h)
Ks half saturated constant of Monod`s equation (mg COD/L)
t degradation time (h)
AFB Aerobic Fluidized Bed
AST Activated Sludge Treatment
BOD Biochemical Oxygen Demand
CH4 Methane (Biogas in this study)
CO2 Carbon Dioxide
COD Chemical Oxygen Demand
CSTR Continuous Stirred Tank Reactor
DO Dissolve Oxygen (mg/L)
FFB Fixed Film Bed
H2O Water
HRT Hydraulic Retention Time (h)
MBR Membrane Bioreactor
N Nitrogen
NH4+ Ammonium Ion
P Phosphorus
SBR Sequential Batch Reactor

xiii
TSS Total Suspended Solids
UASB Upflow Anaerobic Sludge Bed
VFA Volatile Fatty Acids
VSS Volatile Suspended Solids

xiv
LIST OF APPENDICES
APPENDIX TITLE PAGE
A MSDS Sheet 54
B Sample Calculations 56
C Results of Grey Wastewater Treatment (Reference: Leal, 2010) 58
D Review on Anaerobic-aerobic Digestion using High Rate Reactor (Reference: Chan et al., 2009) 59
E Setup of This Study 60

CHAPTER 1
1 INTRODUCTION
1.1 Background
This study is related to reduction of Biological Oxygen Demand (BOD) and
Chemical Oxygen Demand (COD) in aerobic, anaerobic and combined anaerobic-
aerobic digestion of wastewater treatment.
Aerobic digestion of waste is the natural biological degradation and
purification process in an oxygen-rich environment, whereas anaerobic digestion is
accomplished without oxygen in a closed system. Aerobic digestion technologies
have been widely applied in organics wastewater treatment due to high degree of
efficiency and high quality of effluent (Yeoh, 1995). Aerobic digestion system can
achieve higher removal of biodegradable organics matters if compared to anaerobic
digestion system, and the produced biomass is well flocculated and resulting lower
effluent suspended solids (Cakir and Stenstrom, 2005). Interest in anaerobic for
wastewater treatment has greatly increased mainly due to resource recovery and
utilization, while still achieving pollution control (Seghezzo et al., 1998). In
comparison with aerobic digestion, anaerobic is a cost effective system (Lettinga,
1995) due to low sludge production, low energy consumption due to unnecessary
transfer of large quantities of air or oxygen and significant conversion of organics
matters to methane gas which is useful for combustible gas.
Generally, anaerobic-aerobic systems that operate separately in sequential
process complement each other. Chan et al. (2009) stated that aerobic digestion are
more suitable for low strength wastewater (COD less than 1000 mg/L) and anaerobic
treatments are more suitable for high strength wastewater (COD more than 4000
mg/L). High polluted industrial are more suitable to treat with anaerobic treatment
follow by aerobic treatment due to high level of COD. Furthermore effluent
produced in anaerobic (pre-) treatments consists of solubilized organics matter and
aerobic (post-) treatments are required to polish the effluent and meet the standard
(less than 30 mg BOD/L) (Chan et al, 2009 ; Vochten et al., 1998). Such sequential
treatment scheme is potential and combines the advantages of both treatments.
1.2 Problem Statement
In fact, both aerobic and anaerobic digestions have advantages and disadvantages. A
combined of both digestions was developed to minimise disadvantages and meet the
requirement. However, only aerobic digestions are employed in mostly existing
wastewater plant due to the quality of effluent. Implement of additional anaerobic
reactor will increase the capital investment cost. Therefore, comparison of aerobic
and combined system in terms of operating conditions and performance must be
investigated, in order to determine the advantages of combined system over aerobic
system.
2
1.3 Objectives
The objectives of this study are listed as follows:
1. To develop a combined anaerobic-aerobic digestion system using one
anaerobic digester and one aerobic digester.
2. To study pH and DO profiles in three systems.
3. To investigate and compare the performance of anaerobic-aerobic system
with aerobic and anaerobic digestion.
4. To study the effect of different initial COD concentration for three systems.
5. To perform kinetic studies on three systems.
1.4 Scope of Study
This study was to investigate and compared reduction of BOD and COD in aerobic,
anaerobic and combined system. In addition, the performance for combined system
was determined by manipulating residence time. During the processes, pH and DO
were observed for three systems.
Furthermore, COD concentrations profiles of three systems were investigated
by varying initial concentration of COD in wastewater. Then, k inetics studies were
performed using four models, including Monod model, First order, Diffusional and
Singh model, according to obtained data.
3
4
1.5 Hypotheses
Based on the study scope, the hypotheses made are listed as below:
1. The pH profile for anaerobic digestion has greater decrement if compare with
aerobic digestion.
2. The removal efficiency of BOD and COD in combined anaerobic-aerobic
digestion is the greatest followed by aerobic and anaerobic digestion.
3. The removal efficiency of COD decreases as the initial concentration of COD
increases for three systems.

5
CHAPTER 2
2 LITERATURE REVIEW
2.1 Background
Organics compounds are combination of carbon, hydrogen, oxygen, nitrogen,
sulphur and other trace elements. They are generated by plants, animal and human
beings such as human excreta, paper products, detergents, cosmetics, food,
agricultural products, wastes from commercial activities and industrial sources
(Richard, 2008). Large concentration of these organic compounds in a stream will
increase biological oxygen demand (BOD) and chemical oxygen demand (COD) as a
result of low level of dissolve oxygen which will endanger the aquatic organisms
(Richard, 2008). Macro-nutrients (nitrogen, phosphorus) may promote eutrophication
of the receiving water bodies (Duce, 2008). Excessive algae growth and subsequent
dying off and mineralization of these algae, may lead to the death of aquatic life
because of oxygen depletion (Verheyen et al., 1996). Agro- industrial effluents may
contain compounds that are directly toxic to aquatic life (e.g. tannins and chromium
in tannery effluents; un-ionized ammonia) (Verheyen et al., 1996) at pH higher than
8 (Reginatto et al., 2005).
A biological treatment is defined as the use of bacteria or other
microorganism to remove contaminates or organics compounds by assimilating them
(Schultz, 2005). Biological systems in wastewater treatment are relatively simple,
cost effective and energy efficient. They can be used in many industrial, municipal,
commercial and residential building applications (The Natural Edge Project, 2009).

6
The efficiency of biological treatment can be evaluated through toxicity, COD, BOD,
and levels of nitrogen and sulphur compounds (Schultz, 2005).
2.2 Biological Digestion
There are two basic categories of biological digestions for wastewater treatment,
which are aerobic and anaerobic digestions (Schultz, 2005).
2.2.1 Aerobic Digestion
Aerobic digestion is the natural biological degradation and purification process in
which bacteria that thrive in oxygen-rich environments break down and digest the
waste. Microbial metabolism in aerobic digestion can be categorized into
fermentation and respiration, biosynthesis, and endogenous respiration.
When a culture of aerobic heterotrophic microorganisms is placed in an
environment containing a source of organic material, the microorganisms will
remove and utilize most of this material. During fermentation metabolism, these
materials will be channeled into metabolic energy and oxidized to carbon dioxide,
water and soluble inert material, providing energy for both synthesis and
maintenance (life support) functions (Ros and Zupacic, 2002). The equation is given
as below (Seabloom and Buchanan, 2005):
→ [
] (2.1)
Through the process of respiration, aerobic microorganisms can further transform the
volatile fatty acids to carbon dioxide, water and additional energy (Lehninger, 1973)
as shown in Equation 2.2.

7
[
]
→ (2.2)
According to Lehninger (1973), biosynthesis is the most complex and vital
energy requiring activity of all living organisms. Two kinds of ingredients are
required for the biosynthesis of cell components: (1) precursors that provide the
carbon, hydrogen, nitrogen, and other elements found in cellular structures, and (2)
adenosine triphosphate (ATP) and other forms of chemical energy needed to
assemble the precursors into covalently-bonded cellular structure. The formation of
new cells through biosynthesis is given in Equation 2.3.
→
(2.3)
Once the external source of organic material is exhausted, the
microorganisms will begin endogenous respiration where microbes will feed on each
other at a higher rate than new cells can be produced (Ros and Zupacic, 2002 ;
Seabloom and Buchanan, 2005).
→ (2.4)

8
Overall processes of aerobic can be represented in Figure 2.1,
Figure 2.1: The Path of Aerobic Digestion
2.2.2 Anaerobic Digestion
Anaerobic digestion is a biological process that happens naturally when bacteria
breaks down organic matter in environments without oxygen (Friend of Earth, 2007)
with concurrent production of biogas (Midwest Rural Energy Council).
Anaerobic process is generally divided into four stages, which are hydrolysis,
acidogenesis, acetogenesis and methanogenesis. Through hydrolysis, the complex
organic molecules are broken down into simple sugars, amino acids, and fatty acids
(Friend of Earth, 2007). In acidogenesis, acidogenic (acid-forming) bacteria will
further product of hydrolysis to organic acids (e.g., acetic, propionic, formic, lactic,
butyric, or succinic acids), alcohols and ketones, acetate, carbon dioxide, and
hydrogen (United-Tech, 2010). Acetogenic bacteria convert fatty acids (e.g.,
propionic acid, butyric acid) and alcohols into acetate, hydrogen, and carbon dioxide,
which are used by the methanogens. Under relatively high hydrogen partial pressure,
acetate formation is reduced and the substrate is converted to propionic acid, butyric
Waste
Oxygen
Microbes
Fermentation, Respiration
Synthesis
End Products (CO2, H2O, etc)
Energy
More
Microbes

9
acid and ethanol rather than methane (United-Tech, 2010). Last stage
(methanogenesis), methane, carbon dioxide and water are produced by methanogenic
bacteria (Friend of Earth, 2007). Pictures of bacteria and overall anaerobic processes
can be illustrated in Figures 2.2 and 2.3, respectively.
Figure 2.2: Pictures of different bacteria in anaerobic digestion (Reference:
Alexander and Diamantis, 2005)
Figure 2.3: Schematic of Reaction in Anaerobic Digestion (Reference: Salsabil,
2008)
10
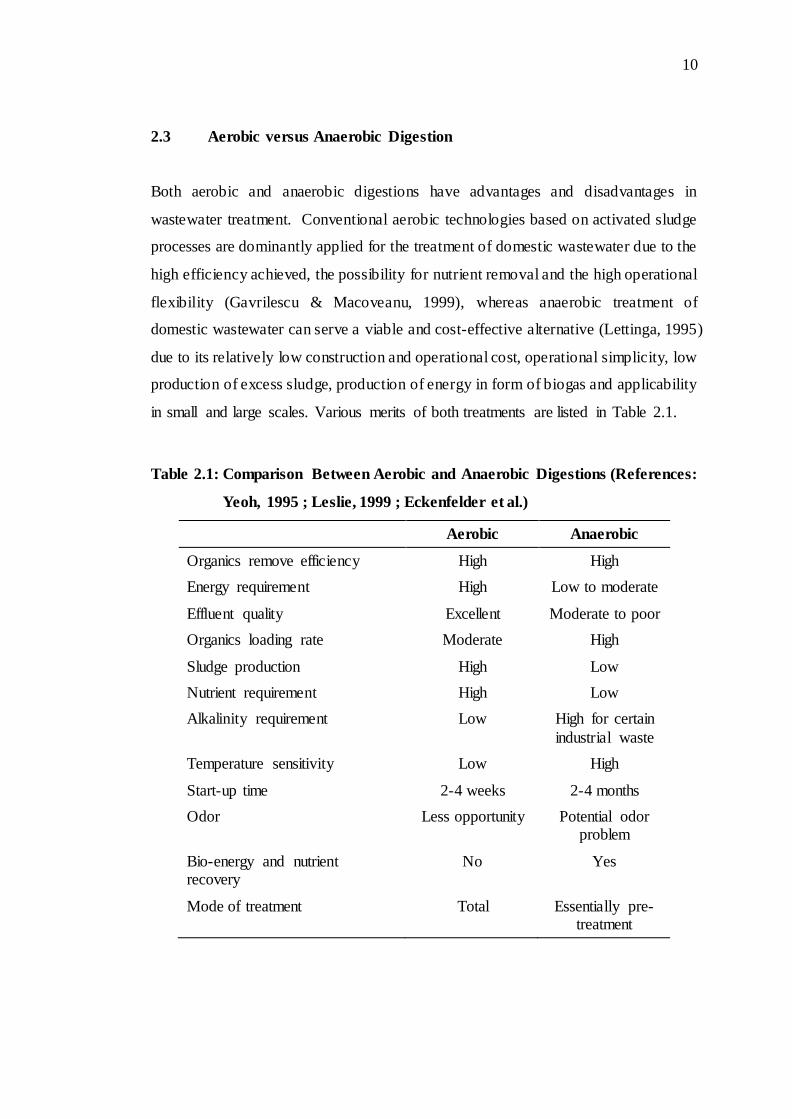
2.3 Aerobic versus Anaerobic Digestion
Both aerobic and anaerobic digestions have advantages and disadvantages in
wastewater treatment. Conventional aerobic technologies based on activated sludge
processes are dominantly applied for the treatment of domestic wastewater due to the
high efficiency achieved, the possibility for nutrient removal and the high operational
flexibility (Gavrilescu & Macoveanu, 1999), whereas anaerobic treatment of
domestic wastewater can serve a viable and cost-effective alternative (Lettinga, 1995)
due to its relatively low construction and operational cost, operational simplicity, low
production of excess sludge, production of energy in form of biogas and applicability
in small and large scales. Various merits of both treatments are listed in Table 2.1.
Table 2.1: Comparison Between Aerobic and Anaerobic Digestions (References:
Yeoh, 1995 ; Leslie, 1999 ; Eckenfelder et al.)
Aerobic Anaerobic
Organics remove efficiency High High
Energy requirement High Low to moderate
Effluent quality Excellent Moderate to poor
Organics loading rate Moderate High
Sludge production High Low
Nutrient requirement High Low
Alkalinity requirement Low High for certain
industrial waste
Temperature sensitivity Low High
Start-up time 2-4 weeks 2-4 months
Odor Less opportunity Potential odor problem
Bio-energy and nutrient recovery
No Yes
Mode of treatment Total Essentially pre-treatment

11
Aerobic treatment systems are commonly used in the treatment of organic
wastewaters for achieving high degree of treatment efficiency, while in anaerobic
treatment systems, considerable progress has been achieved in anaerobic
biotechnology for waste treatment based on the concept of resource recovery and
utilization, while still achieving the objective of pollution control (Yeoh, 1995 ;
Seghezzo, 1998).
Anaerobic treatment systems have some advantages over aerobic treatment
systems due to removal of higher organic loading, low sludge production and high
pathogen removal, methane gas production and low energy consumption (Nykova et
al., 2002). Conventional activated sludge (CAS) process in aerobic treatment systems
is energy intensive due to the high aeration requirement and it also produces large
quantity of sludge (about 0.4 g dry weight/g COD removed) that has to be treated
and disposed off (Mrowiec and Suschka). Sludge production in anaerobic systems is
low and the excess sludge is already digested and can be directly dewatered,
typically by drying beds, and disposed (Kassab et al., 2009). Anaerobic treatment
systems have higher volumetric organic loads than aerobic processes, so smaller
reactor volumes and less space may be required for treatment. Organic loading rates
of 3.2 to 32 kg COD/m3/d may be achieved, compares with 0.5 to 3.2 kg COD/m3/d
for aerobic processes (The AD Community, 2007). In addition, the required nutrient
addition is much less for anaerobic treatment system because less biomass is
produced (The AD Community, 2007). Production of methane (biogas) in anaerobic
treatment can be used to generate power to satisfy the energy need of the whole
treatment plant (energy recovery) or used as fuel (Last, 2006).
Nevertheless, anaerobic treatment systems have relatively poor effluent
quality, high temperature sensitivity and alkalinity requirement. In terms of effluent
quality, methanogens have limited substrate affinity, and thus anaerobic system is
inefficient in treatment polishing. In comparison, aerobic system permits the removal
of organics with, in practice, a capacity of purification down to values lower than
required standard (less than 30 mg BOD/L) (Guiot, 1994). Effluent of anaerobic
treatment often contains ammonium ion (NH4+) and hydrogen sulfide (HS-) (Heijnen
et al., 1991), implying a complete stabilization of organic matters is impossible,
therefore anaerobic systems are essentially for pre-treatment. Furthermore, anaerobic

12
treatment is highly influenced by temperature because methanogenic bacteria are
very sensitive to small changes in temperature, which leads to a decrease of the
maximum specific growth rate, while the half-saturation constant increases. Thus, a
mesophilic digester must be designed to operate at temperature between 30 and 35°C
for their optimal functioning (United-Tech, 2010). In addition, methanogenic
bacteria are also pH sensitive and generally have an optimum range from pH 6.5 to
pH 7.5 (Clark and Speece, 1971). Under normal conditions, acid produced by
acidogenic bacteria is buffered by the bicarbonate that is produced by methanogens.
Under adverse environmental conditions, the buffering capacity of the system can be
upset, eventually stopping the production of methane. Acidity is inhibitorier to
methanogens than of acidogenic bacteria (United-Tech, 2010) therefore alkalinity
and pH are often controlled by adding bicarbonate to reactor (Eckenfelder et al.,
2010).
Generally, highly polluting industrial wastewaters (more than 4000 mg
COD/L) are preferably treated in an anaerobic reactor due to the high potential for
energy generation and low surplus sludge production (Chan et al., 2009), while
aerobic treatment systems are suitable for the treatment of low strength wastewaters
such as municipal wastewater (less than 1000 mg COD/L) (Mrowiec and Suschka,
2010).
2.4 Combined Anaerobic-Aerobic Digestion
In a combined anaerobic-aerobic treatment, two stages involving anaerobic
degradation of the main fraction of organic matter, and a polishing step of the
partially treated wastewaters by aerobic treatment to lower the final organic load of
the effluent sequentially take place, so the discharge requirements can be met (Cocci
et al., 1991; Monroy et al., 1995). Treatment of domestic wastewater in the combined
anaerobic–aerobic treatment exploits the advantages of the two systems in the most
cost-effective set-up if compared with aerobic treatment alone (Vera et al., 1999).

13
Benefits of combined anaerobic-aerobics identified by Frostell (1983) and
Cervantes et al. (2006) and reorganized by Chan et al. (2009) are listed as below:
Great potential of resource recovery: Anaerobic pretreatment removes most
of the organic pollutants and converts them into a useful fuel, namely biogas.
High overall treatment efficiency: Aerobic post-treatment polishes the
anaerobic effluent and results in very high overall treatment efficiency. The
aerobic treatment also smoothes out fluctuations in the quality of the
anaerobic effluent.
Less disposal of sludge: By digesting excess aerobic sludge in the anaerobic
tank, a minimum stabilized total sludge is produced which leads to a
reduction in sludge disposal cost. As an additional benefit, a higher gas yield
is achieved.
Low energy consumption: anaerobic pretreatment acts as an influent
equalization tank, reducing diurnal variations of the oxygen demand and
resulting in a further reduction of the required maximum aeration capacity.
When volatile organics are present in the wastewater, the volatile compound
is degraded in the anaerobic treatment, removing the possibility of
volatilization in the aerobic treatment.
Ros and Zupancic (2004) agreed that it is operationally and economically
advantageous to adopt anaerobic–aerobic processes in the treatment of high strength
industrial wastewaters since it coupled the benefit of anaerobic digestion (i.e. biogas
production) with the benefits of aerobic digestion (i.e. better COD and volatile
suspended solid (VSS) removal) and increase their capability to biodegrade organic
matter.
2.4.1 Type of Combination
Generally there are three types of combination for aerobic-anaerobic treatment
system, which are conventional anaerobic-aerobic system, anaerobic-aerobic system
using high rate reactor and integrated anaerobic-aerobic system as shown in Figure
2.4,

14
Figure 2.4: Type of Combine Anaerobic-Aerobic System (Adapted from Chan et
al., 2009)
The simplest approach for the anaerobic–aerobic treatment is the use of
conventional systems such as aerated stabilization ponds, aerated and non-aerated
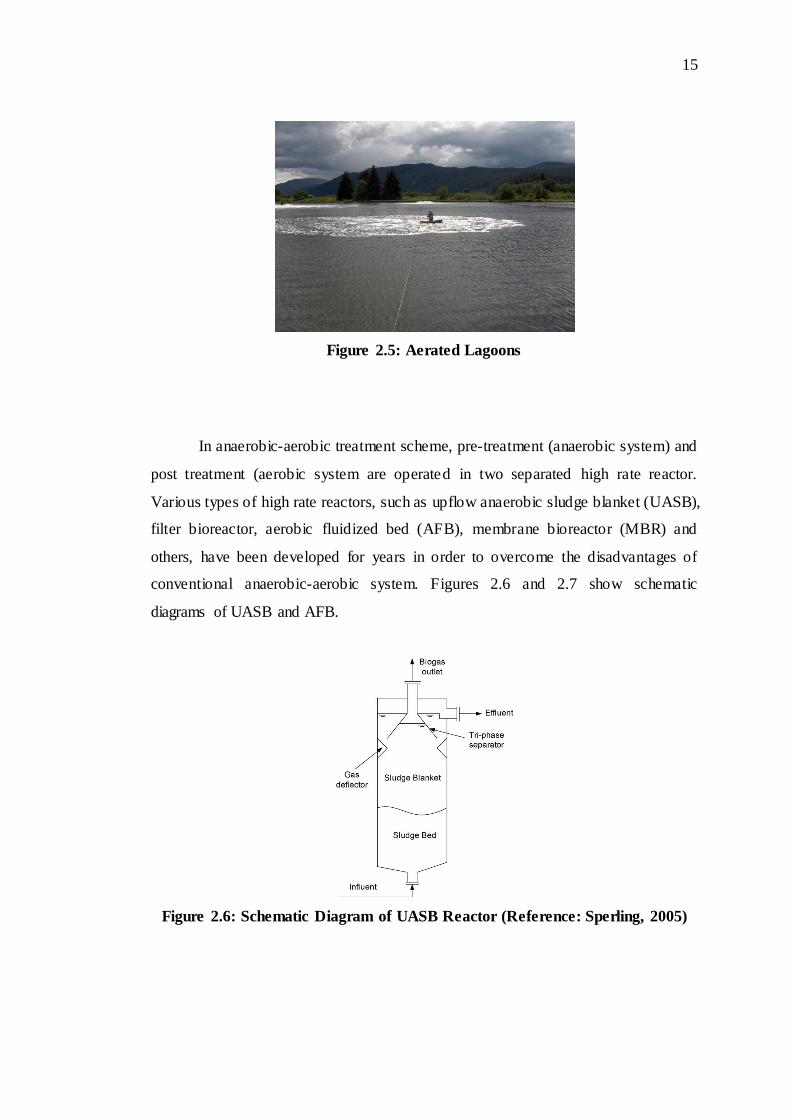
lagoons, as well as natural and artificial wetland systems (Chan et al., 2009). Figure
2.5 shows an aerated lagoon. Aerobic treatment occurs in the upper part of these
systems while anaerobic treatment occurs at the bottom end. However, conventional
anaerobic-aerobic system has disadvantages including large space requirement,
emissions into populated environments from large open reactors, low process
efficiencies, large surplus sludge production and high energy consumption.
Anaerobic-aerobic Treatment
Conventional Anaerobic-aerobic
Treatment
Anaerobic-aerobic Treatment using
high rate bioreactor
Integrated Anaerobic-aerobic
Treatment bioreactor
Integrated Anaerobic-aerobic
Treatment with physical separation
Integrated Anaerobic-aerobic Treatment without physical separation
Sequencing Batch
Reactor (SBR)
Combine Anaerobic-
aerobic culture system
15
Figure 2.5: Aerated Lagoons
In anaerobic-aerobic treatment scheme, pre-treatment (anaerobic system) and
post treatment (aerobic system are operated in two separated high rate reactor.
Various types of high rate reactors, such as upflow anaerobic sludge blanket (UASB),
filter bioreactor, aerobic fluidized bed (AFB), membrane bioreactor (MBR) and
others, have been developed for years in order to overcome the disadvantages of
conventional anaerobic-aerobic system. Figures 2.6 and 2.7 show schematic
diagrams of UASB and AFB.
Figure 2.6: Schematic Diagram of UASB Reactor (Reference: Sperling, 2005)

16
Figure 2.7: Schematic Diagram of AFB Reactor (Reference: Sperling, 2005)
Various combinations of high rate reactors have been applied for industrial
wastewater treatment plants. For example, UASB and continuous stirred reactor
(CSTR) are used to treat wastewater from pulp and paper industry (Tezel et al.,
2001), pharmaceutical industry (Spooza and Demidran, 2008), simulate textile
industry (Isik and Spooza, 2008) and etc. Figure 2.8 shows a typical example of
anaerobic-aerobic treatment for combined fixed film bed (FFB) system.
Figure 2.8: Schematic Diagram for Anaerobic-Aerobic FFBs (Pozo & Diez, 2005)

17
Integrated anaerobic-aerobic treatments are more intensive form of
biodegradation by integrating anaerobic and aerobic area within single reactor.
Typical example for these treatment systems are bubble column with draught tube
and upflow anaerobic-aerobic fix bed (UA/AFB) integrated bioreactor, as shown in
Figures 2.9 and 2.10, respectively.
Figure 2.9: Bubble Column with Draught Tube (Reference: Hano et al., 2005)
Figure 2.10: UA/AFB Integrated Reactor (Reference: Moosavi et al., 2004)
18
2.5 Case Study
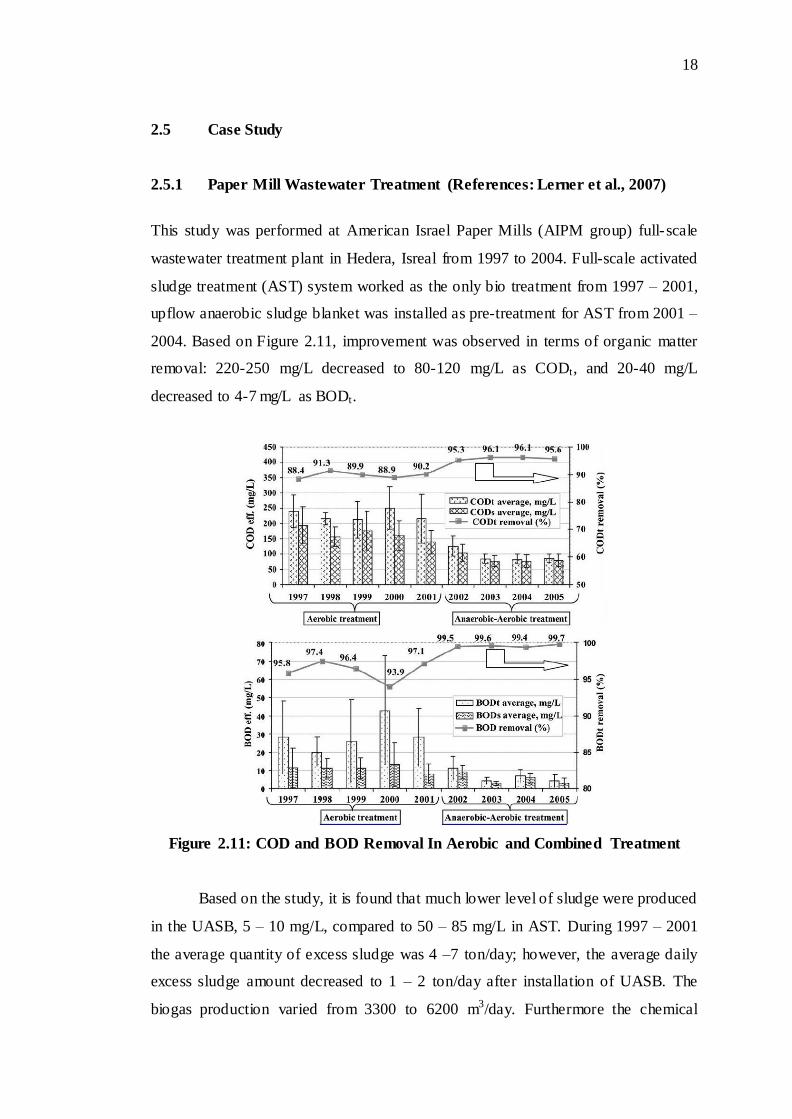
2.5.1 Paper Mill Wastewater Treatment (References: Lerner et al., 2007)
This study was performed at American Israel Paper Mills (AIPM group) full-scale
wastewater treatment plant in Hedera, Isreal from 1997 to 2004. Full-scale activated
sludge treatment (AST) system worked as the only bio treatment from 1997 – 2001,
upflow anaerobic sludge blanket was installed as pre-treatment for AST from 2001 –
2004. Based on Figure 2.11, improvement was observed in terms of organic matter
removal: 220-250 mg/L decreased to 80-120 mg/L as CODt, and 20-40 mg/L
decreased to 4-7 mg/L as BODt.
Figure 2.11: COD and BOD Removal In Aerobic and Combined Treatment
Based on the study, it is found that much lower level of sludge were produced
in the UASB, 5 – 10 mg/L, compared to 50 – 85 mg/L in AST. During 1997 – 2001
the average quantity of excess sludge was 4 –7 ton/day; however, the average daily
excess sludge amount decreased to 1 – 2 ton/day after installation of UASB. The
biogas production varied from 3300 to 6200 m3/day. Furthermore the chemical

19
consumption and cost comparison is shown in Table 2.2. Polymer consumption was
reduced 50% due to low production of biosolids. The nutrient demand and electricity
consumption of anaerobic digestion was only 60% and 70%, respectively of AST
plant. Nevertheless anaerobic treatment required caustic soda to control pH level as
methanogenesis deactivated when pH dropped below pH 6.
Table 2.2: Wastewater Treatment Plant Main Expenses
Parameter Unit Aerobic treatment only Combined treatment
1999 2000 2001 2002 2003 2004
Electricity kWh/day 10800 10100 10200 7100 7100 7000 Polymers kg/day 74 64 67 34 19 31
Nutrients kg/day 783 1464 1186 679 747 708 Caustic Soda kg/day - - - 3600 1900 1000
2.5.2 Grey Wastewater Treatment (References: Zeeman, 2009)
This study employed three systems: aerobic, anaerobic and anaerobic-aerobic system
to treat grey wastewater. Grey wastewater was collected from Sneek, The Netherland,
which contained total COD and nutrient concentration of 800 and 30 mg/L,
respectively. Hydraulic retention times (HRT) were 12 hours for both Sequential
batch reactor (SBR) and upflow anaerobic sludge blanket (UASB), and 7 hours in
UASB followed by 6 hours in SBR for combine system. Figure 2.12 shows the setup
of the reactors in this study.
Figure 2.12: Apparatus Setup in Grey Wastewater Treatment

20
Based on Table 2.3, the COD removal percentages for aerobic and combine
systems were both 88%, and 47% for anaerobic digestion. Effluent COD
concentrations were reported as 91, 408 and 100 mg/L for aerobic, anaerobic and
combined system respectively. For biogas production, anaerobic treatment produced
123 NL/m3 and combined system produced 72 NL/m3. Aerobic treatment achieved
relatively high removal of nitrogen and phosphorus.
The study concluded that combine system did not give any advantages in grey
wastewater treatment in terms of COD removal and sludge yield. However, the
benefits of this configuration depend on gas used and energy input.
Table 2.3: Performance of Biological Treatment on Grey Wastewater
Aerobic Anaerobic Combine
HRT (h) 12 12 13.2 COD removal (%) 88 47 88
COD effluent (mg/L) 91 408 100 Yield (g VSS/g COD) 0.11 0.08 0.19
Bio-gas production (NL/m3) - 123 72 N removal (%) 24 3 2 P removal (%) 8 6 3
CHAPTER 3
3 METHODOLOGY
3.1 Experimental Setup and Procedure
3.1.1 Wastewater and microbial culture
The synthesis wastewater employed in this study was prepared at various COD
concentrations in the range of 2000 to 2500 mg COD/L as shown in Table 3.1. The
pH of wastewater was adjusted manually close to neutral by adding HCL or NaOH
solution. The concentration of sucrose was manipulated for preparation of other
COD concentrations in wastewater, e.g., 850, 4500 and 5000 mg/L.
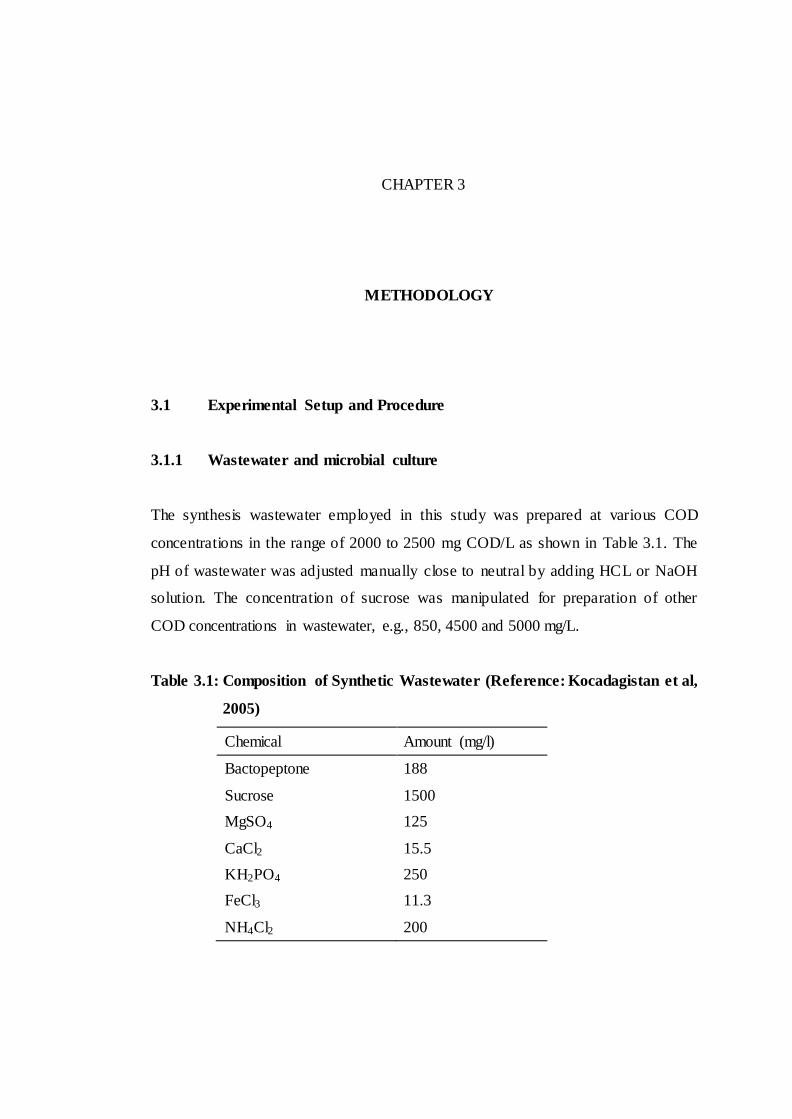
Table 3.1: Composition of Synthetic Wastewater (Reference: Kocadagistan et al,
2005)
Chemical Amount (mg/l)
Bactopeptone 188
Sucrose 1500
MgSO4 125
CaCl2 15.5
KH2PO4 250
FeCl3 11.3
NH4Cl2 200
22
Activated sludge was collected from a wastewater treatment plant of Indah
Water Konsordium (I.W.K.) at Bangi. Both aerobic and anaerobic digesters were
seeded with this sludge and cultivated for three weeks before experiments were
performed. During the cultivation process, concentration of COD was measured
daily until the variation is less than 5% (Sponza and Demirden, 2010).
3.1.2 Safety and Precautions
Some safety and precautions must be emphasized and followed prior to the
experiment. Heater and thermocouple must be fully ensured that immersed into
liquid before the heater is switched on. The temperature controller must not be set
higher than 60◦C as the reactor can be damage at this temperature. The electrical
control box must be always kept dry. In event of spillage, any spilled liquid off the
surface of electrical control must be wiped immediately using a clean dry cloth.
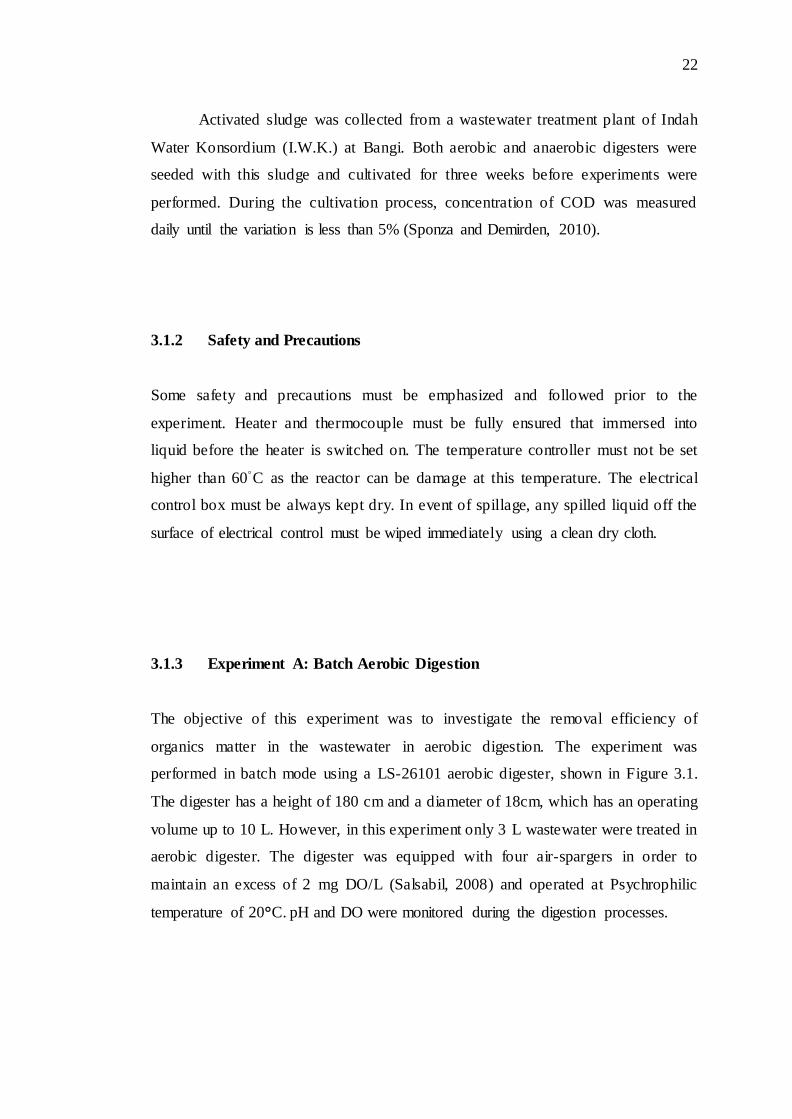
3.1.3 Experiment A: Batch Aerobic Digestion
The objective of this experiment was to investigate the removal efficiency of
organics matter in the wastewater in aerobic digestion. The experiment was
performed in batch mode using a LS-26101 aerobic digester, shown in Figure 3.1.
The digester has a height of 180 cm and a diameter of 18cm, which has an operating
volume up to 10 L. However, in this experiment only 3 L wastewater were treated in
aerobic digester. The digester was equipped with four air-spargers in order to
maintain an excess of 2 mg DO/L (Salsabil, 2008) and operated at Psychrophilic
temperature of 20°C. pH and DO were monitored during the digestion processes.
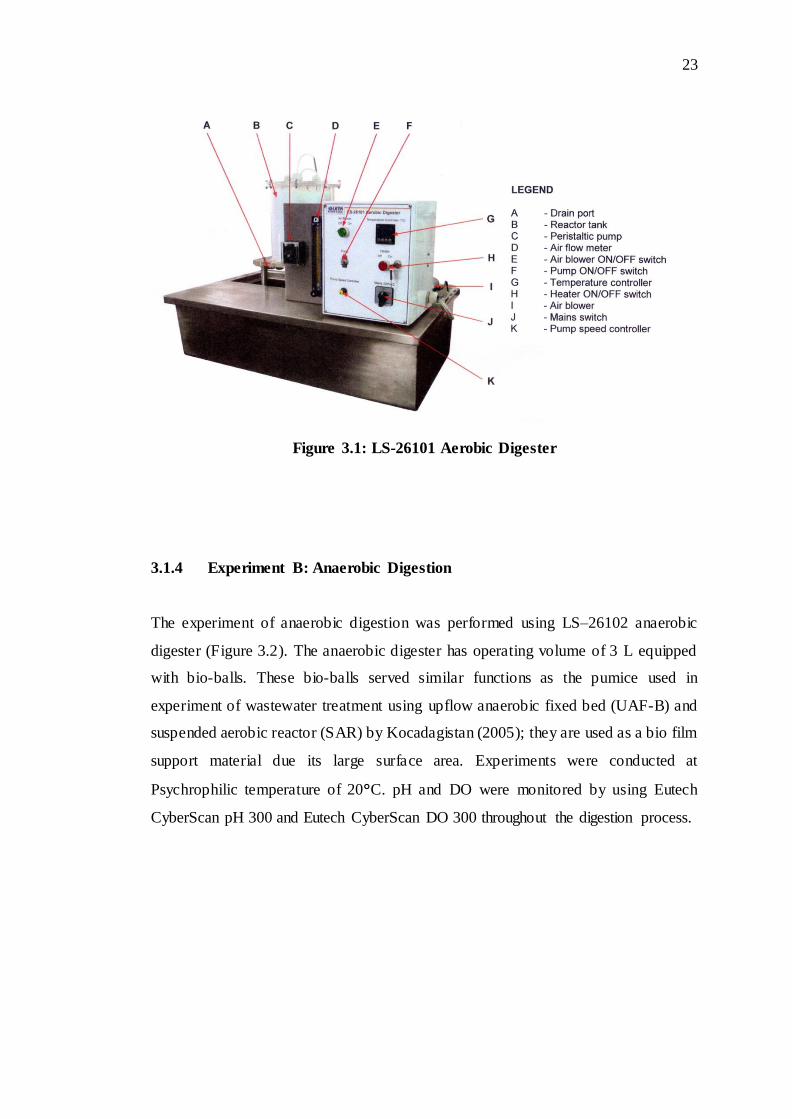
23
Figure 3.1: LS-26101 Aerobic Digester
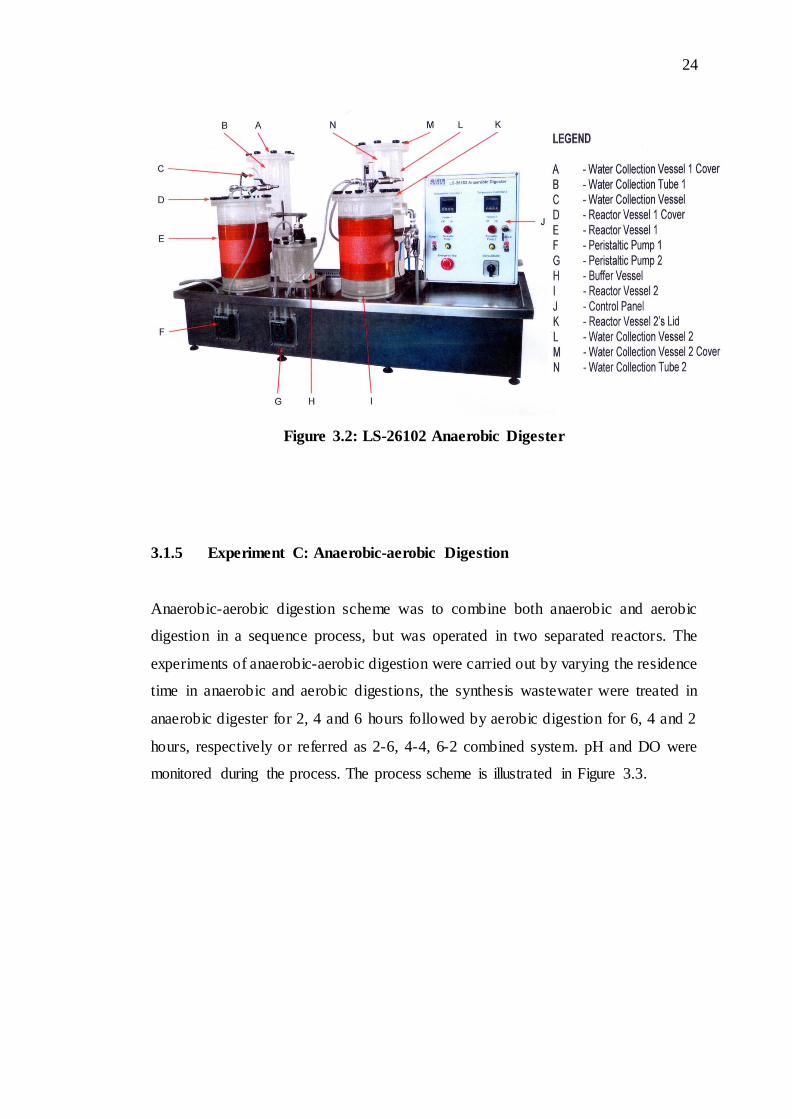
3.1.4 Experiment B: Anaerobic Digestion
The experiment of anaerobic digestion was performed using LS–26102 anaerobic
digester (Figure 3.2). The anaerobic digester has operating volume of 3 L equipped
with bio-balls. These bio-balls served similar functions as the pumice used in
experiment of wastewater treatment using upflow anaerobic fixed bed (UAF-B) and
suspended aerobic reactor (SAR) by Kocadagistan (2005); they are used as a bio film
support material due its large surface area. Experiments were conducted at
Psychrophilic temperature of 20°C. pH and DO were monitored by using Eutech
CyberScan pH 300 and Eutech CyberScan DO 300 throughout the digestion process.
24
Figure 3.2: LS-26102 Anaerobic Digester
3.1.5 Experiment C: Anaerobic-aerobic Digestion
Anaerobic-aerobic digestion scheme was to combine both anaerobic and aerobic
digestion in a sequence process, but was operated in two separated reactors. The
experiments of anaerobic-aerobic digestion were carried out by varying the residence
time in anaerobic and aerobic digestions, the synthesis wastewater were treated in
anaerobic digester for 2, 4 and 6 hours followed by aerobic digestion for 6, 4 and 2
hours, respectively or referred as 2-6, 4-4, 6-2 combined system. pH and DO were
monitored during the process. The process scheme is illustrated in Figure 3.3.

25
Figure 3.3: Anaerobic-Aerobic Process Scheme
3.2 Analysis Setup and Procedure
3.2.1 Biochemical Oxygen Demand (BOD) Test
Biochemical oxygen demand (BOD) determination is a laboratory test used to
determine the relative oxygen requirement of wastewater. This test was conducted
according to Standard Method 5210B (5-day BOD test). The test measures the
molecular oxygen utilized during a specified incubation period for biochemical
degradation of organic material and oxidation of inorganic material (e.g., sulfides
and ferrous ion).
3.2.1.1 Materials and Apparatus
A BOD incubator serves to maintain the process temperature at 20 º C for five days
and prevent the sunlight exposure. Other materials and apparatus are needed to
prepare are listed as following
BOD bottles (300 mL each)
200 – 250 mL beakers
Dilution water (prepared 24 hours before performed BOD test)
DO probe (Eutech CyberScan pH 300).
Anaerobic
Digestion
Aerobic
Digestion
Anaerobic
digested
wastewater

26
3.2.2 Chemical Oxygen Demand (COD) Test
Chemical Oxygen Demand (COD) is defined as the amount of a specified oxidant
that reacts with the sample under controlled condition. This test was performed
according to standard method 5220D (Closed reflux, colorimetric method). The
quantity of oxidant consumed is expresses in terms of its oxygen equivalence.
Oxidising agent, potassium dichromate (K2Cr2O7), are used to determine COD
because it is shown to be the most effective, relatively cheap and easy to purify, and
is able to nearly completely oxidize almost all organic compounds. In this test,
dichromate ion (Cr2O72-) is reduced to chromic ion (Cr3+). Based on American Public
Health Association (1998), both of these chromium species absorb in the visible
region of the spectrum. Dichromate ion absorbs strongly in the 600 nm region, where
chromic ion absorption is much less. The chromic ions absorbs strongly in the 400
nm region, where dichromate has nearly zero absorption.
3.2.2.1 Safety and Precautions
Potassium dichromate (K2Cr2O7) is identified as very hazardous to health in case of
skin contact (permeator, corrosive, and irritant), inhalation (irritant) and swallow.
Furthermore potassium dichromate is a strong oxidising agent reacts vigorously or
explosively with wide variety of reducing agents.
Some safety and precautions steps are required to follow when performing
the COD analysis,
Always wear safety glasses and glove while performing tests.
Ensure working environment is well ventilated.
Ensure any spills are cleaned up without any delay.
Dispose unused chemical in appropriate lab manner after used.
Rinse with running water immediately in case of skin or eye contact.
Other safety information can be referred to Material Safety Data Sheet (MSDS)
Chemical Safety Data: Potassium Dichromate as attached in appendices.

27
3.2.2.2 Materials and Apparatus
Main equipments required to perform this analysis tests were DRB200 Reactor and
DR2800 spectrophotometer. DRB200 reactor served to heat up the wastewater
sample to 150°C for 2 hours, and COD concentrations were measured by using
DR2800 Spectrophotometer. Other materials and apparatus are listed as follows:
Beaker (250 ml)
COD digestion reagent vials
Magnetic Stirrer and stir bar
Opaque shipping container for storage of unused
Pipet, Tensette ®, 0.1 to 1.0 mL, with tips (for 200-15000 mg/L range)
Test Tube Rack
3.3 Kinetics Model Formulation
Kinetic modelling is an interest exercise that used for design, prediction and control
purposes for a digestion system (Lyberatos and Skiadas, 1999; Gavala et al., 2003).
Experimental data obtained from the batch digestion studies were fitted into four
models namely, Monod model, First model, Diffusional and Singh Model.
3.3.1 Monod Model
(3.1)
-
(
)
(3.2)
where Ks, K1 and Cs correspond to half saturated constant of Monod`s equation (mg
COD/L), the product of maximum specific degradation rate and biomass
28
concentration (mg COD/ L-h), and substrate concentration (mg COD/L), respectively,
while the term
represents the substrate degradation (mg COD/L-h).
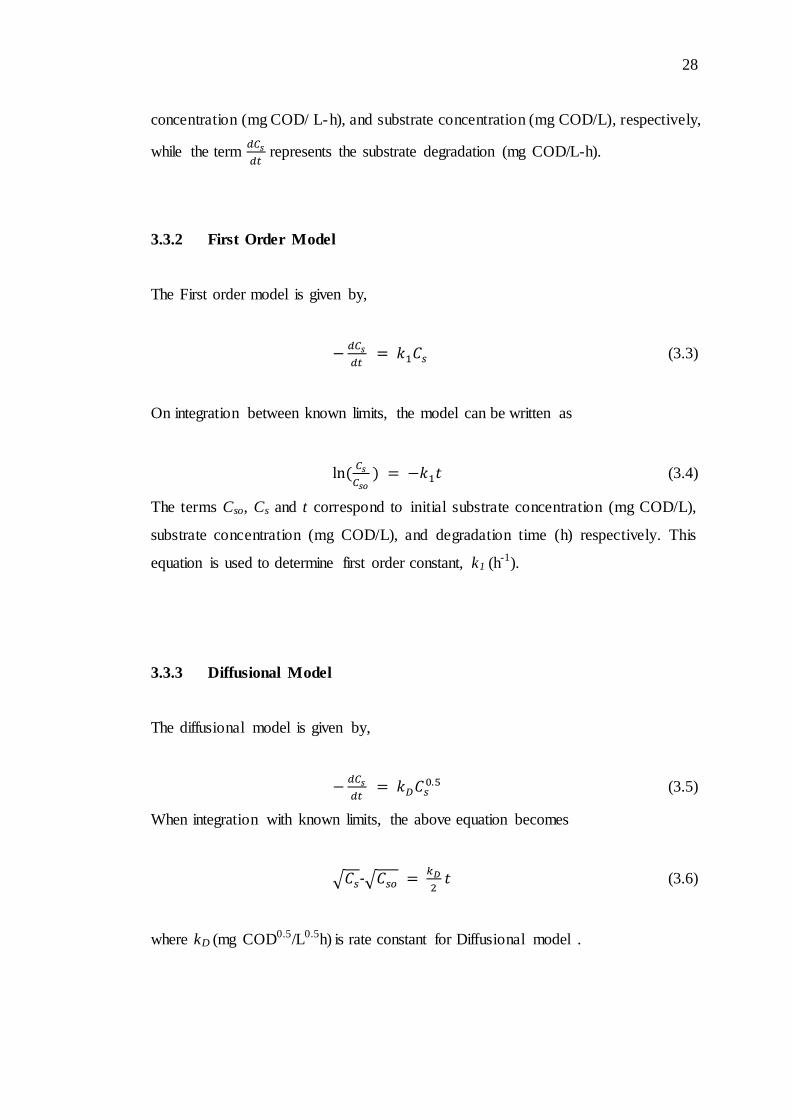
3.3.2 First Order Model
The First order model is given by,
(3.3)
On integration between known limits, the model can be written as
(3.4)
The terms Cso, Cs and t correspond to initial substrate concentration (mg COD/L),
substrate concentration (mg COD/L), and degradation time (h) respectively. This
equation is used to determine first order constant, k1 (h-1).
3.3.3 Diffusional Model
The diffusional model is given by,
(3.5)
When integration with known limits, the above equation becomes
√ -√
(3.6)
where kD (mg COD0.5/L0.5h) is rate constant for Diffusional model .
29
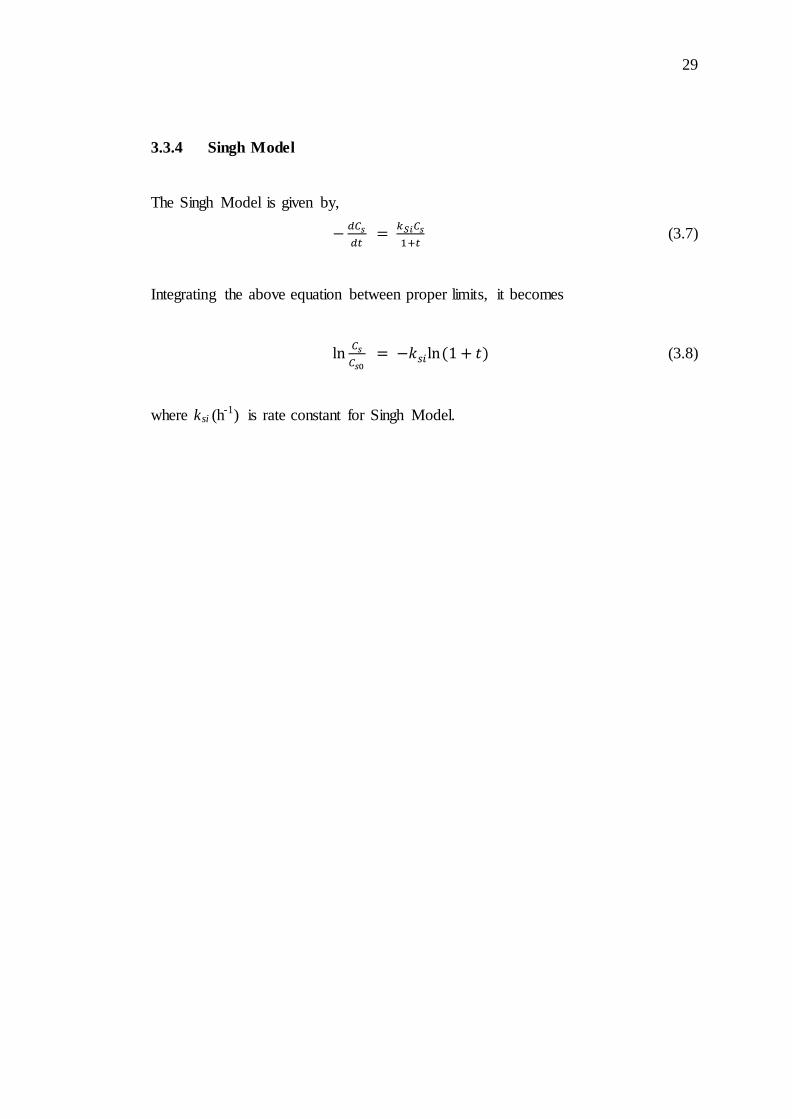
3.3.4 Singh Model
The Singh Model is given by,
(3.7)
Integrating the above equation between proper limits, it becomes
(3.8)
where ksi (h-1) is rate constant for Singh Model.
30
CHAPTER 4
4 RESULTS AND DISCUSSION
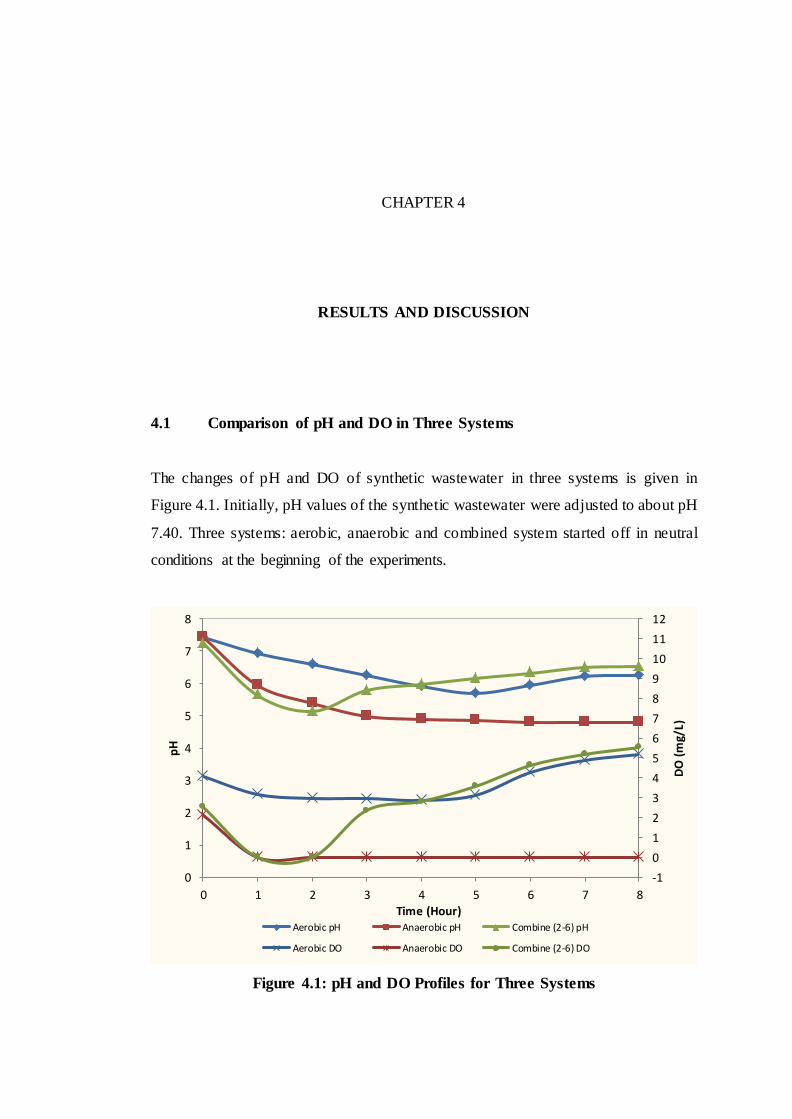
4.1 Comparison of pH and DO in Three Systems
The changes of pH and DO of synthetic wastewater in three systems is given in
Figure 4.1. Initially, pH values of the synthetic wastewater were adjusted to about pH
7.40. Three systems: aerobic, anaerobic and combined system started off in neutral
conditions at the beginning of the experiments.
Figure 4.1: pH and DO Profiles for Three Systems
-1
0
1
2
3
4
5
6
7
8
9
10
11
12
0
1
2
3
4
5
6
7
8
0 1 2 3 4 5 6 7 8
DO
(m
g/L)
pH
Time (Hour) Aerobic pH Anaerobic pH Combine (2-6) pH
Aerobic DO Anaerobic DO Combine (2-6) DO

31
Initially pH value in the aerobic digester was decreased slowly until it
reached pH 5.69. However, the pH value increased slowly after fifth hour of
digestion. The change of pH in the aerobic digestion was mainly due to nitrification
and denitrification activities. Metcalf and Eddy (1991) stated that optimum pH
ranges for both nitrification and denitrification activities: pH 7.5 to 8.5 favoured
nitrification and pH 6 to 8 for denitrification activity. Based on Figure 4.1,
nitrification activity occurred in five hours from the beginning of aerobic digestion
which consumed alkalinity (Grady et al., 1999) and decreased pH; it converted nitrite
and nitrate in the presence of high DO conditions. Theoretically denitrification
occurs under a low DO condition which reduces nitrate acids to nitrogen gas.
However, both pH and DO profile were increased after fifth hour of digestion. This
can be explained due to completely removal of NH4+, therefore the consumption of
DO by nitrifiers to oxidise NH4+ decreased. Although NH4
+ concentration was not
measured throughout this experiment, this phenomenon was, however, supported by
Hassimi et al. (2010).
Furthermore, decrease in pH can also be caused by production of CO2 as it
will dissolve in water to form carbonic acid (H2CO3). Theoretically, pH in aerobic
digester is more alkaline than anaerobic digester (O`Keefe and Chynoweth, 2000;
Kim, 2005) because CO2 will be stripped by air. This decrease in CO2 will leads to
decrease of the H2CO3 and bicarbonate ion concentrations (HCO3-) consuming H+
ions (Kim, 2005). In comparison to aerobic digestion, the pH value in anaerobic
digester decreased more rapidly until it achieved almost constant value at pH 4.8.
Furthermore, a complete anaerobic process required to undergo four stages as
mentioned in Chapter 2, product form from each stage will cause the pH of leachate
to change. In fact last stage of anaerobic process, methanogenesis, will neutralise the
acids produced from acidogenesis and acetogenesis by converting acetic acid,
propionic acid and volatile fatty acid (VFA) to final product of methane and carbon
dioxide gas. Nevertheless, Lay et al. (1997) proposed that methanogenesis rate would
decrease at pH lower than 6.3, as low pH would inhibit methanogens and cause
organic acids accumulate in the digester which would probably lead to a failure
system. However, the pH profile that shown in Figure 4.1 is still reasonable to be
obtained from a non-failure anaerobic system. According to the research performed

32
by Erses et al. (2008), the pH value in the anaerobic digester remained at about 5.0
when treated with municipal solid waste. After certain period of time, transition from
acetogenic to methanogenic condition would occur and VFA would be utilised as
substrate, and hence the pH would increase again. Metcalf and Eddy (1991) also
suggested methanogen are strict anaerobes, hence their metabolism considered rate-
limiting and long detention time is required. It is believed that the anaerobic system
in this experiment still remained in acidogenesis and acetogenesis condition during
the eight hours of digestion.
In combined system, the pH of synthetic wastewater dropped drastically
when it was treated in the anaerobic digester for two hours, and then the pH
increased rapidly when treated in the aerobic digester. As discussed, CO2 produced
would be dissolved and formed H2CO3 and other acids might be formed during the
anaerobic digestion. After synthetic wastewater was transferred to aerobic digester,
CO2 was purged out by aeration and VFA would be utilised as substrate. Throughout
the aerobic processes the pH remained at 6.52, and hence denitrification was
favoured and less DO was consumed.
4.2 Reduction of COD and BOD in Three Systems
Chemical oxygen demand (COD) is adopted as indicators of synthetic wastewater
organic strength. The COD concentrations of the synthetic wastewater for three
systems are presented in Figure 4.2. The initial concentrations of COD for all the
systems were similar 2100 mg/L. The COD concentration in the aerobic digester
decreased drastically within eight hours of digestion if compared to that in the
anaerobic digester. This result showed that aerobic digestion had higher digestion
rate of 191.3 mg COD/L-h (Table 4.1), when compared with the anaerobic digestion
rate of 96.3 mg COD/L-h. It is proposed that anaerobic digestions are limited to
fermentation process, where higher organic compound will be reduced to lower
organic (e.g. methane and carbon dioxide) through this process (Buchanan and
Seabloom, 2005). However, the aerobic digestion will undergo additional respiration

33
process instead of fermentation process. Through this respiration, aerobic
microorganism can further transform volatile fatty acids and other organics
compound to bio-energy, which is required to produce more cells (Lehninger, 1973).
This process is also referred as biosynthesis. Therefore, more cells are produced
through aerobic digestion compared with through anaerobic digestion. As these new
cells will also undergo fermentation and respiration, the digestion rate is also greater.
This theory has been supported by Aivasidis and Diamantis (2010), as 30-50% of
COD was converted to activated sludge in aerobic digestion and only 5% in
anaerobic digestion.
Figure 4.2: COD Concentration of Synthetic Wastewater for Three Systems
0
500
1000
1500
2000
2500
0 1 2 3 4 5 6 7 8
Re
du
ctio
n o
f C
OD
(m
g/L)
Time (Hour)
Aerobic Anaerobic Combine (2-6) Combine (4-4) Combine (6-2)

34
Table 4.1: COD Removal Rate and Efficiency for Three Systems
Treatment
Present Study Leal (2010)*
Rate
(mg/L-h) Efficiency
Rate
(mg/L-h) Efficiency
Aerobic 191.3 70.83% 62.5 90%
Anaerobic 96.3 35.65% 33.4 59%
Combine (2-6) 205.0 74.21%
89% Combine (4-4) 182.5 68.87% 58.4
Combine (6-2) 150.0 57.42%
*SBR and UASB operated at HRT 12 hours in treating grey water. Combine system consists of a
sequence of UASB and SBR operated at HRT of 7 hours and 6 hours respectively and temperature
of 32 2°C.
In addition, anaerobic digestion achieved lower COD removal efficiency of
35.65% compared with aerobic digestion of 70.83%. As mentioned previously, the
anaerobic is limited to fermentation activity, as nutrients (e.g. phosphorus and
ammonia) are only consumed in the respiration process (Heijnen, 1991). Therefore,
the effluent from the anaerobic digestion often contains ammonium ions (NH4+) and
hydrogen sulphide (HS-) which then contribute to the COD level. Although the
concentration of ammonium ions was not measured in this experiment, this
explanation has been practically proved by Leal (2010) and the result is attached in
Appendices C. Based on this result, there is no reduction of ammonium ions in the
effluent of the UASB reactor.
In combined anaerobic-aerobic system, the 2-6 combine system achieved the
highest COD removal efficiency (74.21%), followed by 4-4 (68.87%) and 6-2
(57.42%) systems. This trend can be explained as the anaerobic digestion has lower
digestion rate compared to the aerobic digestion rate. The COD removal rate dropped
slowly when treated in anaerobic digester but dropped drastically after transferred to
aerobic digester as shown Figure 4.2. Therefore, it can be concluded that the longer
the synthetic wastewater was treated in the anaerobic digester the lower COD
removal efficiency. In comparison with single digestion, the 6-2 combined system
had the highest COD removal efficiency followed by aerobic digestion. This was
probably due to the fact that the complex organic compounds were broken down to
volatile fatty acids (VFA) which could be easily digested by subsequent aerobic

35
process (Gray, 2005). Furthermore, other combined systems also presented higher
COD removal efficiency than anaerobic digestion.
According to Leal (2010), the COD removal rates were 62.5, 33.4 and 58.4
mg/L-h for aerobic, anaerobic and combined system, respectively. In comparison to
this study, the removal rates reported by Leal (2010) were three times lower. This is
because grey water contains large amount of colloidal COD as shown in Table 4.2. It
is known that colloidal fraction of COD is poorly removed, especially in the UASB
because it cannot be entrapped and flocculated in the sludge bed, and hence longer
hydraulic retention time (HRT) is required to digest colloidal COD. This
phenomenon was also supported by Elmitwali et al. (2000). However, the synthetic
wastewater employed in this study did not contain colloidal COD. Thus, it is
expected that the removal rate was quicker to digest the soluble COD. Despite the
lower removal rate, the removal efficiency from Leal̀ s study (2010) is higher than
that in the present study. This could be due to the longer HRT (12 h) in Leal`s study
which was greater than the duration employed in this study. Nevertheless, both
studies also showed that the combined system did not possess any advantages over
aerobic digestion, if compared in term of removal efficiency and digestion rate. In
fact, it should be highlighted that the combined system has advantages of methane
and low sludge production.
Table 4.2: Characteristics of Grey Water (Reference: Leal, 2010)
Concentration (mg/L)
CODtotal 833
CODsuspended 411 CODcolloidal 204 CODsoluble 224
Anionic surfactants Total N 41.2
NH4-N 1.0 NO3-N 0.12 Total P 6.6
36
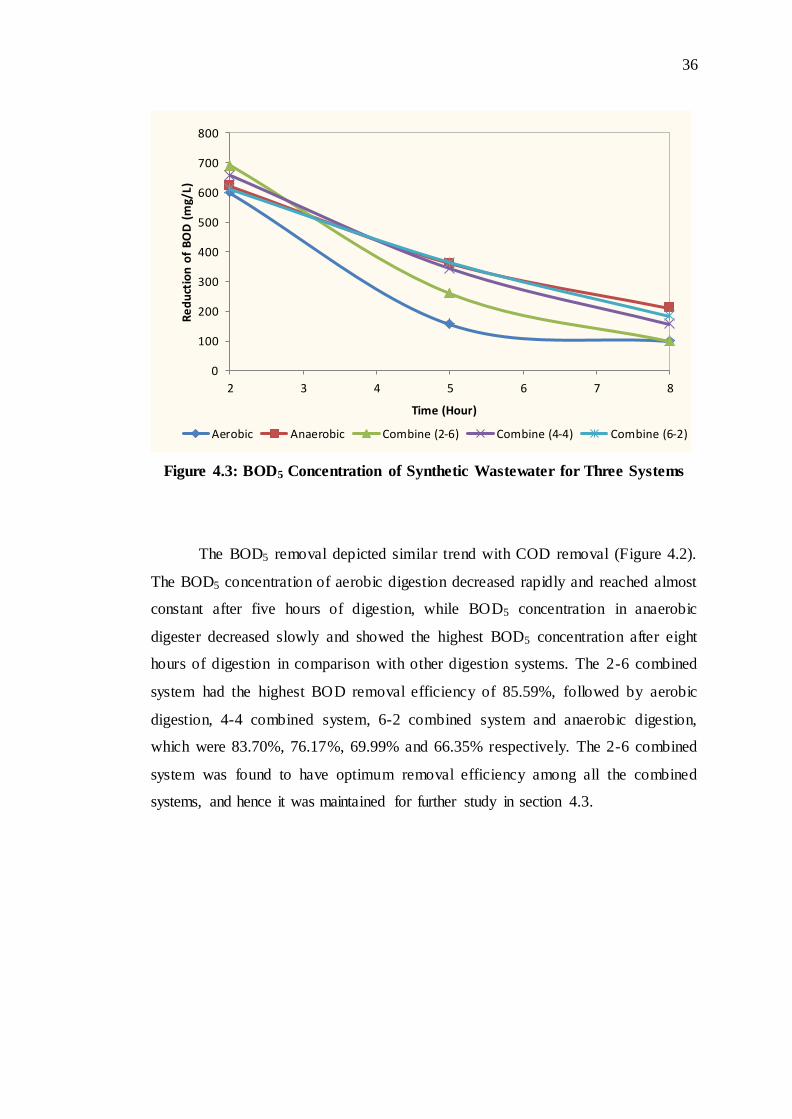
Figure 4.3: BOD5 Concentration of Synthetic Wastewater for Three Systems
The BOD5 removal depicted similar trend with COD removal (Figure 4.2).
The BOD5 concentration of aerobic digestion decreased rapidly and reached almost
constant after five hours of digestion, while BOD5 concentration in anaerobic
digester decreased slowly and showed the highest BOD5 concentration after eight
hours of digestion in comparison with other digestion systems. The 2-6 combined
system had the highest BOD removal efficiency of 85.59%, followed by aerobic
digestion, 4-4 combined system, 6-2 combined system and anaerobic digestion,
which were 83.70%, 76.17%, 69.99% and 66.35% respectively. The 2-6 combined
system was found to have optimum removal efficiency among all the combined
systems, and hence it was maintained for further study in section 4.3.
0
100
200
300
400
500
600
700
800
2 3 4 5 6 7 8
Re
du
ctio
n o
f B
OD
(m
g/L)
Time (Hour)
Aerobic Anaerobic Combine (2-6) Combine (4-4) Combine (6-2)

37
4.3 Effect of Initial COD Concentration in Three Systems
The initial COD concentration of wastewater was varied to give approximately 1420,
2160, 3330 and 4020 mg/L, and then treated in aerobic, anaerob ic and 2-6 combine
system. The COD concentration profiles of these three systems are shown in Figure
4.4 (a)-(c).
Figure 4.4 (a) revealed that the higher initial COD concentrations (4020, 3330
and 2160 mg/L) led to faster drop in the COD level in the aerobic digestion at the
early stage. On the other hand, it took longer to degrade the COD when the initial
COD concentration was 1420 mg/L. It was also found that the aerobic digestion
could remove 70 – 80% of COD for different initial concentrations (Table 4.3). The
COD reduction trend in Figure 4.4 (b) possessed the similar pattern as aerobic
digestion; however, the COD removal efficiency in anaerobic digestion was 35 –50%
only. Both of the results obtained for aerobic and anaerobic in this study were similar
to the findings from Magnaye (2009), Ping Zhou (2004), and Miquesleto (2004). In
the 2-6 combined system, the COD degraded slowly in anaerobic digester, but it
degraded rapidly in aerobic digester as illustrated in Figure 4.4 (c). The removal
efficiency was 60-78% in the 2-6 combined treatment.

38
(a)
(b)
(c)
Figure 4.4: Effect of Initial COD Concentration in (a) Aerobic Digestion, (b)
Anaerobic Digestion, (c) 2-6 Combined Digestion
Table 4.3: COD removal (%) for Different Initial Concentration in Three
Systems
Initial COD concentration (mg/L)
COD removal (%)
Aerobic Anaerobic 2-6 Combined
1420 80.28 49.30 78.41 2160 70.83 35.65 74.21 3330 73.87 41.44 65.97
4120 70.15 49.00 60.80
0
500
1000
1500
2000
2500
3000
3500
4000
4500
0 1 2 3 4 5 6 7 8
CO
D R
ed
uct
ion
Time (Hour)
0
500
1000
1500
2000
2500
3000
3500
4000
4500
0 1 2 3 4 5 6 7 8
CO
D R
ed
uct
ion
Time (Hour)
0
500
1000
1500
2000
2500
3000
3500
4000
4500
0 1 2 3 4 5 6 7 8
CO
D R
ed
uct
ion
Time (Hour)
1420 mg COD/L
2160 mg COD/L
3330 mg COD/L
4120 mg COD/L
39
4.4 Kinetics Studies
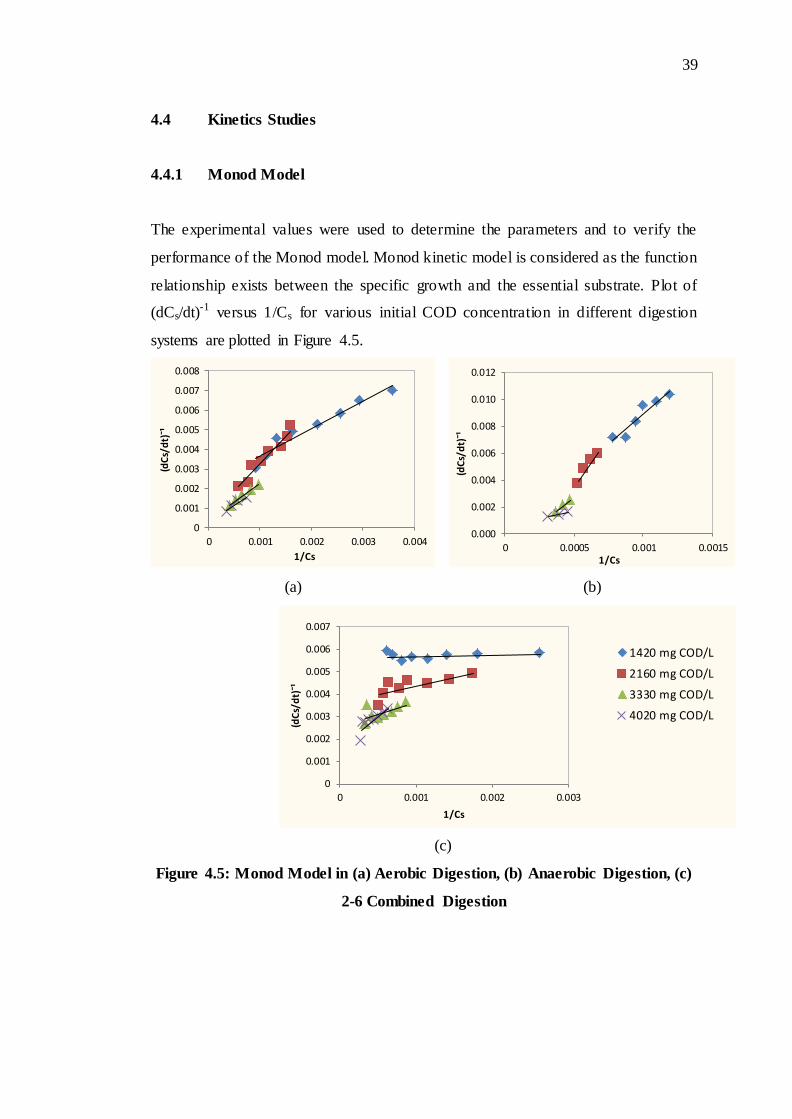
4.4.1 Monod Model
The experimental values were used to determine the parameters and to verify the
performance of the Monod model. Monod kinetic model is considered as the function
relationship exists between the specific growth and the essential substrate. Plot of
(dCs/dt)-1 versus 1/Cs for various initial COD concentration in different digestion
systems are plotted in Figure 4.5.
(a)
(b)
(c)
Figure 4.5: Monod Model in (a) Aerobic Digestion, (b) Anaerobic Digestion, (c)
2-6 Combined Digestion
0
0.001
0.002
0.003
0.004
0.005
0.006
0.007
0.008
0 0.001 0.002 0.003 0.004
(dC
s/d
t)¹̄
1/Cs
0.000
0.002
0.004
0.006
0.008
0.010
0.012
0 0.0005 0.001 0.0015
(dC
s/d
t)¹̄
1/Cs
0
0.001
0.002
0.003
0.004
0.005
0.006
0.007
0 0.001 0.002 0.003
(dC
s/d
t)¹̄
1/Cs
1420 mg COD/L
2160 mg COD/L
3330 mg COD/L
4020 mg COD/L

40
Table 4.4: Kinetic Parameters for the Monod Model in Three Systems
Digestion Scheme Initial COD concentration (mg/L)
1420 2160 3330 4020
Aerobic K1 (mg COD/L h) -500 -10000 -20000 1000 Ks (mg COD/L) -695.5 -28480 -36960 4863 R2 0.94 0.94 0.99 0.97
Anaerobic K1 (mg COD/L h) -100000 333.33 1000 -10000 Ks (mg COD/L) 886100 -4906.7 -8020 27660
R2 0.90 0.95 0.98 0.96 2-6 Combined
K1 (mg COD/L h) -200 -333.33 -500 -1000 Ks (mg COD/L) 12.4 259 509.5 2769
R2 0.09 0.61 0.37 0.69
Based on Table 4.3, the kinetic parameters, K1 and Ks, for aerobic and
anaerobic digestions were inconsistent. Therefore, the operating conditions were
unpredicted, even though the determination coefficient, R2, indicated value more
than 0.9. The R2 values for the 2-6 combined system were generally lower than 0.9,
in other words, the experimental data obtained did not fit into the Monod kinetic
model. In the combined system, the product of maximum specific degradation rate
and biomass concentration, K1, decreased as the initial COD concentration increased,
while half saturated constant, Ks, increased as the initial COD concentration
increased.
4.4.2 First Order Model
The First Order model was applied to the experimental data to verify the
performance of the model. The results of ln(Cs/Cso) versus time were plotted for
various initial substrate concentrations (Figure 4.6). It is found that the R2 values
larger than 0.9 for all cases. The values of rate constants in the First Order model
were found to increase in general with the increase in the initial COD concentration
for both aerobic and anaerobic digestion, except for initial COD concentration of
1420 mg/L in aerobic digestion. This was probably because the aerobic degradation
rate was faster for initial COD concentration of 1420 mg/L if compared with initial
COD concentration of 2160 mg/L. Nevertheless, the k1 value decreased as initial

41
COD concentration increased for 2-6 combined digestion. This was in agreement
with the results of Saravanan and Lakshmanan (2008).
(a)
(b)
(c)
Figure 4.6: First Order Model in (a) Aerobic Digestion, (b) Anaerobic Digestion,
(c) 2-6 Combined Digestion
Table 4.5: Kinetic Parameters for the First Order Model in Three Systems
Digestion Scheme Initial COD concentration (mg/L)
1420 2160 3330 4020
Aerobic k1 (h-1) 0.209 0.175 0.248 0.280 R2 0.99 0.90 0.97 0.96
Anaerobic k1 (h-1) 0.09 0.098 0.159 0.210
R2 0.98 0.94 0.91 0.98 2-6 Combined k1 (h-1) 0.163 0.157 0.134 0.116
R2 0.93 0.97 0.99 0.99
-2.5
-2
-1.5
-1
-0.5
0
0 2 4 6 8 10
ln(C
s/C
so)
Time (hour)
-1.8
-1.6
-1.4
-1.2
-1
-0.8
-0.6
-0.4
-0.2
0
0 2 4 6 8 10
ln(C
s/C
so)
Time (hour)
-1.8
-1.6
-1.4
-1.2
-1
-0.8
-0.6
-0.4
-0.2
0
0 2 4 6 8 10
ln(C
s/C
so)
Time (hour)
1420 mg COD/L
2160 mg COD/L
3330 mg COD/L
4020 mg COD/L
42
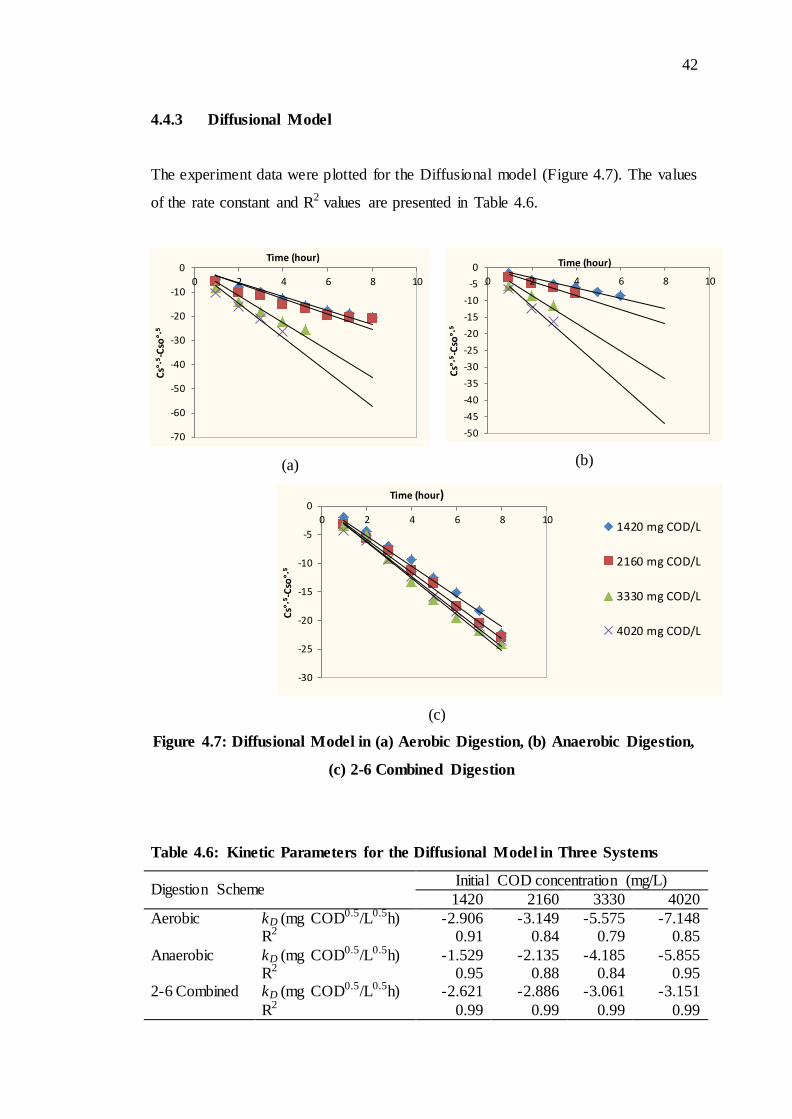
4.4.3 Diffusional Model
The experiment data were plotted for the Diffusional model (Figure 4.7). The values
of the rate constant and R2 values are presented in Table 4.6.
(a)
(b)
(c)
Figure 4.7: Diffusional Model in (a) Aerobic Digestion, (b) Anaerobic Digestion,
(c) 2-6 Combined Digestion
Table 4.6: Kinetic Parameters for the Diffusional Model in Three Systems
Digestion Scheme Initial COD concentration (mg/L)
1420 2160 3330 4020
Aerobic kD (mg COD0.5/L0.5h) -2.906 -3.149 -5.575 -7.148 R2 0.91 0.84 0.79 0.85
Anaerobic kD (mg COD0.5/L0.5h) -1.529 -2.135 -4.185 -5.855 R2 0.95 0.88 0.84 0.95
2-6 Combined kD (mg COD0.5/L0.5h) -2.621 -2.886 -3.061 -3.151
R2 0.99 0.99 0.99 0.99
-70
-60
-50
-40
-30
-20
-10
0
0 2 4 6 8 10
Cs°·⁵
-Cso
°·⁵
Time (hour)
-50
-45
-40
-35
-30
-25
-20
-15
-10
-5
0
0 2 4 6 8 10
Cs°·⁵
-Cso
°·⁵
Time (hour)
-30
-25
-20
-15
-10
-5
0
0 2 4 6 8 10
Cs°·⁵
-Cso
°·⁵
Time (hour)
1420 mg COD/L
2160 mg COD/L
3330 mg COD/L
4020 mg COD/L
43
The Diffusional model failed miserably in representing both aerobic and
anaerobic digestion of synthetic wastewater due to poor R2 value obtained. However,
the COD reduction profile in combined digestion was well explained by the
Diffusional model with high values of R2 (0.99) for all initial COD concentrations. It
was also found that the diffusional constant, kD, decreased as initial COD
concentration increased.
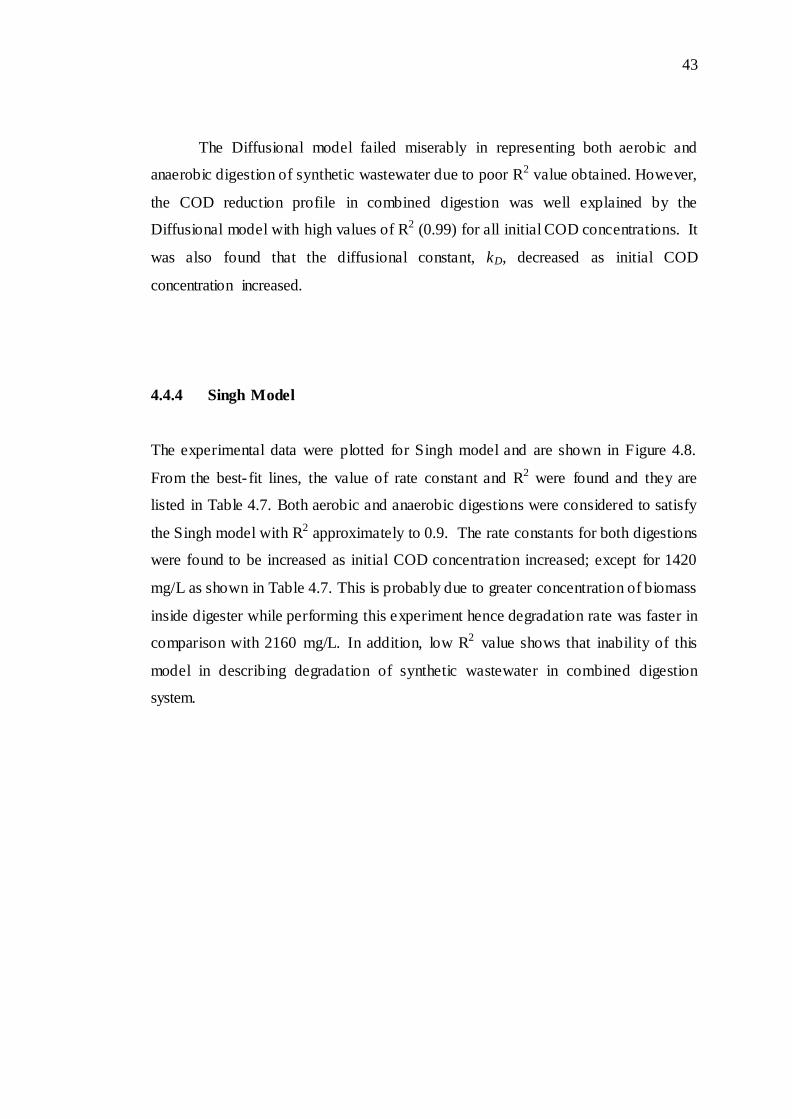
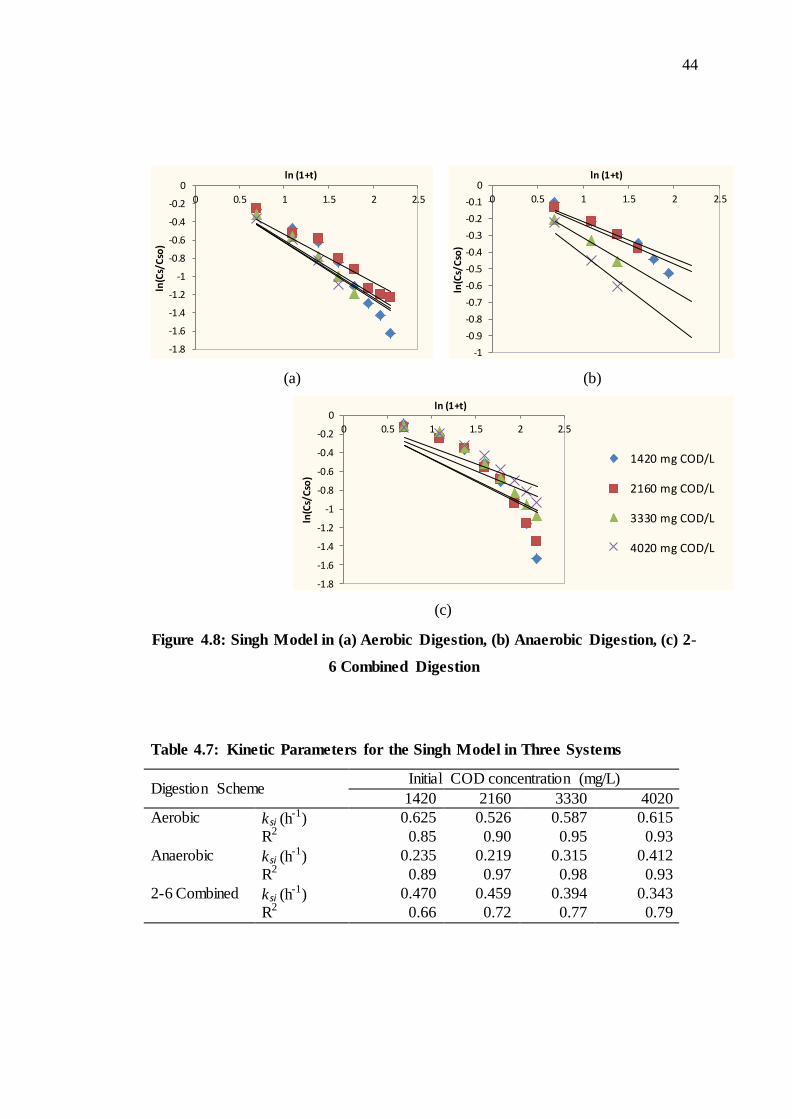
4.4.4 Singh Model
The experimental data were plotted for Singh model and are shown in Figure 4.8.
From the best- fit lines, the value of rate constant and R2 were found and they are
listed in Table 4.7. Both aerobic and anaerobic digestions were considered to satisfy
the Singh model with R2 approximately to 0.9. The rate constants for both digestions
were found to be increased as initial COD concentration increased; except for 1420
mg/L as shown in Table 4.7. This is probably due to greater concentration of biomass
inside digester while performing this experiment hence degradation rate was faster in
comparison with 2160 mg/L. In addition, low R2 value shows that inability of this
model in describing degradation of synthetic wastewater in combined digestion
system.
44
(a)
(b)
(c)
Figure 4.8: Singh Model in (a) Aerobic Digestion, (b) Anaerobic Digestion, (c) 2-
6 Combined Digestion
Table 4.7: Kinetic Parameters for the Singh Model in Three Systems
Digestion Scheme Initial COD concentration (mg/L)
1420 2160 3330 4020
Aerobic ksi (h-1) 0.625 0.526 0.587 0.615
R2 0.85 0.90 0.95 0.93
Anaerobic ksi (h-1) 0.235 0.219 0.315 0.412
R2 0.89 0.97 0.98 0.93
2-6 Combined ksi (h-1) 0.470 0.459 0.394 0.343
R2 0.66 0.72 0.77 0.79
-1.8
-1.6
-1.4
-1.2
-1
-0.8
-0.6
-0.4
-0.2
0
0 0.5 1 1.5 2 2.5
ln(C
s/C
so)
ln (1+t)
-1
-0.9
-0.8
-0.7
-0.6
-0.5
-0.4
-0.3
-0.2
-0.1
0
0 0.5 1 1.5 2 2.5
ln(C
s/C
so)
ln (1+t)
-1.8
-1.6
-1.4
-1.2
-1
-0.8
-0.6
-0.4
-0.2
0
0 0.5 1 1.5 2 2.5
ln(C
s/C
so)
ln (1+t)
1420 mg COD/L
2160 mg COD/L
3330 mg COD/L
4020 mg COD/L

45
CHAPTER 5
5 CONCLUSIONS AND RECOMMENDATIONS
5.1 Conclusions
Based on the experiments performed in three different biodegradation schemes, the
following conclusions were established:
a) The pH in aerobic digester was more alkaline than anaerobic digester after 8
hours of digestion process as CO2 produced was stripped by aeration in aerobic
digester, while anaerobic digestion was essentially stopped at acetogenesis and
acidogenesis processes, whereby volatile fatty acids (VFA) was produced
without being consumed by methanogenic bacteria. The study on pH and DO
profiles would be related in aerobic digestion due to nitrification and
denitrification activities.
b) The 2-6 combined system achieved the highest COD and BOD efficiencies
because VFA produced in anaerobic digestion could be easily digested by the
subsequent aerobic digestion. Aerobic digestion had higher COD and BOD
removal efficiencies and rates if compared with anaerobic digestion as anaerobic
process underwent fermentation activity only instead of respiration activity.
However, other combined scheme had lower COD and BOD removal
efficiencies and rates than aerobic digestion owing to slow degradation rate
occurred in anaerobic digestion as pre-treatment.

46
c) Aerobic digestion had 70 – 80% of COD removal efficiency when treated with
various initial COD concentrations of synthetic wastewater, while anaerobic
digestion achieved 35 – 50% and 2-6 combined schemes achieved 60 – 78%.
Consequently, it can be concluded that the combined system did not possess any
advantage over aerobic digestion in terms of COD removal.
d) Three of the digestion schemes did not fit with the Monod Kinetics Model.
However, both aerobic and anaerobic fitted well with the First Kinetics Model
and Singh Model, while the 2-6 combined schemes would be described nicely
using Diffusional Model and Singh Model.
5.2 Recommendations and Future Studies
There are three criteria to be compared in three digestion systems, which are COD
removal efficiency, sludge yield and bio-gas production. In fact, sludge yield and
bio-gas production were unable to be measured in this study due to limitation setup
of existing apparatus. Therefore, it is proposed that further investigation of these two
criteria can be carried out in anaerobic digestion by using fluidised reactor (e.g.
UASB) instead of the fixed bed reactor that used in this study. A well-mixed
wastewater that contains sludge can be obtained from UASB, and hence total
suspended solids (TSS) or volatile suspended solid (VSS) test can be performed.
Biogas can be collected and analysed, thus the recovery can be compared in terms of
anaerobic digestion and combined anaerobic-aerobic digestion.
In addition, other analysis tests are suggested to be performed throughout the
digestion process such as total kjhedal nitrogen (TKN), ammonia-chloride (NH4Cl),
orthophosphate, and alkali metals (e.g. Na, K, Ca, Mg). Therefore, a complete
nutrient degradation profiles can be obtained and studied. These analysis tests are
very important when comparing the performance and operating conditions (pH and
DO) in aerobic and anaerobic digestions.
47
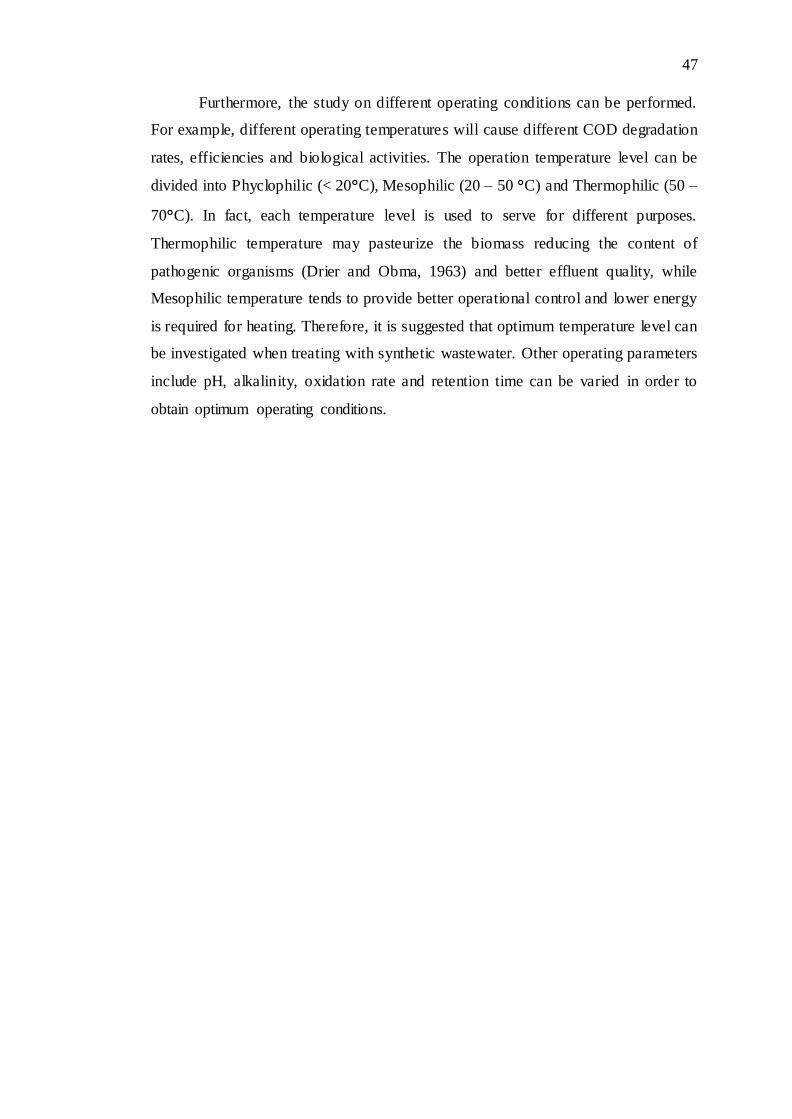
Furthermore, the study on different operating conditions can be performed.
For example, different operating temperatures will cause different COD degradation
rates, efficiencies and biological activities. The operation temperature level can be
divided into Phyclophilic (< 20°C), Mesophilic (20 – 50 °C) and Thermophilic (50 –
70°C). In fact, each temperature level is used to serve for different purposes.
Thermophilic temperature may pasteurize the biomass reducing the content of
pathogenic organisms (Drier and Obma, 1963) and better effluent quality, while
Mesophilic temperature tends to provide better operational control and lower energy
is required for heating. Therefore, it is suggested that optimum temperature level can
be investigated when treating with synthetic wastewater. Other operating parameters
include pH, alkalinity, oxidation rate and retention time can be varied in order to
obtain optimum operating conditions.

48
REFERENCES
American Public Health Association, American Water Works Association, Water Environment Federation, Clesceri, L.S., Greenberg, A.E., and Eaton, A.D. (1998).
Standard methos for examination of water and wastewater. Washington, DC: Author.
American Psychiatric Association. (1994). Diagnostic and statistical manual of mental disorders (4th ed.). Washington, DC: Author.
American Psychological Association. (2003). Electronic references. Retrieved October 8, 2006, from http://www.apastyle.org/ref.html.
Aivasidis, A. and Diamantis, V.I. (2005). Biochemical Engineering and Process Development in Anaerobic Waste. Adv Biochem Engin/Biotechnol, 92, 49-72.
Bunchanan, J.R. and Seabloom, R.W. (2005). Aerobic Treatment of Wastewater and Aerobic Treatment Units. University Curriculum Development for Decentralized
Wastewater Management. National Decentralized Water Resources Capacity Development Project. University of Arkansas, Fayetteville, AR.
Cervantes, F.J., Pavlostathis, S.G., van Haandel, A.C. (2006). Advanced Biological Treatment Processes for Industrial Wastewaters: Principles and Applications,
IWA Publishing.
Chan, Y.J., Chong, M.F., Law, C.L., Hassell, D.G. (2009), A review on anaerobic–
aerobic treatment of industrial and municipal wastewater. Chemical Engineering Journal, 155, 1-18.
Christopher, P. (2006). Unleashing change: A study of organizational renewal in
government. Administrative Science Quarterly, 51(2), 117-123. Retrieved October 8, 2006, from http://proquest.umi.com/ed32457.html
Clark, R.M. & Speece, R.E. (1971). The pH tolerance of anaerobic digestion. Proceeding of the 5th International Conference on water pollution research. Advances in water pollution research 11-27/ 1 to 14.
Cocci, A.A., Burke, B.F., Landine, C., Blickenstaff, D.L. (1991). Anaerobic–aerobic pretreatment of a dairy waste; a case history. Dairy, Food and Environmental
Sanitation, 11 (9), 505–509.

49
Drier, D.E. and Obma, C.A. (1963). Aerobic digestion of solids. Walker Process Equipment Co. Bulletin, 33-S-18194, Aurora, IL.
Duce, R.A. (2008). Impact of atmospheric anthropogenic nitrogen on the open ocean.
Science Journal.
Eckenfelder, W.W., Patoczka, J.B., & Pulliam, G.W. Anaerobic versus aerobic
treatment in the U.S.A. Retrieved August 9, 2010, from http://www.patoczka.net/Jurek%20Pages/Papers/Anaerobic%20vs%20Aerobic%20Treatment.pdf.
Elmitwalli, T. A., van Dun, M., Bruning, H., Zeeman, G., Lettinga, G. (2000). The role of filter media in removing suspended and colloidal particles in an anaerobic
reactor treating domestic sewage. Biosour. Technol, 72 (3), 235-242.
Erses, A.S., Onay, T.T., Yenigun, O. (2007). Comparison of aerobic and anaerobic degradation of municipal solid waste in bioreactor landfills. Biosource
Technology, 99, 5418-5426.
Friend of Earth. (2007). Briefing anaerobic digetion. Retrieve August 9, 2010, from
http://www.foe.co.uk/resource/briefings/anaerobic_digestion.pdf.
Frostell, B. (1983). Anaerobic–Aerobic Biological Treatment of Starch Industry Waste Waters. Starch—Stärke, 35, 185–189.
Gavala, H.N., Skiadas, I.V., Schmidt, J.E. and Ahring, B.K. (2003). Anaerobic granular sludge and biofilm reactors. Adv Biochemical Eng/Biotechnol, 82, 57-93.
Gavrilescu, M. and Macoveanu, M. (1999). Process engineering in biological aerobic wastewater treatment. Acta Biotechnol, 19 (2), 111–145.
Grady, L., Diagger, G., and Lim. (1990). Biological Wastewater Treatment., 2nd
Edition Marcel Dekker, Inc., New York, NY.
Gray, N.F. (2005). Water Technology: An Introduction for Enviromental Scientists and Engineers, Elsevier, Oxford.
Guiot, S.R. (1994). Anaerobic and aerobic integrated system for biotreatment of toxic wastes (canoxis). Retrieved August 9, 2010, from
http://www.freepatentsonline.com/5599451.html.
Hano, T., Matsumoto, M., Kuribayashi, K. & Hatate, Y. (1992). Biological nitrogen removal in a bubble column with a draught tube. Chemical Engineering Science,
47, 3737–3744.

50
Hassimi, A.H., Siti Rozaimah, S.B., Siti Kartom, K. and Noorhisham, T.K. (2010). Recognition of Relevant ORP, pH, and DO Bending Points in Ammonia Removal From Drinking Water through Online BAF system. International Journal of
Chemcal Engineering, 2010.
Heijnen, J.J., Mulder, A., Weltevrede, R., Hols, J., Vanleeuwen, H. (1991). Large
anaerobic-aerobic treatment of complex industrial-waste water using reactors. Water science and technology, 23, 1427-1436.
Isik, M. & Sponza, D.T. (2008). Anaerobic/aerobic treatment of a simulated
textilewastewater. Separation and Purification Technology, 60, 64–72.
Kassab, G., Halalsheh, M., Klapwijk,A., Fayyad,M. & Lier, J.B.V. (2010).
Sequential anaerobic–aerobic treatment for domestic wastewater. Biorsource Technology, 101, 3299-3310.
Kim, H. (2005). Comparative Studies of Aerobic and Anaerobic Landfills Using
Simulated Landfill Lysimeters. Ph.D. Thesis, University of Florida, USA.
Leal, L.H. (2010). Removal of Micropollutant From Grey Water. Retrieve March 21,
2011, from http://edepot.wur.nl/146492.
Last, S. (2006). The Magic of Combined Anaerobic Digestion with Composting of Municipal Solid Waste. Retrieved 9 August, 2010, from http://www.anaerobic-
digestion.com/Advantages_of_Combined_Digestion_and_Composting.pdf.
Lay, J.J., Li, Y.Y., Noike, T., Endo, J., and Ishimoto, S. (1997). Analysis of
environmental factors affecting methane production from high-solids organic waste. Wat.Sci. Tech., 36(6-7), 493-500.
Lettinga, C. (1995). Anaerobic digestion and wastewater treatment systems. Antonie
van Leeuwenhoek, 67, 3–28.
Lyberatis, G. and Skiadas, I.V. (1999). Modelling of an aerobic digestion – a review. Global NEST, 1, 63-76.
Magnaye, F.A., D.Gaspillo, P., Auresenia, J.L. (2009). Biological Nitrogen and COD removal of Nutrient-Rich Wastewater Using Aerobic and Anaerobic Reactors. J.
Water Resource and Protection, 1, 376-380.
Mak, J. (2006). More public holidays for workers. The Star, p. N6.
Martin, S., Smith, L., Forehand, M. R., Mobbs, R., Lynch, T. F., Renfrew, E. J., et al.
(2001). Use of collaborative technology in business. The Academy of Management Executive, 19, 130-138.

51
Metcalf and Eddy (1991). Wastewater Engineering: Treatment, 3rd Edition. McGraw-Hill, Inc., New York, NY.
Midwest Rural Energy Council. Anaerobic Digestion of farm and food processing
residues. Retrieve August 9, 2010, from http://www.mrec.org/biogas/adgpg.pdf.
Miqueleto, A.P., D. Rodrigues, J.A., Ratusznei, S.M., Foresti, E. and Zaiat, M.
(2005). Treatment of Easily Degrable Wastewater in a Stirred Anaerobic Sequencing Batch Biofilm Reactor. Water Research, 39, 2376-2384.
Monroy, H.O., Vazquez, F.M., Derramadero, J.C., Guyot, J.P. (1995). Anaerobic–
aerobic treatment of cheese wastewater with national technology in Mexico: the f‘‘ S z”. Water Science and Technology, 32 (12), 149–156.
Moosavi, G.R., Mesdaghinia, A.R., Naddafi, K., & Mahvi, A.H. (2004). Feasibility of development and application of an up-flow anaerobic/aerobic fixed bed combined reactor to treat high strength wastewaters. World Congress on
Anaerobic Digestion, 10, 2436–2440.
Nykova N., Muller T. G., Gyllenberg M., Timmer J. (2002). Quantitative analyses of
anaerobic wastewater treatment processes: identifiability and parameter estimation. Biotechnology and Bioengineering, 78 (1), 89-103.
O`Keefe, D.M. and Chynoweth, D.P. (2000). Influence of Phase Seperation,
Leachate Recycle and Aeration on Treatment of Municipal solid waste in Simulated Landfill Cells. Bioresource Technology, 72, 55-56.
Pang Zhou, M.ASMCE, Chengyi, S., BinWei, L. and Yi Qian (2004). Treatment of High-Strength Pharmaceutical Wastewater and removal of Antibiotics in Anaerobic and Aerobic Biological Treatment Processes. Journal of Enviromental
Engineering, 1, 129-136.
Playfair, J. H., and Bancroft, G. J. (2004). Infection and immunity. (2nd ed.). Oxford: Oxford University Press.
Pozo, R.D. and Diez, V. (2003). Organic matter removal in combined anaerobic–aerobic fixed-film bioreactors. Water Research, 37, 3561–3568.
Reginatto, V., Teixeira, R.M., Pereira, F., Schmidell, W., Furigo, J.A., Menes, R., Etchebehere, C. and Soares, H.M. (2005). Anaerobic ammonium oxidation in a bioreactor treating slaughterhouse wastewater. Brazilian Journal of Chemi-cal
Engineering, 22(4).
Reppel, F. G. (2003, February 13). Conflict and cognitive control. Natural Science,
33, 969-970.
52
Richard. (2008). Contaminants in waster water: Organics and gases. Retrieve August 7, 2010, from http://www.all-about-wastewater-treatment.com/2008/09.
Roeder, K., Howdeshell, J., Fulton, L., Lochhead, M., Craig, K., Peterson, R., et. al.
(1967). Nerve cells and insect behavior. Cambridge, MA: Harvard University Press.
Ros, M. and Zupancic, G.D. (2002). Thermophilic aerobic digestion of waste active sludge. Acta Chim. Slov., 49, 931-943. Retrieve August 8, 2010, from http://acta.chem-soc.si/49/49-4-931.pdf.
Ros, M. & Zupancic, G.D. (2004). Two-stage thermophilic anaerobic–aerobic digestion of waste-activatedsludge. Environmental Engineering Science, 21, 617–
626.
Saravanan, A.M. and Lakshmanan, S. (2008). Experimental Scrutinization on Treatment of Industrial Effluents and Models Representing the Kinetics for
Aerobic Digestion. International Journal of Engineering, 2, Issue 4.
Salsabil, M.R. (2008). Comparative Study of the Digestion of Urban Biological
Sludge Pretreated by Physical, Chemical and Thermal Properties: Applied to Reduce Sludge Production.
Schultz, T.E. (2005). Biological wastewater treatment. Retrieve August 8, 2010,
from http://www.water.siemens.com/SiteCollectionDocuments/Industries/Hydrocarbon
_Processing/Brochures/CE_10-05_biological_trt.pdf.
Seabloom, R.W. and Buchanan, J.R. (2005). Aerobic Treatment of Wastewater and Aerobic Treatment Units Text. Retrieve August 8, 2010, from
http://onsite.tennessee.edu/Aerobic%20Treatment%20&%20ATUs.pdf.
Seghezzo, L., Zeeman, G., Lier, J.B.V., Hamelers, H.V.M., Lettinga, G. (1998). A review: The anaerobic treatment of sewage in UASB and EGSB reactors.
BioresourceTechnology, 65, 175–190.
Serlin, R. C., & Lapsley, D. K. (1985). Rationality in psychological research: The
good-enough principle. American Psychologist, 40, 73-83.
Skinner, M. E., Sun, K. F., & Liu, R. P. (2005). Small group learning, Psychological Bulletin, 26, 57-63.
Sponza, D.T. & Demirden, P. (2007). Treatability of sulfamerazine in sequential upflow anaerobic sludge blanket reactor (UASB)/completely stirred tank reactor
(CSTR) processes. Separation and Purification Technology, 56, 108–117.

53
The AD Community (2007). Advantages and Disadvantages of Anaerobic Treatment. Retrieved on March 3, 2011, from http://www.anaerobic-digestion.com/html/pros___cons.html
Tezel, U., Guven, E., Erguder, T.H., & Demirer, G.H. (2001). Sequential (anaerobic/aerobic) biological treatment of dalaman SEKA Pulp and Paper
Industry effluent. Waste Management, 21,717–724.
Vera, M., Aspe, E., Marti, M.C.& Roeckel, M. (1999). Optimization of a sequential anaerobic–aerobic treatment of a saline fishing effluent. Process Safety and
Environmental Protection, 77, 275–290.
Verheyen, L.A.H.M., Wiersema, D., Hulshoff-Pol, L.W., Brandjes, P., Westra, P.J.,
Bos, J.F.F.P. and Jansen J.C.M. (1996). Management of waste from animal product processing. Retrieve August 8, 2010, from http://www.fao.org/WAIRDOCS/LEAD/X6114E/x6114e03.htm
Walker, M. M. (2001). Transfer of lexical information in adults with reading disorders. Perceptual and Motor Skills, 93 (1), 257-267.
Yeoh, B.G. (1995). Anaerobic treatment of industrial wastewaters in Malaysia, in: Post Conference Seminar on Industrial Wastewater Management in Malaysia, Kuala Lumpur, Malaysia.
Zeeman, G., Temmink, H., Marques, A. and Buisman, C. (2009). Biological Treatment of Grey Wastewater: Comparison of three systems. Retrieve August 8,
2010, from http://www.sanitation-challenge.wur.nl/NR/rdonlyres/15D1C7DB-AF46-403A-8FCB-51ECBA46339A/64958/Theme4Session5Hernandez.pdf

54
APPENDICES
APPENDIX A: MSDS Sheet

55
Chemical Safety Data: Potassium dichromate
Common synonyms
None
Formula K2Cr2O7
Physical properties
Form: orange-red crystalline solid Stability: Stable Melting point: 398 C Boiling point: 500 C Specific gravity: 2.68
Principal hazards
Potassium dichromate is toxic if swallowed, inhaled or absorbed through the skin. It is corrosive and may produce severe eye damage.
Chromium (VI) compounds are carcinogens. Potassium dichromate may act as a sensitizer.
This material is a strong oxidizing agent and reacts vigorously or explosively with a wide variety of reducing agents.
Safe handling
Wear safety glasses and gloves. Work in a well ventilated area, preferably using a fume cupboard. Ensure that any spills are cleaned up without delay. "Chromic acid" baths, which were once widely used for cleaning glassware, should not be used unless (a) there is no alternative available for cleaning, and (b) a suitable procedure has been determined BEFORE work starts for disposing of waste. Note that, since chromium (VI) is a carcinogen, used chromic acid cannot be disposed of down the drains. Chromic acid is, in any case, a very dangerous material and should not be used unless it is absolutely necessary.
Emergency Eye contact: Immediately flush the eye with water. Call for medical help. Skin contact: Wash off with soap and water. If swallowed: Call for medical help.
Disposal Store for later disposal as solid waste. Ensure that the container is marked both with the name of the chemical and a statement that it is a strong oxidizer and a carcinogen.
Protective equipment
Safety glasses, gloves.

56
APPENDIX B: Sample Calculations
1. BOD Concentration (mg/L)
Table 1: Dissolve Oxygen (DO) in Aerobic Digestion
Time
(h)
Sample Wastewater
Volume (mL)
DOf
(mg/L)
DOi
(mg/L)
BOD5
(mg/L)
Average
(mg/L)
2
0.5 7.35 8.06 424.56
597.92 1 5.72 7.88 648.52
2 3.02 7.82 720.68
5
1 7.49 7.78 87.02
154.15 2 7.29 8.02 109.89
5 3.29 7.72 265.56
8
2 7.23 7.88 96.78
97.59 5 6.46 8.24 106.56
10 5.12 8.10 89.45
By referring to the column of 2 hours and sample wastewater of 0.5 mL:
, where
DOi = Initial Dissolve Oxygen
DOf = Dissolve Oxygen after 5 days
Average of BOD5 for 2 hours of digestion in aerobic:
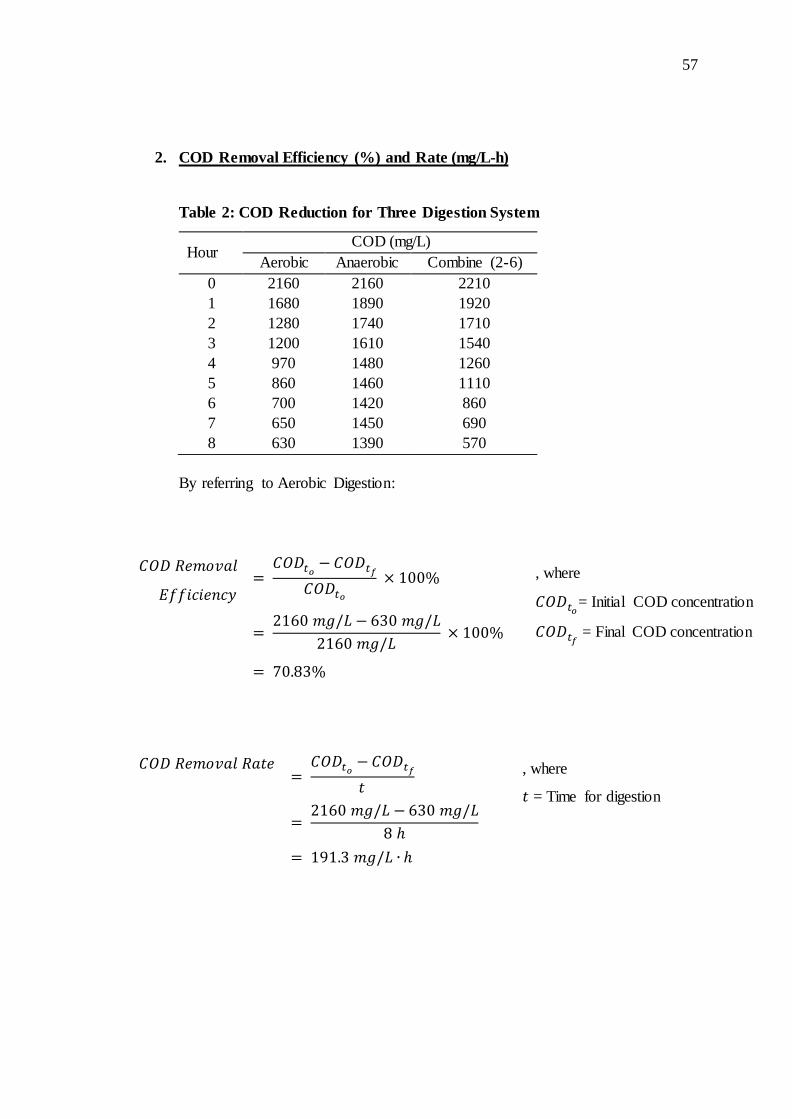
57
2. COD Removal Efficiency (%) and Rate (mg/L-h)
Table 2: COD Reduction for Three Digestion System
Hour COD (mg/L)
Aerobic Anaerobic Combine (2-6)
0 2160 2160 2210
1 1680 1890 1920
2 1280 1740 1710
3 1200 1610 1540
4 970 1480 1260
5 860 1460 1110
6 700 1420 860
7 650 1450 690
8 630 1390 570
By referring to Aerobic Digestion:
, where
= Initial COD concentration
= Final COD concentration
, where
= Time for digestion

58
APPENDIX C: Results of Grey Wastewater Treatment (Reference: Leal, 2010)

59
APPENDIX D: Review on Anaerobic-aerobic Digestion using High Rate Reactor
(Reference: Chan et al., 2009)
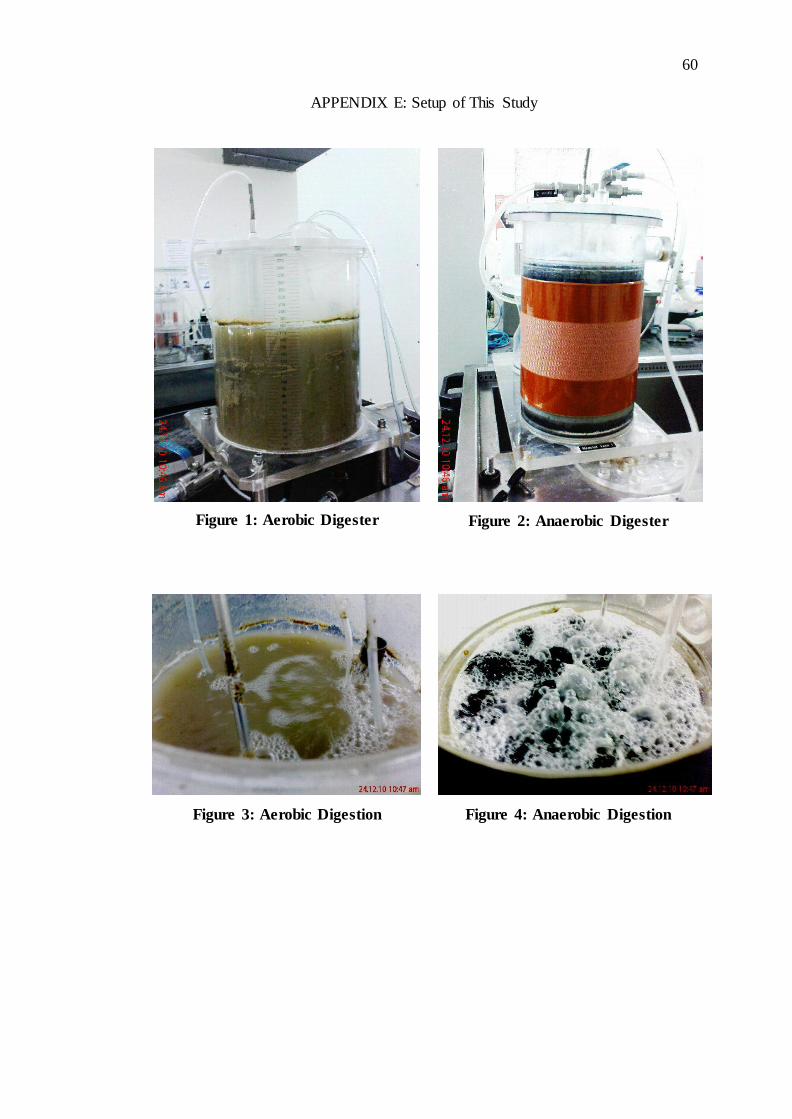
60
APPENDIX E: Setup of This Study
Figure 1: Aerobic Digester
Figure 2: Anaerobic Digester
Figure 3: Aerobic Digestion
Figure 4: Anaerobic Digestion

61
Figure 5: Bio Balls Seeded with Anaerobic Sludge
Figure 6: Aerobic Treated Wastewater
Figure 7: Anaerobic Treated
Wastewater

62
Figure 8: Comparison between Aerobic and Anaerobic Treated Wastewater
Figure 9: COD Analysis Tests
Figure 10: BOD Analysis Tests