Embed Size (px)
Citation preview

The 2014 Big Four Firm Performance Analysis January 2015 www.Big4.com Page 1 of 34
THE 2014 BIG FOUR FIRMS PERFORMANCE ANALYSIS
An Analysis Of The 2014 Financial Performance Of The World’s Largest Accounting Firms By Big4.com January 2015
The 2013 Big Four Firm Performance Analysis January 2015 www.Big4.com Page 2 of 34
THE 2014 BIG FOUR FIRMS PERFORFMANCE ANALYSIS - EXECUTIVE SUMMARY
Deloitte, EY, KPMG and PwC: Revenues Accelerate in 2014 to a Record $120 Billion
Growth in 2014 accelerated for the Big Four accounting firms: Deloitte & Touche, Ernst & Young (EY), KPMG and PricewaterhouseCoopers (PwC) following moderate growth in 2013, as Americas and Advisory delivered exceptional performance and Audit returned to positive growth. In 2009, combined revenue of $94 billion fell 7% from 2008’s record of $101 billion, but stabilized as 2010 revenue increased 1.4% to $95 billion. 2011 revenue rose 9% to $103 billion. Strong momentum helped 2012 revenues increase 6% to $110 billion. 2013 revenue growth slowed to 3.1% but to a record $113.7 billion. 2014 revenues grew 5.8% to a record $120.3 billion.
Big Four firms leveraged good GNP growth in all global economies to realize accelerated performance in 2014, to match our 6% growth expectations. Revenue grew 5.8% to a record of $120.3 billion, at a rate higher than 2013 and matching 2012. Revenue growth was uniformly strong across service lines and geographies as the audit environment eased, tax and consulting demand improved and Americas and Europe offset difficult Asian conditions.
Interestingly, revenue growth rates for all firms was in a tight band of 5.7% to 6.0% in US dollar terms. EY and KPMG were joint growth leaders with 6.0% increase. PwC grew slightly faster than Deloitte reaching 2014 revenues of $33.952 billion, $248 million less than Deloitte’s $34.2 billion. Thus Deloitte retained its leadership position as the largest accounting firm on the planet.
In 2013 EY’s strong performance was way above all its peers. In 2014, that lead diminished but EY did have solid growth in all service lines and all geographies. KPMG and PwC’s growth noticeably accelerated in 2014 from a slow rise in 2013. Deloitte continued its strong growth trajectory. EY widened its revenue gap against KPMG. Audit, Americas and Europe revenues all exceeded the $50 billion milestone in 2014.
In terms of geography, Americas have 43% and highest share of global combined revenues, retaining its top spot over Europe for the second consecutive year. From 2013 to 2014, Americas had a strong performance growth of 6.5%, following 6.8% growth in 2013. Europe has 42% of combined firm revenues and had the strongest growth in the last six years. Revenues accelerated to 7.8% from 2013 to 2014, after 1.4% and 3.2% in last two years. Asian revenues shrank for the second year in a row with 0.7% decline in 2014 following a 1.3% decline in 2013.
By service line, Audit accounts for 42% of total revenues and grew a solid 2.4% from 2013 to 2014 after a 0.2% growth in 2013. Tax services are 23% of total revenues and rose 6.2% in 2014 after rising 3.6% from 2012 to 2013. Advisory services have 35% of total revenues in 2014, with revenues accelerating by a strong 9.9% in 2014 after growing 6.8% from 2012 to 2013.
Foreign exchange had minimal impact at the firm level, but was very pronounced at regional levels. Asian growth in US dollar terms was severely negatively impacted by depreciating Asian currencies while Europe growth was positively impacted owing to appreciating Euro currencies.
The firms employ 756,000 staff globally, with 39,000 partners overseeing 580,000 professionals. Net employment increased by 32,000 from 2013 to 2014 with high levels of intake and attrition.
The outlook for 2015 and beyond is optimistic, revenue is expected to grow at a solid pace, with help from Americas, specialized Audit and Tax services, continued regulations, conversions to IFRS and from recent Advisory acquisitions. 2015 will also prove whether Deloitte can continue to be the leader and whether EY can extend its strong growth trajectory. The impact of strengthening US dollar will be felt in 2015.
The 2014 Big Four Firm Performance Analysis January 2015 www.Big4.com Page 3 of 34
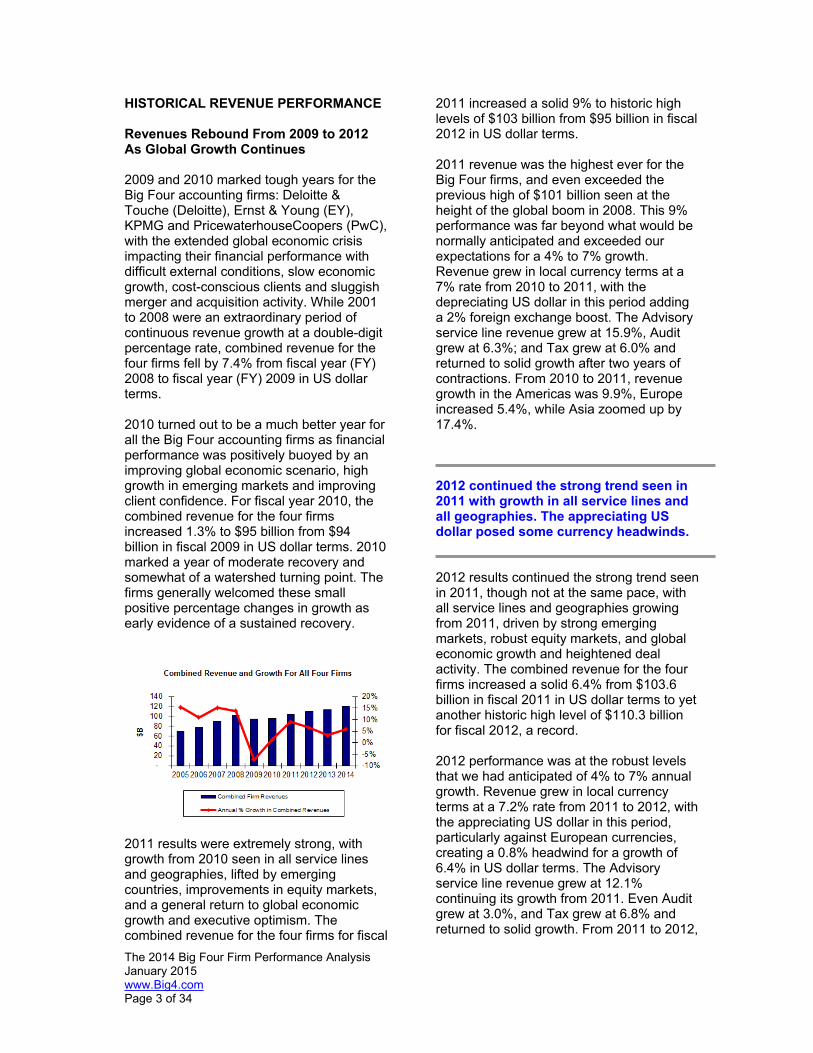
HISTORICAL REVENUE PERFORMANCE Revenues Rebound From 2009 to 2012 As Global Growth Continues 2009 and 2010 marked tough years for the Big Four accounting firms: Deloitte & Touche (Deloitte), Ernst & Young (EY), KPMG and PricewaterhouseCoopers (PwC), with the extended global economic crisis impacting their financial performance with difficult external conditions, slow economic growth, cost-conscious clients and sluggish merger and acquisition activity. While 2001 to 2008 were an extraordinary period of continuous revenue growth at a double-digit percentage rate, combined revenue for the four firms fell by 7.4% from fiscal year (FY) 2008 to fiscal year (FY) 2009 in US dollar terms. 2010 turned out to be a much better year for all the Big Four accounting firms as financial performance was positively buoyed by an improving global economic scenario, high growth in emerging markets and improving client confidence. For fiscal year 2010, the combined revenue for the four firms increased 1.3% to $95 billion from $94 billion in fiscal 2009 in US dollar terms. 2010 marked a year of moderate recovery and somewhat of a watershed turning point. The firms generally welcomed these small positive percentage changes in growth as early evidence of a sustained recovery.
2011 results were extremely strong, with growth from 2010 seen in all service lines and geographies, lifted by emerging countries, improvements in equity markets, and a general return to global economic growth and executive optimism. The combined revenue for the four firms for fiscal
2011 increased a solid 9% to historic high levels of $103 billion from $95 billion in fiscal 2012 in US dollar terms. 2011 revenue was the highest ever for the Big Four firms, and even exceeded the previous high of $101 billion seen at the height of the global boom in 2008. This 9% performance was far beyond what would be normally anticipated and exceeded our expectations for a 4% to 7% growth. Revenue grew in local currency terms at a 7% rate from 2010 to 2011, with the depreciating US dollar in this period adding a 2% foreign exchange boost. The Advisory service line revenue grew at 15.9%, Audit grew at 6.3%; and Tax grew at 6.0% and returned to solid growth after two years of contractions. From 2010 to 2011, revenue growth in the Americas was 9.9%, Europe increased 5.4%, while Asia zoomed up by 17.4%. 2012 continued the strong trend seen in 2011 with growth in all service lines and all geographies. The appreciating US dollar posed some currency headwinds. 2012 results continued the strong trend seen in 2011, though not at the same pace, with all service lines and geographies growing from 2011, driven by strong emerging markets, robust equity markets, and global economic growth and heightened deal activity. The combined revenue for the four firms increased a solid 6.4% from $103.6 billion in fiscal 2011 in US dollar terms to yet another historic high level of $110.3 billion for fiscal 2012, a record. 2012 performance was at the robust levels that we had anticipated of 4% to 7% annual growth. Revenue grew in local currency terms at a 7.2% rate from 2011 to 2012, with the appreciating US dollar in this period, particularly against European currencies, creating a 0.8% headwind for a growth of 6.4% in US dollar terms. The Advisory service line revenue grew at 12.1% continuing its growth from 2011. Even Audit grew at 3.0%, and Tax grew at 6.8% and returned to solid growth. From 2011 to 2012,
The 2013 Big Four Firm Performance Analysis January 2015 www.Big4.com Page 4 of 34
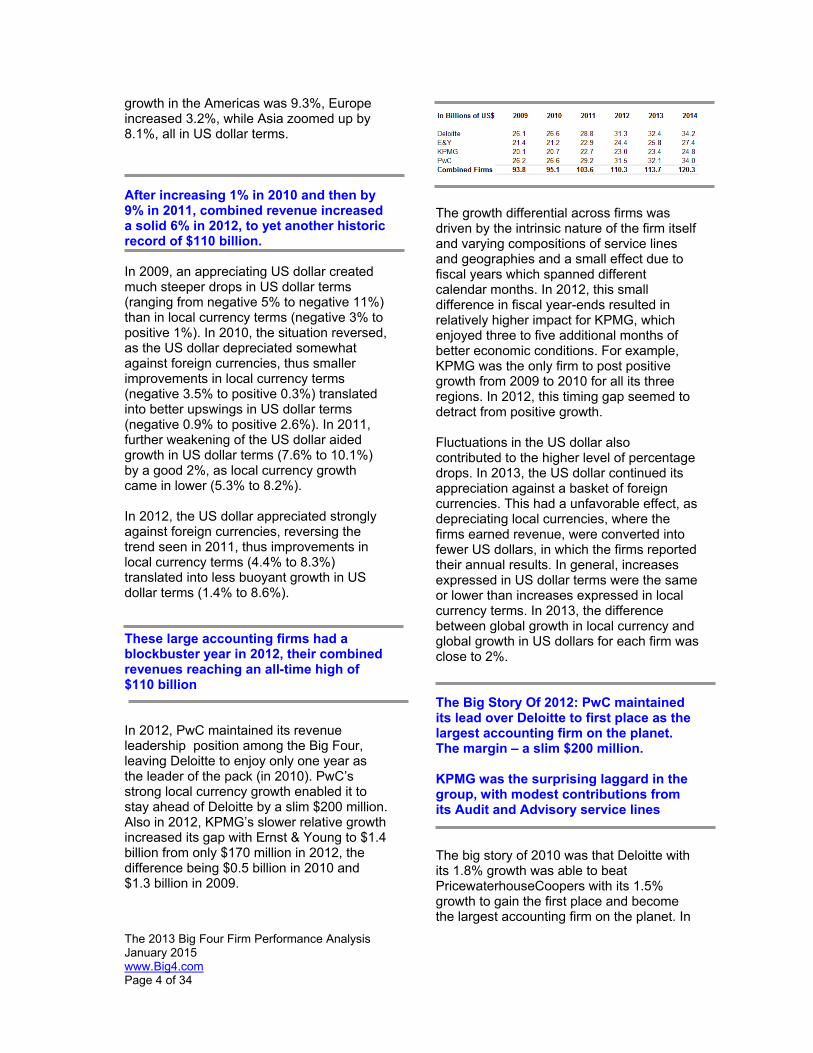
growth in the Americas was 9.3%, Europe increased 3.2%, while Asia zoomed up by 8.1%, all in US dollar terms. After increasing 1% in 2010 and then by 9% in 2011, combined revenue increased a solid 6% in 2012, to yet another historic record of $110 billion. In 2009, an appreciating US dollar created much steeper drops in US dollar terms (ranging from negative 5% to negative 11%) than in local currency terms (negative 3% to positive 1%). In 2010, the situation reversed, as the US dollar depreciated somewhat against foreign currencies, thus smaller improvements in local currency terms (negative 3.5% to positive 0.3%) translated into better upswings in US dollar terms (negative 0.9% to positive 2.6%). In 2011, further weakening of the US dollar aided growth in US dollar terms (7.6% to 10.1%) by a good 2%, as local currency growth came in lower (5.3% to 8.2%). In 2012, the US dollar appreciated strongly against foreign currencies, reversing the trend seen in 2011, thus improvements in local currency terms (4.4% to 8.3%) translated into less buoyant growth in US dollar terms (1.4% to 8.6%). These large accounting firms had a blockbuster year in 2012, their combined revenues reaching an all-time high of $110 billion In 2012, PwC maintained its revenue leadership position among the Big Four, leaving Deloitte to enjoy only one year as the leader of the pack (in 2010). PwC’s strong local currency growth enabled it to stay ahead of Deloitte by a slim $200 million. Also in 2012, KPMG’s slower relative growth increased its gap with Ernst & Young to $1.4 billion from only $170 million in 2012, the difference being $0.5 billion in 2010 and $1.3 billion in 2009.
The growth differential across firms was driven by the intrinsic nature of the firm itself and varying compositions of service lines and geographies and a small effect due to fiscal years which spanned different calendar months. In 2012, this small difference in fiscal year-ends resulted in relatively higher impact for KPMG, which enjoyed three to five additional months of better economic conditions. For example, KPMG was the only firm to post positive growth from 2009 to 2010 for all its three regions. In 2012, this timing gap seemed to detract from positive growth. Fluctuations in the US dollar also contributed to the higher level of percentage drops. In 2013, the US dollar continued its appreciation against a basket of foreign currencies. This had a unfavorable effect, as depreciating local currencies, where the firms earned revenue, were converted into fewer US dollars, in which the firms reported their annual results. In general, increases expressed in US dollar terms were the same or lower than increases expressed in local currency terms. In 2013, the difference between global growth in local currency and global growth in US dollars for each firm was close to 2%. The Big Story Of 2012: PwC maintained its lead over Deloitte to first place as the largest accounting firm on the planet. The margin – a slim $200 million. KPMG was the surprising laggard in the group, with modest contributions from its Audit and Advisory service lines The big story of 2010 was that Deloitte with its 1.8% growth was able to beat PricewaterhouseCoopers with its 1.5% growth to gain the first place and become the largest accounting firm on the planet. In
The 2013 Big Four Firm Performance Analysis January 2015 www.Big4.com Page 5 of 34
2009, PwC was narrowly ahead of Deloitte, but Deloitte’s 2010 revenues of $26.578 billion was ahead of PwC’s 2010 revenues of $26.569 billion by an ultra-slim but very significant $9 million. In 2011, the situation of the previous year reversed. PwC posted 10.0% growth in US dollar terms and 8.2% in local currency terms. Both were ahead of Deloitte, which recorded 8.4% in US dollar terms and 7.7% in local currency terms. The result – PwC’s 2011 revenues zoomed to $29.223 million, a good $423 million more than Deloitte’s 2011 revenues of $28.800 million. In 2012, 2011’s situation continued. PwC posted 7.8% growth in US dollar terms and 8.0% in local currency terms. Both were behind Deloitte, which recorded 8.6% in US dollar terms and 8.3% in local currency terms. Yet, the result – PwC’s 2012 revenues zoomed to $31.5 billion, a slim but significant $200 million more than Deloitte’s 2012 revenues of $31.3 billion. In 2012, interestingly, PwC had lower growth in US dollar and local currency terms than Deloitte, but its larger size in 2011 offset this lower growth differential, and while reducing the gap to $200 million, still enabled the firm to hold first place. Nevertheless, Deloitte had proven in the last few years that it is a strong contender for the leadership position. In 2012, Ernst & Young took the third spot at $24.4 billion, and KPMG maintained its position as the smallest of the Big Four firms at $23.0 billion, a good $1.4 billion behind, as the gap increased against EY. Interestingly, KPMG posted relatively lower growth against EY in every service line and each geography. Combined firm revenues grew 14% CAGR from 2004 to 2008 and 8% CAGR from 2004 to 2014 The Big Four firms have had an astonishing run up in total revenues over the last nine years. In 2004, combined firm revenues were only $60 billion, but by 2008, this had moved up at a compounded annual growth
rate of 14% to exceed $100 billion; and then subsided to 2009. Some of this gain was from the collapse of Andersen, as Andersen’s $10 billion or so of revenues in 2002 was generally redistributed over the remaining four firms. Beyond this, the global financial boom in the middle of the decade, combined with assertive penetration into emerging economies provided the engine for revenue increases. 2014 has seen the result of this penetration into clients and emerging economies, with record high results for all firms being realized.
This positive trend rapidly reversed in 2009, the first time in six years, as economies all over the world came to an abrupt halt in mid-2008, with many countries going into recessions, and ultimately affecting the seemingly unstoppable growth in Big Four firm revenues. Even with this drop in 2009, the six year compounded annual growth rate from 2004 to 2012 was 8%, a remarkable achievement, given that these multi-billion dollar enterprises had to grow their size by nearly 60% from a high starting point by either finding new revenue opportunities or penetrating current clients. With the additional small growth boost in 2013, the eight-year CAGR has moved to around 7% from 2004 to 2013 and back to 8% for 2004 to 2104 time frame. The Big Four firms provide only very high level financial information with minimum commentary,
The 2013 Big Four Firm Performance Analysis January 2015 www.Big4.com Page 6 of 34
One aspect to take note - despite being auditors for the world’s public companies, who are themselves required to report extensive details on their financials, the Big Four firms provide only very high level financial information with minimum commentary, with consequent impact on the depth of possible analysis in our study. 2013 FIRM PERFORMANCE For the four firms combined, 2013 revenues of $113.7 billion were 3.2% higher in US dollar terms than the 2012 combined revenues of $110.3 billion. This was yet another historic revenue record. In local currency terms, revenue grew at 5.2% from 2012 to 2013, the US dollar appreciating against foreign currencies during fiscal year 2013 shaved off a good 2% growth when reported in US dollar terms, the preferred reporting currency of all the Big Four firms. While 2013 did post creditable growth, the level of annual growth did slow considerably from previous years. Firms pointed to a tough environment for Audit, lower global M&A activity, and difficult economic conditions in Asia. The impact of all these factors was very visible in the subdued growth figures compared to previous years. Growth in 2013 was moderate compared to prior years. Combined Big Four firms reached another record of $113 billion 2013 turned out to be a very different year from 2012, with several highlightable trends: The Audit service growth slowed down to a halt. From 2012 to 2013, Audit revenues grew only 0.2% in US dollar terms to $49 billion. Even in local currency terms, Audit grew only by 2% from 2012 to 2013. For KPMG and PwC, Audit actually shrank with growth rates of negative 1.0% and negative 0.7% respectively. All firms explained this in terms of a very tough audit environment and strong inter firm competition. The Tax service line on the other hand, continued its string of good growth, posting
revenue growth of 3.6% from 2012 to 2013, following 6.0% and 6.8% in the two previous years. Firms pointed to strong client demand and were optimistic about future prospects. The Advisory service line also slowed considerably, growing by only 6.8% from 2012 to 2013, far below the double-digits growth seen in previous years of 15.9% and 12.1%. 2013 growth performance varied across service lines and geographies. Audit was flat, while Asian growth was negative. An appreciating US dollar led to lower annual growth % in US dollar terms Americas reported continued strong growth, with 2013 revenues of $48 billion increasing 6.8% from $45 billion in 2012. With the US economy improving in recent years, this region has shown steady growth following 9.9% and 9.3% in previous years. EY had its best years in 2013 since 2008. EY revenues of $25.829 billion grew from $24.420 billion 7.7% in local currency terms and 5.7% in US dollar terms. This was the best performance among all the Big 4 firms and enabled EY to capture all but one accolade in our growth stars competition; and solidifying its third position. Further, it widened EY’s revenue gap from KPMG from just $170 million in 2011 to $2.4 billion in 2013. KPMG continues as the smallest of the Big Four firms. Deloitte became the largest accounting firm on the planet, beating PwC on revenue in 2013. Deloitte gained this spot for the first time ever in 2010, but lost to PwC in 2011 and 2012. In 2013, Deloitte’s revenues grew 3.5% from 2012 while PwC’s revenue grew only 1.8%, thus Deloitte exceeded PwC’s revenuesby $311 million in 2013 compared to a deficit of $200 million in 2012.
The 2013 Big Four Firm Performance Analysis January 2015 www.Big4.com Page 7 of 34
Leader Alert: Deloitte became the largest accounting firm on the planet, beating PwC on revenue terms in 2014 2013 saw a lot of acquisition activity by the Big Four firms in the Advisory space. Notably, Deloitte bought Monitor, and PwC bought and consolidated Booz, KPMG made several acquisitions, while EY made no large acquisitions, keeping its growth wholly organic. There was considerable variation in the growth rates of all firms from 2012 to 2013. In US dollar terms from 2012 to 2013, Deloitte grew 3.5%, EY 5.7%, KPMG 1.7% and PwC 1.8% for a combined rate of 3.2%. In local currency dollar terms from 2012 to 2013, Deloitte grew 5.6%, EY 7.7%, KPMG 3.7% and PwC 4.0% for a combined rate of 5.2%. Thus the appreciating US dollar in the 2013 fiscal year had a uniformly negative 2% impact on revenue growth for all firms. We had forecasted 4% to 7% growth in revenues from 2012 to 2013, however actual results of 3.2% came in lower than our expectations. Audit service line was flat and Advisory slowed down faster than anticipated. Moreover, the impact of the Asian slowdown had a much stronger impact than our forecast, Asian revenues actually shrunk from 2012 to 2013. Revenue growth in 2013 turned out to be more variable than in prior years and it appeared that the nascent global recovery was having a delayed impact on firm growth profiles. In general, the firms’ 2013 results were below our expectations of 4% to 7% growth. KPMG had the slowest growth rate, while EY grew the fastest There was some drama owing to the somewhat close race between Deloitte and PwC. After Deloitte reported on September 16, 2013, PwC’s revenue threshold became quite clear, and as it reported on October 8, 2013, it became evident that PwC’s
revenues had not exceeded Deloitte and it had lost the crown as the largest accounting firm. 2014 FIRM PERFORMANCE
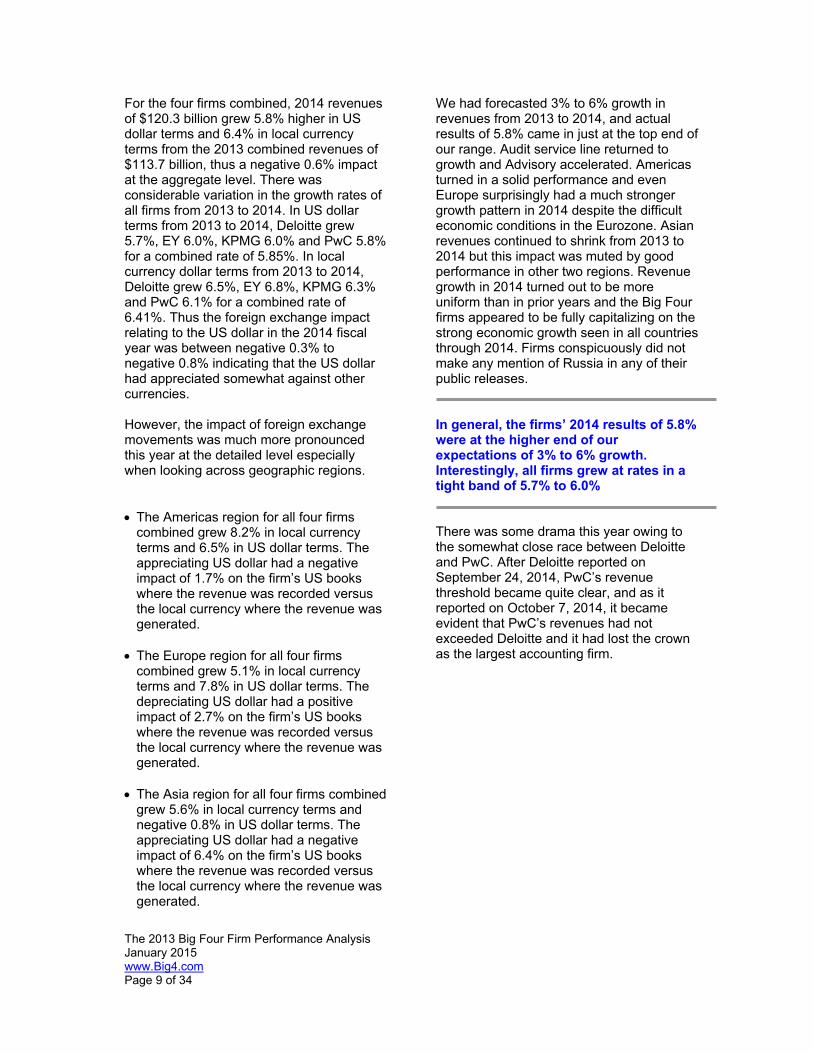
2014 Growth Accelerates Remarkably from 2013 Deloitte’s fiscal 2014 ended on May 31, 2014, EY and PwC’s fiscal 2014 ended on June 30, 2014 and KPMG was the last to close out the fiscal year 2014 on September 30, 2014. Deloitte was the first firm to report this year on September 24, 2014, followed by EY on, September 26, 2014, PwC on October 7, 2014 and KPMG was the last to report on December 12, 2014.
For the four firms combined, 2014 revenues of $120.3 billion were 5.8% higher in US dollar terms than the 2013 combined revenues of $113.7 billion. This was yet another historic revenue record. In local currency terms, revenue grew at 6.4% from 2013 to 2014, with foreign exchange movements of the US dollar having a negative 0.6% impact at the aggregate level. 2014 growth accelerated smartly from 2013 for all firms with KPMG and PwC posting the largest increases in growth rates from prior year. Level of annual growth reached those seen in 2012. Firms pointed to creditable performance, large impact of acquired

The 2013 Big Four Firm Performance Analysis January 2015 www.Big4.com Page 8 of 34
advisory firms against a tough environment for Audit and sporadically difficult economic conditions in Asia. Growth in 2014 was very strong compared to 2013. Combined Big Four firms climbed to another record of $120 billion 2014 turned out to be a very different year from 2013, with several highlightable trends: Audit service line returned to growth with Audit revenues growing a respectable 2.4% from 2013 to 2014 and crossing the $50 billion milestone. In local currency terms, growth was even stronger at 3.4%. EY Audit grew 4.5% in local currency terms. While all firms pointed to very tough audit environment and strong inter firm competition, the actual results proved much better than expectations. The Tax service line on the other hand, continued its string of good growth, posting an accelerated revenue growth of 6.4% from 2013 to 2014, following 3.6%, 6.8% and 6.0% in the three previous years. Firms pointed to strong client demand and were optimistic about future prospects. Advisory zoomed with a 9.9% growth from 2013 to 2014, following 6.8% from 2012 to 2013, very close to double-digits growth seen in previous years of 12.1% and 15.9%. 2014 growth performance was strong and uniform across service lines and geographies. Audit grew 2.4% and Americas and Advisory zoomed. Asian growth was negative as an appreciating US dollar led to lower annual growth % in US dollar terms Americas continued to report continued strong growth, with 2014 revenues of $51 billion increasing 6.5% from $48 billion in 2013. With the US economy improving in recent years, this region has shown steady growth following 6.8%, 9.3% and 9.9% in three previous years. With Americas gaining the top spot among regions for the second
consecutive year, Americas growth had a large positive effect for all firms. EY had another great year in 2014 following its best years in 2013 since 2008. EY 2014 revenues of $27.369 billion grew from $25.829 billion 6.8% in local currency terms and 6.0% in US dollar terms. This was the best overall performance among all the Big 4 firms and solidifed its third position. Further, it widened EY’s revenue gap from KPMG from just $170 million in 2011 to $2.5 billion in 2014. KPMG continues as the smallest of the Big Four firms. Deloitte became the largest accounting firm on the planet, beating PwC on revenue terms in 2014. Deloitte had gained this spot for the first time ever in 2010, but lost out to PwC in 2011 and 2012. In 2013, Deloitte’s revenues grew 3.5% from 2012 while PwC’s revenue grew only 1.8%, thus Deloitte’s revenues exceeded PwC’s by $311 million in 2013 compared to a deficit of $200 million in 2012. In 2014, Deloitte’s revenues grew 5.7% from 2013 while PwC’s revenue grew slightly faster at 5.8%, but Deloitte’s revenues still exceeded PwC’s by $248 million in 2014 compared to a lead of $311 million in 2013. Leader Alert: Deloitte became the largest accounting firm on the planet, beating PwC on revenue terms in 2014 2014 saw good acquisition activity by the Big Four firms in the Advisory space. Notably, Deloitte made 20 acquisitions, including Platon Group, Urgentis Digital Crisis Solutions, McColl Partners, Banyan Branch, NXG Business Solutions, The Brief Group, MN Security and Vigilant. PwC finally bought and consolidated Booz. KPMG bought SAFIRA, Cynergy, Quebera and Rothstein Kass, while EY bought Parthenon and Thomson Reuters’ Tax Preparation and Court Accounting Outsourcing business. FOREIGN EXCHANGE IMPACT
The 2013 Big Four Firm Performance Analysis January 2015 www.Big4.com Page 9 of 34
For the four firms combined, 2014 revenues of $120.3 billion grew 5.8% higher in US dollar terms and 6.4% in local currency terms from the 2013 combined revenues of $113.7 billion, thus a negative 0.6% impact at the aggregate level. There was considerable variation in the growth rates of all firms from 2013 to 2014. In US dollar terms from 2013 to 2014, Deloitte grew 5.7%, EY 6.0%, KPMG 6.0% and PwC 5.8% for a combined rate of 5.85%. In local currency dollar terms from 2013 to 2014, Deloitte grew 6.5%, EY 6.8%, KPMG 6.3% and PwC 6.1% for a combined rate of 6.41%. Thus the foreign exchange impact relating to the US dollar in the 2014 fiscal year was between negative 0.3% to negative 0.8% indicating that the US dollar had appreciated somewhat against other currencies. However, the impact of foreign exchange movements was much more pronounced this year at the detailed level especially when looking across geographic regions. The Americas region for all four firms
combined grew 8.2% in local currency terms and 6.5% in US dollar terms. The appreciating US dollar had a negative impact of 1.7% on the firm’s US books where the revenue was recorded versus the local currency where the revenue was generated.
The Europe region for all four firms
combined grew 5.1% in local currency terms and 7.8% in US dollar terms. The depreciating US dollar had a positive impact of 2.7% on the firm’s US books where the revenue was recorded versus the local currency where the revenue was generated.
The Asia region for all four firms combined
grew 5.6% in local currency terms and negative 0.8% in US dollar terms. The appreciating US dollar had a negative impact of 6.4% on the firm’s US books where the revenue was recorded versus the local currency where the revenue was generated.
We had forecasted 3% to 6% growth in revenues from 2013 to 2014, and actual results of 5.8% came in just at the top end of our range. Audit service line returned to growth and Advisory accelerated. Americas turned in a solid performance and even Europe surprisingly had a much stronger growth pattern in 2014 despite the difficult economic conditions in the Eurozone. Asian revenues continued to shrink from 2013 to 2014 but this impact was muted by good performance in other two regions. Revenue growth in 2014 turned out to be more uniform than in prior years and the Big Four firms appeared to be fully capitalizing on the strong economic growth seen in all countries through 2014. Firms conspicuously did not make any mention of Russia in any of their public releases. In general, the firms’ 2014 results of 5.8% were at the higher end of our expectations of 3% to 6% growth. Interestingly, all firms grew at rates in a tight band of 5.7% to 6.0% There was some drama this year owing to the somewhat close race between Deloitte and PwC. After Deloitte reported on September 24, 2014, PwC’s revenue threshold became quite clear, and as it reported on October 7, 2014, it became evident that PwC’s revenues had not exceeded Deloitte and it had lost the crown as the largest accounting firm.

The 2013 Big Four Firm Performance Analysis January 2015 www.Big4.com Page 10 of 34
GROWTH STARS This year as in 2013, we highlight the firms who have achieved the highest growth rate in revenues from 2013 to 2014 in local currency terms as the growth stars in 2014. 2014 GROWTH STARS (2013 to 2014 Revenue growth in Local Currency) Audit EY Audit – 4.5% Tax PwC Tax – 8.0% Advisory EY Advisory – 12.3% Americas KPMG Americas – 10.1% Europe Deloitte Europe – 5.8% Asia Pacific PwC Asia – 7.7% Global EY – 6.8% Growth Star: EY had the best showing in 2014 after totally dominating this category in 2013. EY had the highest overall growth in 2014 2014 HIGHLIGHTS This year 2014, for the first time we highlight some key achievements across firms, service lines and geographies. 2014 KEY HIGHLIGHTS (Revenue growth in Local Currency) Combined Total revenues cross $120 billion for the first time.
Fourth consecutive year of 3%+ revenue growth PwC Largest Audit, Tax, Europe and Asia practices Fastest growth in Tax and Asia Deloitte Overall revenue leader Fifth consecutive year of positive revenue growth Largest Americas and Advisory practices Fastest growth in Europe EY Fastest growth in Audit, Advisory and total firm Fastest overall growth in 2014 KPMG Fastest growth in Americas Highest acceleration in growth from 2013 to 2014 A brief overview of 2014 results for each firm follows. PricewaterhouseCoopers PwC
PricewaterhouseCoopers’s FY 2014 global revenues for the year ending June 30, 2014 was $33.952 billion, a 5.8% increase from the $32.088 billion in FY 2013 in US dollar terms. However, on local currency terms FY 2014 revenues were actually higher than FY 2013 by 6.1% - the US dollar having a small positive impact. This solid performance, while advancing revenues, did not help the firm maintain its top ranking as the largest accounting firm on the planet. PwC lost this top honor to Deloitte, which reported FY 2014 revenues of $34.2 billion, thus beating PwC by $248 million, after being ahead in 2013 by a slim margin of just $311 million.
The 2013 Big Four Firm Performance Analysis January 2015 www.Big4.com Page 11 of 34
PwC revenues rose 5.8% in 2014, not enough to maintain its leadership as the largest accounting firm on the planet PwC firms had strong revenue increases across all service lines and all geographies. Growth in emerging markets outpaced developed economies. Emerging markets are now 20% of total revenues with India up 24%, China 11% and Brazil 10%. Advisory service line had the strongest growth in 2014 and Middle East and Africa grew the strongest among regions. All PwC service lines and all geographies had solid growth from 2013 to 2014. Advisory and Asia were very strong Overall, 2013 to 2014 revenue increases were much more robust than numbers seen from 2012 to 2013. PwC positioned this as strong performance in face of some challenging economic circumstances in some countries, increased regulation and stiff competition in all markets. In terms of service lines, 2014 Assurance revenues was up 2.7% in local currency terms to $15.137 billion, but in terms of US dollars, revenues climbed 2.5% from $14.761 billion in 2013. PwC noted that this was impressive growth in its signature Assurance practice, the largest in the world, grew despite the maturity of the business and the very tough globally competitive market for traditional audit services. The firm indicated that demand for risk controls, internal audit, and social and environmental reporting continued to grow. Tax services increased a strong 8.0% in local currency terms to $8.813 billion in 2014, and 7.8% in US dollar terms from $8.175 billion in 2013. PwC noted with pride that the service line, the largest Tax practice in the world, had strong growth and driven by demand for tax compliance and advisory leading to the fifth consecutive growth year.
Tax demand is expected to remain strong in 2015. Advisory services for PwC was the top service line again this year as revenues increased by 10.0% in local currency terms to $10.002 billion, and 9.3% in US dollar terms from $9.153 billion in 2013. PwC noted that Advisory services had broken through the $10 billion revenue milestone for the first time; that growth had accelerated from 2013 and the service line had doubled in size from five years ago. Strong performance was from organic growth and focus on complex cross-border work involving strategy through implementation. PwC’s acquisition of Booz increased capability to deliver strategic consulting, an area of strong expected growth in 2015. PwC noted strong growth in the Middle East, South America and Asia and increasing revenue share from emerging markets. Europe was solid despite tough conditions In terms of geographies, total Americas revenue increased 7.0% in local currency terms and 5.4% in US dollar terms from $13.028 billion in 2013 to $13.730 billion in 2014. North America turned in an excellent
performance, with 2014 revenues at $12.704 billion, up 6.5% in local currency terms and 5.9% in US dollar terms from $12.000 billion in 2013. US grew 6% with strong growth across all business lines.
Similarly, South and Central America, with 2014 revenues at $1.026 billion, up 12.8% in local currency terms but down 0.2% in US dollar terms from $1.028 billion in 2013.
Europe, Middle East and Africa combined revenues in 2014 of $14.768 billion, rose 5.0% in local currency terms and 7.7% in US dollar terms from $13.711 billion in 2013. PwC noted that despite some continuing tough economic conditions across Europe, operations continued to grow solidly. This
The 2013 Big Four Firm Performance Analysis January 2015 www.Big4.com Page 12 of 34
was a particularly good result in Western Europe, with growth accelerating from 2% in 2013. The ongoing economic uncertainty in the Eurozone is having a negative impact on economic growth. PwC expects that uncertainty to continue in 2015. However, PwC Europe is seeing increased demand for services and experiencing particularly impressive results from UK (up 5%), Germany (up 4%), Italy (up 8%) and France (up 5%), given the difficult economic conditions in those countries. Western Europe revenues increased 4.1%
in local currency terms and 8.0% in US dollar terms from $11.829 billion in 2013 to $12.777 billion in 2014.
Central and Eastern European revenue increased 2.5% in local currency terms and 1.5% in US dollar terms from $0.809 billion in 2013 to $0.821 billion in 2014.
Middle East and Africa revenue increased 15.9% in local currency terms and 9.0% in US dollar terms from $1.074 billion in 2013 to $1.170 billion in 2014.
Asia and Australasia 2014 combined revenues grew 7.7% in local currency terms and 2.2% in US dollar terms from $5.348 billion in 2013 to $5.454 billion in 2014. Asia revenues increased 9.2% in local
currency terms and 5.3% in US dollar terms from $3.706 billion in 2013 to $3.902 billion in 2014.
Australasia and Pacific Islands revenues increased 3.9% in local currency terms but declined 5.5% in US dollar terms from $1.642 billion in 2013 to $1.552 billion in 2014.
PwC Asia accelerated 2014 growth to 9% from just 2% in 2013 driven by solid results from across the region, and in particular the benefits of increased investment in PwC’s operations in China (up 11%), India (up 24%) and Japan (up 10%). As anticipated last year, PwC’s revenues in Australasia and the Pacific Islands returned to healthy growth with a 4% increase in 2014, boosted by focusing on the growing advisory services market in Australia. PwC noted that economic conditions in Australia continue to
be uncertain, but believes it has the right strategy in place to secure future profitable growth. In 2014 the firm recruited 45,000 professionals, taking the total number of people to 195,000 from 184,000 in 2013. Deloitte
Deloitte Touche Tohmatsu, the global firm, reported fiscal 2014 revenues for the year ending May 31, 2014 of US$34.2 billion, a 6.5% growth in local currency terms, and an increase of 5.7% in US dollar terms from 2013 of $32.4 billion. This was an acceleration from the 3.5% US dollar revenue growth from 2012 to 2013. All Deloitte service lines experienced growth across all three major geographic regions in local currency terms, led by strong results generated in Advisory, Americas, Europe and Tax. In FY2014, Deloitte saw growth across all industries, specifically Life Sciences & Health Care led growth among industries posting 17.4% total growth in local currency, a significant increase from 2013 growth of 12.9%, followed by Public Sector, which grew by 11.9%. Technology, Media & Telecommunications grew by an aggregate 9.1%, and Financial Services also posted strong growth at 5.9%. Deloitte continues to invest in global emerging and growth markets with these strategic markets growing an aggregated 10.9% in 2014. Deloitte saw solid growth in all three regions, all functions and all industry sectors. Advisory, Tax and Americas were particularly very strong Audit and Enterprise Risk Services (ERS) revenue increased 2.9% in local currency terms but 1.5% in US dollar terms to $13.3

The 2013 Big Four Firm Performance Analysis January 2015 www.Big4.com Page 13 of 34
billion in 2014 against $13.1 billion in 2013. ERS grew faster than Audit. Most industries reported positive growth for Audit, specifically Financial Services; Consumer Business; Technology, Media & Telecommunications; and Energy & Resources. Tax and Legal revenues rose 7.7% in local currency terms and 7.4% in US dollar terms to $6.5 billion in 2014 against $6.1 billion in 2013. Tax had strong growth across all regions highlighted by exceptional growth in Global Employer Services, Tax Management Consulting, Global Business Tax Services, Indirect Tax, and Outsourcing Services. Tax notes strong opportunities in 2015. Consulting (combined with Financial Advisory) was the fastest grower at 9.6% in local currency terms and 9.1% in US dollar terms from $13.2 billion in 2013 to $14.4 billion in 2014. Consulting grew 10.3% in local currency, driven by impressive performance in Strategy & Operations (10.5% growth), Technology (10.3% growth), and Human Capital (9.6% growth) service lines. The business experienced growth across all industries, led by a 26% increase in Life Sciences & Health Care revenues and double-digit growth in Energy & Resources; Public Sector; and Technology Media & Telecommunications. Financial Advisory grew 6.8% in local currency, led by increased demand for M&A services arising from strong growth in global M&A activity, and growth in the organization’s crisis business driven particularly by increased regulatory focus in the FSI industry. In terms of geography, Americas increased 7.5% in local currency terms and 6.1% in US dollar terms from $16.4 billion in 2013 to $17.4 billion in 2014. The strongest growth occurred in Spanish-speaking Latin America or LATCO (14.1%) and Brazil (10.6%). The United States, the largest member firm in the network, produced particularly strong growth, led by an 11.3% increase in Consulting.
Europe, Middle East and Africa revenues increased 5.8% in local currency terms and 8.8% in US dollar terms from $11.1 billion in 2013 to $12.1 billion in 2014. In particular, Italy (11.5%), Germany (11.8%) and France (10.5%) demonstrated strong performance over 2013. Aggregate revenues for the sub region of Africa grew by an impressive 17.6%. Asia Pacific grew 4.9% in local currency terms but declined 3.0% in US dollar terms from $4.9 billion in 2013 to $4.8 billion in 2014. Surprisingly, Asia dropped to third place among regional growth, after being the fastest-growing region for many consecutive years. Japan was a key contributor to regional results at 5.1% growth, and India and New Zealand both grew in the double digits. The Americas region grew a solid 7.5%, making it the fastest growing region in 2014, followed by Europe Deloitte’s remarkable performance enabled it to leap over PwC to become the largest Big Four firm in the world in 2013. Its 2012 revenues of $31.3 billion were behind PwC’s 2012 revenues of $31.5 billion by a slim $200 million, after being ahead in 2010 by a miniscule but significant margin of $9 million or 0.03%. In 2013, that positioning reversed again. Deloitte by virtue of a strong 3.5% growth in US dollar terms outperformed PwC which grew only at 1.8%. In 2013, Deloitte posted revenues of $32.4 billion, while PwC’s revenues came in at $32.089 billion, thus falling short of Deloitte by $311 million. Notably, Deloitte’s stronger performance from 2012 to 2013 enabled the firm not only to zero out the $200 million gap but create further distance by being ahead by $500 million, a remarkable attainment given the relatively lower growth figures seen in 2013. In 2014, despite acceleration in growth by all the four firms, Deloitte by virtue of a strong 5.7% growth in US dollar terms outperformed PwC which grew faster at
The 2013 Big Four Firm Performance Analysis January 2015 www.Big4.com Page 14 of 34
5.8% but from a smaller base. In 2014, Deloitte posted revenues of $34.2 billion, while PwC’s revenues came in at $33.952 billion, thus falling short of Deloitte by $248 million. Notably, Deloitte’s stronger performance from 2012 to 2013 enabled the firm not only to zero out the $200 million gap but create further distance by being ahead by $500 million, a remarkable attainment given the relatively lower growth figures seen in 2013. This lead dropped from $311 million in 2013 to $248 million in 2014 yet helped Deloitte keep its leadership position in a tough race marked by strong overall growth. A remarkable performance in 2010 had helped Deloitte to beat PwC and become the largest Big Four firm in the world. We had indicated in our 2009 analysis that if Deloitte’s growth rate were to exceed PwC’s growth rate only by a minimum of 0.3%, Deloitte’s 2010 revenues in US dollar terms would make it the largest among the Big Four firms. And as it happened, PwC revenues grew by 1.5% and Deloitte revenues grew by 1.8% from 2009 to 2010, and that put Deloitte ahead by a very small but critical delta, which Deloitte celebrated by indicating that “Deloitte ascends to become the largest private professional services organization worldwide” while not naming PwC in its press release. In 2009, Deloitte revenues shrank less than PwC, thus narrowing, but not completely closing the gap against PwC. By showing remarkable performance in 2009, arguably one of the toughest environments in recent memory, Deloitte demonstrated that it was a strong contender for the leadership position. Deloitte’s very strong relative performance versus PwC from 2013 to 2014 enabled it to retake its former position and continue to be the largest Big Four firm in the world
Deloitte continued to focus on hiring, developing, and retaining top talent as a key driver of the expansion of business activity. In FY2014, Deloitte hired 54,000 professionals; its total workforce now exceeds 210,000 professionals worldwide. Ernst & Young
Ernst & Young’s combined worldwide 2014 revenues for the year ending 30 June 2014 were US$27.369 billion, increasing 6.8% in local currency terms from the comparable period in FY 2013 of US$25.829 billion in global revenues. In US dollar terms, the revenue jumped 6.0% from 2013 to 2014. EY followed 2013, which was the strongest growth for the firm in five years, with another solid performance in 2014. In US dollar terms, 2014 growth of 6.0% was actually higher than 5.8% in 2013. Though in local currency terms, 2014 growth of 6.8% was slightly below 7.7% growth seen in 2013. Ernst & Young noted that all service lines continued to grow revenues in 2014. Americas and Advisory experienced very strong growth. EY noted weakening economic conditions in some part of Asia. Emerging markets grew 8.7% overall in 2014 compared to 12% in 2013 impacted by tough economic conditions and slowdown in a number of key emerging market economies. After revenues increased 5.8% from 2012 to 2013, Ernst & Young followed up with another great year with 6.0% revenue growth from 2013 to 2014. EY has had a string of good years since 2010. The firm’s strongest performing sectors with double digit growth, were Life Sciences and Government & Public Sector. Americas grew
The 2013 Big Four Firm Performance Analysis January 2015 www.Big4.com Page 15 of 34
9.1%, India grew 16.5% and China grew 6.8%. Assurance Services had FY 2014 revenues of $11.277 billion, which was up 4.5% in local currency terms, and 3.1% in US dollar terms from FY 2013 revenues of $10.936 billion. EY is investing $400 million in state-of-the-art audit technologies and processes. Global Tax Services with FY 2014 revenues of $7.224 billion was up 4.3% in local currency terms and also up 4.0% in US dollar terms from FY 2013 of $6.946 billion. This was the fourth year of consecutive strong growth. EY acquired Thomson Reuters’ Tax Preparation and Court Accounting Outsourcing businesses in 2014. Advisory Services with FY 2014 revenues of $6.526 billion was up an astounding 14.4% in local currency terms, and 13.5% increase in US dollar terms from $5.751 billion in FY 2013. Transaction Advisory Services (TAS) with FY 2014 revenues of $2.342 billion, had a 6.5% increase in local currency terms and revenues grew 6.6% in US dollar terms from $2.196 billion in 2013. Advisory growth was largely organic along with targeted acquisitions. For a fifth consecutive year TAS performance outpaced a subdued M&A market. EY’s recent acquisition of global strategy consultants Parthenon will help TAS in 2015. Ernst & Young has a great 2014 performance. All service lines and geographies grew. Americas and Advisory growth were exceptional In terms of geographies, Americas had FY 2014 revenues of $11.542 billion, which increased 9.1% in local currency terms, and 7.4% in US dollar terms from FY 2013 revenues of $10.750 billion. This followed a great year in 2013. This strong Americas performance is closing the gap with Europe which continues to be EY’s largest region though only with a small lead. EMEIA with FY 2014 revenues of $11.780 billion was up 5.1% in local currency terms
and also up 7.6% in US dollar terms from FY 2013 of $10.943 billion. Revenue growth was strong in India with 16.5%. Europe was strongly helped by foreign exchange movement this year as growth in US dollar terms exceeded growth in local currency terms by 2.5%. Asia-Pacific with FY 2014 revenues of $2.949 billion was up 5.2% in local currency terms, but increased only 0.5% in US dollar terms from $2.934 billion in FY 2013. EY Greater China grew 6.8%. Japan had FY 2014 revenues of $1.098 billion, which was a welcome increase of 5.3% in local currency but down 8.7% in US dollar terms from FY 2013 of $1.202 billion. This was against a background of a rapidly weakening Japanese Yen against the US dollar. The firm noted that emerging markets saw combined revenue growth of 8.7% in 2014 compared to 12% in 2013. EY’s headcount was at an all-time high of 188,000, with 60,000 new hires in 2014. Strong performance and confidence led to 675 partner promotions. Along with 324 direct-admit partners, this was EY’s largest partner intake ever, with the largest number joining Assurance. Our estimate is that EY had approximately 9,100 partners in 2013 and 9,800 partners in 2014. Ernst & Young made a key change to their reporting of revenues in 2009, showing combined, not consolidated revenues Ernst & Young made a key change to their reporting of revenues in 2009, electing to show combined, not consolidated revenues by eliminating intra-firm billings. EY restated its 2008 revenues down from $24.5 billion as originally reported to $23.0 billion reported as restated in 2009. The reason provided for this change was, “In line with our globalization efforts to harmonize policies across member firms, revenues for 2009 and 2008 related to member firm billings to other member firms have been eliminated from the financial information presented

The 2013 Big Four Firm Performance Analysis January 2015 www.Big4.com Page 16 of 34
here. This financial information represents combined not consolidated revenues, and includes expenses billed to clients.” KPMG
KPMG reported a record 2014 combined revenues for the fiscal year ending 30 September 2014 of US$24.820 billion versus US$23.420 billion for the prior 2013 fiscal year. This was a 6.3% increase in local currency terms and a 6.0% increase in US dollars terms. The difference between growth in local currency and US dollar was minimal at the overall firm level but was quite different in the three regions – Americas and Asia were negatively impacted by the appreciating US dollar but Europe was positively helped. KPMG was pleased to report accelerated growth in 2014 as compared to 2013 with strong results from nearly all service lines and geographies. Audit recovered from a decline in 2013 to smart growth in 2014. Growth in Tax jumped by an additional 5%, and in Advisory by 5%. All regions also saw acceleration in growth, up by 2% to 6% as compared to 2013. KPMG made a number of significant acquisitions in 2014, all in Advisory, including SAFIRA in Portugal, Cynergy in USA, Qubera in UK and Rothstein Kass in USA. In the area of Data & Analytics, KPMG has made good strides with a strategic alliance with McLaren and an equity stake in Bottlenose. KPMG reported solid growth in 2014, with all service lines and geographies showing accelerated growth as compared to 2013. Revenues grew 6.0% in 2014 compared to only 1.7% in 2013
KPMG recorded increased revenues across all service lines in 2014 with particularly strong growth generated in India (up by 17.8%), Middle East (up by 11.1%), Africa (10.5%), ASEAN (up 8.0%) and China (7.3%). Audit had FY 2014 revenues of $10.460 billion, which was up a strong 3.8% in local currency terms, and 2.4% in US dollar terms from FY 2013 revenues of $10.210 billion. Audit grew only 1.2% in 2013. KPMG noted a challenging global audit market and intense competition for audit engagements. Specifically, the firm saw the introduction of EU audit reforms which drove an unprecedented level of audit tenders. Tax Services with FY 2014 revenues of $5.270 billion was up a robust 6.1% in local currency terms and also up 6.0% in US dollar terms from FY 2013 of $4.970 billion. Tax recovered smartly from lower growth seen in 2013 and matched levels seen in earlier years. Tax was driven by an increased demand for tax compliance and tax advisory services in the Americas, Asia Pacific and EMA. Advisory Services with FY 2014 revenues of $9.090 billion was up a very strong 10.4% in local currency terms, and also 10.3% increase in US dollar from $8.240 billion in FY 2013. Advisory growth also accelerated from 2013. KPMG noted strengthening demand for Management Consulting services with 9.6% growth, Risk Consulting services, which grew 12.3%, and Transactions & Restructuring where improving demand from all three regions delivered growth of 10.8%. KPMG’s revenue grew 6.3% in US Dollar terms and up 6.0% in local currency terms from 2013 to 2014, in line with all the other Big Four firms. Yet the gap with Ernst and Young increased marginally in 2014 In terms of geographies, Americas had FY 2014 revenues of $8.510 billion, which increased 10.1% in local currency terms,

The 2013 Big Four Firm Performance Analysis January 2015 www.Big4.com Page 17 of 34
and 8.0% in US dollar terms from FY 2013 revenues of $7.880 billion. Americas Advisory grew 15.1%, Tax grew 8.0% and Audit 8.7%, all in local currency. Europe with FY 2014 revenues of $12.450 billion was up 4.7% in local currency terms and also up 7.0% in US dollar terms from FY 2013 of $11.640 billion. KPMG noted strong growth in Ireland, Spain, Switzerland and the UK, as many of the region’s leading economies returned to growth. Asia-Pacific with FY 2014 revenues of $3.860 billion was up 3.8% in local currency terms, but fell 1.0% in US dollar terms from $3.900 billion in FY 2013. KPMG noted a return to growth for some parts of the region. Also, KPMG India grew 17.8% and KPMG China grew 7.3%. Asia was unfavorably impacted by foreign exchange movements of the US dollar. US dollar growth in 2014 was a substantial 5% below local currency growth. In 2013, KPMG faced a similar situation with positive 1.1% local currency growth but negative 4.2% US dollar growth. KPMG’s headcount was at an all-time high of 162,000, with 54,000 new hires in 2014. KPMG Advisory and KPMG Americas had the strongest showing with revenue growth in excess of 10% REVENUE BY GEOGRAPHY The distribution of revenues by geography shows some very interesting insights. Contrary perhaps to common belief, till 2012, Europe (including generally Europe, Middle East and Africa), rather than the Americas region (including Canada, the US and South America), had the highest percentage of total revenues for the Big Four firms. In 2013, the position reversed owing to strong American growth, the Americas took over for the first time ever,
the leading position among the three key regions of the world. And Americas continued to hold the top spot in 2014 also. Europe had the highest proportion of total revenues for the Big Four firms till 2012. In 2013, that position reversed and America was the top region. Asia’s share has climbed rapidly to 16% In general Europe and Americas average 42% each and the Asia Pacific countries (including India, South Asia, China, North Asia and Australia) have the remaining 16% of the revenue share. In 2014, Asia’s share dropped to 15% with Americas and Europe at 42.5% each. This was due to the disproportionate depreciation of Asian currencies against the US dollar
The Americas The Americas represent about 42% of global revenues of the Big Four firms combined revenues, and in 2013 was the largest region by revenue share. In 2014, Americas continued to hold that top spot, if only by a very slim margin. From 2004 to 2008, there has been a noticeable drop of about 3% in the Americas region’s share of the total revenue for all the firms. In 2004, 42% of combined firm revenues were reported from
The 2013 Big Four Firm Performance Analysis January 2015 www.Big4.com Page 18 of 34
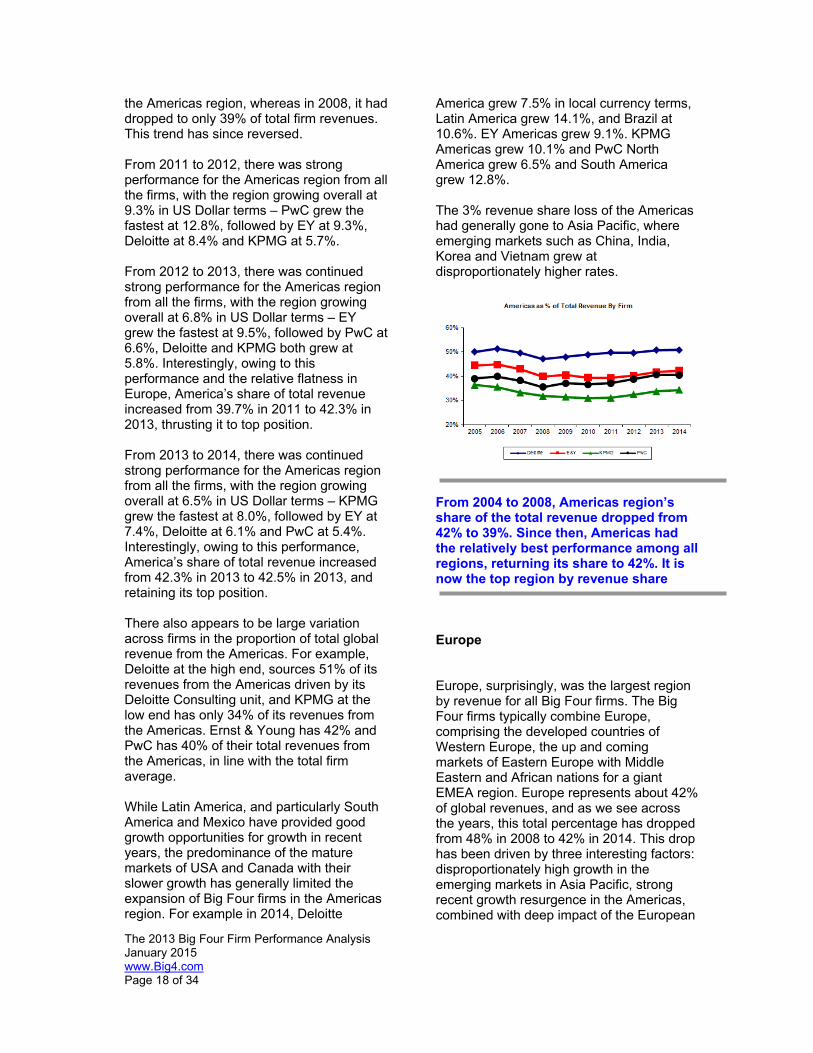
the Americas region, whereas in 2008, it had dropped to only 39% of total firm revenues. This trend has since reversed. From 2011 to 2012, there was strong performance for the Americas region from all the firms, with the region growing overall at 9.3% in US Dollar terms – PwC grew the fastest at 12.8%, followed by EY at 9.3%, Deloitte at 8.4% and KPMG at 5.7%. From 2012 to 2013, there was continued strong performance for the Americas region from all the firms, with the region growing overall at 6.8% in US Dollar terms – EY grew the fastest at 9.5%, followed by PwC at 6.6%, Deloitte and KPMG both grew at 5.8%. Interestingly, owing to this performance and the relative flatness in Europe, America’s share of total revenue increased from 39.7% in 2011 to 42.3% in 2013, thrusting it to top position. From 2013 to 2014, there was continued strong performance for the Americas region from all the firms, with the region growing overall at 6.5% in US Dollar terms – KPMG grew the fastest at 8.0%, followed by EY at 7.4%, Deloitte at 6.1% and PwC at 5.4%. Interestingly, owing to this performance, America’s share of total revenue increased from 42.3% in 2013 to 42.5% in 2013, and retaining its top position. There also appears to be large variation across firms in the proportion of total global revenue from the Americas. For example, Deloitte at the high end, sources 51% of its revenues from the Americas driven by its Deloitte Consulting unit, and KPMG at the low end has only 34% of its revenues from the Americas. Ernst & Young has 42% and PwC has 40% of their total revenues from the Americas, in line with the total firm average. While Latin America, and particularly South America and Mexico have provided good growth opportunities for growth in recent years, the predominance of the mature markets of USA and Canada with their slower growth has generally limited the expansion of Big Four firms in the Americas region. For example in 2014, Deloitte
America grew 7.5% in local currency terms, Latin America grew 14.1%, and Brazil at 10.6%. EY Americas grew 9.1%. KPMG Americas grew 10.1% and PwC North America grew 6.5% and South America grew 12.8%. The 3% revenue share loss of the Americas had generally gone to Asia Pacific, where emerging markets such as China, India, Korea and Vietnam grew at disproportionately higher rates.
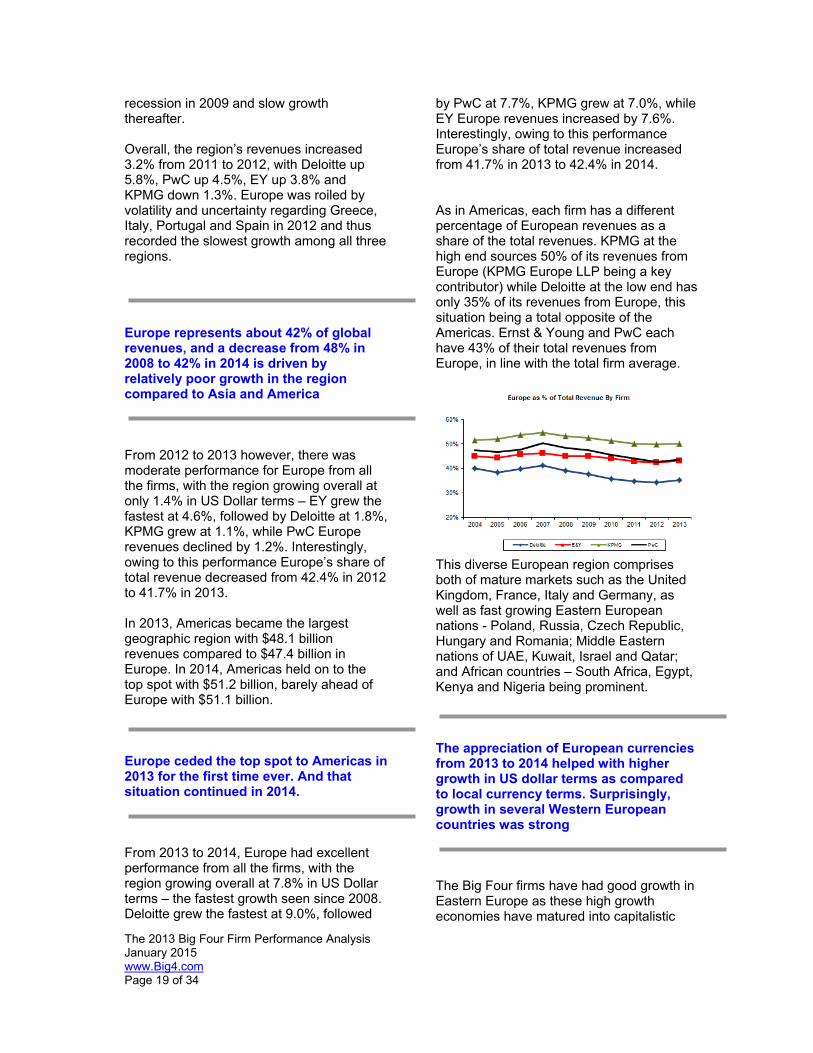
From 2004 to 2008, Americas region’s share of the total revenue dropped from 42% to 39%. Since then, Americas had the relatively best performance among all regions, returning its share to 42%. It is now the top region by revenue share Europe Europe, surprisingly, was the largest region by revenue for all Big Four firms. The Big Four firms typically combine Europe, comprising the developed countries of Western Europe, the up and coming markets of Eastern Europe with Middle Eastern and African nations for a giant EMEA region. Europe represents about 42% of global revenues, and as we see across the years, this total percentage has dropped from 48% in 2008 to 42% in 2014. This drop has been driven by three interesting factors: disproportionately high growth in the emerging markets in Asia Pacific, strong recent growth resurgence in the Americas, combined with deep impact of the European
The 2013 Big Four Firm Performance Analysis January 2015 www.Big4.com Page 19 of 34
recession in 2009 and slow growth thereafter. Overall, the region’s revenues increased 3.2% from 2011 to 2012, with Deloitte up 5.8%, PwC up 4.5%, EY up 3.8% and KPMG down 1.3%. Europe was roiled by volatility and uncertainty regarding Greece, Italy, Portugal and Spain in 2012 and thus recorded the slowest growth among all three regions. Europe represents about 42% of global revenues, and a decrease from 48% in 2008 to 42% in 2014 is driven by relatively poor growth in the region compared to Asia and America From 2012 to 2013 however, there was moderate performance for Europe from all the firms, with the region growing overall at only 1.4% in US Dollar terms – EY grew the fastest at 4.6%, followed by Deloitte at 1.8%, KPMG grew at 1.1%, while PwC Europe revenues declined by 1.2%. Interestingly, owing to this performance Europe’s share of total revenue decreased from 42.4% in 2012 to 41.7% in 2013. In 2013, Americas became the largest geographic region with $48.1 billion revenues compared to $47.4 billion in Europe. In 2014, Americas held on to the top spot with $51.2 billion, barely ahead of Europe with $51.1 billion. Europe ceded the top spot to Americas in 2013 for the first time ever. And that situation continued in 2014. From 2013 to 2014, Europe had excellent performance from all the firms, with the region growing overall at 7.8% in US Dollar terms – the fastest growth seen since 2008. Deloitte grew the fastest at 9.0%, followed
by PwC at 7.7%, KPMG grew at 7.0%, while EY Europe revenues increased by 7.6%. Interestingly, owing to this performance Europe’s share of total revenue increased from 41.7% in 2013 to 42.4% in 2014. As in Americas, each firm has a different percentage of European revenues as a share of the total revenues. KPMG at the high end sources 50% of its revenues from Europe (KPMG Europe LLP being a key contributor) while Deloitte at the low end has only 35% of its revenues from Europe, this situation being a total opposite of the Americas. Ernst & Young and PwC each have 43% of their total revenues from Europe, in line with the total firm average.
This diverse European region comprises both of mature markets such as the United Kingdom, France, Italy and Germany, as well as fast growing Eastern European nations - Poland, Russia, Czech Republic, Hungary and Romania; Middle Eastern nations of UAE, Kuwait, Israel and Qatar; and African countries – South Africa, Egypt, Kenya and Nigeria being prominent. The appreciation of European currencies from 2013 to 2014 helped with higher growth in US dollar terms as compared to local currency terms. Surprisingly, growth in several Western European countries was strong The Big Four firms have had good growth in Eastern Europe as these high growth economies have matured into capitalistic
The 2013 Big Four Firm Performance Analysis January 2015 www.Big4.com Page 20 of 34
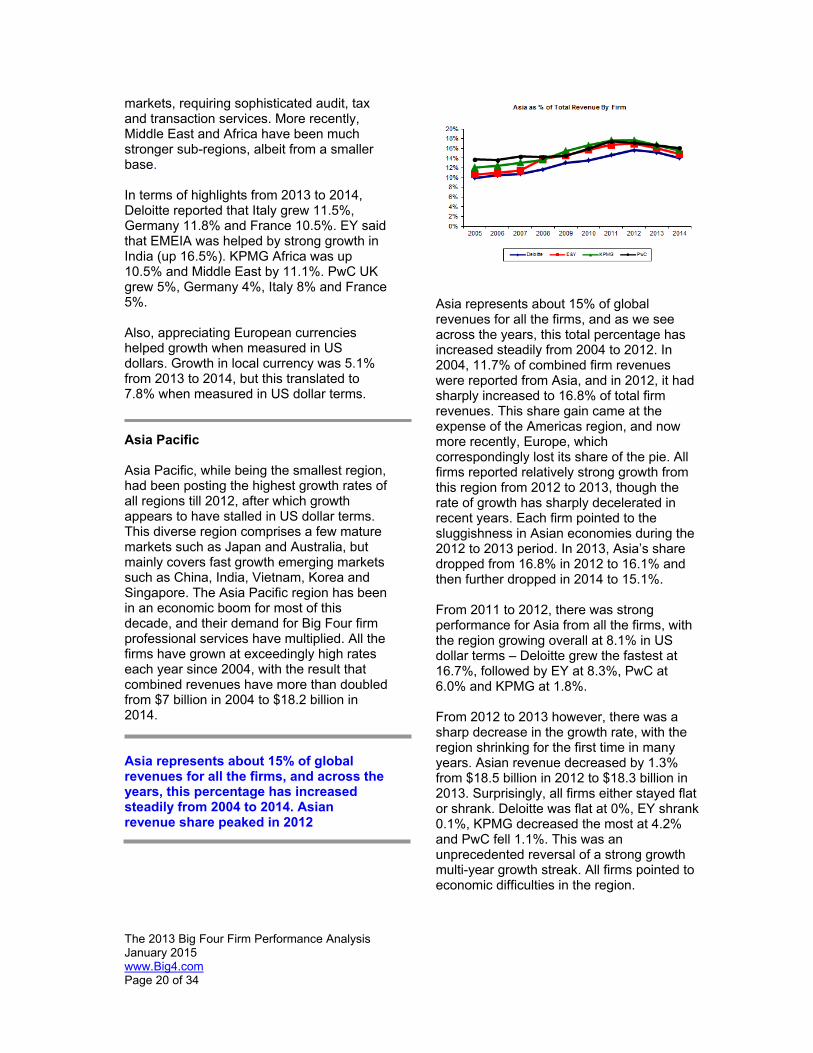
markets, requiring sophisticated audit, tax and transaction services. More recently, Middle East and Africa have been much stronger sub-regions, albeit from a smaller base. In terms of highlights from 2013 to 2014, Deloitte reported that Italy grew 11.5%, Germany 11.8% and France 10.5%. EY said that EMEIA was helped by strong growth in India (up 16.5%). KPMG Africa was up 10.5% and Middle East by 11.1%. PwC UK grew 5%, Germany 4%, Italy 8% and France 5%. Also, appreciating European currencies helped growth when measured in US dollars. Growth in local currency was 5.1% from 2013 to 2014, but this translated to 7.8% when measured in US dollar terms. Asia Pacific Asia Pacific, while being the smallest region, had been posting the highest growth rates of all regions till 2012, after which growth appears to have stalled in US dollar terms. This diverse region comprises a few mature markets such as Japan and Australia, but mainly covers fast growth emerging markets such as China, India, Vietnam, Korea and Singapore. The Asia Pacific region has been in an economic boom for most of this decade, and their demand for Big Four firm professional services have multiplied. All the firms have grown at exceedingly high rates each year since 2004, with the result that combined revenues have more than doubled from $7 billion in 2004 to $18.2 billion in 2014. Asia represents about 15% of global revenues for all the firms, and across the years, this percentage has increased steadily from 2004 to 2014. Asian revenue share peaked in 2012
Asia represents about 15% of global revenues for all the firms, and as we see across the years, this total percentage has increased steadily from 2004 to 2012. In 2004, 11.7% of combined firm revenues were reported from Asia, and in 2012, it had sharply increased to 16.8% of total firm revenues. This share gain came at the expense of the Americas region, and now more recently, Europe, which correspondingly lost its share of the pie. All firms reported relatively strong growth from this region from 2012 to 2013, though the rate of growth has sharply decelerated in recent years. Each firm pointed to the sluggishness in Asian economies during the 2012 to 2013 period. In 2013, Asia’s share dropped from 16.8% in 2012 to 16.1% and then further dropped in 2014 to 15.1%. From 2011 to 2012, there was strong performance for Asia from all the firms, with the region growing overall at 8.1% in US dollar terms – Deloitte grew the fastest at 16.7%, followed by EY at 8.3%, PwC at 6.0% and KPMG at 1.8%. From 2012 to 2013 however, there was a sharp decrease in the growth rate, with the region shrinking for the first time in many years. Asian revenue decreased by 1.3% from $18.5 billion in 2012 to $18.3 billion in 2013. Surprisingly, all firms either stayed flat or shrank. Deloitte was flat at 0%, EY shrank 0.1%, KPMG decreased the most at 4.2% and PwC fell 1.1%. This was an unprecedented reversal of a strong growth multi-year growth streak. All firms pointed to economic difficulties in the region.

The 2013 Big Four Firm Performance Analysis January 2015 www.Big4.com Page 21 of 34
2013 to 2014 continued the shrinkage seen in the previous year. Asian revenue decreased by 0.7% from $18.3 billion in 2013 to $18.2 billion in 2014 in US dollar terms. Surprisingly, most firms shrank. Deloitte revenues fell 3%, EY shrank 2%, KPMG fell by 1%, while PwC had the best showing due to a 2% increase in revenues. This was an unprecedented two years of revenue decrease. Asian revenues shrank 0.8% from 2013 to 2014 in US dollar terms, reducing for the second year in a row, owing to very strong appreciating US dollar. Asian growth was the lowest seen in a long time. Asian share of total revenues also dropped in 2014 to 15.1% In 2014, foreign exchange played a huge role in Asia. The appreciating US dollar had a huge impact in translating local currency growth into US dollar based growth. The Big Four firms combined grew 5.6% in local currency terms from 2013 to 2014, but shrank 0.7% in dollar terms in the same period. Deloitte grew 4.9% in local currency terms with Japan growing at 5.1%, and India and New Zealand posting double digit growth. EY Asia Pacific and Japan grew at 5.2% and Greater China grew 6.8%. EY Japan was largely impacted by the depreciated Yen against the US dollar. KPMG Asia grew 3.8% with India growing at 17.8%, ASEAN at 8% and China at 7.3%. PwC Asia grew 9.2% while Australia grew 3.9%, PwC China increased 11%, PwC India 24% and Japan 10%. Asian revenues in local currency terms were quite strong growing 5.6% from 2013 to 2014. India, China, Australia and Japan turned in solid growth. Foreign exchange fluctuations played a key role in dampening Asian growth when expressed in US dollars BRIC
The BRIC countries – Brazil, Russia, India and China – have been unquestionably the shining stars in the growth story in recent years. Though the firms do not report individual country revenues, there is typically some commentary on the annual report on the spectacular increases in these countries. The BRIC countries – Brazil, Russia, India and China – were shining stars in recent years, but the growth story seems to have slowed down in 2014 For example from 2011 to 2012, PwC Brazil grew 14%, Russia was up 13%, India grew 16%, and PwC China grew 14%. For Deloitte, Brazil and other Latin countries grew 16.3%, India grew 19% and China experienced double digit growth. EY Brazil grew 17.5%, Russia grew 15.6%, India was up 19.8%, and China grew 11.8%. For KPMG, Brazil and India both had 20%+ growth. But from 2012 to 2013, even BRIC growth slowed. EY India grew 17%, EY Brazil grew 24%, KPMG India grew 16%, KPMG China was up 10%,and Deloitte India grew 6.5+%. PwC Russia and China both grew at 3%. From 2013 to 2014, BRIC growth slowed. EY India grew 16.5%, EY China grew 6.8%, KPMG India grew 17.8%, KPMG China was up 7.3%. Deloitte India grew in double digits, while Deloitte Brazil expanded by 10.6%. PwC China grew 11% and PwC India revenues increased by 24%. No Big Four firm commented on revenue changes in Russia. REVENUE BY SERVICE LINE The Big Four firms offer a wide variety of professional and financial services, with newer Advisory services adding to their
The 2013 Big Four Firm Performance Analysis January 2015 www.Big4.com Page 22 of 34
more traditional and deep-rooted Audit (Assurance) and Tax Services. Firms vary in their structure and definition of these broad service lines, typically though about half the revenues are sourced from Audit, and the balance is shared between Tax and Advisory Services.
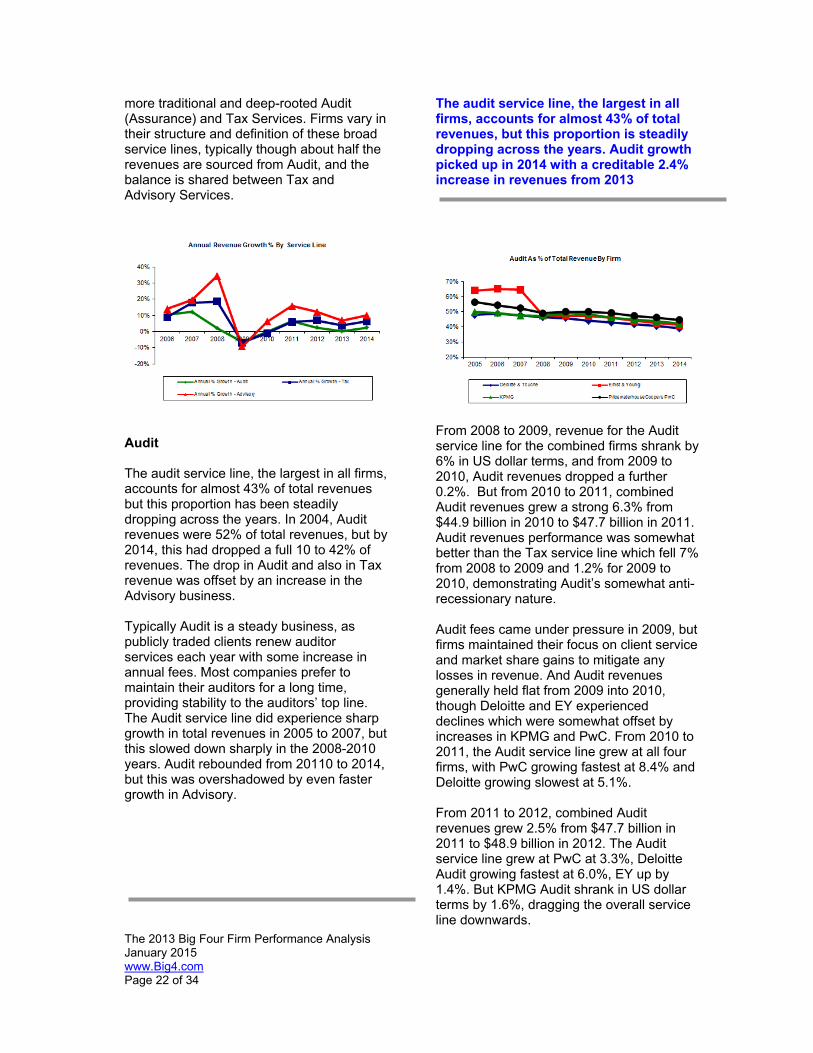
Audit The audit service line, the largest in all firms, accounts for almost 43% of total revenues but this proportion has been steadily dropping across the years. In 2004, Audit revenues were 52% of total revenues, but by 2014, this had dropped a full 10 to 42% of revenues. The drop in Audit and also in Tax revenue was offset by an increase in the Advisory business. Typically Audit is a steady business, as publicly traded clients renew auditor services each year with some increase in annual fees. Most companies prefer to maintain their auditors for a long time, providing stability to the auditors’ top line. The Audit service line did experience sharp growth in total revenues in 2005 to 2007, but this slowed down sharply in the 2008-2010 years. Audit rebounded from 20110 to 2014, but this was overshadowed by even faster growth in Advisory.
The audit service line, the largest in all firms, accounts for almost 43% of total revenues, but this proportion is steadily dropping across the years. Audit growth picked up in 2014 with a creditable 2.4% increase in revenues from 2013
From 2008 to 2009, revenue for the Audit service line for the combined firms shrank by 6% in US dollar terms, and from 2009 to 2010, Audit revenues dropped a further 0.2%. But from 2010 to 2011, combined Audit revenues grew a strong 6.3% from $44.9 billion in 2010 to $47.7 billion in 2011. Audit revenues performance was somewhat better than the Tax service line which fell 7% from 2008 to 2009 and 1.2% for 2009 to 2010, demonstrating Audit’s somewhat anti-recessionary nature. Audit fees came under pressure in 2009, but firms maintained their focus on client service and market share gains to mitigate any losses in revenue. And Audit revenues generally held flat from 2009 into 2010, though Deloitte and EY experienced declines which were somewhat offset by increases in KPMG and PwC. From 2010 to 2011, the Audit service line grew at all four firms, with PwC growing fastest at 8.4% and Deloitte growing slowest at 5.1%. From 2011 to 2012, combined Audit revenues grew 2.5% from $47.7 billion in 2011 to $48.9 billion in 2012. The Audit service line grew at PwC at 3.3%, Deloitte Audit growing fastest at 6.0%, EY up by 1.4%. But KPMG Audit shrank in US dollar terms by 1.6%, dragging the overall service line downwards.
The 2013 Big Four Firm Performance Analysis January 2015 www.Big4.com Page 23 of 34
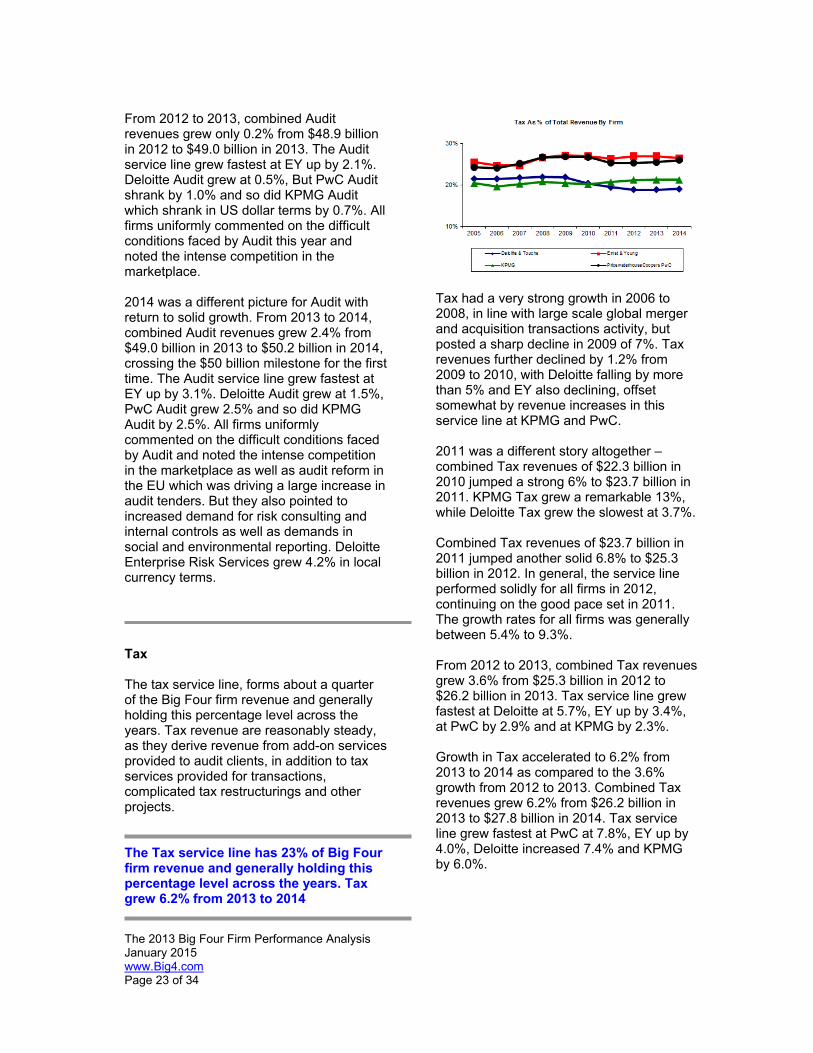
From 2012 to 2013, combined Audit revenues grew only 0.2% from $48.9 billion in 2012 to $49.0 billion in 2013. The Audit service line grew fastest at EY up by 2.1%. Deloitte Audit grew at 0.5%, But PwC Audit shrank by 1.0% and so did KPMG Audit which shrank in US dollar terms by 0.7%. All firms uniformly commented on the difficult conditions faced by Audit this year and noted the intense competition in the marketplace. 2014 was a different picture for Audit with return to solid growth. From 2013 to 2014, combined Audit revenues grew 2.4% from $49.0 billion in 2013 to $50.2 billion in 2014, crossing the $50 billion milestone for the first time. The Audit service line grew fastest at EY up by 3.1%. Deloitte Audit grew at 1.5%, PwC Audit grew 2.5% and so did KPMG Audit by 2.5%. All firms uniformly commented on the difficult conditions faced by Audit and noted the intense competition in the marketplace as well as audit reform in the EU which was driving a large increase in audit tenders. But they also pointed to increased demand for risk consulting and internal controls as well as demands in social and environmental reporting. Deloitte Enterprise Risk Services grew 4.2% in local currency terms. Tax The tax service line, forms about a quarter of the Big Four firm revenue and generally holding this percentage level across the years. Tax revenue are reasonably steady, as they derive revenue from add-on services provided to audit clients, in addition to tax services provided for transactions, complicated tax restructurings and other projects. The Tax service line has 23% of Big Four firm revenue and generally holding this percentage level across the years. Tax grew 6.2% from 2013 to 2014
Tax had a very strong growth in 2006 to 2008, in line with large scale global merger and acquisition transactions activity, but posted a sharp decline in 2009 of 7%. Tax revenues further declined by 1.2% from 2009 to 2010, with Deloitte falling by more than 5% and EY also declining, offset somewhat by revenue increases in this service line at KPMG and PwC. 2011 was a different story altogether – combined Tax revenues of $22.3 billion in 2010 jumped a strong 6% to $23.7 billion in 2011. KPMG Tax grew a remarkable 13%, while Deloitte Tax grew the slowest at 3.7%. Combined Tax revenues of $23.7 billion in 2011 jumped another solid 6.8% to $25.3 billion in 2012. In general, the service line performed solidly for all firms in 2012, continuing on the good pace set in 2011. The growth rates for all firms was generally between 5.4% to 9.3%. From 2012 to 2013, combined Tax revenues grew 3.6% from $25.3 billion in 2012 to $26.2 billion in 2013. Tax service line grew fastest at Deloitte at 5.7%, EY up by 3.4%, at PwC by 2.9% and at KPMG by 2.3%. Growth in Tax accelerated to 6.2% from 2013 to 2014 as compared to the 3.6% growth from 2012 to 2013. Combined Tax revenues grew 6.2% from $26.2 billion in 2013 to $27.8 billion in 2014. Tax service line grew fastest at PwC at 7.8%, EY up by 4.0%, Deloitte increased 7.4% and KPMG by 6.0%.
The 2013 Big Four Firm Performance Analysis January 2015 www.Big4.com Page 24 of 34
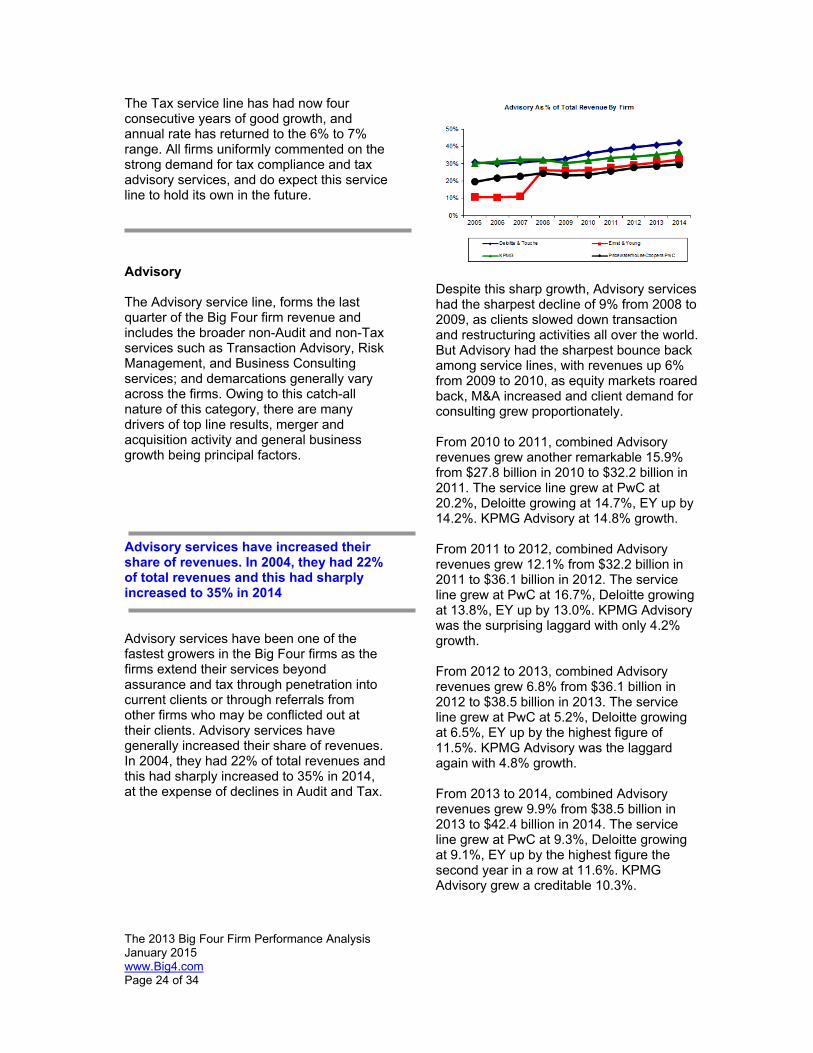
The Tax service line has had now four consecutive years of good growth, and annual rate has returned to the 6% to 7% range. All firms uniformly commented on the strong demand for tax compliance and tax advisory services, and do expect this service line to hold its own in the future. Advisory The Advisory service line, forms the last quarter of the Big Four firm revenue and includes the broader non-Audit and non-Tax services such as Transaction Advisory, Risk Management, and Business Consulting services; and demarcations generally vary across the firms. Owing to this catch-all nature of this category, there are many drivers of top line results, merger and acquisition activity and general business growth being principal factors. Advisory services have increased their share of revenues. In 2004, they had 22% of total revenues and this had sharply increased to 35% in 2014 Advisory services have been one of the fastest growers in the Big Four firms as the firms extend their services beyond assurance and tax through penetration into current clients or through referrals from other firms who may be conflicted out at their clients. Advisory services have generally increased their share of revenues. In 2004, they had 22% of total revenues and this had sharply increased to 35% in 2014, at the expense of declines in Audit and Tax.
Despite this sharp growth, Advisory services had the sharpest decline of 9% from 2008 to 2009, as clients slowed down transaction and restructuring activities all over the world. But Advisory had the sharpest bounce back among service lines, with revenues up 6% from 2009 to 2010, as equity markets roared back, M&A increased and client demand for consulting grew proportionately. From 2010 to 2011, combined Advisory revenues grew another remarkable 15.9% from $27.8 billion in 2010 to $32.2 billion in 2011. The service line grew at PwC at 20.2%, Deloitte growing at 14.7%, EY up by 14.2%. KPMG Advisory at 14.8% growth. From 2011 to 2012, combined Advisory revenues grew 12.1% from $32.2 billion in 2011 to $36.1 billion in 2012. The service line grew at PwC at 16.7%, Deloitte growing at 13.8%, EY up by 13.0%. KPMG Advisory was the surprising laggard with only 4.2% growth. From 2012 to 2013, combined Advisory revenues grew 6.8% from $36.1 billion in 2012 to $38.5 billion in 2013. The service line grew at PwC at 5.2%, Deloitte growing at 6.5%, EY up by the highest figure of 11.5%. KPMG Advisory was the laggard again with 4.8% growth. From 2013 to 2014, combined Advisory revenues grew 9.9% from $38.5 billion in 2013 to $42.4 billion in 2014. The service line grew at PwC at 9.3%, Deloitte growing at 9.1%, EY up by the highest figure the second year in a row at 11.6%. KPMG Advisory grew a creditable 10.3%.
The 2013 Big Four Firm Performance Analysis January 2015 www.Big4.com Page 25 of 34
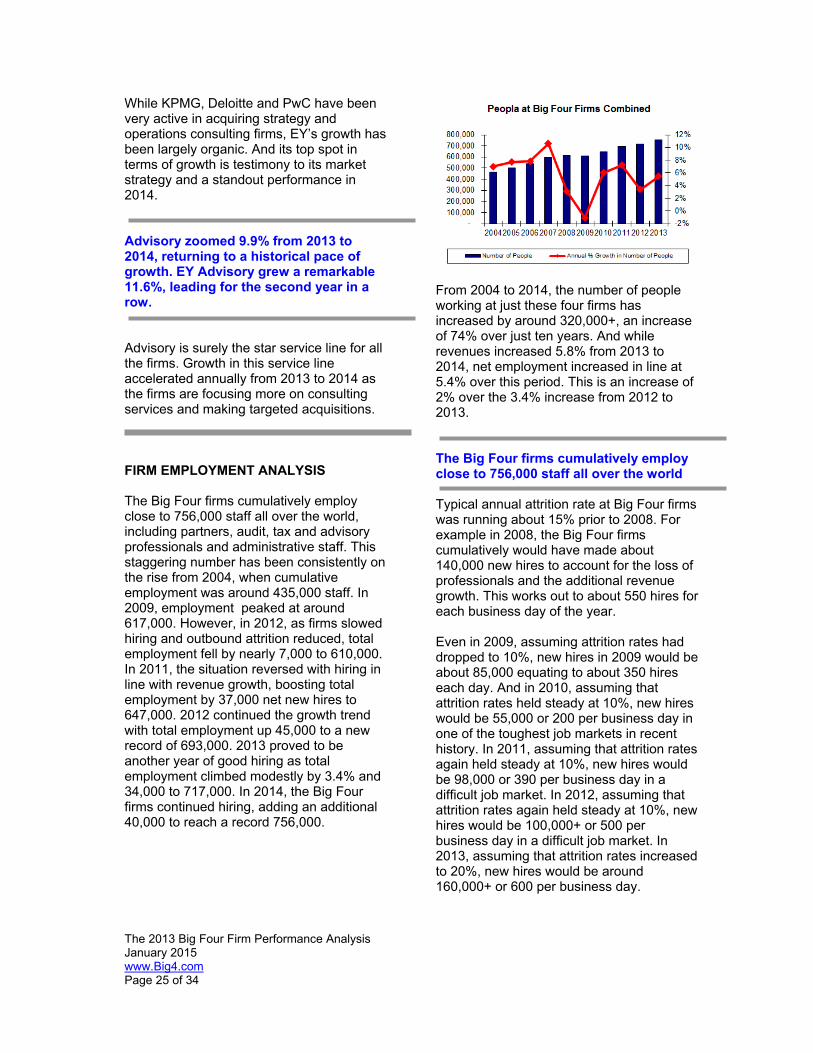
While KPMG, Deloitte and PwC have been very active in acquiring strategy and operations consulting firms, EY’s growth has been largely organic. And its top spot in terms of growth is testimony to its market strategy and a standout performance in 2014. Advisory zoomed 9.9% from 2013 to 2014, returning to a historical pace of growth. EY Advisory grew a remarkable 11.6%, leading for the second year in a row. Advisory is surely the star service line for all the firms. Growth in this service line accelerated annually from 2013 to 2014 as the firms are focusing more on consulting services and making targeted acquisitions. FIRM EMPLOYMENT ANALYSIS The Big Four firms cumulatively employ close to 756,000 staff all over the world, including partners, audit, tax and advisory professionals and administrative staff. This staggering number has been consistently on the rise from 2004, when cumulative employment was around 435,000 staff. In 2009, employment peaked at around 617,000. However, in 2012, as firms slowed hiring and outbound attrition reduced, total employment fell by nearly 7,000 to 610,000. In 2011, the situation reversed with hiring in line with revenue growth, boosting total employment by 37,000 net new hires to 647,000. 2012 continued the growth trend with total employment up 45,000 to a new record of 693,000. 2013 proved to be another year of good hiring as total employment climbed modestly by 3.4% and 34,000 to 717,000. In 2014, the Big Four firms continued hiring, adding an additional 40,000 to reach a record 756,000.
From 2004 to 2014, the number of people working at just these four firms has increased by around 320,000+, an increase of 74% over just ten years. And while revenues increased 5.8% from 2013 to 2014, net employment increased in line at 5.4% over this period. This is an increase of 2% over the 3.4% increase from 2012 to 2013. The Big Four firms cumulatively employ close to 756,000 staff all over the world Typical annual attrition rate at Big Four firms was running about 15% prior to 2008. For example in 2008, the Big Four firms cumulatively would have made about 140,000 new hires to account for the loss of professionals and the additional revenue growth. This works out to about 550 hires for each business day of the year. Even in 2009, assuming attrition rates had dropped to 10%, new hires in 2009 would be about 85,000 equating to about 350 hires each day. And in 2010, assuming that attrition rates held steady at 10%, new hires would be 55,000 or 200 per business day in one of the toughest job markets in recent history. In 2011, assuming that attrition rates again held steady at 10%, new hires would be 98,000 or 390 per business day in a difficult job market. In 2012, assuming that attrition rates again held steady at 10%, new hires would be 100,000+ or 500 per business day in a difficult job market. In 2013, assuming that attrition rates increased to 20%, new hires would be around 160,000+ or 600 per business day.
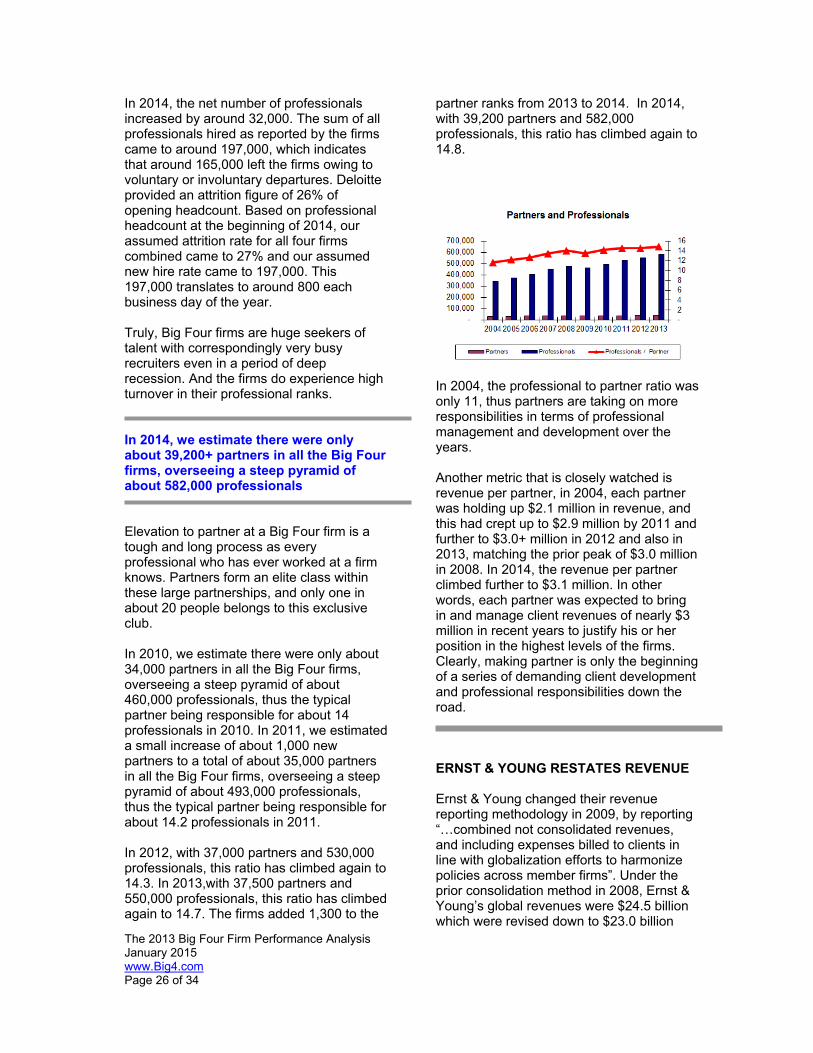
The 2013 Big Four Firm Performance Analysis January 2015 www.Big4.com Page 26 of 34
In 2014, the net number of professionals increased by around 32,000. The sum of all professionals hired as reported by the firms came to around 197,000, which indicates that around 165,000 left the firms owing to voluntary or involuntary departures. Deloitte provided an attrition figure of 26% of opening headcount. Based on professional headcount at the beginning of 2014, our assumed attrition rate for all four firms combined came to 27% and our assumed new hire rate came to 197,000. This 197,000 translates to around 800 each business day of the year. Truly, Big Four firms are huge seekers of talent with correspondingly very busy recruiters even in a period of deep recession. And the firms do experience high turnover in their professional ranks. In 2014, we estimate there were only about 39,200+ partners in all the Big Four firms, overseeing a steep pyramid of about 582,000 professionals Elevation to partner at a Big Four firm is a tough and long process as every professional who has ever worked at a firm knows. Partners form an elite class within these large partnerships, and only one in about 20 people belongs to this exclusive club. In 2010, we estimate there were only about 34,000 partners in all the Big Four firms, overseeing a steep pyramid of about 460,000 professionals, thus the typical partner being responsible for about 14 professionals in 2010. In 2011, we estimated a small increase of about 1,000 new partners to a total of about 35,000 partners in all the Big Four firms, overseeing a steep pyramid of about 493,000 professionals, thus the typical partner being responsible for about 14.2 professionals in 2011. In 2012, with 37,000 partners and 530,000 professionals, this ratio has climbed again to 14.3. In 2013,with 37,500 partners and 550,000 professionals, this ratio has climbed again to 14.7. The firms added 1,300 to the
partner ranks from 2013 to 2014. In 2014, with 39,200 partners and 582,000 professionals, this ratio has climbed again to 14.8.
In 2004, the professional to partner ratio was only 11, thus partners are taking on more responsibilities in terms of professional management and development over the years. Another metric that is closely watched is revenue per partner, in 2004, each partner was holding up $2.1 million in revenue, and this had crept up to $2.9 million by 2011 and further to $3.0+ million in 2012 and also in 2013, matching the prior peak of $3.0 million in 2008. In 2014, the revenue per partner climbed further to $3.1 million. In other words, each partner was expected to bring in and manage client revenues of nearly $3 million in recent years to justify his or her position in the highest levels of the firms. Clearly, making partner is only the beginning of a series of demanding client development and professional responsibilities down the road. ERNST & YOUNG RESTATES REVENUE Ernst & Young changed their revenue reporting methodology in 2009, by reporting “…combined not consolidated revenues, and including expenses billed to clients in line with globalization efforts to harmonize policies across member firms”. Under the prior consolidation method in 2008, Ernst & Young’s global revenues were $24.5 billion which were revised down to $23.0 billion
The 2013 Big Four Firm Performance Analysis January 2015 www.Big4.com Page 27 of 34
under the new combined method of reporting. Ernst & Young restated only 2008 under this methodology but did not restate prior years, thus our analysis is affected by this reporting constraint. Under the prior consolidation method in 2008, Ernst & Young’s global revenues were $24.5 billion which were revised down to $23.0 billion under the new combined method of reporting CONCLUSION The 2007 to 2009 recession has been the world’s worst financial crisis for over 70 years, and despite such turbulence, the Big Four firms turned in quite a creditable performance, with revenues falling by single digits in local currency terms from 2008 to 2009. Since March 2009, global financial markets had a marked improvement in equity values, and general business conditions are in much better shape in December 2014. 2011 marked a return to moderate growth and positive global macroeconomic momentum, very favorable for all Big Four firms Leading economic indicators in developed nations were on the uptrend in 2014 and both OECD and emerging market countries posted multiple quarters of positive GDP growth. 2015 has seen the general continuation of positive trends with strong outlook in United States, but generally subdued growth expectations for Europe, Japan and China. Large economic crises though seem to have been averted.
US and Canada appear to be leading in terms of recovery as evidenced by buoyant equity markets in 2014 US and Canada appear to be leading in terms of recovery as evidenced by buoyant equity markets in 2014. Strong growth results in North America by all Big Four firms are reflective of the resurgence in the Americas region. Further, an optimistic outlook among global executives, rebounding M&A activity, continued globalization strongly favored Big Four firm revenue growth, as the firms participated in an increasing level of financial activities pursued by their clients, whether it be tax restructuring or compliance, transfer pricing, mergers and acquisitions, IPOs, strategic growth, risk management, IFRS conversions or audit compliance. Capitalizing on these favorable trends, in 2014, the firms had solid performance reaching record revenues for each firm and for the combined entities. While there was a backdrop of tough economic climate, difficult global challenges, intense audit competition, economic rebalancing, increasing regulation, market uncertainty, and slowing growth in developing countries, these factors were not large enough overall to detract from accelerating growth. Capitalizing on these favorable trends, in 2014, the firms had solid performance reaching record revenues for each firm and for the combined entities Fiscal year 2014, which ranged from mid-2013 to mid-calendar 2014, produced highly welcome positive revenue growth. After seeing the moderate results for 2013 against expectations of 4%-7%, we lowered our expectations for 2014 to 3%-6%, still forecasting good growth in the year for a variety of key factors: Companies having improved their
bottom lines, were moving from a mentality of cost control to a more optimistic attitude of aggressively seeking top line growth. This would
The 2013 Big Four Firm Performance Analysis January 2015 www.Big4.com Page 28 of 34
translate into greater need for consulting and tax services from the Big Four firms
Global equity markets were positive in
2014 with outlook for further gains. Credit markets were very fluid due to continuing low interest rates and private equity firm activity was sharply up.
Both Merger and Acquisition activity and
Initial Public Offerings are on the rise in 2014.
Big Four firms’ 2013 revenue had been
moving up based on prior years momentum, and likely to continue into 2014.
For 2014, we lowered our expectations to 3% to 6% growth, and very hopeful of continuing solid performance. Actual performance was at the top of the range Overall, actual 2014 performance of 5.8% turned out to be at the higher end of our expectations. Growth in the Audit was more solid than our anticipation, and a strong acceleration from near-flat growth in 2013. External conditions and inter-firm competition did not ultimately have that much effect on performance. Tax continued its strong growth in 2014, returning to a pace seen in 2012, owing to continued demand for tax advisory and compliance. Advisory growth zoomed from 2013 to 2014 showing signs of strong growth seen a few years ago. Consulting in the US was a big driver and recent acquisitive activity in this service line was starting to manifest as strong growth both in volume and expansion of client capabilities. Americas grew much faster than anticipated as the US pulled the globe out of recession. Interestingly, this helped Americas retain the top spot of regional revenue from Europe.
Europe this year was a big surprise. Growth in Europe was lower than Americas in local currency terms, but was much higher than Americas on US dollar terms. The firms seemed to have growth despite the difficult continuing regional issues. Americas grew much faster than anticipated as the US pulled the globe out of recession. Europe this year was a big surprise. Asian revenue was significantly affected by the appreciating US dollar Asian revenue was significantly affected by the appreciating US dollar. While the region turned in good performance in local currencies, when converted to US dollars, this robbed the region of 6.4% growth points. From 2012 to 2013, Asian revenue actually shrunk, an unanticipated condition. Despite external conditions and relatively lower growth in peer firms, EY turned out to the star performer, posting remarkable growth results in every service line and geography. EY Advisory grew 12.3% and was the star service line in the industry. EY grew the fastest among all four firms. The top spot among the Big Four firms was a toss up in 2013 owing to the small differential between PwC and Deloitte. Deloitte’s larger revenue base in 2013 turned out to be a winning card, which offset its slower growth pace to still maintain its lead over PwC by $248 million, a small drop from 2013’s lead of $311 million. Overall actual 2014 performance of 5.8% turned out to be at the higher end of our expectations. Growth in the Audit was more solid than our anticipation, and a strong acceleration from near-flat growth in 2013. Americas and Advisory were strong and Tax turned in good results. EY was the overall growth leader. Deloitte retained top spot. Americas continued to be the top region

The 2013 Big Four Firm Performance Analysis January 2015 www.Big4.com Page 29 of 34
The Big Four firms dominate their space and are unlikely to face any emerging competitors for a long time, and while regulation and audit litigation do pose operating and financial risks, it is unlikely that any of these single items will be of sufficient magnitude to generally upset the status quo. For 2015 and beyond, we foresee several favorable and unfavorable factors. We anticipate that favorable factors will outweigh and product 3% to 6% revenue growth in 2015 and similar levels going forward OUTLOOK 2011 through 2013 have been solid turning points, building upon the foundation set in 2010, as the world’s worst economic crisis faded into the rear view mirror. For 2015 and beyond, we will see good revenue growth for all firms, driven by generally favorable economic circumstances. In particular, for fiscal year 2015 (mid-2014 to mid-2015), we see a 3% to 6% overall growth for all the firms. Strong business momentum will be somewhat moderated by a strengthening US dollar. Based on the results seen in 2014, and the commentary provided by the firms, we lay out the favorable and unfavorable revenue factors which will impact revenue growth in 2015. Overall, we do see that favorable factors will outweigh all unfavorable points. Favorable Factors The Big Four firms have participated extensively in the explosive growth in the emerging markets and recently improvements in developed countries. And while it will be harder to grow at high levels from an already huge revenue baseline, now exceeding $20 billion for each firm, the firms have demonstrated tremendous global
breadth and depth to benefit from global growth or even changes in their client base. Particularly, we see some favorable factors to drive growth in the near to medium term, for 2015 and beyond: Audit performance in 2014 was certainly
solid, indicating that firms were able to increase revenues despite a tough competitive marketplace. Particularly, specialty services within Audit: Risk Consulting, Risk & Data Security Management & Reporting, Social & Environmental Reporting and Total Impact Measurement and Performance Improvement will likely see continued higher demand compared to traditional audit services.
Tax will directly benefit from client
globalization, needs for compliance, M&A and complexity in supply chains. Tax will also benefit from multi-year growth and recent investments in the service line to produce solid revenue growth.
The US, a very key market for Big Four
firms, is enjoying strong & rapid growth, low interest rates, decelerating unemployment and a strong dollar. Big Four US revenues have been growing strongly and will continue their solid ascent.
Within Advisory, Strategy Consulting,
Data & Analytics and Outsourcing will strongly benefit from continuing momentum and the Big Four firms’ increasing scope and penetration in this sector. Global equity markets were buoyant in 2014 with strong IPO and M&A activity. With low debt rates continuing to persist, this translates to good demand for all service lines
Global equity markets had a very strong
performance throughout the entire 2014 calendar year, with outstanding IPO and M&A activity. This will translate into

The 2013 Big Four Firm Performance Analysis January 2015 www.Big4.com Page 30 of 34
higher demand across the board for Big Four services. More so, interest rates globally are low and likely to rise only moderately in 2015, which will further contribute to capital market needs for Big Four services.
2014 has shown that Big Four firms are rapidly making selective acquisitions to enhance their consulting expertise. These value-adding services will provide additional boosts to overall revenue. In particular, PwC’s Booz, Deloitte’s Monitor, EY’s Parthenon and Thomson Reuters and KPMG’s numerous analytic acquisitions will be integrated and enhance strategic and operational consulting capabilities, resulting in even higher Advisory growth. 2014 has shown that Big Four firms are rapidly making selective acquisitions to enhance their consulting expertise. These value-adding services will provide additional boosts to overall revenue
Continued absence of credible and
scaled competition will perpetuate the domination of Big Four firms in the Audit and Tax markets, notwithstanding any efforts in European zone to diminish Big4’s near monopolies.
Adoption of IFRS standards all over the
world will continue to accelerate in 2015 and beyond, necessitating external assistance from Big Four auditors to effect implementation and compliance.
Unfavorable Factors The audit and assurance service line will
continue to be impacted by tough external conditions, client pressures, and intense inter-firm competition, which will likely continue to pressure growth rates.
Foreign currency effect will likely be
unfavorable for Fiscal Year 2015 (mid-
calendar year 2014 to mid-calendar year 2015) as the US dollar has substantially appreciated against all global currencies since June 2014. This means that local currency results from Asia, Europe and South America, key regions for the Big Four firms, will translate into fewer amount of US dollars; and local currency growth will translate to lower levels of growth when measured in US dollars. In particular, Japanese revenue will be severely impacted due to the deep depreciation of the Japanese Yen.
Europe continues to face slow GDP
growth, potential disinflation, high unemployment and continued easy monetary policy. This will likely have negative impact though 2014.
Commodity prices, especially oil, have declined since July 2014. This will immediately reduce revenue and capital investments with potential spillover to related sectors; with consequent unfavorable impact on professional services provided by Big Four firms.
Commodity prices have generally
declined since July 2014, especially oil which has dropped more than 50% in price, as has iron ore, copper and other metal and non-metal commodities. This will immediately reduce revenue and capital investments in these industries with potential spillover to related sectors; with consequent unfavorable impact on professional services provided by Big Four firms.
Asian economies have slowed in
2014/2015, especially China and Japan which are facing moderating GNP annual % rates of growth, creating lower consequential demand for Big Four firm services. However India is on the upsurge.
Middle East and African economies
which are reliant on a high oil prices are decelerating and facing budget

The 2013 Big Four Firm Performance Analysis January 2015 www.Big4.com Page 31 of 34
shortfalls. Big Four firms have had tremendous success in these countries will now face a sharp slowdown.
The BRIC countries are each affected
by their individual localized factors. Specifically Brazil is being impacted by lower commodity prices and infrastructural impediments. Russia is facing recession and international isolationism.
What to Look for in 2015 and Beyond Beyond 2015, we do see several years of anticipated solid growth with general global improvement and large scope and size of the Big Four firms. 2015 will be an interesting year to watch for any changes in Big Four rankings: whether Deloitte will be able to maintain its lead over PwC, whether EY can continue its strong growth streak and increase its gap against KPMG; and whether Americas can maintain their top position among the regions. Further, we will analyze the impact of the recently appreciating US dollar on growth rates. More so, the impact of the recent slowdown in Eurozone on Europe growth will be monitored. Also, we will be looking for sustainable improvement in the Audit service line. Finally, any large acquisitions in the Advisory space by any firm will be on our watchlist. 2015 will also be an interesting year to see if Deloitte will continue to maintain its lead over PwC, whether EY can continue its growth streak, whether Americas remains on top, sustainability of Audit growth, impact of recent Eurozone slowdown and large acquisitions in Advisory
The 2013 Big Four Firm Performance Analysis January 2015 www.Big4.com Page 32 of 34
Notes All figures are in United States dollars. Disclaimer Source of facts and figures for this analysis are publicly available financial statements and / or press releases issued by Deloitte & Touche LLP, Ernst & Young LLP, KPMG LLP and PricewaterhouseCoopers LLP on their websites or on the internet. Big4.com believes in these numbers and analysis, but does not guarantee their accuracy. Some numbers and ratios have been estimated due to non-availability of information. Numbers may not add or slightly vary due to rounding. Photo attribution Full attribution for cover page photograph is due to Paul Kelly at Yahoo Flickr Creative Commons. All logos and trademarks are copyrights of their respective owners. Use Of This Analysis
This analysis is meant for your personal or organization’s use only. You may not distribute parts or whole of this analysis to others or other organizations, either in hard copy or over the internet. You can use this data for internal analysis, but prominent and full attribution should be given at all times to: “The 2014 Big Four Firms Performance Analysis by www.Big4.com” Contact For further information, please contact Big4.com: Phone: (866) 690-5050 Email: [email protected] The Big Four Job Board The Big Four Blog Big4 on Youtube Big4 on Twitter Big4 on Facebook Big4 on LinkedIn Big4 on Xing
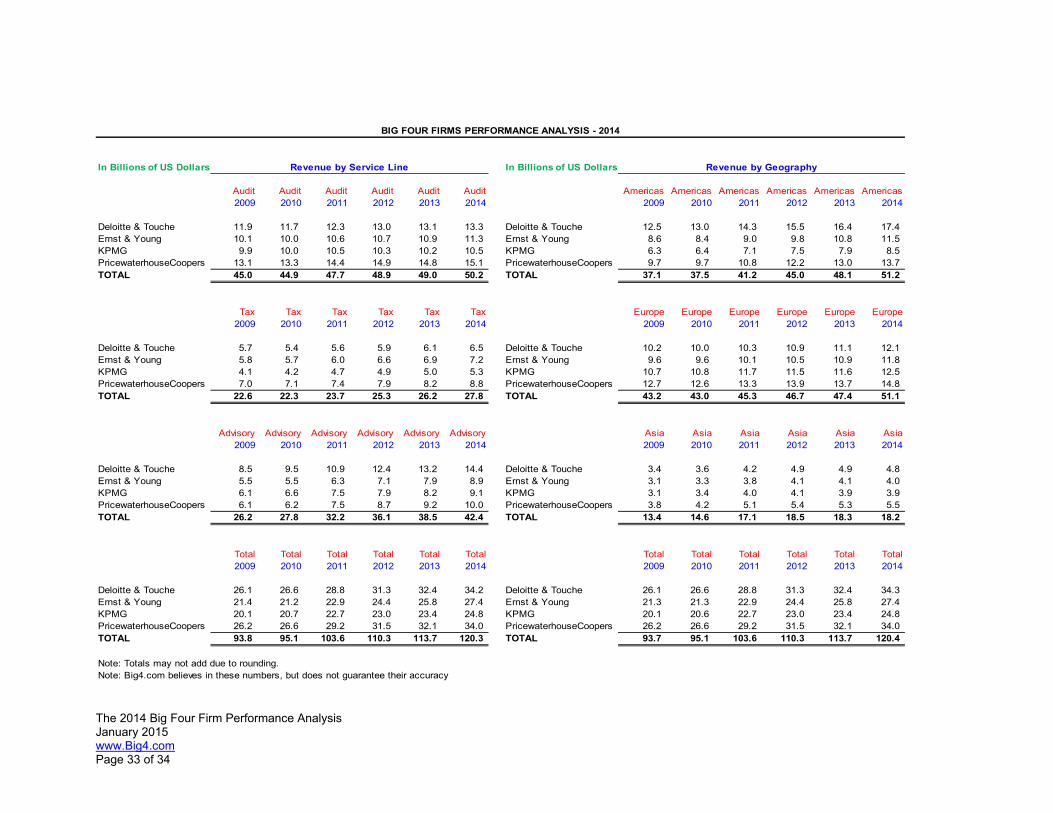
The 2014 Big Four Firm Performance Analysis January 2015 www.Big4.com Page 33 of 34
In Billions of US Dollars In Billions of US Dollars
Audit Audit Audit Audit Audit Audit Americas Americas Americas Americas Americas Americas2009 2010 2011 2012 2013 2014 2009 2010 2011 2012 2013 2014
Deloitte & Touche 11.9 11.7 12.3 13.0 13.1 13.3 Deloitte & Touche 12.5 13.0 14.3 15.5 16.4 17.4 Ernst & Young 10.1 10.0 10.6 10.7 10.9 11.3 Ernst & Young 8.6 8.4 9.0 9.8 10.8 11.5 KPMG 9.9 10.0 10.5 10.3 10.2 10.5 KPMG 6.3 6.4 7.1 7.5 7.9 8.5 PricewaterhouseCoopers 13.1 13.3 14.4 14.9 14.8 15.1 PricewaterhouseCoopers 9.7 9.7 10.8 12.2 13.0 13.7 TOTAL 45.0 44.9 47.7 48.9 49.0 50.2 TOTAL 37.1 37.5 41.2 45.0 48.1 51.2
Tax Tax Tax Tax Tax Tax Europe Europe Europe Europe Europe Europe2009 2010 2011 2012 2013 2014 2009 2010 2011 2012 2013 2014
Deloitte & Touche 5.7 5.4 5.6 5.9 6.1 6.5 Deloitte & Touche 10.2 10.0 10.3 10.9 11.1 12.1 Ernst & Young 5.8 5.7 6.0 6.6 6.9 7.2 Ernst & Young 9.6 9.6 10.1 10.5 10.9 11.8 KPMG 4.1 4.2 4.7 4.9 5.0 5.3 KPMG 10.7 10.8 11.7 11.5 11.6 12.5 PricewaterhouseCoopers 7.0 7.1 7.4 7.9 8.2 8.8 PricewaterhouseCoopers 12.7 12.6 13.3 13.9 13.7 14.8 TOTAL 22.6 22.3 23.7 25.3 26.2 27.8 TOTAL 43.2 43.0 45.3 46.7 47.4 51.1
Advisory Advisory Advisory Advisory Advisory Advisory Asia Asia Asia Asia Asia Asia2009 2010 2011 2012 2013 2014 2009 2010 2011 2012 2013 2014
Deloitte & Touche 8.5 9.5 10.9 12.4 13.2 14.4 Deloitte & Touche 3.4 3.6 4.2 4.9 4.9 4.8 Ernst & Young 5.5 5.5 6.3 7.1 7.9 8.9 Ernst & Young 3.1 3.3 3.8 4.1 4.1 4.0 KPMG 6.1 6.6 7.5 7.9 8.2 9.1 KPMG 3.1 3.4 4.0 4.1 3.9 3.9 PricewaterhouseCoopers 6.1 6.2 7.5 8.7 9.2 10.0 PricewaterhouseCoopers 3.8 4.2 5.1 5.4 5.3 5.5 TOTAL 26.2 27.8 32.2 36.1 38.5 42.4 TOTAL 13.4 14.6 17.1 18.5 18.3 18.2
Total Total Total Total Total Total Total Total Total Total Total Total2009 2010 2011 2012 2013 2014 2009 2010 2011 2012 2013 2014
Deloitte & Touche 26.1 26.6 28.8 31.3 32.4 34.2 Deloitte & Touche 26.1 26.6 28.8 31.3 32.4 34.3 Ernst & Young 21.4 21.2 22.9 24.4 25.8 27.4 Ernst & Young 21.3 21.3 22.9 24.4 25.8 27.4 KPMG 20.1 20.7 22.7 23.0 23.4 24.8 KPMG 20.1 20.6 22.7 23.0 23.4 24.8 PricewaterhouseCoopers 26.2 26.6 29.2 31.5 32.1 34.0 PricewaterhouseCoopers 26.2 26.6 29.2 31.5 32.1 34.0 TOTAL 93.8 95.1 103.6 110.3 113.7 120.3 TOTAL 93.7 95.1 103.6 110.3 113.7 120.4
Note: Totals may not add due to rounding. Note: Big4.com believes in these numbers, but does not guarantee their accuracy
Revenue by Service Line Revenue by Geography
BIG FOUR FIRMS PERFORMANCE ANALYSIS - 2014

The 2014 Big Four Firm Performance Analysis January 2015 www.Big4.com Page 34 of 34
THE 2014 BIG FOUR FIRMS PERFORMANCE ANALYSIS