Embed Size (px)
Citation preview

The 2010 Eyjafjallajökull summit eruption: Nature of the explosive activity in the initial phase
Elísabet Pálmadóttir
Faculty of Earth science
University of Iceland
2016


The 2010 Eyjafjallajökull summit eruption: Nature of the explosive activity in the initial phase
Elísabet Pálmadóttir
60 ECTS thesis submitted in partial fulfillment of a
Magister Scientiarum degree in Geology
Advisor
Professor Þorvaldur Þórðarson
External Examiner
Lucia Gurioli
M.Sc. committee Professor Þorvaldur Þórðarson
Professor Bruce F. Houghton
Faculty of Earth Sciences School of Engineering and Natural Sciences
University of Iceland Reykjavík, 29 May 2016
The 2010 Eyjafjallajökull summit eruption: Nature of explosive activity in the initial phase
Explosive activity in Eyjafjallajökull 2010 event
60 ECTS thesis submitted in partial fulfilment of a Magister Scientiarum degree in
Geology
Copyright © 2016 Elísabet Pálmadóttir
All rights reserved
Faculty of Earth Sciences
School of Engineering and Natural Sciences
University of Iceland
Sturlugata 7. Askja
101, Reykjavik
Iceland
Telephone: 525 4000
Bibliographic information:
Elísabet Pálmadóttir, 2016, The 2010 Eyjafjallajökull summit eruption: Nature of explosive
activity in the initial phase, Master’s thesis, Faculty of Earth Sciences, University of
Iceland.
ISBN
Printing: Háskólaprent, Fálkagata 2, 107 Reykjavík
Reykjavík, Iceland, 6th month 2016

Abstract
On 14 April 2010 the summit of Eyjafjallajökull started to erupt, following an effusive
eruption at the volcanoes flank. This was a hybrid eruption that featured pulsating explosive
activity along with lava effusion. On 17 April 2010, which is the focus of this study, the
magma discharge rate was estimated around 6.0 x 10⁵ kg s-1 with a plume reaching over 9
km. Plume monitoring covering seven hours of the afternoon on the 17th, revealed eight
distinct pulsating periods of dark explosive plume pulses, following periods of little or no
activity. The deposits from the afternoon on 17 April consists of six alternating pumice lapilli
and ash-grade units, thus matching the main pulses of explosive activity. The sampled tephra
units contain fairly high amounts (7-45%) of ash (<2 mm), which presence at such a
proximal site is best explained by ash aggregation induced by water vapor derived from the
melted glacier ice. Density measurements, along with image analysis of the vesicles,
revealed mainly two types of clasts: 1) Pumices, typified by densities of 600 to 1000 kg m-
3) and showing evidence of at least two nucleation events and substantial growth upon
decompression. 2) Juvenile lithics with densities of 1400 to 1800 kg m-3, outgassed and with
evidence of collapsed bubble framework. A formation of a plug from outgassed magma at
top of the rising magma column is proposed as the mechanism controlling the pulsating
explosive activity on 17 April 2010.
Útdráttur
Þann 14 apríl 2010 hófst blandgos í toppgíg Eyjafjallajökuls sem myndaði hvort tveggja
benmorít gjósku og hraun. Þann 17. apríl 2010, sem er dagurinn sem er til umfjöllunar í
þessari ritgerð var sprengigosið í hámarki. Kvikuframleiðni gossins var um 6.0x10⁵ kg s-1
og gosstrókurinn náði í meira en 9 km hæð. Athuganir á gosmekkinum á sjö klukkustunda
tímabili þann 17. apríl sýna átta afgerandi tímabil þar sem gosmökkurinn var kraftmikill og
dökkur á litinn (þ.e. öskuríkur). Þessi tímabil voru aðskilin af tímabilum þar sem
sprengivirknin lá niðri og gosmökkurinn var hvítur (þ.e. gufa). Gjóskusyrpan sem myndaðist
seinni part dags þann 17. apríl á suðurbarmi toppgígsins, samanstendur af sex þykkum
gosmalarlögum sem eru aðskilin af þunnum öskuríkum lögum. Þessi lagskipting virðist
endurspegla púlsavirkni sprengigossins á þessum tíma. Gjóskusýnin frá þessari syrpu sem
voru kornastærðargreind hafa hátt hlutfall af ösku (7-45% af kornum <2 mm). Sennilega er
það vegna þess að samsöfnun á öskukornum vegna samloðunar myndaði öskukúlur sem
náðu gosmalarstærð og féllu því til jarðar í grennd við gosgíginn. Eðlisþyngdarmælingar og
smásjáarathuganir á gosmölinni leiddu í ljós tvennskonar kornagerðir: 1) vikur með
eðlisþyngd frá 600 til 1000 kg m-3, er innheldur vitnisburð um tvö afgösunarstig á kvikunni
þegar hún reis upp eftir gosrásinni, og 2) þétt korn með eðlisþyngd frá 1400 to 1800 kg m-3
sem er upprunnin frá útgasaðri kviku þar sem blöðrurnar eru að hluta til fallnar saman.
Tillaga um að útgasaða kvikan hafi sex sinnum myndaði tappa í efri hluta gosrásarinnar er
lögð fram sem skýring á púlsavirkni sprengigossins þann 17. apríl.


xi
Table of Contents
List of Figures .......................................................................................................... xiii
List of Tables ............................................................................................................ xvi
Abbreviations .......................................................................................................... xvii
Acknowledgements ................................................................................................... xx
1. Introduction ............................................................................................................ 1
2. Volcanism in Iceland ............................................................................................. 3 2.1 Iceland geology .............................................................................................. 3 2.2 Volcanism in Iceland ...................................................................................... 4 2.3 Explosive volcanism....................................................................................... 6
2.3.1 Dry explosive eruptions ........................................................................ 8 2.3.2 Fragmentation processes ..................................................................... 10
2.3.3 Phreatomagmatic eruptions ................................................................. 11 2.4 Volcanic plumes ........................................................................................... 12
3. Geology of Eyjafjöll ............................................................................................. 15 3.1 Eyjafjallajökull volcanic system .................................................................. 15 3.2 Eruption history ............................................................................................ 16
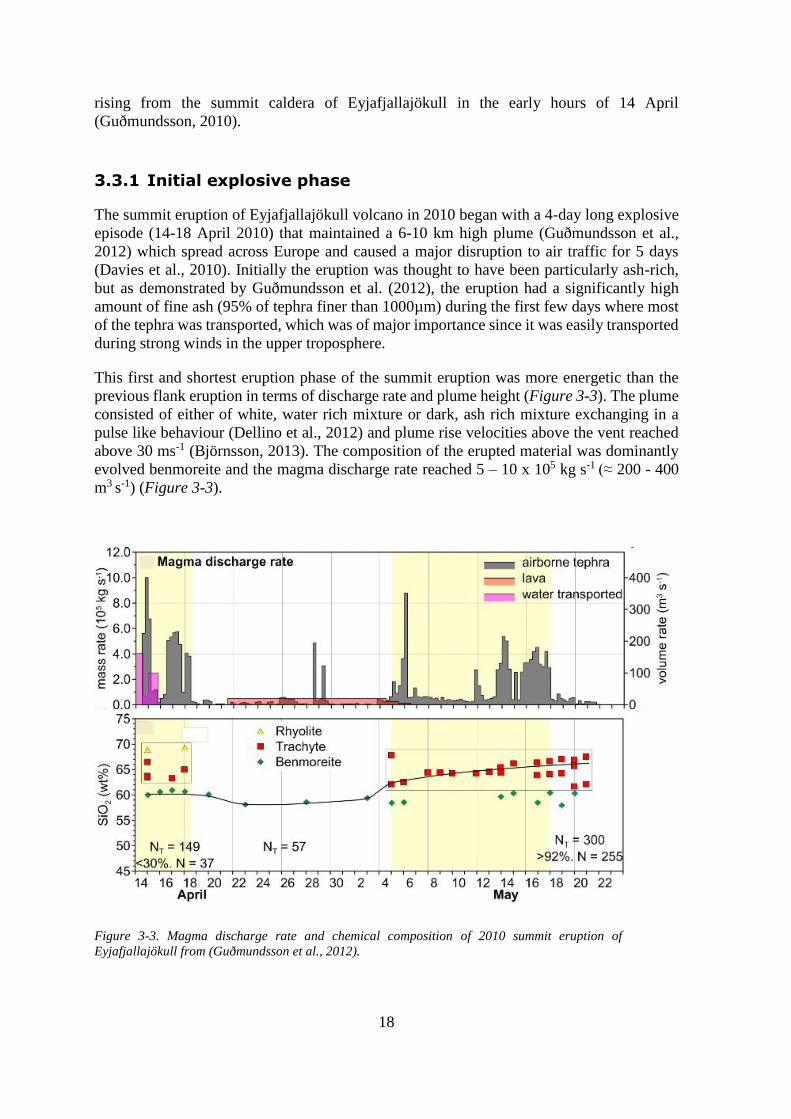
3.3 2010 Eruption ............................................................................................... 16 3.3.1 Initial explosive phase......................................................................... 18
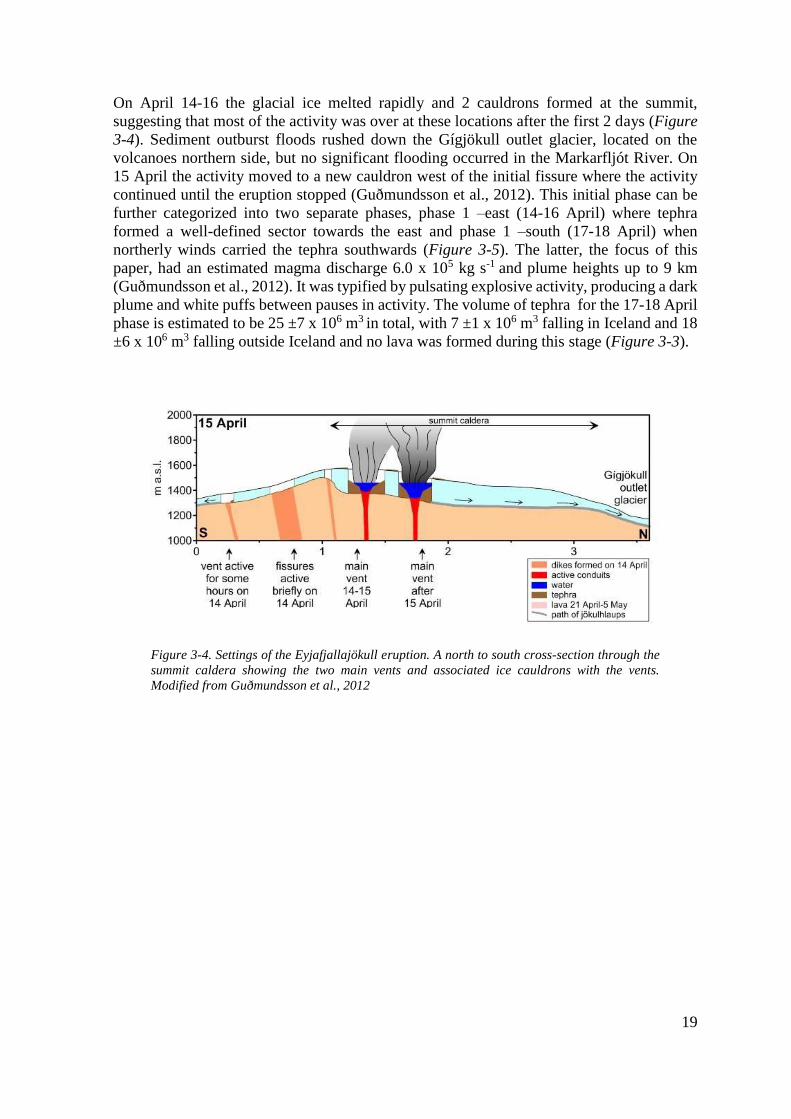
3.3.2 Later phases ........................................................................................ 20
4. Methodology ......................................................................................................... 23 4.1 Field observations and sampling .................................................................. 23
4.2 Plume observations....................................................................................... 24 4.3 Grain size analysis ........................................................................................ 27
4.3.1 Sieving ................................................................................................ 28
4.4 Density and vesicularity measurements ....................................................... 28 4.5 Image analysis .............................................................................................. 31
4.5.1 Sample preparation ............................................................................. 31 4.5.2 Image acquistion ................................................................................. 32 4.5.3 Image strategy ..................................................................................... 34
4.5.4 Image rectification .............................................................................. 35 4.5.5 Image analysis ..................................................................................... 36
4.5.6 Limitations of the data ........................................................................ 43
5. Results ................................................................................................................... 45 5.1 Plume observations....................................................................................... 45
5.1.1 White plume ........................................................................................ 47
xii
5.1.2 Dark plume ......................................................................................... 49 5.2 Stratigraphy .................................................................................................. 49 5.3 Grain size analysis ....................................................................................... 52 5.4 Density and vesicularity ............................................................................... 53
5.4.1 Clast morphologies ............................................................................. 57 5.5 Image analysis .............................................................................................. 59
5.5.1 Bubble morphology ............................................................................ 63
6. Discussion ............................................................................................................. 71 6.1 Stratigraphy and plume observations ........................................................... 71
6.2 Grain size ..................................................................................................... 73 6.3 Density and vesicularity ............................................................................... 73
6.4 Image analysis .............................................................................................. 74 6.5 Eruption scenario ......................................................................................... 75
7. Conclusions .......................................................................................................... 79
8. References............................................................................................................. 81
xiii
List of Figures
Figure 2-1. Iceland and the North Atlantic. .......................................................................... 3
Figure 2-2. A geological map of Iceland .............................................................................. 4
Figure 2-3. Ft vs Ad ............................................................................................................... 7
Figure 2-4. Conduit flow ....................................................................................................... 8
Figure 2-5. The solubility of H2O and CO2 with pressure ..................................................... 9
Figure 2-6 Clast forming processes and possible enhancement interactions ..................... 11
Figure 2-7. The different phases of a volcanic plume ......................................................... 13
Figure 3-1.Eyjafjallajökull area .......................................................................................... 15
Figure 3-2. Schematic east-west cross-section across the summit area ............................. 17
Figure 3-3. Magma discharge rate and chemical composition .......................................... 18
Figure 3-4. Settings of the Eyjafjallajökull eruption. .......................................................... 19
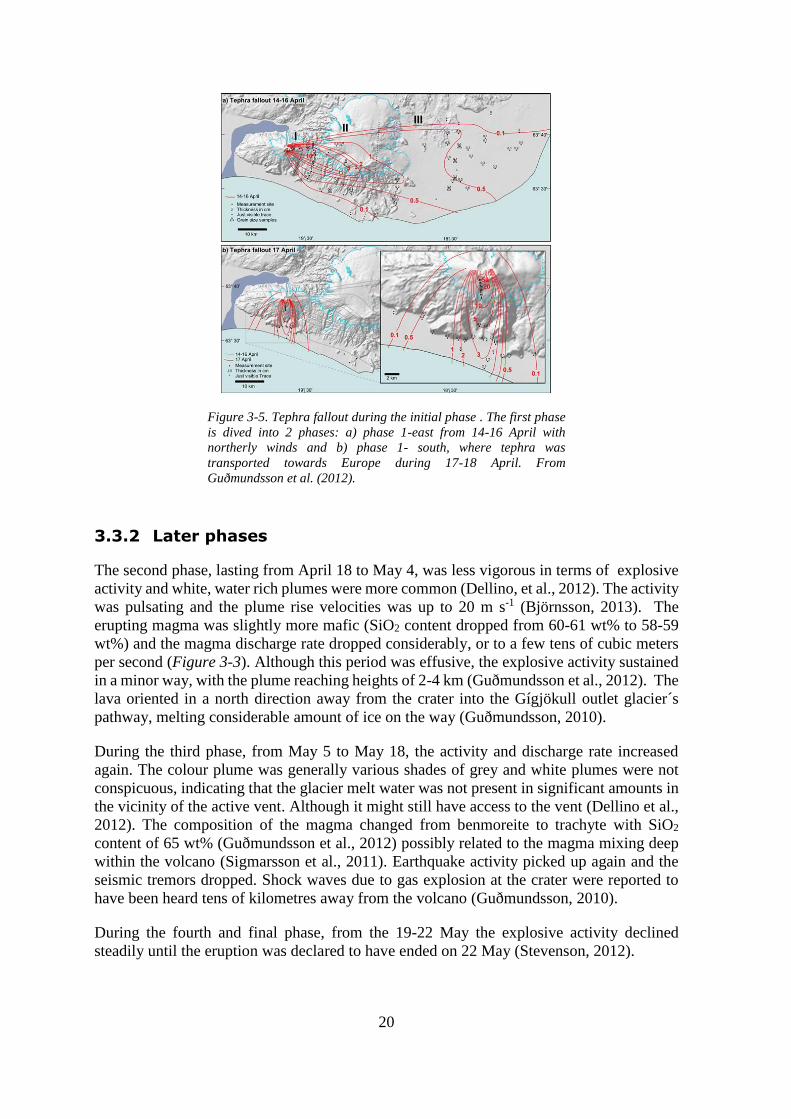
Figure 3-5. Tephra fallout during the initial phase ............................................................ 20
Figure 4-1. Section JG070811............................................................................................. 23
Figure 4-2. Stratigraphic column of the entire section ...................................................... 24
Figure 4-3. The location and distance of the Míla webcamera........................................... 25
Figure 4-4. Scale bar of plume height ................................................................................. 26
Figure 4-5. A Pulsating episode .......................................................................................... 27
Figure 4-6 Density measurements procedure ..................................................................... 30
Figure 4-7. Image analysis of Clast 70_37 ......................................................................... 33
Figure 4-8. Image analysis at 100x magnification of clast 70_37 ...................................... 36
Figure 4-9 Sample 70_37_100a decoaleced images processed in ImageJ ......................... 37
Figure 4-10. An overview of each magnification in sample 70_37 ..................................... 40
Figure 4-11. Number of vesicles per unit area versus vesicle size ..................................... 40
Figure 5-1. A natural-colour satellite image from 17 April ................................................ 45
Figure 5-2. Plume height measurements of the summit eruption of Eyjafjallajökull .......... 46
xiv
Figure 5-3. A timeline of plume pulses ............................................................................... 46
Figure 5-4. A white plume episode ...................................................................................... 48
Figure 5-5. A dark plume episode ....................................................................................... 49
Figure 5-6. A stratigraphic column representing the 17 April 2010 .................................. 51
Figure 5-7. Grain size histogram from layer 70 ................................................................. 52
Figure 5-8 Histograms of grain size analysis from layers 83 ............................................. 53
Figure 5-9 Histograms of grain size analysis from layer 110 ............................................ 53
Figure 5-10. Density and Vesicularity of layer 70 .............................................................. 54
Figure 5-11. Density and vesicularity of layer 83 .............................................................. 55
Figure 5-12. Density and vesicularity of layer 90 .............................................................. 55
Figure 5-13. Density and vesicularity of layer 97 .............................................................. 55
Figure 5-14. Density and vesicularity of layer 110. ........................................................... 56
Figure 5-15. Mean density lapilli layer samplesfrom 17 April ........................................... 56
Figure 5-16. Mean density derived vesicularity for the 5 lapilli rich layers ...................... 57
Figure 5-17. The two clasts chosen for image analysis from layer 97 ............................... 58
Figure 5-18. Morphologies of the various scoria clasts with low vesicularity ................... 59
Figure 5-19 Non-juvenile lithics and foreign clasts ............................................................ 59
Figure 5-20 Histogram of densities of the two layers ......................................................... 60
Figure 5-21. Decoaleaced images ...................................................................................... 61
Figure 5-22 . Decoaleced images at 50x, 100x and 250x magnifications. ......................... 62
Figure 5-23. Vesicle size distribution ................................................................................. 64
Figure 5-24. The vesicle volume distribution, VVD ............................................................ 66
Figure 5-25. Cumulative volume fraction size distribution (CVVD) .................................. 66
Figure 5-26. VG/VL vs NVm ............................................................................................... 69
Figure 6-1. A proposal ........................................................................................................ 72
Figure 6-2. Accretionary lapilli found near Seljavallalaug ................................................ 73
Figure 6-3. A schematic drawing of a plug formation proposal ......................................... 77

xv
xvi
List of Tables
Table 2-1 Definitions effusive, hybrid and explosive eruptions in Iceland ........................... 5
Table 2-2 Volcanic systems active in historical times in Iceland. ........................................ 6
Table 3-1. List of historic eruptions in Eyjafjallajökull. ..................................................... 16
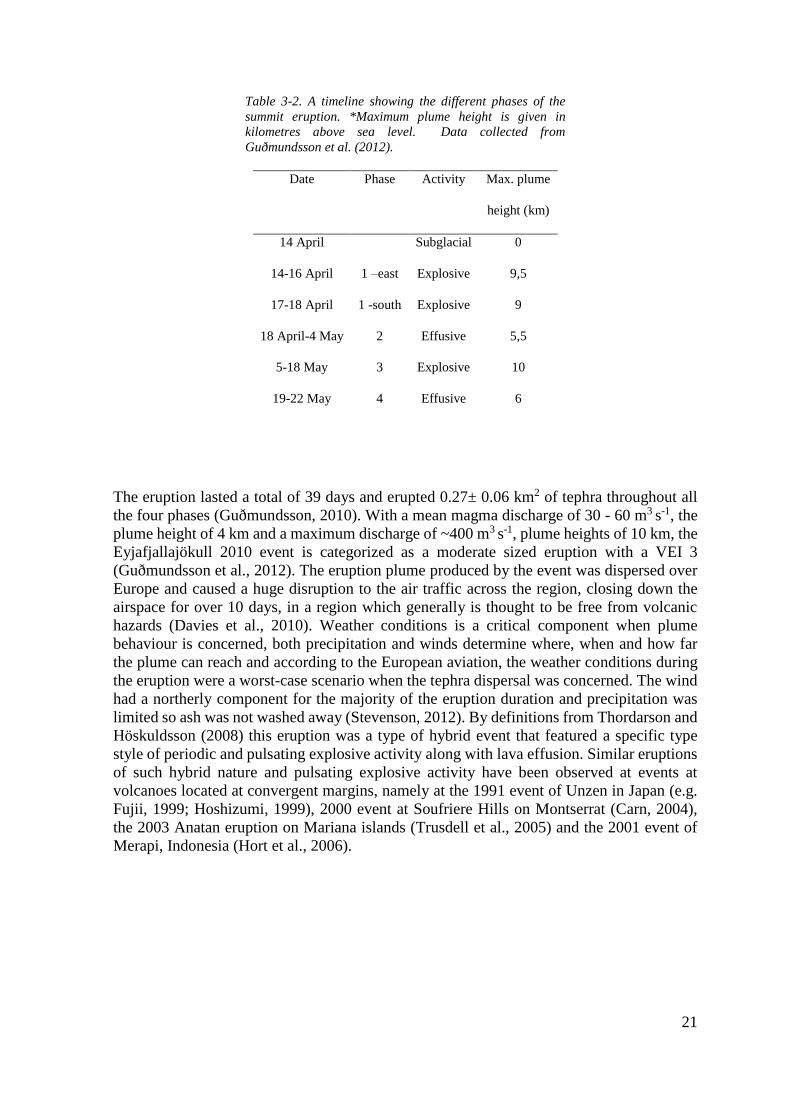
Table 3-2. A timeline showing the different phases of the summit eruption. ...................... 21
Table 4-1. Image information and timing ........................................................................... 25
Table 4-2. Methods of pulse counting. ................................................................................ 27
Table 4-3. An illustration of the 13 image “Exponential” Nest from SEM imaging. ......... 34
Table 4-4 Calculated distance/scale factor in pixels for each magnification ..................... 38
Table 5-1. Number of pulses per dark plume periods (Figure 5-3). ................................... 47
Table 5-2. A timeline example of a typical dark plume explosion cycle ............................. 48
Table 5-3 Density- and vesiculariy means and ranges ....................................................... 54
Table 5-4. Mode peaks of density measured samples. ........................................................ 57
Table 5-5. The modes of Vesicle volume distribution ......................................................... 65
Table 5-6. Final results from image analysis ...................................................................... 68
xvii
Abbreviations
Ap Area in pixels (px2)
Atot Total image area (mm2)
AR Referenced area (px/mm)
ARtot Total referenced area (px/mm)
AV Vesicle area (mm2)
BsDs Bubble size Distribution
Cf Crystal fraction
Dpi Dots per Image
EqD Equivalent diameter (mm)
EVZ East Volcanic Zone
EVRZ East Volcanic Rift Zone
Fbin Frequency of vesicles in each bin
FOAMS The Fast Object Analysis and Measurement System
FV Frequency of vesicle area
Gc Crystal mean greyscale value
Ge Edge vesicle mean greyscale value
GIMP GNU Image Manipulation Program
GNU GNU´s Not Unix
GSD Grain size distribution
GPS Global Positioning System
Gv Vesicle mean greyscale value
H‘ Mean projected height (mm)
Ih Image height (px)
IES Institute of Earth Science
IMO Icelandic meterological Office
xviii
IV Image vesicularity (%)
Iw Image width (px)
m Mass (g)
mA Milliampere
mbar Millibar
mm2 Squared millimetres
NA Number density of vesicles (mm-2)
NAb Bulk number density of vesicles (mm-2)
NAbin Number density for each bin (mm-2)
NAc Number density of vesicles adjusted for the crystals (mm-2)
NAtot Total number density of vesicles (mm-2)
NCIP-DCPEM The Department of Civil protection and Emergency Management of the
National Commissioner of the Icelandic Police
NIH National Institution of Health
NS Number of sections per unit area
NV Number of vesicles per volume unit (mm-3)
NVZ North Volcanic Zone
ρDRE Density of DRE (g cm-3)
ρclast Density of the clast (g cm-3)
px Pixels
RVZ Reykjanes Volcanic Zone
SEM Scanning Electronic Microscope
SF Scale factor (px/mm)
SFs Scale factor for scan (px/mm)
SIFZ South Iceland Flank Zone
SISZ South Iceland Seismic zone
tclast number of clasts
xix
UTC Universal Coordinated Time
v Volume (ml)
V Vesicularity (%)
VAAC Volcanic Ash Advisory Centre
VEI Volcanic explosive intex
Vf Vesicle fraction (%)
Vftot Total vesicle fraction
VI Vesicles included
Vs Spherical volume (mm3)
VSD Vesicle size distribution
Wc Weight of clast (g)
Ws Weight of wax sheet (g)
WVZ West Volcanic Zone
ÖBV Öræfajökull Volcano Belt

xx
Acknowledgements
To my colleagues in the Geology Department of Iceland I thank Tobias Dürig with his
guidance and expertise on plume observations, Jónas Guðnasson for collecting the samples
and helping out with numerous tasks and William Moreland for his guidance in the SEM
imaging techniques and data organization. To the many good friends I´ve gained throughout
the 6 years of studying earth sciences in the University of Iceland I have tremendous
gratitude as they have made this journey a beautiful one, geology rocks!.
For their superb guidance and supervision, I thank Professor Þorvaldur Þórðarsson and
Bruce Houghton, who though out and guided me throughout the process.
To Ingunn Agnes Kro and Páll Grétarsson, I give special thanks for the proof reading and
to my love, Grétar Már Pálsson, I thank for the countless times he gave me that extra support
I needed to continue on and his complete faith in me, not to mention the many hours of
reading the theses over.

1
1. Introduction
Iceland is one of the most active volcanic regions on Earth with an average of one eruption
every 4-5 years (Thordarson and Höskuldsson, 2008). It has also featured some of the largest
explosive eruptions in Europe that have left their mark in various Holocene archives (i.e.
lacustrine and marine sediments, peat bogs and glacier ice in and on both sides of the North
Atlantic Ocean). The latest eruption to impact Europe directly is the April-May 2010 summit
eruption at the Eyjafjallajökull volcano in south Iceland.
This event began with a 4-day long explosive episode (14-18 April 2010) that maintained a
6-10 km high plume (Guðmundsson et al., 2012) that spread across Europe and caused a
major disruption to air traffic for 5 days (Davies, et al., 2010). The plumes of the initial phase
were ash-rich, transporting significant amounts of ash (94% of tephra finer than 1mm and
50% less than 0.063 mm; Guðmundsson et al., 2012) towards Europe via strong north-
westerly winds. April 17 was a day with excellent visibility of the summit eruption and the
MÍLA surveillance cameras captured the eruption plume every 5 seconds during daylight
hours (from14:37 to 21:37). Furthermore, the tephra produced by the activity on the 17th was
sampled by the eruption team of geologists working with the University of Iceland on
centimetre to decimetre scale from a 5 m thick sequence at a near vent site located about 725
m from the main vent. These data and samples are the focus of this study, which has the aim
to analyse and link the explosive eruption behaviour and the tephra it produced.
The objective is to address the following research questions:
Can the pulsating behaviour observed in the eruption column be witnessed within the
stratigraphic column?
What is the density and vesiclarity of these pumice clasts and what is the vesicle size
distribution?
What mechanism and/or conditions inside the conduit contributed to these explosive
pulses?
Chapter 2 begins with a summary of the versatile volcanism of Iceland and general
volcanology with emphasis on explosive eruptions and fragmentation processes. Chapter 3
covers the geology of the research area along with a summary of the 2010 summit eruption
dynamics. In chapter 4 the various methods are explained and criticised. Chapter 5 gives the
result from all the data and chapter 6 provides a discussion of the methods and results.
Chapter 7 summarizes the concluding remarks.

2
3
2. Volcanism in Iceland
2.1 Iceland geology
Iceland is a 103,000 km2 island in the North Atlantic Ocean, a part of the twice larger Iceland
Plateau (Figure 2-1). It is the only segment of the mid-Atlantic ridge system that rises above
sea level, and more than 3 kilometres above the surrounding sea floor, because it is
juxtaposed onto the Icelandic mantle plume. The construction of the Iceland plateau is
thought to have started around 24 Ma (Sæmundsson, 1979) and it is the only still volcanically
active part of the North Atlantic Igneous Province (Saunders et al., 1997; Martin and
Sigmarsson, 2011)
Figure 2-1. Iceland and the North Atlantic. Iceland lies at the junction between the
Reykjanes and Kolbeinsey Ridge segments which is a part of the mid-Atlantic ridge
system. The solid line shows the mid-Atlantic ridge. Black shows the North Atlantic
basalt plateau and the dark grey their submarine equivalents. The light grey areas
represent continental land masses. Numbered dotted line represents the position of
the Iceland mantle plume from 65 million years to the present day. From Thordarson
and Larsen (2007), modified after Saunders et al.(1997).
4
Volcanoes, geothermal areas and glaciers are dominant geological features in Iceland and
often interact with each other, resulting in explosive eruptions (Thordarson and
Höskuldsson, 2008). About 11% of the country is covered by glaciers and around 60% of
the glacier covered area in Iceland is underlain by active volcanoes. The Eyjafjallajökull
central volcano is capped by Iceland´s 6th largest glacier, covering an area of 80 km2
(Björnsson and Pálsson, 2008) and is currently one of 10 most active volcanoes in Iceland
(Thordarson and Larsen, 2007).
2.2 Volcanism in Iceland
The neovolcanic zones in Iceland cover ~30,000 km. They are comprised of an echelon
arranged volcanic systems featuring a fissure swarm, a central volcano, or both (Figure 2-2).
Figure 2-2. A geological map of Iceland The mail faults, volcanic zones and belts. RR,
Reykjanes ridge; RVB Reykjanes Volcanic Belt; SISZ, South Iceland Seismic Zone; WVZ,
West Volcanic Zone; MIB, Mid-Iceland Belt; EVZ, East Volcanic Zone; NVZ, North
Volcanic Zone; TFZ, Tjornes Fracture Zone; KR, Kolbeinsey Ridge; ÖVB, Öræfi Volcanic
Belt; SVB, Snæfellsnes Volcanic Belt. Modified from Thordarsson and Hoskuldsson
(2008).

5
In total 30 active volcanic systems are identified within the neovolcanic zones and 16 of
those have produced eruptions in historical times. The magma production by volcanoes in
Iceland over the last 1100 years equals to ~87 km3 (dense rock equivalent). Basaltic magma
dominates the output in historic times, equal to 79% against 16% for intermediate and 5%
for silicic magmas (Thordarson and Larsen, 2007). The size of individual volcanic systems
ranges from 25 - 2500 km2 in terms of area and 7 – 200 km in terms of length (Table 2-1).
The large-scale volcanic lineaments are an axial zone, which is delineated by the Reykjanes,
West and North Volcanic zones (RVZ, WVZ, NVZ). These volcanic zones are connected by
the Mid-Iceland Belt (MIB) (Figure 2-2). The Eastern Volcanic Zone (EVZ) is a rift in the
making, propagating to the southwest through older crust (Sæmundsson, 1979). It reaches
from the centre of Iceland to the Vestmannaeyjar system of the south coast (Figure 2-2). The
EVZ hosts nine volcanic systems, eight with fully developed central volcanoes and has
featured more than 80% of eruptions and produced ~60% of the erupted magma since
settlement (i.e. the last 1140 years; e.g. Thordarson and Höskuldsson, 2008). It also features
the four most active systems in Iceland, namely Hekla, Katla, Grímsvötn and Bárðabunga-
Veiðivötn systems. The systems at the north end of EVZ, are tholeiitic, while the ones further
south are either transitional (mildly alkali) or alkalic (Mattsson and Höskuldsson, 2007)
Iceland contains most types of volcanoes and eruption styles experienced on Earth (e.g.
Thordarson and Larsen, 2007). The first order can be grouped into lava producing eruptions
(effusive) and tephra producing eruptions (explosive). For those eruptions including both
lava and tephra, the percentage of erupted material rules whether they are determined
explosive or effusive (Table 2-1). Hybrid eruptions, featuring both explosive and effusive
activity, have most commonly been produced by intermediate eruptions and are largely
confined to the Hekla volcano (Thordarson and Höskuldsson, 2008). The diversity in
Icelandic volcanism is well demonstrated by the activity during historical times (last 1140
years), where basaltic, andesitic, dacitic or rhyolitic nature magmatism has produced
effusive eruptions of Hawaiian to flood lava magnitudes, hybrid eruptions with Strombolian
to Plinian eruptive styles as well as phreatomagmatic eruptions of Surtseyjan to
Phreatoplinianintensities and dry (magmatic) Strombolian and Plinian eruptions
(Thordarson and Larsen, 2007).
Eruptions are frequent with one event every 3-4 years on average. Explosive eruptions are
more common than effusive, normally attributed to frequent eruption-glacier interaction.
However, the largest eruptions are effusive basaltic eruptions which are also the main
building blocks of Iceland (Thordarson and Höskuldsson, 2008).
Table 2-1 Definitions effusive, hybrid and explosive eruptions in Iceland From Thordarson
and Hoskuldsson (2008)
Major erupted material Eruption type
Lava Effusive
Tephra Explosive
Lava + tephra, tephra > 50% of total DRE product volume Hybrid Explosive
Lava + tephra, lava > 50% of total DRE product volume Hybrid Effusive
6
Table 2-2 Volcanic systems active in historical times in Iceland. Location of volcanic zones can be seen on
Figure 2.2. a*Maximum elevation above sea level. From (Thordarson and Larsen, 2007; Johannesson and
Saemundsson, 1998).
Name Central
volcano
Volcanic
zone
Max. elev.
(m.a.s.l.)*
Area
(km2)
Last known
eruption
Askja Askja NVZ 1510 2300 1961
Bárðarbunga Bárðarbunga EVZ 2009 2500 2014-15
Brennisteinsfjöll RVZ 621 280 1341
Esjufjöll Snæhetta ÖVB 1760 400 1927
Eyjafjallajökull Eyjafjallajökull EVZ 1666 300 2010
Grímsvötn Þórðarhyrna EVZ 1722 1350 2011
Hekla Hekla EVZ 1491 720 2000
Katla Mýrdalsjökull EVZ 1480 1300 1918
Krafla Krafla NVZ 818 900 1984
Krýsuvík RVZ 393 300 1340
Ljósufjöll SVB 1063 720
Reykjanes RVZ 163 350 1879
Torfajökull EVZ 1278 900 1477
Vestmannaeyjar Heimaey EVZ 283 >480 1973
Þeystareykir NVZ 600 650
Öræfajökull ÓVB 2110 250 1727
2.3 Explosive volcanism
Like other natural hazards, volcanic eruptions can vary greatly in their intensity. Some are
effusive, and have even been referred to “tourist friendly” because small events are
susceptible for up close viewing, while others are explosive and support tephra and gas-rich
plumes that keeps viewers at bay and can often be associated with widespread effects
(Gonnermann and Manga, 2012). Explosive eruptions are generally categorized into
magmatic or “dry” and phreatomagmatic or “wet” eruptions (Wilson, 1991). Dry events are
driven by exolving and expanding magmatic gas phase and can range in style from
Strombolian to ultra-Plinian. Wet eruptions involve interaction of magma and external water
7
and range from Surtseyan to Phreatoplinian in terms of styles (Walker, 1973; Cashman et
al., 2000; Morrissey et al., 2000). The products of explosive volcanism contribute to the
global geochemical cycles, affecting the geosphere, hydrosphere and atmosphere
(Crosweller et al., 2012). Explosive eruptions can produce large amounts of pyroclastic
material, including fine ash and aerosols that subsequently can be emplaced into the
stratosphere and dispersed into the farfield (e.g. Cashman et al., 2000).
The intensity of explosive eruptions depends on the composition and pressure rates of the
magma, original volatile gas content, magma rise velocity, degassing rates as well as the
bubbles mobility (Gonnermann and Manga, 2012). As such, explosive eruptions span a wide
range in terms of intensity or from very weakly explosive events like such as the 2004
Grímsvötn (Jude-Eton et al., 2012) and 2010 Eyjafjallajökull summit eruption
(Guðmundsson et al., 2012), through moderate subPlinian eruptions like the 1991 Hekla
event (Guðmundsson et al., 1992) and the moderate Plinian eruptions such as Hekla 1947
and Grímsvötn 2011 (Þórarinsson, 1970; Hreinsdóttir, et al., 2014) to high intensity Plinian
events, like the 1991 Pinatubo and 1912 Katmai eruptions (e.g. Hildreth and Fierstein, 2012;
Sobradelo, 2015). Events of extreme intensity, i.e. ultraPlinian or super-eruptions, are known
from the geological record, for example the 186 AD Taupo (Houghton et al., 2014) and the
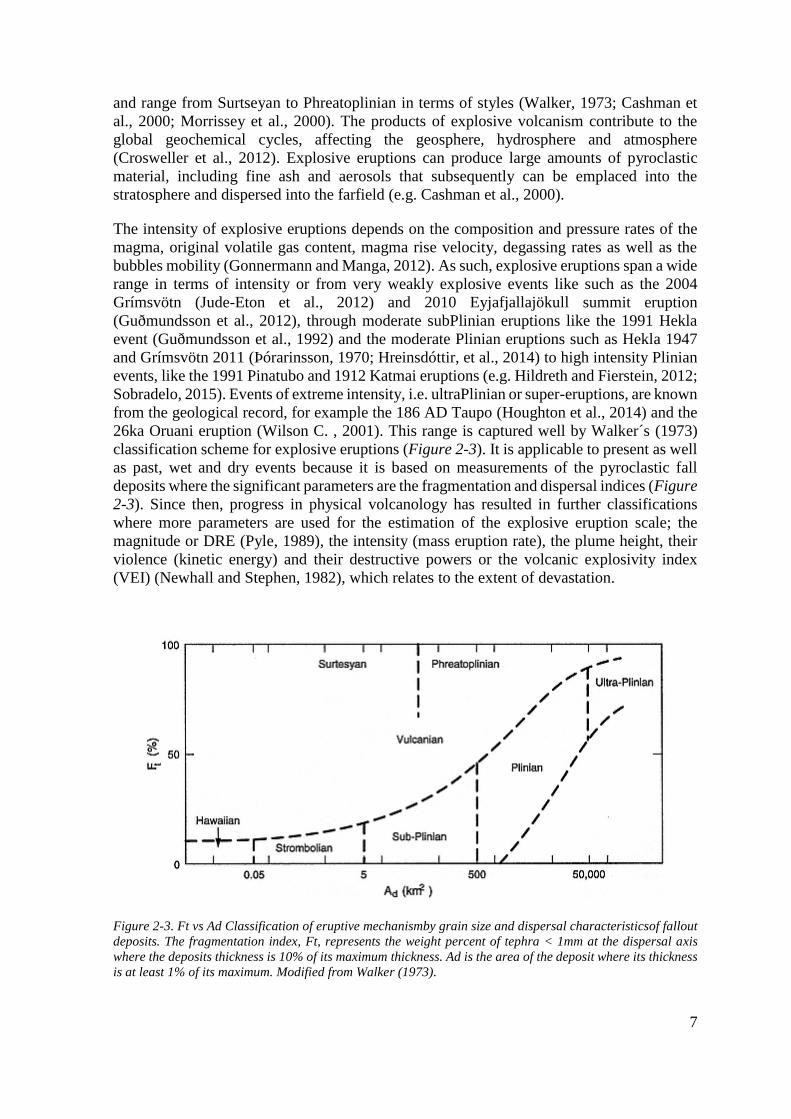
26ka Oruani eruption (Wilson C. , 2001). This range is captured well by Walker´s (1973)
classification scheme for explosive eruptions (Figure 2-3). It is applicable to present as well
as past, wet and dry events because it is based on measurements of the pyroclastic fall
deposits where the significant parameters are the fragmentation and dispersal indices (Figure
2-3). Since then, progress in physical volcanology has resulted in further classifications
where more parameters are used for the estimation of the explosive eruption scale; the
magnitude or DRE (Pyle, 1989), the intensity (mass eruption rate), the plume height, their
violence (kinetic energy) and their destructive powers or the volcanic explosivity index
(VEI) (Newhall and Stephen, 1982), which relates to the extent of devastation.
Figure 2-3. Ft vs Ad Classification of eruptive mechanismby grain size and dispersal characteristicsof fallout
deposits. The fragmentation index, Ft, represents the weight percent of tephra < 1mm at the dispersal axis
where the deposits thickness is 10% of its maximum thickness. Ad is the area of the deposit where its thickness
is at least 1% of its maximum. Modified from Walker (1973).

8
2.3.1 Dry explosive eruptions
The driving force of dry explosive eruptions is exsolution of volatiles due to decompression
up on ascent, forming a two phase mixture of melt and gas bearing bubbles. Bubble growth
and vesiculation are the driving force of the expansion itself with fragmentation taking place
by the separation of the foam (Figure 2-4). The rate of expansion, or bubble growth, is a
function of the rate of decompression, or the ascent rate (Proussevitch and Sahagian, 1998)
and fragmentation may then result from an unstable melt or brittle fracture (Morrissey et al.,
2000).
Figure 2-4. Conduit flow : Schematic view of the flow
in the conduit of the volcano, corresponding to
sustained explosive eruptions (Melnik, 2000).
Volatiles, magma degassing and bubbles
At depth the magma mostly consists of bubble-free liquid where the gases are dissolved in
the magma. As the magma rises towards surface and pressure inside the conduit decreases,
the volatiles escape the melt into bubbles (Gaonac'h et al., 2004). If the amount of dissolved
volatiles exceeds the equilibrium solubility at a certain pressure, the melt will be
supersaturated and bubble nucleation can take place (Sparks, 2003). Basaltic magmas
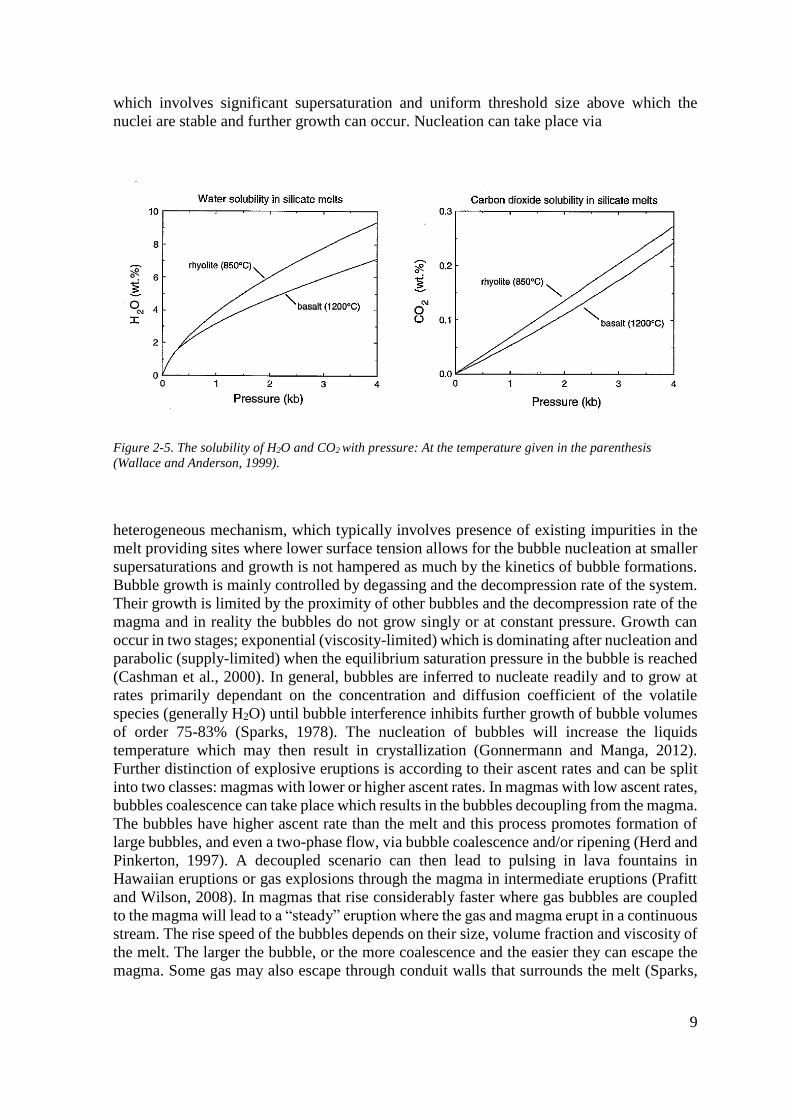
contain volatiles including H2O, CO2, sulphur, chlorine and fluorine species. The solubility
of the volatiles is partially dependent on pressure, where the first formed bubbles at depth
are in a supercritical state, however, temperature and chemical composition also factor in the
solubility (Wallace and Anderson, 1999). The pre-eruptive volatile content shows a wide
range of water content in both basaltic and silicic magmas (Figure 2-5), however, the CO2
content is more difficult to constrain because of its low solubility at shallow depths
(Anderson Jr. and Brown, 1993). The higher the original volatile content, the more likelihood
there is of explosive eruption.
The key to understanding the dynamics of volcanic eruptions is the “birth”, “life” and
“death” of bubbles (Gonnermann and Manga, 2012). Vesiculation starts with bubble
nucleation and it can take place by mechanism referred to as “homogenous nucleation”
9
which involves significant supersaturation and uniform threshold size above which the
nuclei are stable and further growth can occur. Nucleation can take place via
Figure 2-5. The solubility of H2O and CO2 with pressure: At the temperature given in the parenthesis
(Wallace and Anderson, 1999).
heterogeneous mechanism, which typically involves presence of existing impurities in the
melt providing sites where lower surface tension allows for the bubble nucleation at smaller
supersaturations and growth is not hampered as much by the kinetics of bubble formations.
Bubble growth is mainly controlled by degassing and the decompression rate of the system.
Their growth is limited by the proximity of other bubbles and the decompression rate of the
magma and in reality the bubbles do not grow singly or at constant pressure. Growth can
occur in two stages; exponential (viscosity-limited) which is dominating after nucleation and
parabolic (supply-limited) when the equilibrium saturation pressure in the bubble is reached
(Cashman et al., 2000). In general, bubbles are inferred to nucleate readily and to grow at
rates primarily dependant on the concentration and diffusion coefficient of the volatile
species (generally H2O) until bubble interference inhibits further growth of bubble volumes
of order 75-83% (Sparks, 1978). The nucleation of bubbles will increase the liquids
temperature which may then result in crystallization (Gonnermann and Manga, 2012).
Further distinction of explosive eruptions is according to their ascent rates and can be split
into two classes: magmas with lower or higher ascent rates. In magmas with low ascent rates,
bubbles coalescence can take place which results in the bubbles decoupling from the magma.
The bubbles have higher ascent rate than the melt and this process promotes formation of
large bubbles, and even a two-phase flow, via bubble coalescence and/or ripening (Herd and
Pinkerton, 1997). A decoupled scenario can then lead to pulsing in lava fountains in
Hawaiian eruptions or gas explosions through the magma in intermediate eruptions (Prafitt
and Wilson, 2008). In magmas that rise considerably faster where gas bubbles are coupled
to the magma will lead to a “steady” eruption where the gas and magma erupt in a continuous
stream. The rise speed of the bubbles depends on their size, volume fraction and viscosity of
the melt. The larger the bubble, or the more coalescence and the easier they can escape the
magma. Some gas may also escape through conduit walls that surrounds the melt (Sparks,

10
2003). Eventually the bubble walls get so thin that the foam becomes unstable and breaks up
into vesicular clots (Cashman et al., 2000).
Microlite crystallization and magma rheology
The magma liquidus temperature is raised when volatiles escapes from the melt in significant
amounts (Lin et al., 2005). This degassing-induced change in liquidus temperature can result
in substantial microlite crystallization and hence stiffening of the magma (Applegarth et al.,
2013). If vesiculation reaches its greatest maturity in the top or upper part of the conduit and
the ascent rate is relatively low, the system may experience outgassing which can result in
partial to near complete collapse of the bubbles (i.e. the foam) (Gonnermann and Manga,
2012). This, coupled with degassing-induced crystallization, can lead to a horizon at the top
of the magma column that is stiffer and moving slower than the fresh magma that is rising
through the column below (Cashman et al., 2000). Hence the stiffer top can act as a plug,
promoting pressurization of the system at the very top of the conduit. This could eventually
cause destruction of the plug via violent outburst, and when repeated at regular intervals, a
pulsating eruption (Hammer et al., 1999).
2.3.2 Fragmentation processes
The process of fragmentation itself is the explosive process of a volcanic eruption. Simply
put, the fragmentation changes the magma from a melt with gas bubbles into gas carrying
liquid melt fragments that contain bubbles (Cashman et al., 2000). Pressure acting on the
magma stored deep within the magma chamber is relatively high because of the strength
from surrounding rock (Figure 2-4). When the pressure at the surface of the magma drops,
a release wave dives down the vesicular column, producing dynamic tensile stress within the
magma. Fragmentation and fracturing may occur if that pressure overrides the dynamic
tensile stress of the magma (Alidibirov and Dingwell, 1996). Degassing can also increase
the yield strength and viscosity of the melt with microlite crystallization which makes it
more difficult for the bubbles to expand. This can build up added pressure in the bubbles and
the system in general. This does lead to fragmentation, sometimes in part due to formation
of instabilities in the bubbly melt, with spacing´s of the same dimensions as lapilli.
Fragmentation can also take place when the pressure inside the bubble overcomes the
strength of the melt surrounding it. If this happens rapidly, the fragmentation will be
explosive (Gonnermann and Manga, 2012). On the other hand, lower part of a rising magma
batch may outgas without disintegrating and form a stiffer and poorly-vesicular horizon that
forms a plug that can hamper the rise and pressurize the next fresh batch of magma. The
pressure acting on the trapped magma will eventually find a release outcome to override the
plug, possibly resulting in breakage of the plug or, as Gonnerman and Manga (2003) suggest,
that non-explosive fragmentation near the conduit walls can generate intermittent permeable
fracture network resulting in degassing of the trapped magma. Such fragmentation, contrary
to conventional views where fragmentation contributes to explosive volcanism, may actually
reduce the likelihood of explosive behaviour by reducing the dynamic pressure and degas
the melt (Gonnermann and Manga, 2003).

11
2.3.3 Phreatomagmatic eruptions
An eruption event, where external water interacts with the magma at some point, is referred
to as a phreatomagmatic eruption and are categorized as Surtseyjan, Vulcanian and
phreatoplinian (Figure 2-3). Contact of external water with magma can result in
instantaneous flashing of water into steam and the formation of oscillating steam film. This
can develop wave-like instabilities that promote fragmentation of the magma at the interface
(Kokelaar, 1986). The intensity of phreatomagmatic eruptions can differ from mild
interactions, such as when low viscosity lava flows into a lake, or high energetic interactions
with pyroclastic deposits dominating the fragmented country rock (Zimanowski and
Wohletz, 2000). Theoretically, magma-water interaction can take place at any stage in the
vesiculation history of the magma. The tephra deposits can provide valuable data to interpret
the depth of intersection of the water and magma and the geometry of the vent. The
mechanism of contact between the magma and the water results in high pressure steam that
may compress and cause explosivity, this implies that most of the energy is transferred from
the magma to the water to produce the steam (Zimanowski and Wohletz, 2000). The main
physical mechanism that causes the expansion of steam in phreatomagmatic eruptions is the
major difference in the volumetric thermal expansions between the water and magma. When
the water cools the melt, it creates less space than is needed for an isobaric expansion of
heated water and therefore this mechanism can occur even at high ambient pressures
(Zimanowski and Wohletz, 2000).
Figure 2-6 Clast forming processes and possible enhancement interactions in
basaltic eruptions from (Kokelaar, 1986).
Kokelaar (1986) lists four primary processes in basaltic eruptions that form volcanoclastic
materials of which three are the result of phreatomagmatic interactions: 1) contact-surface
steam explosivity, 2) bulk interaction steam explosivity and 3) cooling-contraction
granulation. Both the contact-surface steam explosivity and/or cooling-contraction
granulation can be promoted when the magma comes in direct contact with water. The

12
contact-surface steam explosivity occurs at near surface depths where magma comes in
contact with water and forms a vapour film which is unstable. The heat is transferred from
the magma to water and can enhance itself directly with further heating and decompression.
There is no certain depth limit for the contact-surface steam explosivity, however the
likelihood decreases rapidly with depth. The bulk interaction steam explosivity can occur of
depths down to 3 km, even deeper when the salinity is passing 3.45%. The water is enclosed
in the magma along with clastic materials or can be trapped close to the magma. The cooling-
contraction granulation occurs when a layer of steam surrounds magma droplets and causes
it to shrink and fracture, producing granule-sized particles. It has no depth limit and is more
passive. It can occur in very deep waters where steam explosivity is impossible due to
pressure and can be replaced by contact-surface steam explosivity at shallow levels. The
resulting clastic deposits are highly angular glass grains of sand- and granule-size. All these
processes can occur together and may, in return, enhance one another (Kokelaar, 1986).
2.4 Volcanic plumes
A volcanic plume is a turbulent mix of volcanic ash and gases, water and air. It can be divided
into three different regions according to which phase and particles are dominant (Sparks et
al., 1997). This division mostly applies to Plinian eruptions (Björnsson, 2013). The first and
lowest phase is called the gas thrust phase, where the plume is densest and compact. Even
though the particle rich plume is denser then the surrounding air, the force from the pressure
in the volcanic vent below thrusts the mixture of gas and solids upwards, resulting in further
mixing with the ambient air. At the top of the gas thrust region, the plume becomes buoyant
if it manages to take in and heat up enough of the ambient atmosphere and rises in a turbulent
fashion (Figure 2-7). This is called the buoyant convective region and can form anywhere
from a hundred meters above the event to tens of kilometres, differencing with the eruption
strength and air condition (Sparks, 1986). The umbrella region is the third and highest phase,
where the plume reaches neutral buoyancy because the density of the plume equals to the
density of the ambient atmosphere and spreads out in the dominant wind direction where
particles can travel far from the volcano and even spread over the globe´s atmosphere in
large eruptions (Figure 2-7)

13
Figure 2-7. The different phases of a volcanic plume: A sketch showing the three
different phases of a volcanic plume; the umbrella region where level of neutral
buoyancy occurs, the convective region were the plume rises and the gas thrust
region were the plume enters the atmosphere (Sparks, 1986).
The plume associated with a phreatomagmatic eruption is often white in colour although
tephra can alter and darken the colour (see chapter 4). Generally, the grain size of ejected
materials are finer than those erupted in magmatic phases, especially if the water/magma
fragmentations ratios are high (Morrissey, 2000).
.

14

15
3. Geology of Eyjafjöll
3.1 Eyjafjallajökull volcanic system
The Eyjafjallajökull system is located right behind the propagating front of the EVZ (Figure
2-2) and rises 1650 m above its surrounding lowlands, covering an area of around 400 km2
(Loughlin, 2002) with the glacier covering an area of 80 km2 (Björnsson and Pálsson, 2008).
The dominant volcanic products of Eyjafjallajökull is a part of the transitional alkali series
and the succession that makes up the volcano was formed during both glacial and interglacial
periods in the last 800,000 years (Loughlin, 2002). Although quite thin, with in average
thickness of 100 meters, the Eyjafjallajökull glacier covers most of the volcano above 1000
meters with the thickness reaching 250 meters in the summit crater (Guðmundsson, et al.,
2005). Prior to the 2010 eruption the total volume of ice within the summit crater was ~0.8
km3 (Magnússon et al., 2012). Valley glaciers extend to lower regions on both the north and
the south side of the crater (Figure 3-1).
Figure 3-1.Eyjafjallajökull area : The study area and its surroundings. Lava and tephra cones
formed during the 2010 eruption are marked in red and the summit crater is marked with a
dotted red line. Vents and fissures and vents are marked in yellow. The corner inlet shows the
geographical location of the area in Iceland. From Magnússon et al., (2012).
16
Fimmvörðuháls, an E-W orientated ridge sits to the east, joining Eyjafjallajökull to its
neighbour volcano Katla (Larsen, 1999). A large part of the edifice is built from up of lava,
volcanoclastic deposits and hyaloclastite formed by subaqueous volcanic activity (Loughlin,
2002).
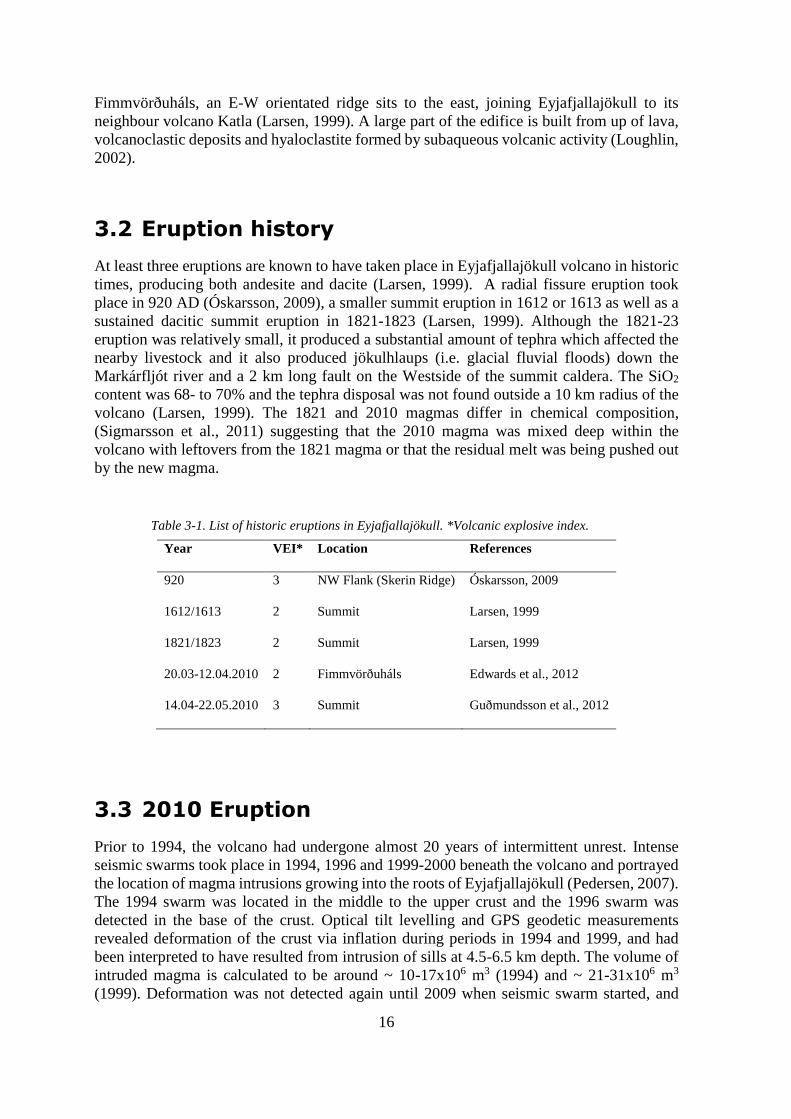
3.2 Eruption history
At least three eruptions are known to have taken place in Eyjafjallajökull volcano in historic
times, producing both andesite and dacite (Larsen, 1999). A radial fissure eruption took
place in 920 AD (Óskarsson, 2009), a smaller summit eruption in 1612 or 1613 as well as a
sustained dacitic summit eruption in 1821-1823 (Larsen, 1999). Although the 1821-23
eruption was relatively small, it produced a substantial amount of tephra which affected the
nearby livestock and it also produced jökulhlaups (i.e. glacial fluvial floods) down the
Markárfljót river and a 2 km long fault on the Westside of the summit caldera. The SiO2
content was 68- to 70% and the tephra disposal was not found outside a 10 km radius of the
volcano (Larsen, 1999). The 1821 and 2010 magmas differ in chemical composition,
(Sigmarsson et al., 2011) suggesting that the 2010 magma was mixed deep within the
volcano with leftovers from the 1821 magma or that the residual melt was being pushed out
by the new magma.
Table 3-1. List of historic eruptions in Eyjafjallajökull. *Volcanic explosive index.
Year VEI* Location References
920 3 NW Flank (Skerin Ridge) Óskarsson, 2009
1612/1613 2 Summit Larsen, 1999
1821/1823 2 Summit Larsen, 1999
20.03-12.04.2010 2 Fimmvörðuháls Edwards et al., 2012
14.04-22.05.2010 3 Summit Guðmundsson et al., 2012
3.3 2010 Eruption
Prior to 1994, the volcano had undergone almost 20 years of intermittent unrest. Intense
seismic swarms took place in 1994, 1996 and 1999-2000 beneath the volcano and portrayed
the location of magma intrusions growing into the roots of Eyjafjallajökull (Pedersen, 2007).
The 1994 swarm was located in the middle to the upper crust and the 1996 swarm was
detected in the base of the crust. Optical tilt levelling and GPS geodetic measurements
revealed deformation of the crust via inflation during periods in 1994 and 1999, and had
been interpreted to have resulted from intrusion of sills at 4.5-6.5 km depth. The volume of
intruded magma is calculated to be around ~ 10-17x106 m3 (1994) and ~ 21-31x106 m3
(1999). Deformation was not detected again until 2009 when seismic swarm started, and
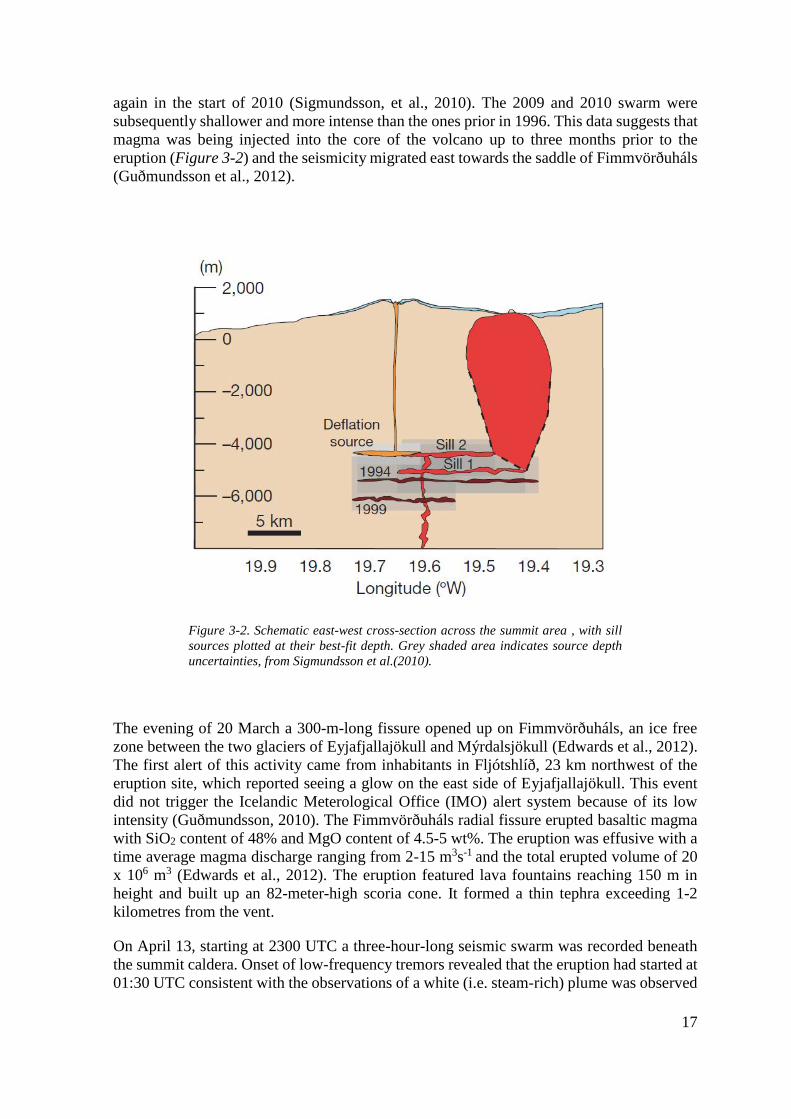
17
again in the start of 2010 (Sigmundsson, et al., 2010). The 2009 and 2010 swarm were
subsequently shallower and more intense than the ones prior in 1996. This data suggests that
magma was being injected into the core of the volcano up to three months prior to the
eruption (Figure 3-2) and the seismicity migrated east towards the saddle of Fimmvörðuháls
(Guðmundsson et al., 2012).
Figure 3-2. Schematic east-west cross-section across the summit area , with sill
sources plotted at their best-fit depth. Grey shaded area indicates source depth
uncertainties, from Sigmundsson et al.(2010).
The evening of 20 March a 300-m-long fissure opened up on Fimmvörðuháls, an ice free
zone between the two glaciers of Eyjafjallajökull and Mýrdalsjökull (Edwards et al., 2012).
The first alert of this activity came from inhabitants in Fljótshlíð, 23 km northwest of the
eruption site, which reported seeing a glow on the east side of Eyjafjallajökull. This event
did not trigger the Icelandic Meterological Office (IMO) alert system because of its low
intensity (Guðmundsson, 2010). The Fimmvörðuháls radial fissure erupted basaltic magma
with SiO2 content of 48% and MgO content of 4.5-5 wt%. The eruption was effusive with a
time average magma discharge ranging from 2-15 m3s-1 and the total erupted volume of 20
x 106 m3 (Edwards et al., 2012). The eruption featured lava fountains reaching 150 m in
height and built up an 82-meter-high scoria cone. It formed a thin tephra exceeding 1-2
kilometres from the vent.
On April 13, starting at 2300 UTC a three-hour-long seismic swarm was recorded beneath
the summit caldera. Onset of low-frequency tremors revealed that the eruption had started at
01:30 UTC consistent with the observations of a white (i.e. steam-rich) plume was observed
18
rising from the summit caldera of Eyjafjallajökull in the early hours of 14 April
(Guðmundsson, 2010).
3.3.1 Initial explosive phase
The summit eruption of Eyjafjallajökull volcano in 2010 began with a 4-day long explosive
episode (14-18 April 2010) that maintained a 6-10 km high plume (Guðmundsson et al.,
2012) which spread across Europe and caused a major disruption to air traffic for 5 days
(Davies et al., 2010). Initially the eruption was thought to have been particularly ash-rich,
but as demonstrated by Guðmundsson et al. (2012), the eruption had a significantly high
amount of fine ash (95% of tephra finer than 1000µm) during the first few days where most
of the tephra was transported, which was of major importance since it was easily transported
during strong winds in the upper troposphere.
This first and shortest eruption phase of the summit eruption was more energetic than the
previous flank eruption in terms of discharge rate and plume height (Figure 3-3). The plume
consisted of either of white, water rich mixture or dark, ash rich mixture exchanging in a
pulse like behaviour (Dellino et al., 2012) and plume rise velocities above the vent reached
above 30 ms-1 (Björnsson, 2013). The composition of the erupted material was dominantly
evolved benmoreite and the magma discharge rate reached 5 – 10 x 105 kg s-1 (≈ 200 - 400
m3 s-1) (Figure 3-3).
Figure 3-3. Magma discharge rate and chemical composition of 2010 summit eruption of
Eyjafjallajökull from (Guðmundsson et al., 2012).
19
On April 14-16 the glacial ice melted rapidly and 2 cauldrons formed at the summit,
suggesting that most of the activity was over at these locations after the first 2 days (Figure
3-4). Sediment outburst floods rushed down the Gígjökull outlet glacier, located on the
volcanoes northern side, but no significant flooding occurred in the Markarfljót River. On
15 April the activity moved to a new cauldron west of the initial fissure where the activity
continued until the eruption stopped (Guðmundsson et al., 2012). This initial phase can be
further categorized into two separate phases, phase 1 –east (14-16 April) where tephra
formed a well-defined sector towards the east and phase 1 –south (17-18 April) when
northerly winds carried the tephra southwards (Figure 3-5). The latter, the focus of this
paper, had an estimated magma discharge 6.0 x 10⁵ kg s-1 and plume heights up to 9 km
(Guðmundsson et al., 2012). It was typified by pulsating explosive activity, producing a dark
plume and white puffs between pauses in activity. The volume of tephra for the 17-18 April
phase is estimated to be 25 ±7 x 10⁶ m3 in total, with 7 ±1 x 10⁶ m3 falling in Iceland and 18
±6 x 10⁶ m3 falling outside Iceland and no lava was formed during this stage (Figure 3-3).
Figure 3-4. Settings of the Eyjafjallajökull eruption. A north to south cross-section through the
summit caldera showing the two main vents and associated ice cauldrons with the vents.
Modified from Guðmundsson et al., 2012
20
Figure 3-5. Tephra fallout during the initial phase . The first phase
is dived into 2 phases: a) phase 1-east from 14-16 April with
northerly winds and b) phase 1- south, where tephra was
transported towards Europe during 17-18 April. From
Guðmundsson et al. (2012).
3.3.2 Later phases
The second phase, lasting from April 18 to May 4, was less vigorous in terms of explosive
activity and white, water rich plumes were more common (Dellino, et al., 2012). The activity
was pulsating and the plume rise velocities was up to 20 m s-1 (Björnsson, 2013). The
erupting magma was slightly more mafic (SiO2 content dropped from 60-61 wt% to 58-59
wt%) and the magma discharge rate dropped considerably, or to a few tens of cubic meters
per second (Figure 3-3). Although this period was effusive, the explosive activity sustained
in a minor way, with the plume reaching heights of 2-4 km (Guðmundsson et al., 2012). The
lava oriented in a north direction away from the crater into the Gígjökull outlet glacier´s
pathway, melting considerable amount of ice on the way (Guðmundsson, 2010).
During the third phase, from May 5 to May 18, the activity and discharge rate increased
again. The colour plume was generally various shades of grey and white plumes were not
conspicuous, indicating that the glacier melt water was not present in significant amounts in
the vicinity of the active vent. Although it might still have access to the vent (Dellino et al.,
2012). The composition of the magma changed from benmoreite to trachyte with SiO2
content of 65 wt% (Guðmundsson et al., 2012) possibly related to the magma mixing deep
within the volcano (Sigmarsson et al., 2011). Earthquake activity picked up again and the
seismic tremors dropped. Shock waves due to gas explosion at the crater were reported to
have been heard tens of kilometres away from the volcano (Guðmundsson, 2010).
During the fourth and final phase, from the 19-22 May the explosive activity declined
steadily until the eruption was declared to have ended on 22 May (Stevenson, 2012).
21
Table 3-2. A timeline showing the different phases of the
summit eruption. *Maximum plume height is given in
kilometres above sea level. Data collected from
Guðmundsson et al. (2012).
Date Phase Activity Max. plume
height (km)
14 April Subglacial 0
14-16 April 1 –east Explosive 9,5
17-18 April 1 -south Explosive 9
18 April-4 May 2 Effusive 5,5
5-18 May 3 Explosive 10
19-22 May 4 Effusive 6
The eruption lasted a total of 39 days and erupted 0.27± 0.06 km2 of tephra throughout all
the four phases (Guðmundsson, 2010). With a mean magma discharge of 30 - 60 m3 s-1, the
plume height of 4 km and a maximum discharge of ~400 m3 s-1, plume heights of 10 km, the
Eyjafjallajökull 2010 event is categorized as a moderate sized eruption with a VEI 3
(Guðmundsson et al., 2012). The eruption plume produced by the event was dispersed over
Europe and caused a huge disruption to the air traffic across the region, closing down the
airspace for over 10 days, in a region which generally is thought to be free from volcanic
hazards (Davies et al., 2010). Weather conditions is a critical component when plume
behaviour is concerned, both precipitation and winds determine where, when and how far
the plume can reach and according to the European aviation, the weather conditions during
the eruption were a worst-case scenario when the tephra dispersal was concerned. The wind
had a northerly component for the majority of the eruption duration and precipitation was
limited so ash was not washed away (Stevenson, 2012). By definitions from Thordarson and
Höskuldsson (2008) this eruption was a type of hybrid event that featured a specific type
style of periodic and pulsating explosive activity along with lava effusion. Similar eruptions
of such hybrid nature and pulsating explosive activity have been observed at events at
volcanoes located at convergent margins, namely at the 1991 event of Unzen in Japan (e.g.
Fujii, 1999; Hoshizumi, 1999), 2000 event at Soufriere Hills on Montserrat (Carn, 2004),
the 2003 Anatan eruption on Mariana islands (Trusdell et al., 2005) and the 2001 event of
Merapi, Indonesia (Hort et al., 2006).

22
23
4. Methodology
4.1 Field observations and sampling
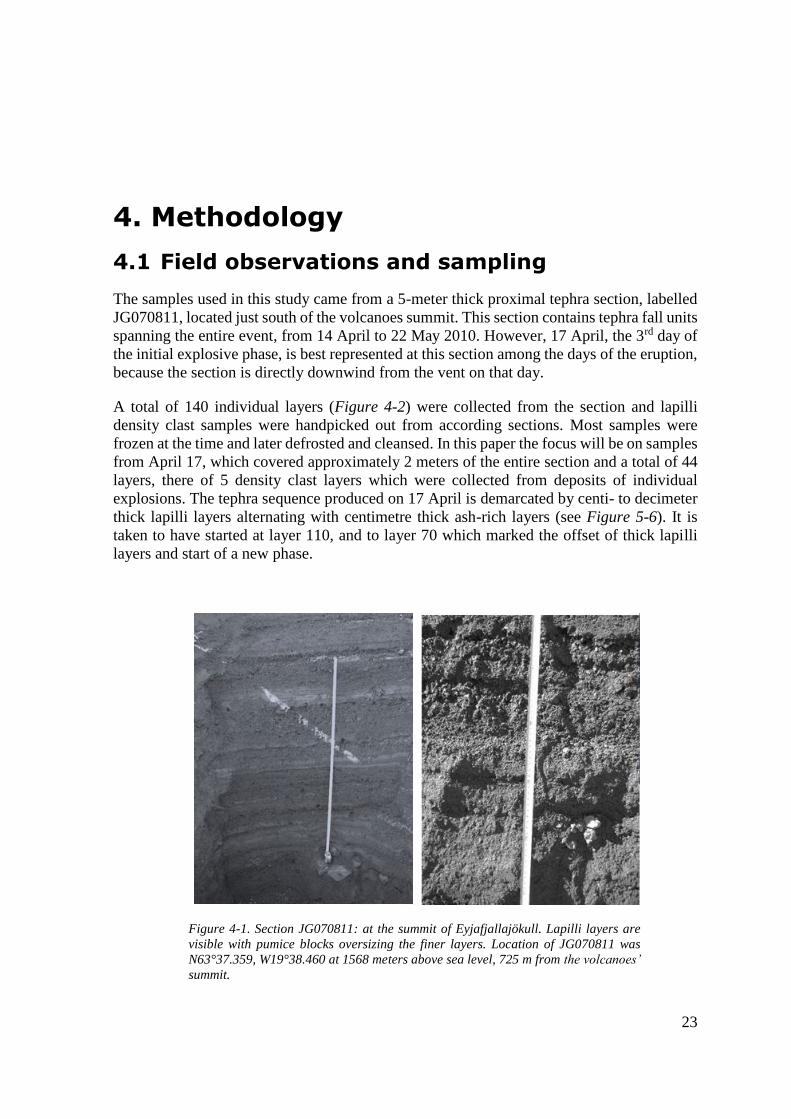
The samples used in this study came from a 5-meter thick proximal tephra section, labelled
JG070811, located just south of the volcanoes summit. This section contains tephra fall units
spanning the entire event, from 14 April to 22 May 2010. However, 17 April, the 3rd day of
the initial explosive phase, is best represented at this section among the days of the eruption,
because the section is directly downwind from the vent on that day.
A total of 140 individual layers (Figure 4-2) were collected from the section and lapilli
density clast samples were handpicked out from according sections. Most samples were
frozen at the time and later defrosted and cleansed. In this paper the focus will be on samples
from April 17, which covered approximately 2 meters of the entire section and a total of 44
layers, there of 5 density clast layers which were collected from deposits of individual
explosions. The tephra sequence produced on 17 April is demarcated by centi- to decimeter
thick lapilli layers alternating with centimetre thick ash-rich layers (see Figure 5-6). It is
taken to have started at layer 110, and to layer 70 which marked the offset of thick lapilli
layers and start of a new phase.
Figure 4-1. Section JG070811: at the summit of Eyjafjallajökull. Lapilli layers are
visible with pumice blocks oversizing the finer layers. Location of JG070811 was
N63°37.359, W19°38.460 at 1568 meters above sea level, 725 m from the volcanoes’
summit.
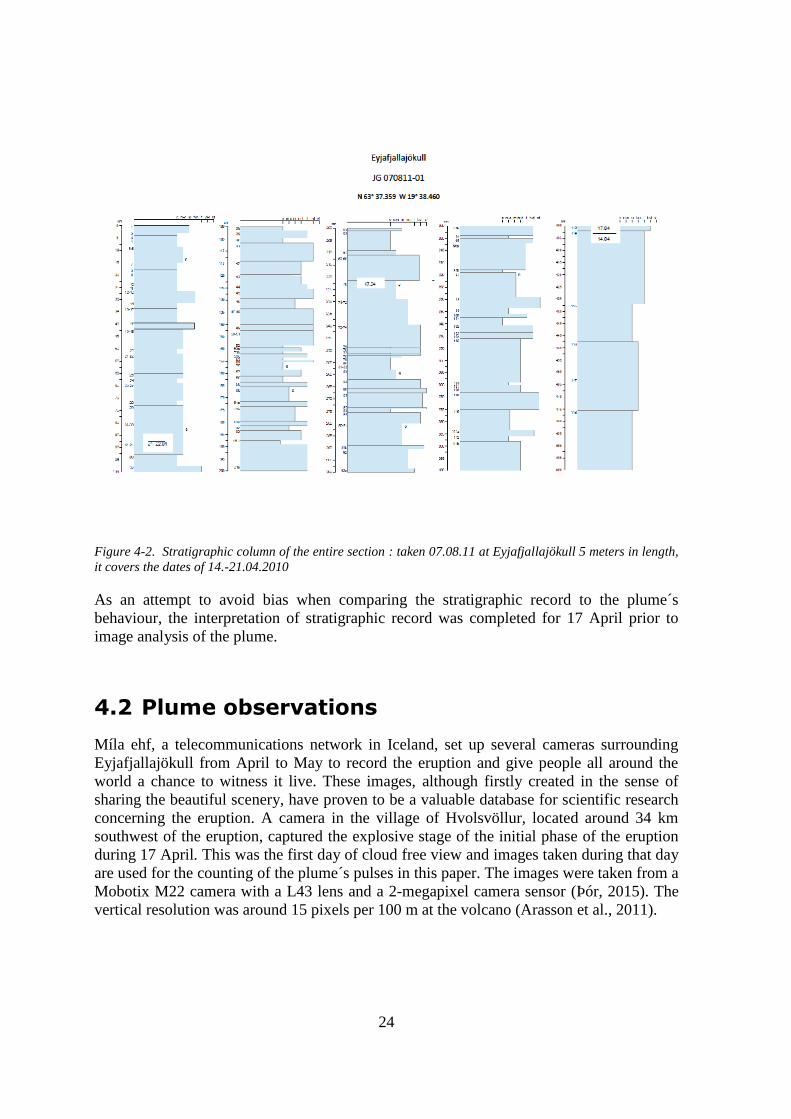
24
Figure 4-2. Stratigraphic column of the entire section : taken 07.08.11 at Eyjafjallajökull 5 meters in length,
it covers the dates of 14.-21.04.2010
As an attempt to avoid bias when comparing the stratigraphic record to the plume´s
behaviour, the interpretation of stratigraphic record was completed for 17 April prior to
image analysis of the plume.
4.2 Plume observations
Míla ehf, a telecommunications network in Iceland, set up several cameras surrounding
Eyjafjallajökull from April to May to record the eruption and give people all around the
world a chance to witness it live. These images, although firstly created in the sense of
sharing the beautiful scenery, have proven to be a valuable database for scientific research
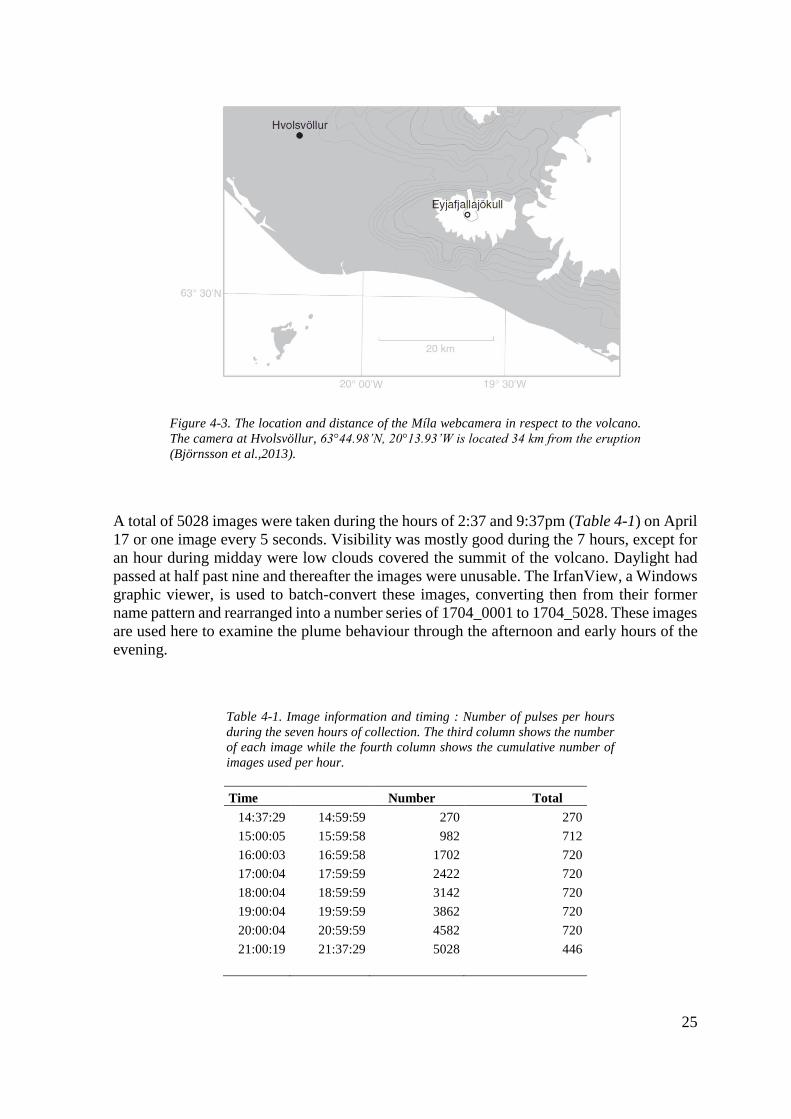
concerning the eruption. A camera in the village of Hvolsvöllur, located around 34 km
southwest of the eruption, captured the explosive stage of the initial phase of the eruption
during 17 April. This was the first day of cloud free view and images taken during that day
are used for the counting of the plume´s pulses in this paper. The images were taken from a
Mobotix M22 camera with a L43 lens and a 2-megapixel camera sensor (Þór, 2015). The
vertical resolution was around 15 pixels per 100 m at the volcano (Arasson et al., 2011).
25
Figure 4-3. The location and distance of the Míla webcamera in respect to the volcano.
The camera at Hvolsvöllur, 63°44.98’N, 20°13.93’W is located 34 km from the eruption
(Björnsson et al.,2013).
A total of 5028 images were taken during the hours of 2:37 and 9:37pm (Table 4-1) on April
17 or one image every 5 seconds. Visibility was mostly good during the 7 hours, except for
an hour during midday were low clouds covered the summit of the volcano. Daylight had
passed at half past nine and thereafter the images were unusable. The IrfanView, a Windows
graphic viewer, is used to batch-convert these images, converting then from their former
name pattern and rearranged into a number series of 1704_0001 to 1704_5028. These images
are used here to examine the plume behaviour through the afternoon and early hours of the
evening.
Table 4-1. Image information and timing : Number of pulses per hours
during the seven hours of collection. The third column shows the number
of each image while the fourth column shows the cumulative number of
images used per hour.
Time Number Total
14:37:29 14:59:59 270 270
15:00:05 15:59:58 982 712
16:00:03 16:59:58 1702 720
17:00:04 17:59:59 2422 720
18:00:04 18:59:59 3142 720
19:00:04 19:59:59 3862 720
20:00:04 20:59:59 4582 720
21:00:19 21:37:29 5028 446

26
Each pulse is documented with a number, ranging from 2-4, with 2 being a pulse typified by
white (i.e. steam-rich and tephra poor) pulse, 4 representing a pulse with dark (tephra-rich)
plume and 3 being a mix of the two former scenarios. The number 1 represents no pulse
(Table 4-2). A timeline was set up throughout the seven hours to obtain a better visualization
of the eruptions behaviour during that day (see chapter 5.1). This data is then used to obtain
the frequency of each pulse type as well as their height, which then can be used to estimate
their contribution to the mass eruption rate during this time interval. An example of how
counting was done during a light grey plume is seen in Figure 4-5 where the numbers simply
represent the counted number of pulses. ImageJ, a Java produced software, is used to stack
together the images of each pulse episode (white and dark) to document the plume behaviour
in a systematic fashion. A total of 100 images of each episode were stacked together and
presented in their maximum and minimum intensity. This is a method where stacks are
analysed by using different projection methods for the pixels and thus highlighting specific
data like the white water vapour in the phreatomagmatic stage or the dark ash in the
magmatic stage which gives the viewer a clear image of the governing phase.A scale bar of
the plume height, published by Arasson et al., (2011) and Björnsson et al., (2013) was used
to analyse images during the ImageJ processing and defining the differences between white,
dark and mixed plume events (Figure 4-4).
Figure 4-4. Scale bar of plume height Published by Arasson et al. in 2011.
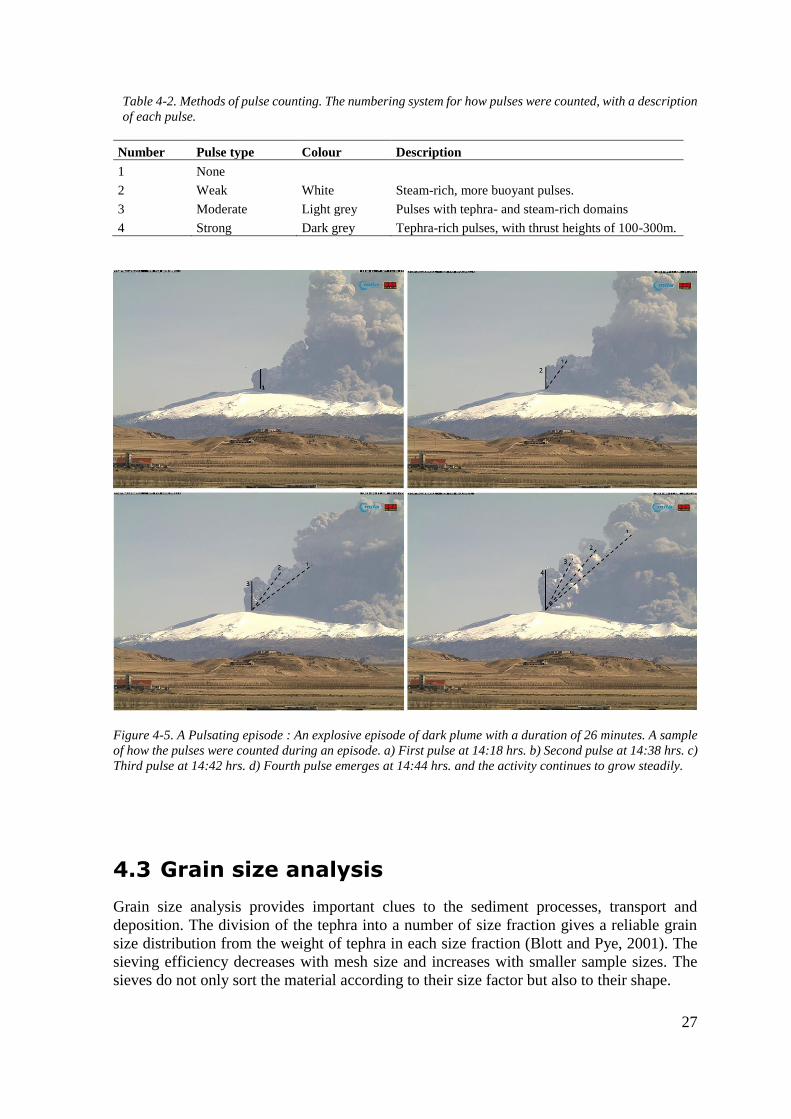
27
Table 4-2. Methods of pulse counting. The numbering system for how pulses were counted, with a description
of each pulse.
Number Pulse type Colour Description
1 None
2 Weak White Steam-rich, more buoyant pulses.
3 Moderate Light grey Pulses with tephra- and steam-rich domains
4 Strong Dark grey Tephra-rich pulses, with thrust heights of 100-300m.
Figure 4-5. A Pulsating episode : An explosive episode of dark plume with a duration of 26 minutes. A sample
of how the pulses were counted during an episode. a) First pulse at 14:18 hrs. b) Second pulse at 14:38 hrs. c)
Third pulse at 14:42 hrs. d) Fourth pulse emerges at 14:44 hrs. and the activity continues to grow steadily.
4.3 Grain size analysis
Grain size analysis provides important clues to the sediment processes, transport and
deposition. The division of the tephra into a number of size fraction gives a reliable grain
size distribution from the weight of tephra in each size fraction (Blott and Pye, 2001). The
sieving efficiency decreases with mesh size and increases with smaller sample sizes. The
sieves do not only sort the material according to their size factor but also to their shape.
28
4.3.1 Sieving
Any explosion imparts a characteristic signature on the sizes and shapes of the particles it
generates (e.g. Walker, 1973). It is therefore crucial to study these particles to gain a deeper
understanding of the leading mechanism taken place during its formation. The granulometric
quantifications, or grain size analysis, of pyroclastic deposits is the key tool for
understanding these mechanisms and for classifying the parent eruptions.
Three out of the five lapilli layers, from the JG070811 section were subjected to grain size
measurements as two of the lapilli samples were not presentable to such measurements. The
purpose of this is to investigate the grain size distribution that were thought to have represent
the tephra produced by a single explosion pulse. As most of the samples are on the smaller
side, 21-320 grams for the lapilli-rich units and 12-440 grams for the ash-rich units, the
whole sample was used for each grain size analysis.
The samples are first dried overnight at temperature ~100 ºC and then cooled off before
sieving. The initial sample is weighted (w) and recorded at the data sheet. The weight of tray
must be subtracted from the recorded weight.
𝒘 = 𝒘(𝒔 + 𝒕) − 𝒘𝒕 (1)
Where:
𝑤𝑠 = 𝑤𝑒𝑖𝑔ℎ 𝑜𝑓 𝑠𝑎𝑚𝑝𝑙𝑒 (g)
𝑤(𝑠 + 𝑡) = 𝑤𝑒𝑖𝑔ℎ𝑡 𝑜𝑓 𝑠𝑎𝑚𝑝𝑙𝑒 𝑎𝑛𝑑 𝑡𝑟𝑎𝑦 (𝑔)
𝑤𝑡 = 𝑤𝑒𝑖𝑔ℎ𝑡 𝑜𝑓 𝑡𝑟𝑎𝑦 (𝑔)
A sieving set of 0.5𝜑 mesh sizes was assembled along with a catch pan. The set was
assembled with the course sieve in the middle and finer one on top, with the catch pan on
the bottom. Then the sieves, along with the pan, are shaken for about 2 minutes, or until
everything that can go through the sieve, has. The material that each fraction retained was
carefully removed from the sieve, weighted to the nearest 0.01 g and recorded in the data
sheet. This is repeated for all sieves sizes that are relevant for the coarseness of the sample.
Potential uncertainties and error in these measurements include loss of sediment during
sieving and the quality and state of the sieve set.
Phi (𝜑) is defined as:
𝝋 = 𝒍𝒐𝒈𝟐𝒅 (2)
where
𝑑 = 𝑑𝑖𝑎𝑚𝑒𝑡𝑒𝑟 𝑜𝑓 𝑚𝑒𝑠ℎ (𝑚𝑚)
4.4 Density and vesicularity measurements
The method of Houghton and Wilson (1989) was used to determine the density and
vesicularity of the juvenile clasts from April 17. A set of 30 or more clasts per section, or
ejected in a single explosion, would be sufficient enough for a reliable density histogram and
29
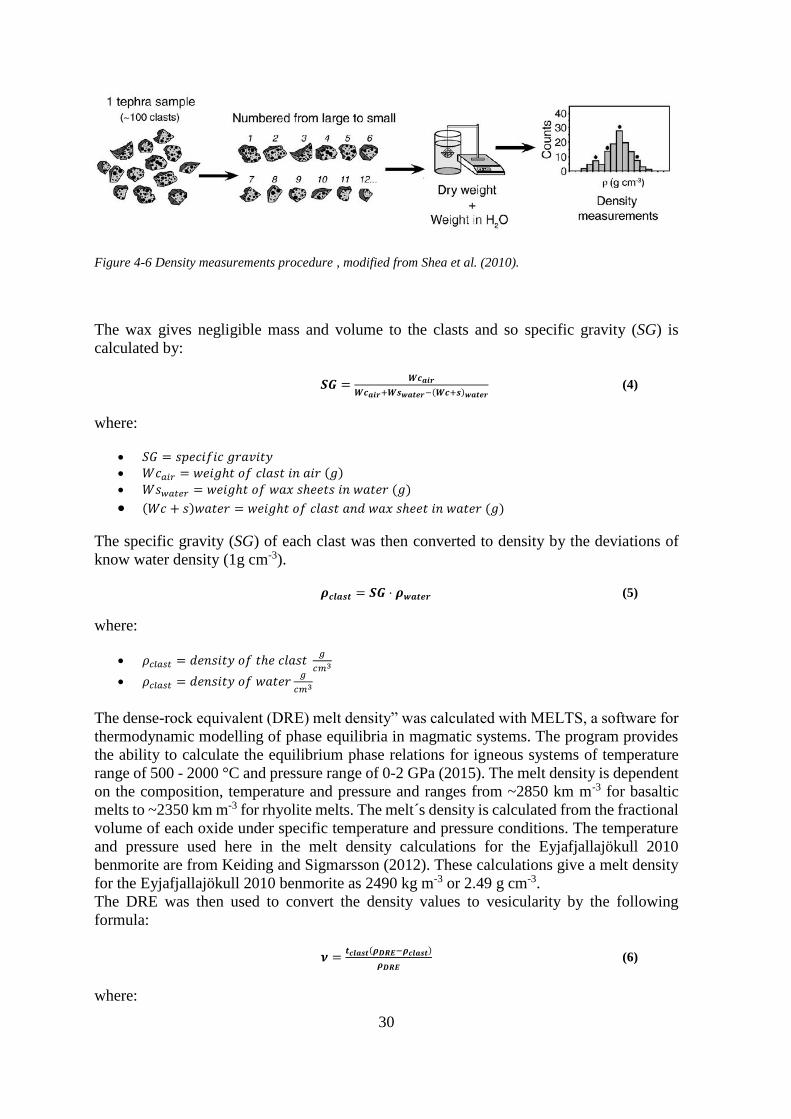
a total of 5 lapilli rich layers were sampled for clast density. However, up on examination in
the laboratory it was realised that only one of the five samples contained 100 clasts (layer
70), the rest contained 44 (layer 83), 82 (layer 90), 74 (layer 97) and 84 (layer 110) clasts.
Firstly, the clasts were washed in a sonic bath for 10 minutes to clear out any residue inside
the vesicles and other unwanted pigments covering the outside of the clasts, this was repeated
3 times. Samples were then placed in an aluminium tray and dried for at least 24 hours in an
oven at >110 °C. After drying, the samples were arranged in an order ranging from the
smallest to the largest and placed on a board and labelled with a number from 1 and up 100.
Colour and other physical characteristics were noted down.
By determining the density and vesicularity, Archimedes principle, the physical law of
buoyancy, was used. Density of an object can be done by dividing it´s mass with its volume.
The law says that any object, completely or partially submerged in water, has a buoyant force
with a magnitude that is equal to the weight of the water that was displaced by the object.
The density (g/ml):
𝒑 =𝒎
𝒗 (3)
where:
𝑝 = 𝑑𝑒𝑛𝑠𝑖𝑡𝑦 (𝑔
𝑚𝑙)
𝑚 = 𝑚𝑎𝑠𝑠 (𝑔)
𝑣 = 𝑣𝑜𝑙𝑢𝑚𝑒 (𝑚𝑙)
First, each sample was weighted dry on a scale with 1/100-gram resolution and noted in the
dry column. Before the density measurements could be carried out the vesicles needed to be
sealed. So each and every clast was coated with a wax paper with known weight and moulded
tightly to the clast surface with body heat. Each clast was labelled with a number from 1 and
up (Houghton and Wilson, 1989).
The wax covered clasts were then placed in an open metal container which was submerged
in water, this was attached to a metal pipe which held the object up for weighing. If the
weight of the clasts was less than that of the displaced water, the object rose. In that case, it
was held down by ballast in order to prevent it from floating. The weight along with the
number of waxing paper per clast, and ballast if they were used, were noted down in the wet
column and the ballast weight in a separate column. The ballast weight was then subtracted
where it applied (Figure 4-6).
30
Figure 4-6 Density measurements procedure , modified from Shea et al. (2010).
The wax gives negligible mass and volume to the clasts and so specific gravity (SG) is
calculated by:
𝑺𝑮 =𝑾𝒄𝒂𝒊𝒓
𝑾𝒄𝒂𝒊𝒓+𝑾𝒔𝒘𝒂𝒕𝒆𝒓−(𝑾𝒄+𝒔)𝒘𝒂𝒕𝒆𝒓 (4)
where:
𝑆𝐺 = 𝑠𝑝𝑒𝑐𝑖𝑓𝑖𝑐 𝑔𝑟𝑎𝑣𝑖𝑡𝑦
𝑊𝑐𝑎𝑖𝑟 = 𝑤𝑒𝑖𝑔ℎ𝑡 𝑜𝑓 𝑐𝑙𝑎𝑠𝑡 𝑖𝑛 𝑎𝑖𝑟 (𝑔)
𝑊𝑠𝑤𝑎𝑡𝑒𝑟 = 𝑤𝑒𝑖𝑔ℎ𝑡 𝑜𝑓 𝑤𝑎𝑥 𝑠ℎ𝑒𝑒𝑡𝑠 𝑖𝑛 𝑤𝑎𝑡𝑒𝑟 (𝑔)
(𝑊𝑐 + 𝑠)𝑤𝑎𝑡𝑒𝑟 = 𝑤𝑒𝑖𝑔ℎ𝑡 𝑜𝑓 𝑐𝑙𝑎𝑠𝑡 𝑎𝑛𝑑 𝑤𝑎𝑥 𝑠ℎ𝑒𝑒𝑡 𝑖𝑛 𝑤𝑎𝑡𝑒𝑟 (𝑔)
The specific gravity (SG) of each clast was then converted to density by the deviations of
know water density (1g cm-3).
𝝆𝒄𝒍𝒂𝒔𝒕 = 𝑺𝑮 ⋅ 𝝆𝒘𝒂𝒕𝒆𝒓 (5)
where:
𝜌𝑐𝑙𝑎𝑠𝑡 = 𝑑𝑒𝑛𝑠𝑖𝑡𝑦 𝑜𝑓 𝑡ℎ𝑒 𝑐𝑙𝑎𝑠𝑡 𝑔
𝑐𝑚3
𝜌𝑐𝑙𝑎𝑠𝑡 = 𝑑𝑒𝑛𝑠𝑖𝑡𝑦 𝑜𝑓 𝑤𝑎𝑡𝑒𝑟𝑔
𝑐𝑚3
The dense-rock equivalent (DRE) melt density” was calculated with MELTS, a software for
thermodynamic modelling of phase equilibria in magmatic systems. The program provides
the ability to calculate the equilibrium phase relations for igneous systems of temperature
range of 500 - 2000 °C and pressure range of 0-2 GPa (2015). The melt density is dependent
on the composition, temperature and pressure and ranges from ~2850 km m-3 for basaltic
melts to ~2350 km m-3 for rhyolite melts. The melt´s density is calculated from the fractional
volume of each oxide under specific temperature and pressure conditions. The temperature
and pressure used here in the melt density calculations for the Eyjafjallajökull 2010
benmorite are from Keiding and Sigmarsson (2012). These calculations give a melt density
for the Eyjafjallajökull 2010 benmorite as 2490 kg m-3 or 2.49 g cm-3.
The DRE was then used to convert the density values to vesicularity by the following
formula:
𝝂 =𝒕𝒄𝒍𝒂𝒔𝒕(𝝆𝑫𝑹𝑬−𝝆𝒄𝒍𝒂𝒔𝒕)
𝝆𝑫𝑹𝑬 (6)
where:

31
𝜈 = 𝑣𝑒𝑠𝑖𝑐𝑢𝑙𝑎𝑟𝑖𝑡𝑦 (%)
𝑡𝑐𝑙𝑎𝑠𝑡 = 𝑛𝑢𝑚𝑏𝑒𝑟 𝑜𝑓 𝑐𝑙𝑎𝑠𝑡𝑠
𝜌𝐷𝑅𝐸 = 𝑑𝑒𝑛𝑠𝑖𝑡𝑦 𝑜𝑓 𝐷𝑅𝐸(𝑔
𝑐𝑚3 )
𝜌𝑐𝑙𝑎𝑠𝑡 = 𝑑𝑒𝑛𝑠𝑖𝑡𝑦 𝑜𝑓 𝑐𝑙𝑎𝑠𝑡 (𝑔
𝑐𝑚3 )
Limitations of these measurements include human error of sample collection, measurements
and recordings. The vesicularity index calculated for the samples are assumed to represent
the magma at time of fragmentation, and therefor that the samples were collected directly of
the fragmentation surface. A total of 100 or more clasts should preferably be collected for
the clast density. A few factors may implicate the certainty of the results during the
laboratory methodology. When wax covering the samples manually it is important to cover
all the outlying vesicles and to tightly seal the sample so that no surrounding air will be
calculated in the vesicularity. Vesicle walls may also be damaged during the procedure,
when the clasts are washed in the sonic bath or when they are being wrapped. The results
from these measurements is presented in section 5.4.
4.5 Image analysis
Information on vesicles in volcanic rocks, such as sizes, population and shapes, give us vital
information about the degassing and magma ascent processes that took place in the magma
prior to and during eruptions. They document processes of gas exsolution, growth and
evacuation that are the driving force of most volcanic eruptions. The vesicle textures are
controlled by the bubble nucleation and growth (Shea, et al., 2010)
4.5.1 Sample preparation
After performing the density measurements on the lapilli clasts, individual clasts were
chosen to obtain information about the vesicularity from image analysis. A total of 4 clasts
were chosen from 2 layers (single explosions) numbered 70 (clast 37 and 38) and 97 (clast
7 and 8) as they covered the majority of the stratigraphic column from 17 April. Each
represented the mode and the tail of each distribution (see Figure 5-17). The first plug was
made by the author, while the remaining three of the plugs were made by Atli Hjartarsson,
a technician at the Faculty of Earth Sciences, the University of Iceland. The samples were
rinsed in a sonic bath for 5 minutes to get rid of any impurities that may have been
incorporated into the clast during the density measurements. They were then dried in an oven
for 30 minutes at >100°C. A mixture of Buhler epo thinner epoxi resin and Buhler epoxi
resin hardener were mixed in a 5:1.95 proportion to make the plug surrounding the clast. A
blue dye was added to the first sample (70-37) to increase contrast while viewing the vesicles
in SEM (scanning electronic microscope) while the other 3 samples were colourless. The
sample was placed in an oval shaped cylinder, which had been coated with a Buehler release
agent (2,2,4-trimethylpentene) to prevent the mixture from getting stuck once hardened. The
mixture was pored over the sample to make a ~17 mm thick plug. To make sure the epoxy
sufficiently filled up the vesicles, the sample was placed in a pressure chamber at 15 bars for
5 minutes, or until the epoxy boiled. It was then removed from the cylinder and poured in a
similar one that had no bottom and that had also been coated with a release agent, placed on
a silicone mat and filled up with the same epoxy blend up to 25 mm. Again, it was placed in
32
a vacum of 2 bars to harden overnight. Once the plug is hardened it was polished with a
Hillquist thin section machine and by Buhler metaserv 250 Grinder-polisher by a vector
power head with grits at 9,3,1 and 0,3 microns. The samples were also polished with water
and liquid grits. The applied force during the polishing was 8.89 N (2 lbs) for up to 2 minutes
at different grits. To clean any unwanted pigments the sample was placed in a sonic bath and
dried overnight. To see if all the vesicles were properly filled up with the epoxy, it was
placed under a microscope and examined carefully. If some of the vesicles were poorly filled,
the sample was polished down and refilled with epoxy.
4.5.2 Image acquisition
Firstly, each sample is scanned in a CanonScan 5600F at 1200 dpi for a complete view of
all the vesicles. The scan is blown up to a 5x magnification and used for further image
analysis as well a map to locate all other images taken at higher magnifications.
To investigate vesicle size and population in the pumice samples, the scanning electron
microscopy (SEM) is used to map the vesicles in higher resolutions. The SEM focuses its
electronic beam on the irritated area which is being viewed and gives out signals of either
secondary electrons, Auger electrons, characteristic x rays, photons of various energies and
backscattered electrons. The backscatter electron imaging (BSEI) mode has proven to be the
most effective setting for this work. When set on backscattered mode, the electron beam is
swept across the sample and gives information about the surface topography. These signals
are then gathered from certain emissions volumes within the sample and can be used for
examining the composition, surface topography, crystallography and other characteristics of
the sample (e.g. Goldstein, 1992).
Prior to imaging in SEM, the plug is gold coated with a Cressington Sputter coater 108auto
machine which sputters the top of the sample with a dc magnetron head (unknown, 2016).
The gold acts as a conductor of electrons during the image analysis in the SEM. The sample
is placed in the middle of the plate and the lid firmly compressed down until the pressure
chamber reacts. When the barometer has reached 35-40 mA, the start button is pushed and
the sample is coated with argon gas particles for about 15 seconds. Thereafter, the chamber
needs to be ventilated by pressing “flush”. The procedure is repeated three times to insure a
sufficient coating on the plug.
After airing out the chamber, the gold coated sample is placed on a platform which has been
set to a certain height and attached with a metal tape to further increase the conductivity of
electrons. The chamber must then be set into the state of vacuum and backscatter electron
imaging mode. Once the air has emptied out, 10 minutes of waiting are added to improve
the durability of the W filaments as the SEM instrument is easily oxidizes when hot.
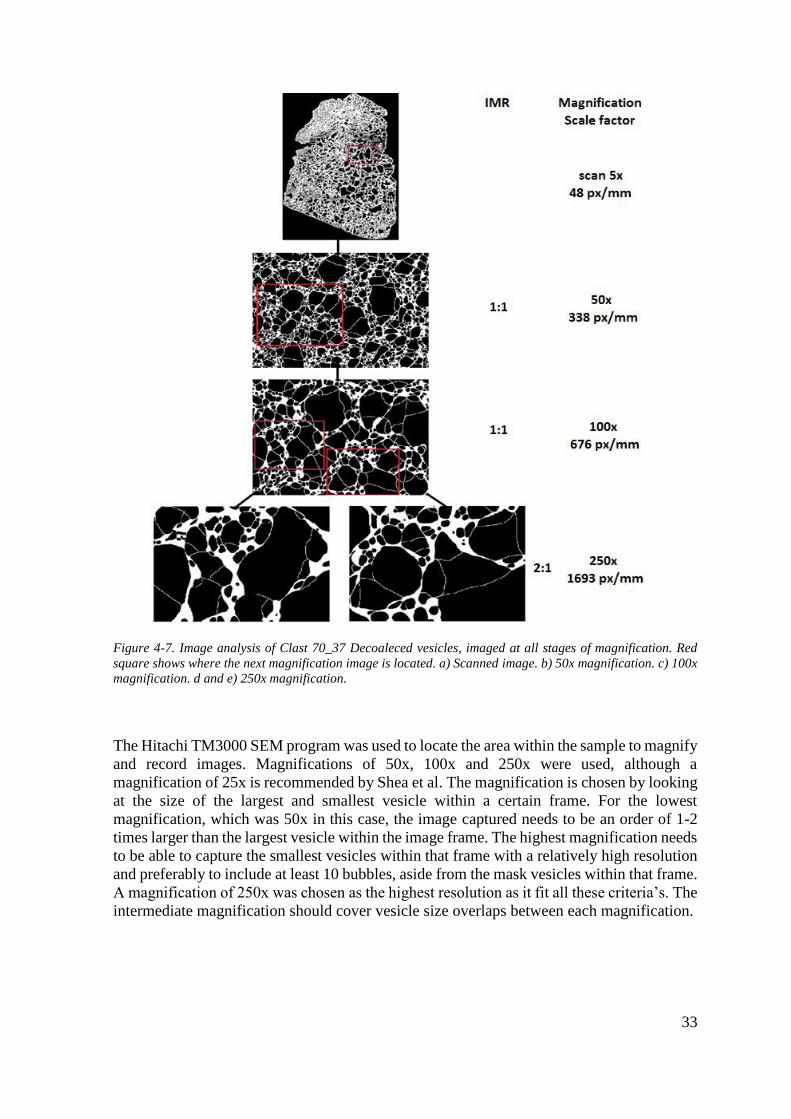
33
Figure 4-7. Image analysis of Clast 70_37 Decoaleced vesicles, imaged at all stages of magnification. Red
square shows where the next magnification image is located. a) Scanned image. b) 50x magnification. c) 100x
magnification. d and e) 250x magnification.
The Hitachi TM3000 SEM program was used to locate the area within the sample to magnify
and record images. Magnifications of 50x, 100x and 250x were used, although a
magnification of 25x is recommended by Shea et al. The magnification is chosen by looking
at the size of the largest and smallest vesicle within a certain frame. For the lowest
magnification, which was 50x in this case, the image captured needs to be an order of 1-2
times larger than the largest vesicle within the image frame. The highest magnification needs
to be able to capture the smallest vesicles within that frame with a relatively high resolution
and preferably to include at least 10 bubbles, aside from the mask vesicles within that frame.
A magnification of 250x was chosen as the highest resolution as it fit all these criteria’s. The
intermediate magnification should cover vesicle size overlaps between each magnification.

34
4.5.3 Image strategy
Shea et al. (2010) propose a few strategies for choosing the adequate image strategy, a 73-
image grid strategy where a thin section is imaged 24 times for each magnification, a 25-
image grid strategy where one thin section has 8 images for each magnification and a 15-
image nest strategy where a thin section has an increased number of images for each of the
magnification of 1:2:4:8. The grid strategy is accurate and insures that the areas imaged are
covered regardless of how the processor chooses where to image but this strategy is quite
time consuming. IMR (Image Magnification ratio) gives you the number of images in each
nest. The grid strategy, the IMR = 1:1, and in the nest strategy, the IMR > 1:1. An alteration
of the nest strategy was chosen for this research with 13 images (Table 4-3), as it is less time
consuming but captures the smallest vesicles at high resolution and thus ensures enough area
to represent each vesicle size range. The IMR was 1:1, 1:1, 1:1 for the first 3 magnifications
and 2:1 for the highest.
When assessing the accurate approach and number of images taken at each magnification it
is important to take into count the time needed to process and correct the images, whether
the clasts are homogeneous or not, the vesicle size distribution and the number of vesicles
per image. For the highest magnification, a total of 10 or more vesicles (the mask vesicles
excluded) must be counted within each frame. Thus, for the 6 images taken at highest
magnification, 60 or more vesicles needed to be present. Shea et al. state that the number of
images used at a given strategy depends on the heterogeneity and vesicle size range. The
smallest vesicles in the samples measured are relatively small. On average the total number
of vesicles counted in the highest magnifications was >60 per image. The melt of the
explosive phase of Eyjafjallajökull was quite heterogeneous, including both very small and
large bubbles which, preferably, should lead to additional series of images. With time
management and the size of research to consider, along with the high amount of small
vesicles, the 13-image nest variation chosen in this paper was thought most suitable.
Scan
50a
100a
250aa 250ab
50b
100b
250ba 250bb
50c
100c
250ca 250cb
Table 4-3. An illustration of the 13 image “Exponential” Nest from SEM imaging.
35
4.5.4 Image rectification
The pumice clasts are very fragile and the vesicles can easily be distorted during fallout or
by natural events during or after the volcanic eruption. Human encounter can also cause
disruption to the clasts while sampling, during transport and throughout the many stages of
imaging process, especially when creating the plug and polishing it. The vesicle walls are
thin and easily break or they simply might not be captured by the SEM even at the highest
resolution. When viewing the vesicles through the SEM, some of them appear in 3D as you
are able to see through the plug. The ImageJ program reads the image in a homogeneous
binary way, where the vesicles and crystals are completely black and the melt white. This is
almost impossible to achieve in the Hitachi SEM program so corrections need to be me maid
to reconstruct bubble walls, decoalece the bubbles and make the image completely binary.
This process of image rectification is time consuming but the quality of thin section, quality
of the instrument and number of magnifications needed all contribute to the amount of work.
GIMP is an acronym for GNU Image Manipulation Program, or a photo editor to simplify.
It is distributed as a free software to tackle tasks such as photo retouching, image
composition and image authoring for GNU/Linux, OS X and Windows users. The program
is used to make the image binary, decoalece the vesicles and highlight crystals as the next
step preformed in ImageJ only identifies the objects in binary. The melt is coloured white
and vesicles are refined and bucket filled with black. All vesicle walls need to be of size 3
pixles or larger in width as the ImageJ program does not identify each vesicle if they are
spaced closer together. The crystals are both coloured in black and grey and pasted on to a
new layer, along with being included in the decoaleced final image. Figure 4-8 shows the
image process in steps from being a raw image from the SEM filament, to being completely
decoaleced and with crystals added.
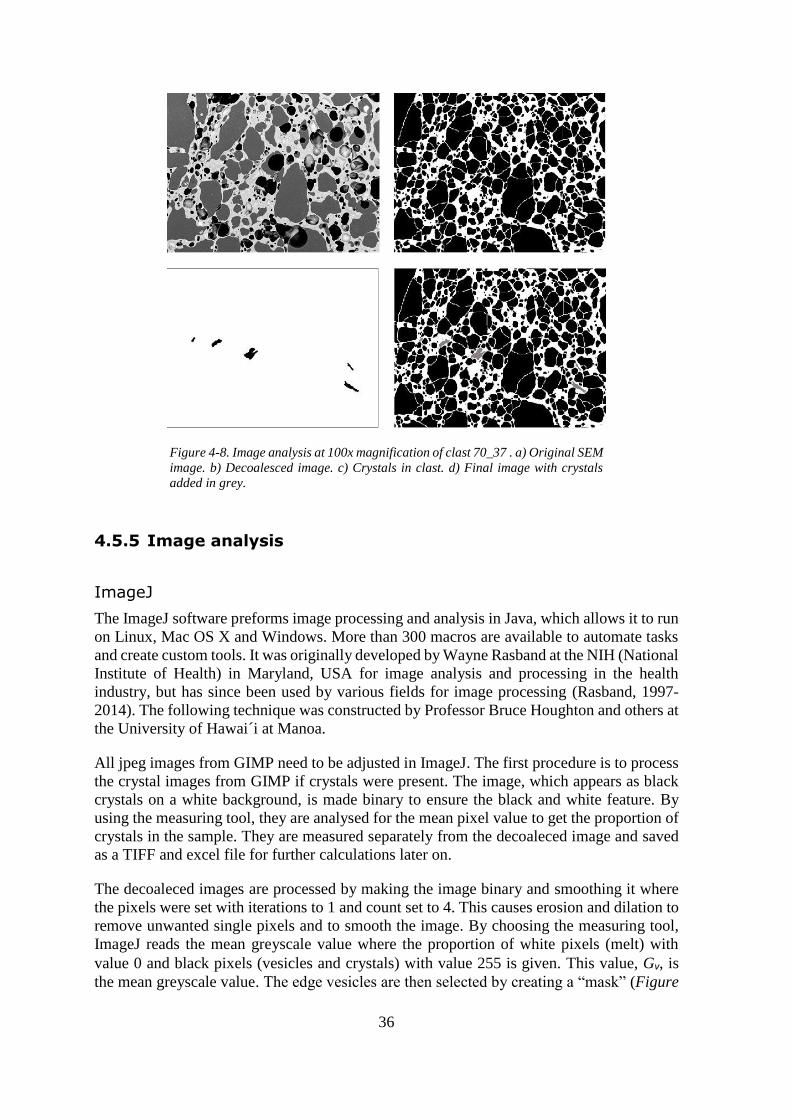
36
Figure 4-8. Image analysis at 100x magnification of clast 70_37 . a) Original SEM
image. b) Decoalesced image. c) Crystals in clast. d) Final image with crystals
added in grey.
4.5.5 Image analysis
ImageJ
The ImageJ software preforms image processing and analysis in Java, which allows it to run
on Linux, Mac OS X and Windows. More than 300 macros are available to automate tasks
and create custom tools. It was originally developed by Wayne Rasband at the NIH (National
Institute of Health) in Maryland, USA for image analysis and processing in the health
industry, but has since been used by various fields for image processing (Rasband, 1997-
2014). The following technique was constructed by Professor Bruce Houghton and others at
the University of Hawai´i at Manoa.
All jpeg images from GIMP need to be adjusted in ImageJ. The first procedure is to process
the crystal images from GIMP if crystals were present. The image, which appears as black
crystals on a white background, is made binary to ensure the black and white feature. By
using the measuring tool, they are analysed for the mean pixel value to get the proportion of
crystals in the sample. They are measured separately from the decoaleced image and saved
as a TIFF and excel file for further calculations later on.
The decoaleced images are processed by making the image binary and smoothing it where
the pixels were set with iterations to 1 and count set to 4. This causes erosion and dilation to
remove unwanted single pixels and to smooth the image. By choosing the measuring tool,
ImageJ reads the mean greyscale value where the proportion of white pixels (melt) with
value 0 and black pixels (vesicles and crystals) with value 255 is given. This value, Gν, is
the mean greyscale value. The edge vesicles are then selected by creating a “mask” (Figure
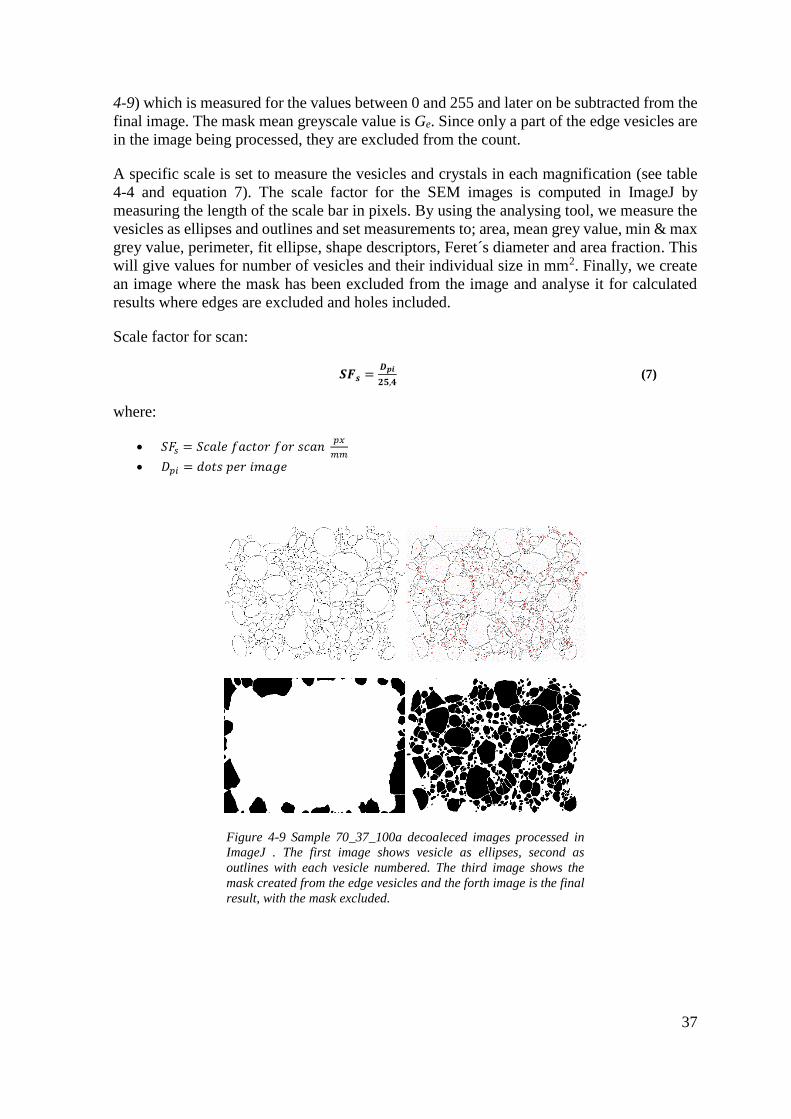
37
4-9) which is measured for the values between 0 and 255 and later on be subtracted from the
final image. The mask mean greyscale value is Ge. Since only a part of the edge vesicles are
in the image being processed, they are excluded from the count.
A specific scale is set to measure the vesicles and crystals in each magnification (see table
4-4 and equation 7). The scale factor for the SEM images is computed in ImageJ by
measuring the length of the scale bar in pixels. By using the analysing tool, we measure the
vesicles as ellipses and outlines and set measurements to; area, mean grey value, min & max
grey value, perimeter, fit ellipse, shape descriptors, Feret´s diameter and area fraction. This
will give values for number of vesicles and their individual size in mm2. Finally, we create
an image where the mask has been excluded from the image and analyse it for calculated
results where edges are excluded and holes included.
Scale factor for scan:
𝑺𝑭𝒔 =𝑫𝒑𝒊
𝟐𝟓,𝟒 (7)
where:
𝑆𝐹𝑠 = 𝑆𝑐𝑎𝑙𝑒 𝑓𝑎𝑐𝑡𝑜𝑟 𝑓𝑜𝑟 𝑠𝑐𝑎𝑛 𝑝𝑥
𝑚𝑚
𝐷𝑝𝑖 = 𝑑𝑜𝑡𝑠 𝑝𝑒𝑟 𝑖𝑚𝑎𝑔𝑒
Figure 4-9 Sample 70_37_100a decoaleced images processed in
ImageJ . The first image shows vesicle as ellipses, second as
outlines with each vesicle numbered. The third image shows the
mask created from the edge vesicles and the forth image is the final
result, with the mask excluded.
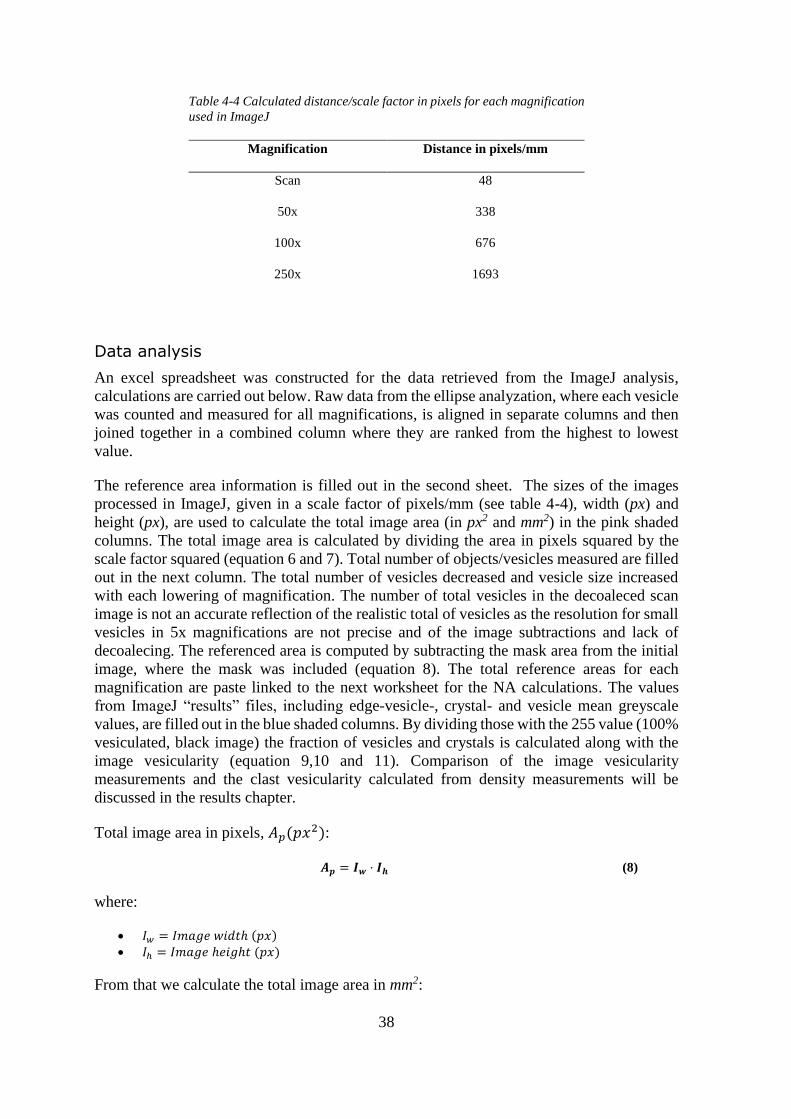
38
Table 4-4 Calculated distance/scale factor in pixels for each magnification
used in ImageJ
Magnification Distance in pixels/mm
Scan 48
50x 338
100x 676
250x 1693
Data analysis
An excel spreadsheet was constructed for the data retrieved from the ImageJ analysis,
calculations are carried out below. Raw data from the ellipse analyzation, where each vesicle
was counted and measured for all magnifications, is aligned in separate columns and then
joined together in a combined column where they are ranked from the highest to lowest
value.
The reference area information is filled out in the second sheet. The sizes of the images
processed in ImageJ, given in a scale factor of pixels/mm (see table 4-4), width (px) and
height (px), are used to calculate the total image area (in px2 and mm2) in the pink shaded
columns. The total image area is calculated by dividing the area in pixels squared by the
scale factor squared (equation 6 and 7). Total number of objects/vesicles measured are filled
out in the next column. The total number of vesicles decreased and vesicle size increased
with each lowering of magnification. The number of total vesicles in the decoaleced scan
image is not an accurate reflection of the realistic total of vesicles as the resolution for small
vesicles in 5x magnifications are not precise and of the image subtractions and lack of
decoalecing. The referenced area is computed by subtracting the mask area from the initial
image, where the mask was included (equation 8). The total reference areas for each
magnification are paste linked to the next worksheet for the NA calculations. The values
from ImageJ “results” files, including edge-vesicle-, crystal- and vesicle mean greyscale
values, are filled out in the blue shaded columns. By dividing those with the 255 value (100%
vesiculated, black image) the fraction of vesicles and crystals is calculated along with the
image vesicularity (equation 9,10 and 11). Comparison of the image vesicularity
measurements and the clast vesicularity calculated from density measurements will be
discussed in the results chapter.
Total image area in pixels, 𝐴𝑝(𝑝𝑥2):
𝑨𝒑 = 𝑰𝒘 ⋅ 𝑰𝒉 (8)
where:
𝐼𝑤 = 𝐼𝑚𝑎𝑔𝑒 𝑤𝑖𝑑𝑡ℎ (𝑝𝑥)
𝐼ℎ = 𝐼𝑚𝑎𝑔𝑒 ℎ𝑒𝑖𝑔ℎ𝑡 (𝑝𝑥)
From that we calculate the total image area in mm2:
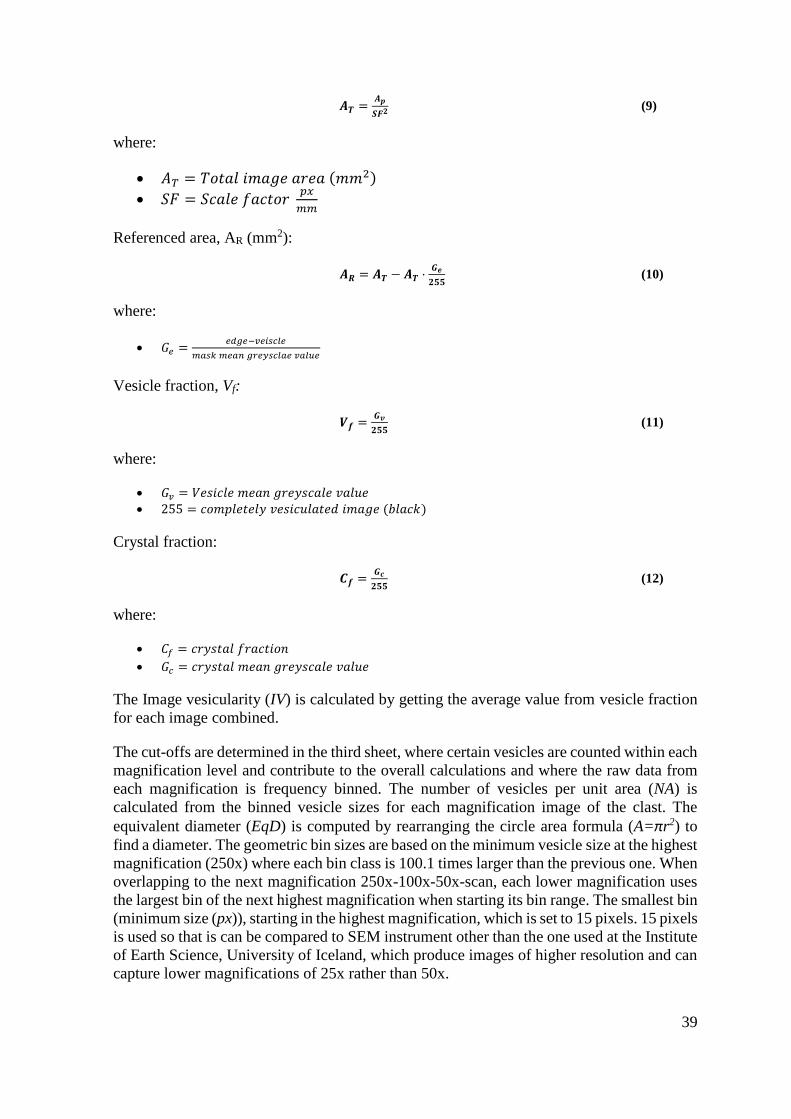
39
𝑨𝑻 =𝑨𝒑
𝑺𝑭𝟐 (9)
where:
𝐴𝑇 = 𝑇𝑜𝑡𝑎𝑙 𝑖𝑚𝑎𝑔𝑒 𝑎𝑟𝑒𝑎 (𝑚𝑚2)
𝑆𝐹 = 𝑆𝑐𝑎𝑙𝑒 𝑓𝑎𝑐𝑡𝑜𝑟 𝑝𝑥
𝑚𝑚
Referenced area, AR (mm2):
𝑨𝑹 = 𝑨𝑻 − 𝑨𝑻 ⋅𝑮𝒆
𝟐𝟓𝟓 (10)
where:
𝐺𝑒 =𝑒𝑑𝑔𝑒−𝑣𝑒𝑖𝑠𝑐𝑙𝑒
𝑚𝑎𝑠𝑘 𝑚𝑒𝑎𝑛 𝑔𝑟𝑒𝑦𝑠𝑐𝑙𝑎𝑒 𝑣𝑎𝑙𝑢𝑒
Vesicle fraction, Vf:
𝑽𝒇 =𝑮𝒗
𝟐𝟓𝟓 (11)
where:
𝐺𝑣 = 𝑉𝑒𝑠𝑖𝑐𝑙𝑒 𝑚𝑒𝑎𝑛 𝑔𝑟𝑒𝑦𝑠𝑐𝑎𝑙𝑒 𝑣𝑎𝑙𝑢𝑒
255 = 𝑐𝑜𝑚𝑝𝑙𝑒𝑡𝑒𝑙𝑦 𝑣𝑒𝑠𝑖𝑐𝑢𝑙𝑎𝑡𝑒𝑑 𝑖𝑚𝑎𝑔𝑒 (𝑏𝑙𝑎𝑐𝑘)
Crystal fraction:
𝑪𝒇 =𝑮𝒄
𝟐𝟓𝟓 (12)
where:
𝐶𝑓 = 𝑐𝑟𝑦𝑠𝑡𝑎𝑙 𝑓𝑟𝑎𝑐𝑡𝑖𝑜𝑛
𝐺𝑐 = 𝑐𝑟𝑦𝑠𝑡𝑎𝑙 𝑚𝑒𝑎𝑛 𝑔𝑟𝑒𝑦𝑠𝑐𝑎𝑙𝑒 𝑣𝑎𝑙𝑢𝑒
The Image vesicularity (IV) is calculated by getting the average value from vesicle fraction
for each image combined.
The cut-offs are determined in the third sheet, where certain vesicles are counted within each
magnification level and contribute to the overall calculations and where the raw data from
each magnification is frequency binned. The number of vesicles per unit area (NA) is
calculated from the binned vesicle sizes for each magnification image of the clast. The
equivalent diameter (EqD) is computed by rearranging the circle area formula (A=πr2) to
find a diameter. The geometric bin sizes are based on the minimum vesicle size at the highest
magnification (250x) where each bin class is 100.1 times larger than the previous one. When
overlapping to the next magnification 250x-100x-50x-scan, each lower magnification uses
the largest bin of the next highest magnification when starting its bin range. The smallest bin
(minimum size (px)), starting in the highest magnification, which is set to 15 pixels. 15 pixels
is used so that is can be compared to SEM instrument other than the one used at the Institute
of Earth Science, University of Iceland, which produce images of higher resolution and can
capture lower magnifications of 25x rather than 50x.
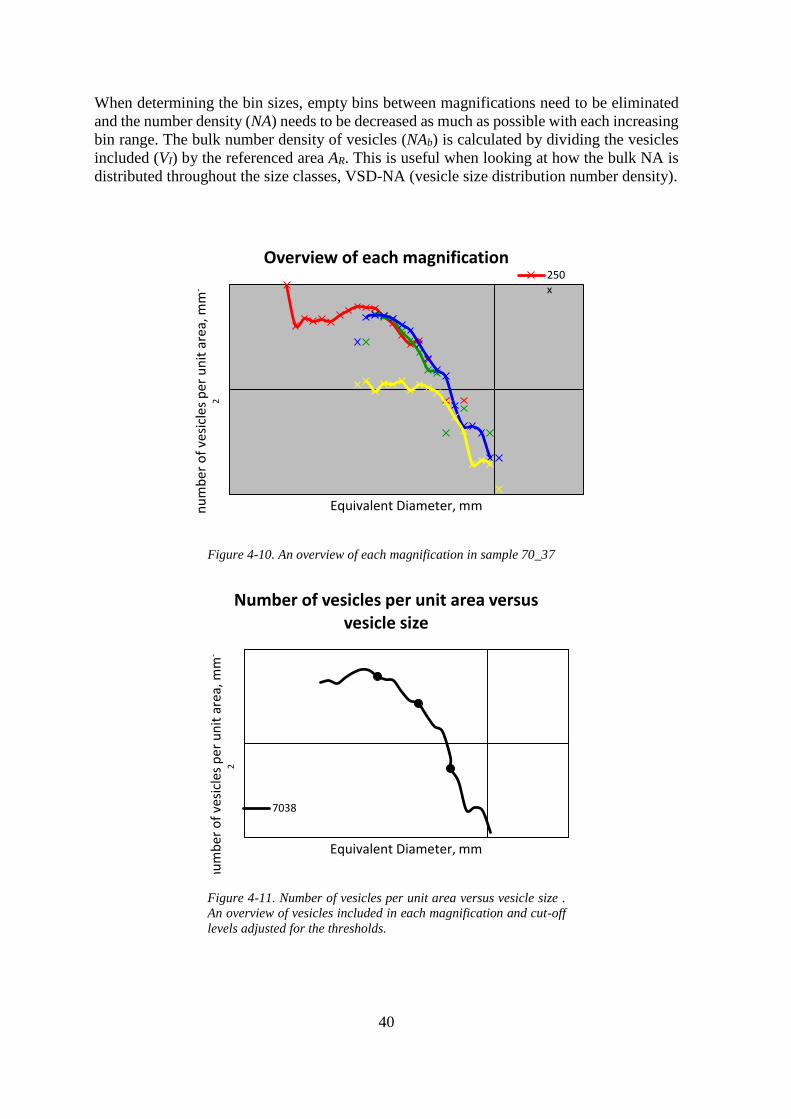
40
When determining the bin sizes, empty bins between magnifications need to be eliminated
and the number density (NA) needs to be decreased as much as possible with each increasing
bin range. The bulk number density of vesicles (NAb) is calculated by dividing the vesicles
included (VI) by the referenced area AR. This is useful when looking at how the bulk NA is
distributed throughout the size classes, VSD-NA (vesicle size distribution number density).
Figure 4-10. An overview of each magnification in sample 70_37
Figure 4-11. Number of vesicles per unit area versus vesicle size .
An overview of vesicles included in each magnification and cut-off
levels adjusted for the thresholds.
nu
mb
er o
f ve
sicl
es p
er u
nit
are
a, m
m-
2
Equivalent Diameter, mm
Overview of each magnification250x
nu
mb
er o
f ve
sicl
es p
er u
nit
are
a, m
m-
2
Equivalent Diameter, mm
Number of vesicles per unit area versus vesicle size
7038
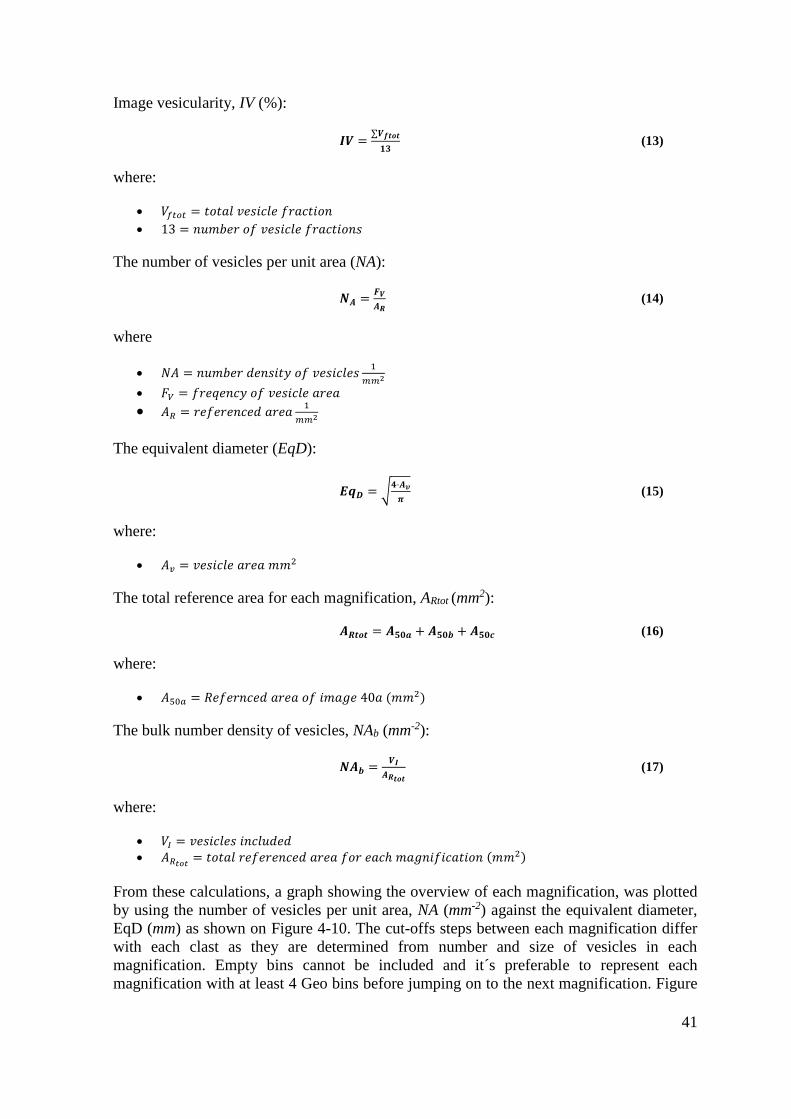
41
Image vesicularity, IV (%):
𝑰𝑽 =∑𝑽𝒇𝒕𝒐𝒕
𝟏𝟑 (13)
where:
𝑉𝑓𝑡𝑜𝑡 = 𝑡𝑜𝑡𝑎𝑙 𝑣𝑒𝑠𝑖𝑐𝑙𝑒 𝑓𝑟𝑎𝑐𝑡𝑖𝑜𝑛
13 = 𝑛𝑢𝑚𝑏𝑒𝑟 𝑜𝑓 𝑣𝑒𝑠𝑖𝑐𝑙𝑒 𝑓𝑟𝑎𝑐𝑡𝑖𝑜𝑛𝑠
The number of vesicles per unit area (NA):
𝑵𝑨 =𝑭𝑽
𝑨𝑹 (14)
where
𝑁𝐴 = 𝑛𝑢𝑚𝑏𝑒𝑟 𝑑𝑒𝑛𝑠𝑖𝑡𝑦 𝑜𝑓 𝑣𝑒𝑠𝑖𝑐𝑙𝑒𝑠1
𝑚𝑚2
𝐹𝑉 = 𝑓𝑟𝑒𝑞𝑒𝑛𝑐𝑦 𝑜𝑓 𝑣𝑒𝑠𝑖𝑐𝑙𝑒 𝑎𝑟𝑒𝑎
𝐴𝑅 = 𝑟𝑒𝑓𝑒𝑟𝑒𝑛𝑐𝑒𝑑 𝑎𝑟𝑒𝑎1
𝑚𝑚2
The equivalent diameter (EqD):
𝑬𝒒𝑫 = √𝟒⋅𝑨𝒗
𝝅 (15)
where:
𝐴𝑣 = 𝑣𝑒𝑠𝑖𝑐𝑙𝑒 𝑎𝑟𝑒𝑎 𝑚𝑚2
The total reference area for each magnification, ARtot (mm2):
𝑨𝑹𝒕𝒐𝒕 = 𝑨𝟓𝟎𝒂 + 𝑨𝟓𝟎𝒃 + 𝑨𝟓𝟎𝒄 (16)
where:
𝐴50𝑎 = 𝑅𝑒𝑓𝑒𝑟𝑛𝑐𝑒𝑑 𝑎𝑟𝑒𝑎 𝑜𝑓 𝑖𝑚𝑎𝑔𝑒 40𝑎 (𝑚𝑚2)
The bulk number density of vesicles, NAb (mm-2):
𝑵𝑨𝒃 =𝑽𝑰
𝑨𝑹𝒕𝒐𝒕
(17)
where:
𝑉𝐼 = 𝑣𝑒𝑠𝑖𝑐𝑙𝑒𝑠 𝑖𝑛𝑐𝑙𝑢𝑑𝑒𝑑
𝐴𝑅𝑡𝑜𝑡= 𝑡𝑜𝑡𝑎𝑙 𝑟𝑒𝑓𝑒𝑟𝑒𝑛𝑐𝑒𝑑 𝑎𝑟𝑒𝑎 𝑓𝑜𝑟 𝑒𝑎𝑐ℎ 𝑚𝑎𝑔𝑛𝑖𝑓𝑖𝑐𝑎𝑡𝑖𝑜𝑛 (𝑚𝑚2)
From these calculations, a graph showing the overview of each magnification, was plotted
by using the number of vesicles per unit area, NA (mm-2) against the equivalent diameter,
EqD (mm) as shown on Figure 4-10. The cut-offs steps between each magnification differ
with each clast as they are determined from number and size of vesicles in each
magnification. Empty bins cannot be included and it´s preferable to represent each
magnification with at least 4 Geo bins before jumping on to the next magnification. Figure

42
4-11 shows how cut-offs were chosen to eliminate gaps and create a steady size increase
between the NA of each magnification.
By dividing the frequency of vesicles in each bin by the total reference area for each
magnification, ARtot (mm2) the NA for each bin is given, NAbin(mm-2) and If crystals were
present in the images, the NA needed to be adjusted for them, NAc (mm-2). Finally, the total
number density of vesicles, NAT, is calculated by adding all the NA values for all the bins.
The NA for each bin is given, NAbin (mm-2):
𝑵𝑨𝒃𝒊𝒏 =𝑭𝒃𝒊𝒏
𝑨𝑹𝒕𝒐𝒕
(18)
where:
𝑁𝐴𝑏𝑖𝑛 = 𝑛𝑢𝑚𝑏𝑒𝑟 𝑑𝑒𝑛𝑠𝑖𝑡𝑦 𝑓𝑜𝑟 𝑒𝑎𝑐ℎ 𝑏𝑖𝑛 (𝑚𝑚−2)
𝐹𝑏𝑖𝑛 = 𝑓𝑟𝑒𝑞𝑢𝑒𝑛𝑐𝑦 𝑜𝑓 𝑣𝑒𝑠𝑖𝑐𝑙𝑒𝑠 𝑖𝑛 𝑒𝑎𝑐ℎ 𝑏𝑖𝑛
𝐴𝑅𝑡𝑜𝑡 = 𝑡𝑜𝑡𝑎𝑙 𝑟𝑒𝑓𝑒𝑟𝑒𝑛𝑐𝑒 𝑎𝑟𝑒𝑎 𝑜𝑓 𝑒𝑎𝑐ℎ 𝑚𝑎𝑔𝑛𝑖𝑓𝑖𝑐𝑎𝑡𝑖𝑜𝑛
The number density of vesicles adjusted for the crystals (mm-2):
𝑵𝑨𝑪 =𝑵𝑨𝒃𝒊𝒏
𝟏−𝑪𝒇 (19)
where:
𝑁𝐴𝐶 = 𝑛𝑢𝑚𝑏𝑒𝑟 𝑑𝑒𝑛𝑠𝑖𝑡𝑦 𝑜𝑓 𝑣𝑒𝑠𝑖𝑐𝑙𝑒𝑠 𝑎𝑑𝑗𝑢𝑠𝑡𝑒𝑑 𝑓𝑜𝑟 𝑡ℎ𝑒 𝑐𝑟𝑦𝑠𝑡𝑎𝑙𝑠 (𝑚𝑚−2)
𝐶𝑓 = 𝑐𝑟𝑦𝑠𝑡𝑎𝑙 𝑓𝑟𝑎𝑐𝑡𝑖𝑜𝑛 (𝑚𝑚−2)
The total number density of vesicles, NAT (mm-2):
𝑵𝑨𝒕𝒐𝒕 = ∑ 𝑵𝑨𝒃𝒊𝒏𝟑𝟏𝟏 (20)
Vesicle volume and size distribution
In the fourth sheet the Geo. bins are aligned in a number ranging from 1-32, with class size
1 being the largest size bin. An alpha value was devised from Sahagain and Proussevitch
(1998) to incorporate the variable of probability into the calculations. Kathy Cashman
calculated the alpha values for all 32 size classes to add to the 12 classes formerly calculated
(Sahagian and Proussevitch, 1998).
The Hbar is the mean height of a shadow casted by particles spinning constantly in randomly
oriented axes and equals to the diameter of each size class. The number of vesicles per
volume (NV, mm-3) uses an equation from Sahagian and Proussevitch (1998) to convert 2D
into 3D (equation 19). Radius is substituted for Hbar/2 in the calculations for equivalent
spherical volume. The volume fraction (Vfr) is then calculated by multiplying the NV value
with the spherical volume and the total volume is simply the sum of all those values. A
corrector factor is then applied to the volume fraction from the previous computed density-
derived clast vesicularity (equation 4) divided by the Vfr sum to calculate the adjusted
volume fraction (Vfad).
43
𝑵𝑽𝟏 =𝟏
𝑯′𝟏𝜶𝟏𝑵𝑺𝟏 (21)
where:
𝑁𝑉1 = 𝑛𝑢𝑚𝑏𝑒𝑟 𝑜𝑓 𝑣𝑒𝑠𝑖𝑐𝑙𝑒𝑠 𝑝𝑒𝑟 𝑢𝑛𝑖𝑡 𝑣𝑜𝑙𝑢𝑚𝑒 𝑓𝑜𝑟 𝑐𝑙𝑎𝑠𝑠 1 (𝑚𝑚−3)
𝐻′1 = 𝑀𝑒𝑎𝑛 𝑝𝑟𝑜𝑗𝑒𝑐𝑡𝑒𝑑 ℎ𝑒𝑖𝑔ℎ𝑡 (𝑚𝑚)
𝑁𝑆1 = 𝑛𝑢𝑚𝑏𝑒𝑟 𝑜𝑓 𝑠𝑒𝑐𝑡𝑖𝑜𝑛𝑠 𝑝𝑒𝑟 𝑢𝑛𝑖𝑡 𝑎𝑟𝑒𝑎 𝑓𝑜𝑟 𝑐𝑙𝑎𝑠𝑠 1
Volume of equivalent sphere, Vs (mm3):
𝑽𝒔 = 𝝅𝑯𝒃𝒂𝒓𝟑
𝟔 (22)
Volume fraction (Vfr):
𝑽𝒇𝒓 = 𝑵𝑽 ∗ 𝑽𝒔 (23)
Total volume fraction (Vfrtot):
𝑽𝒇𝒓𝒕𝒐𝒕 = ∑𝑽𝒇𝒓 (24)
Corrector factor (Cf):
𝑪𝒇 =𝒗
𝑽𝒇𝒓𝒕𝒐𝒕 (25)
where:
𝜈 = 𝑣𝑒𝑠𝑖𝑐𝑢𝑙𝑎𝑟𝑖𝑡𝑦 (%)
Adjusted volume fraction (Vfrad):
𝑽𝒇𝒂𝒅 = 𝑽𝒇𝒓 ∗ 𝑪𝒇 (26)
When the volume conversions are correct, the total volume fraction (Vfrtot) should equal to
the density-derived vesicularity (v) and the corrector factor is unnecessary, it is however
always included in to the final calculations as this is not always the case. The final sheet
represent graphs plotted from all the previous calculations; number of vesicles per volume
versus vesicle size, vesicle volume distribution (VVD), cumulative vesicle volume
distribution (CVVD), vesicle size distribution (VSD), and cumulative volume fraction (see
results chapter).
4.5.6 Limitations of the data
The SEM image strategy puts a great responsibility to the operator of not making bias
choices when assessing the textural heterogeneity, which may result in inaccurate results of
the BSD (bubble size distribution). Only a tiny fraction of samples measured for density and
vesicularity can be further investigated with image analysis. The selection of the clasts
imaged is solely at the discretion of the researcher based upon the criteria outlined in chapter
5.5, and as a result, may be somewhat subjective.

44
When rectifying the images in GIMP, the operator must decide how and if bubbles should
be decoaleced. Decoalecing is a delicate procedure where the operator must apply the same
methodology of decoalecing throughout the entire image collection and must not “create”
desired shapes with the result of illuminating vesicle pixels (black). Choosing the appropriate
cut-offs between each magnification contributes to the amount of the vesicle sizes that are
included in the calculations and so caution has to be made to apply similar limits to each
magnification.

45
5. Results
5.1 Plume observations
According to the European aviation, the weather conditions at the time of the 39-day-long
summit eruption at Eyjafjallajökull volcano in 2010 was a worst-case scenario (Stevenson,
2012). The persistent north-westerly winds that carried the tephra-bearing plumes towards
Europe were dominant for 71% of the duration (Petersen, 2012). This proofed to be very
costly for the aviation industry but convenient for Iceland since bulk of the ash plume blew
straight of the island (Figure 5-1). Little precipitation also did not help with clearing the ash
from the air or the ground.
The plume behaviour was analysed for a period of seven hours in the afternoon and evening
of 17 April 2010 as the visibility was adequate during this time. In this analyses I used the
digital images obtained by the MÍLA surveillance camera at Hvolsvöllur, 34 km from the
eruption site. A total of 5028 images, taken every five seconds were examined for plume
behaviour and types of pulses (see Appendix A, for details).
April 17 featured the most intensive explosive activity during the initial phase of the
summit eruption (Guðmundsson et al., 2012; Dellino, 2012) and the during the 7 hours
considered here the pulsating activity produced plumes reaching heights well above 8 km
(Figure 5-2). A total of 399 pulses were counted for the duration of 7 hours. Most of the
pulses featured dark coloured, i.e. ash-rich, plumes (e.g. Figure 5-3), but pulses producing
white plumes, i.e. steam-dominated plumes, as well as hybrid plumes (see Figure 4-5)
were not uncommon. A typical eruption behaviour pattern during these seven hours was
the emergence and build-up of a substantial dark plume over an hour or so followed by a
decaying hybrid plume (light grey), leading into a <1-hour period of weak activity, typified
by small steam plumes. A sudden burst of white plume, rising to heights >5 km then marks
the onset of next pulse.
Figure 5-1. A natural-colour satellite image from 17 April : captured by Moderate Resolution imaging
Spectroradiometer (MODIS) on NASA’S Aqua satellite. The plume is at two different altitudes, with the denser
one, presumably formed during an explosive pulse event, rising above the diffusive ash cloud below. From
NASA.
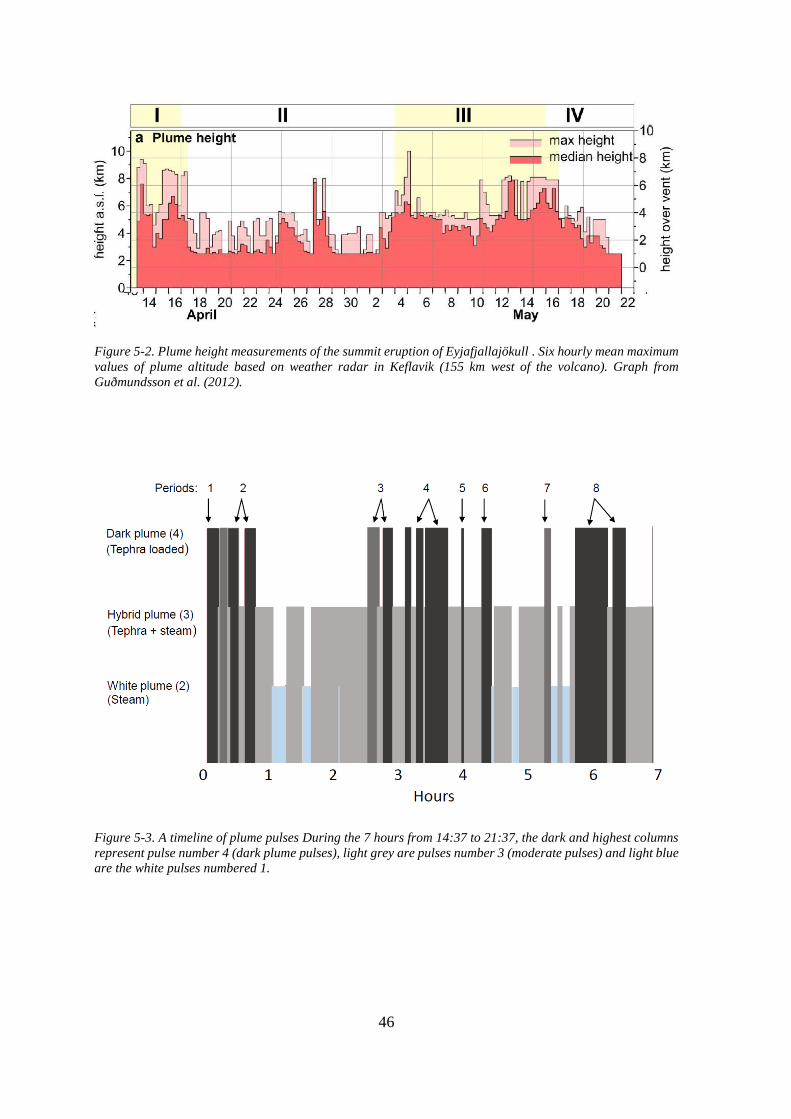
46
Figure 5-2. Plume height measurements of the summit eruption of Eyjafjallajökull . Six hourly mean maximum
values of plume altitude based on weather radar in Keflavik (155 km west of the volcano). Graph from
Guðmundsson et al. (2012).
Figure 5-3. A timeline of plume pulses During the 7 hours from 14:37 to 21:37, the dark and highest columns
represent pulse number 4 (dark plume pulses), light grey are pulses number 3 (moderate pulses) and light blue
are the white pulses numbered 1.
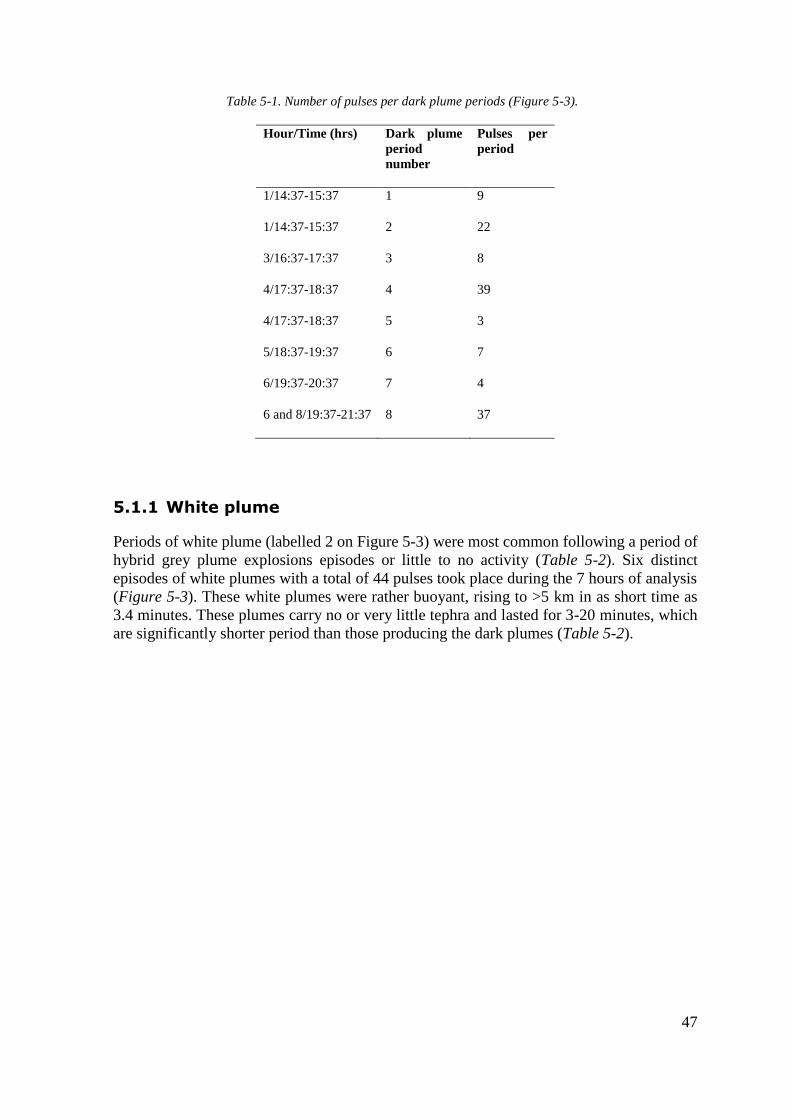
47
Table 5-1. Number of pulses per dark plume periods (Figure 5-3).
Hour/Time (hrs) Dark plume
period
number
Pulses per
period
1/14:37-15:37 1 9
1/14:37-15:37 2 22
3/16:37-17:37 3 8
4/17:37-18:37 4 39
4/17:37-18:37 5 3
5/18:37-19:37 6 7
6/19:37-20:37 7 4
6 and 8/19:37-21:37 8 37
5.1.1 White plume
Periods of white plume (labelled 2 on Figure 5-3) were most common following a period of
hybrid grey plume explosions episodes or little to no activity (Table 5-2). Six distinct
episodes of white plumes with a total of 44 pulses took place during the 7 hours of analysis
(Figure 5-3). These white plumes were rather buoyant, rising to >5 km in as short time as
3.4 minutes. These plumes carry no or very little tephra and lasted for 3-20 minutes, which
are significantly shorter period than those producing the dark plumes (Table 5-2).
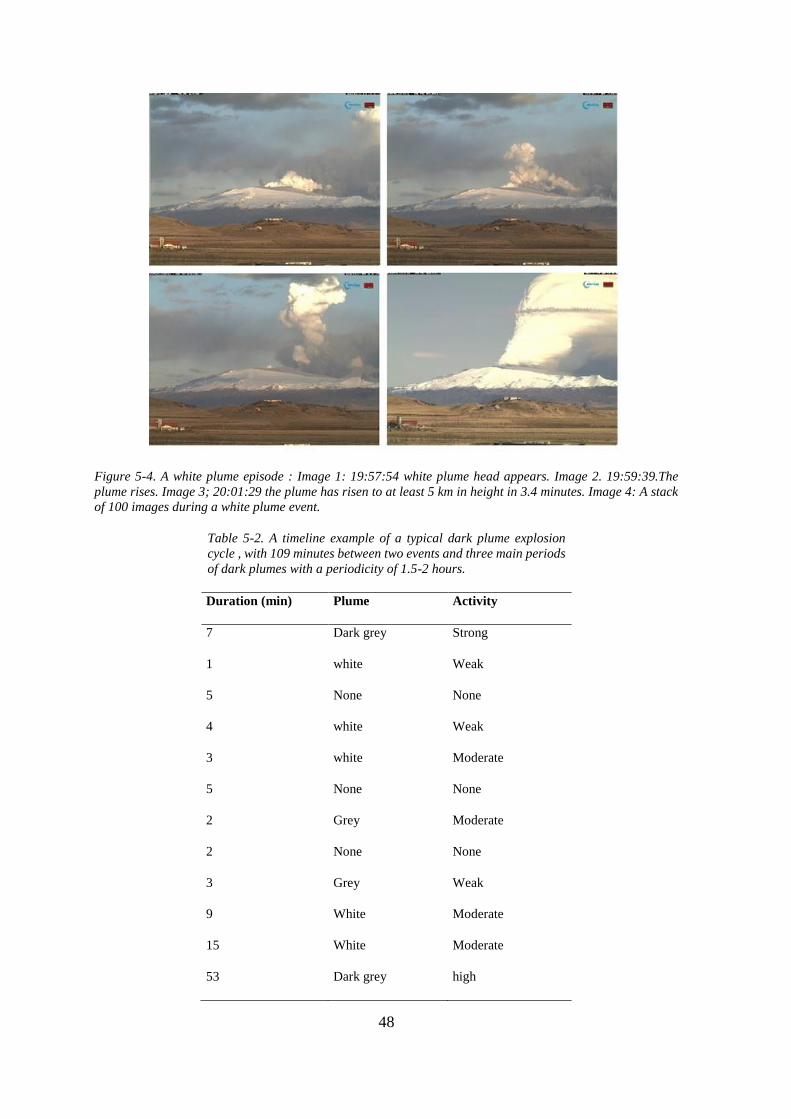
48
Figure 5-4. A white plume episode : Image 1: 19:57:54 white plume head appears. Image 2. 19:59:39.The
plume rises. Image 3; 20:01:29 the plume has risen to at least 5 km in height in 3.4 minutes. Image 4: A stack
of 100 images during a white plume event.
Table 5-2. A timeline example of a typical dark plume explosion
cycle , with 109 minutes between two events and three main periods
of dark plumes with a periodicity of 1.5-2 hours.
Duration (min) Plume Activity
7 Dark grey Strong
1 white Weak
5 None None
4 white Weak
3 white Moderate
5 None None
2 Grey Moderate
2 None None
3 Grey Weak
9 White Moderate
15 White Moderate
53 Dark grey high
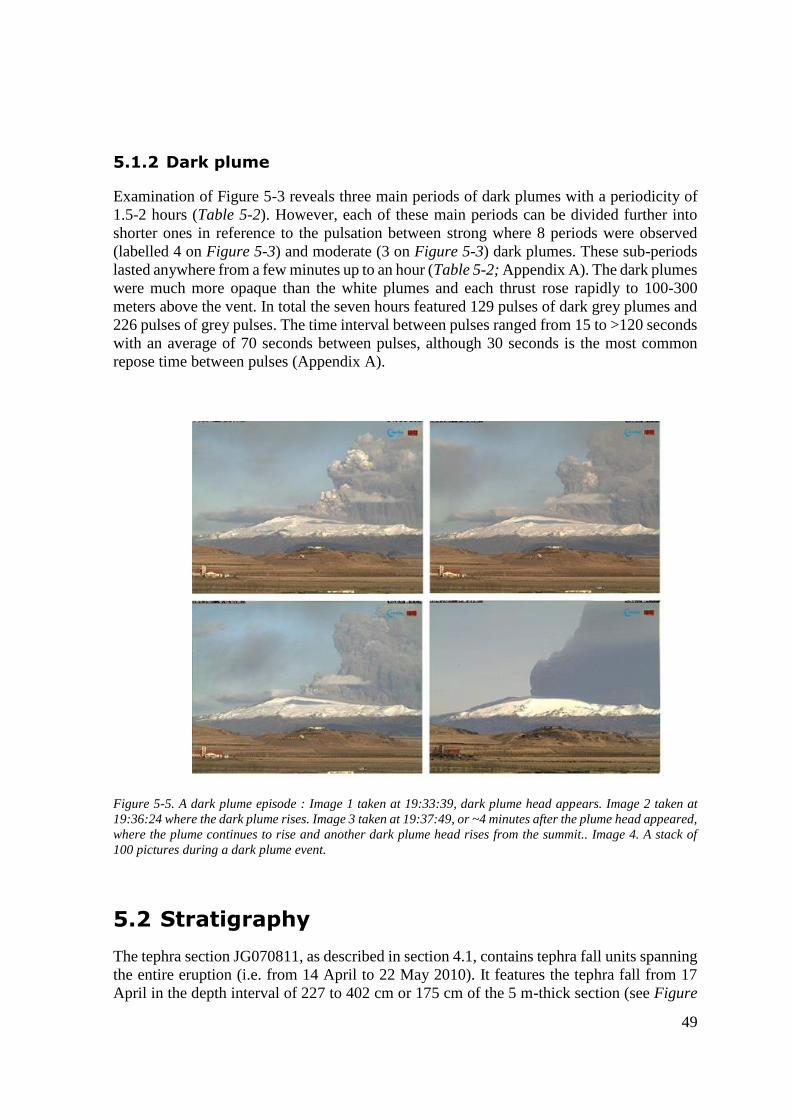
49
5.1.2 Dark plume
Examination of Figure 5-3 reveals three main periods of dark plumes with a periodicity of
1.5-2 hours (Table 5-2). However, each of these main periods can be divided further into
shorter ones in reference to the pulsation between strong where 8 periods were observed
(labelled 4 on Figure 5-3) and moderate (3 on Figure 5-3) dark plumes. These sub-periods
lasted anywhere from a few minutes up to an hour (Table 5-2; Appendix A). The dark plumes
were much more opaque than the white plumes and each thrust rose rapidly to 100-300
meters above the vent. In total the seven hours featured 129 pulses of dark grey plumes and
226 pulses of grey pulses. The time interval between pulses ranged from 15 to >120 seconds
with an average of 70 seconds between pulses, although 30 seconds is the most common
repose time between pulses (Appendix A).
Figure 5-5. A dark plume episode : Image 1 taken at 19:33:39, dark plume head appears. Image 2 taken at
19:36:24 where the dark plume rises. Image 3 taken at 19:37:49, or ~4 minutes after the plume head appeared,
where the plume continues to rise and another dark plume head rises from the summit.. Image 4. A stack of
100 pictures during a dark plume event.
5.2 Stratigraphy
The tephra section JG070811, as described in section 4.1, contains tephra fall units spanning
the entire eruption (i.e. from 14 April to 22 May 2010). It features the tephra fall from 17
April in the depth interval of 227 to 402 cm or 175 cm of the 5 m-thick section (see Figure

50
4-2). A more detailed stratigraphic column of the tephra fall sequence from 17 April is
presented in Figure 5-6.
The units mostly consist of either fine ash layers or pumice lapilli layers with limited ash.
Each layer was interpreted by length and the governing grainsize. Six thick and 11 thinner
lapilli layers clearly stuck out in appearance and are generally thicker than the finer ash
layers, ranging from ~5-12 cm in thickness compared to ~0.5-4 cm but the ash particles are
compact and pack better than the lapilli clasts. This internal stratigraphy between pumice
lapilli layers and fine ash layers suggest phases of pulsating explosive activity. Each of these
sets of lapilli and ash layers may then represent a distinct eruption phase that may perhaps
be correlated with the plume behaviour observations in the next chapter. The stratigraphic
column represents the order of erupted material, with the first erupted material being found
at the bottom of the column and last erupted at the top.
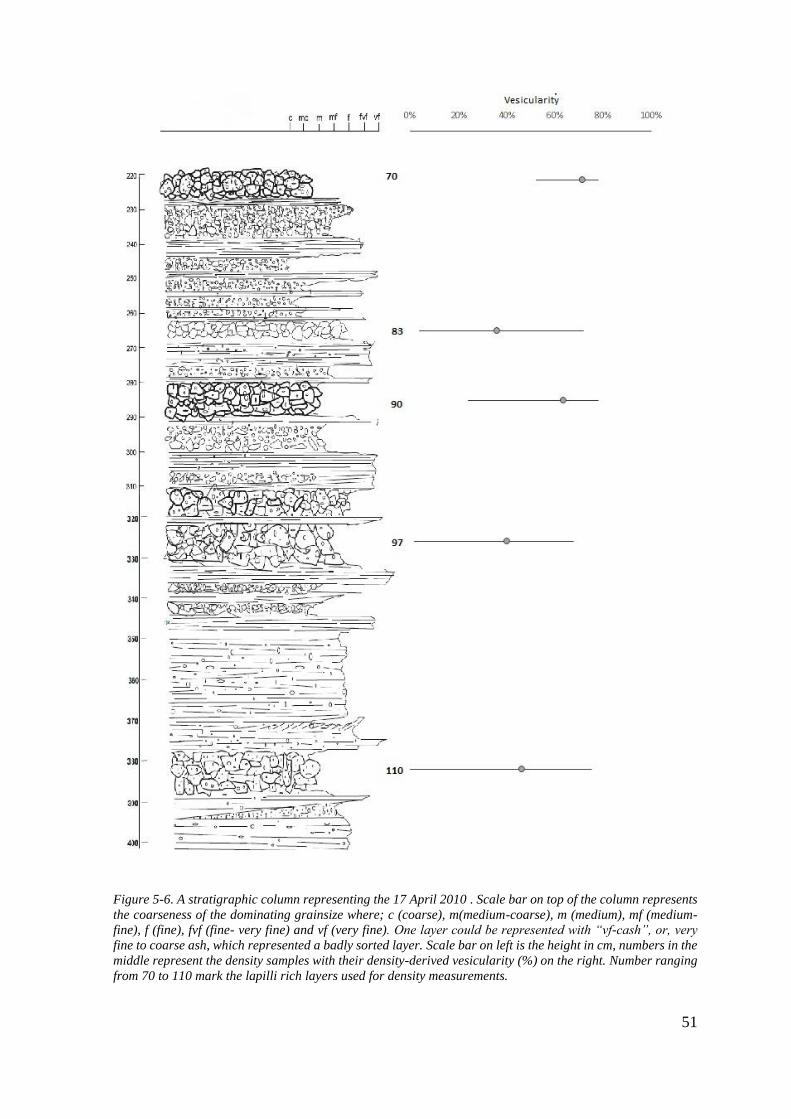
51
Figure 5-6. A stratigraphic column representing the 17 April 2010 . Scale bar on top of the column represents
the coarseness of the dominating grainsize where; c (coarse), m(medium-coarse), m (medium), mf (medium-
fine), f (fine), fvf (fine- very fine) and vf (very fine). One layer could be represented with “vf-cash”, or, very
fine to coarse ash, which represented a badly sorted layer. Scale bar on left is the height in cm, numbers in the
middle represent the density samples with their density-derived vesicularity (%) on the right. Number ranging
from 70 to 110 mark the lapilli rich layers used for density measurements.
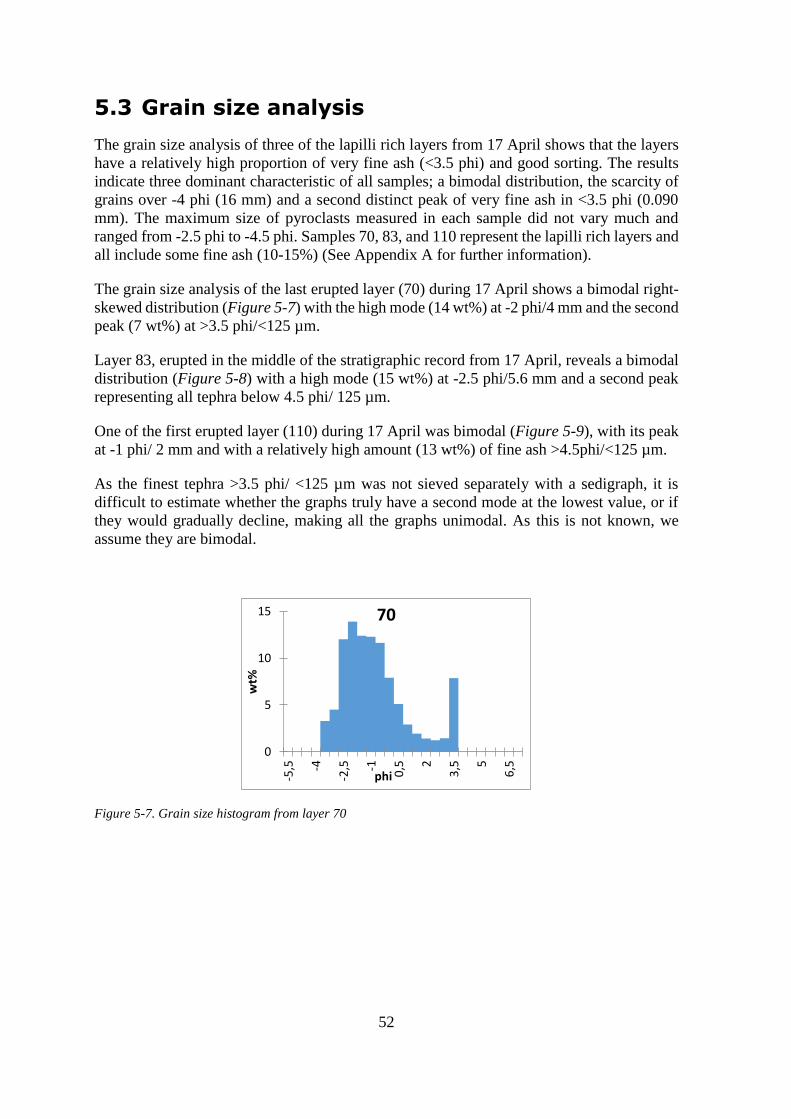
52
5.3 Grain size analysis
The grain size analysis of three of the lapilli rich layers from 17 April shows that the layers
have a relatively high proportion of very fine ash (<3.5 phi) and good sorting. The results
indicate three dominant characteristic of all samples; a bimodal distribution, the scarcity of
grains over -4 phi (16 mm) and a second distinct peak of very fine ash in <3.5 phi (0.090
mm). The maximum size of pyroclasts measured in each sample did not vary much and
ranged from -2.5 phi to -4.5 phi. Samples 70, 83, and 110 represent the lapilli rich layers and
all include some fine ash (10-15%) (See Appendix A for further information).
The grain size analysis of the last erupted layer (70) during 17 April shows a bimodal right-
skewed distribution (Figure 5-7) with the high mode (14 wt%) at -2 phi/4 mm and the second
peak (7 wt%) at >3.5 phi/<125 µm.
Layer 83, erupted in the middle of the stratigraphic record from 17 April, reveals a bimodal
distribution (Figure 5-8) with a high mode (15 wt%) at -2.5 phi/5.6 mm and a second peak
representing all tephra below 4.5 phi/ 125 µm.
One of the first erupted layer (110) during 17 April was bimodal (Figure 5-9), with its peak
at -1 phi/ 2 mm and with a relatively high amount (13 wt%) of fine ash >4.5phi/<125 µm.
As the finest tephra >3.5 phi/ <125 µm was not sieved separately with a sedigraph, it is
difficult to estimate whether the graphs truly have a second mode at the lowest value, or if
they would gradually decline, making all the graphs unimodal. As this is not known, we
assume they are bimodal.
Figure 5-7. Grain size histogram from layer 70
0
5
10
15
-5,5 -4
-2,5 -1 0,5 2
3,5 5
6,5
wt%
phi
70
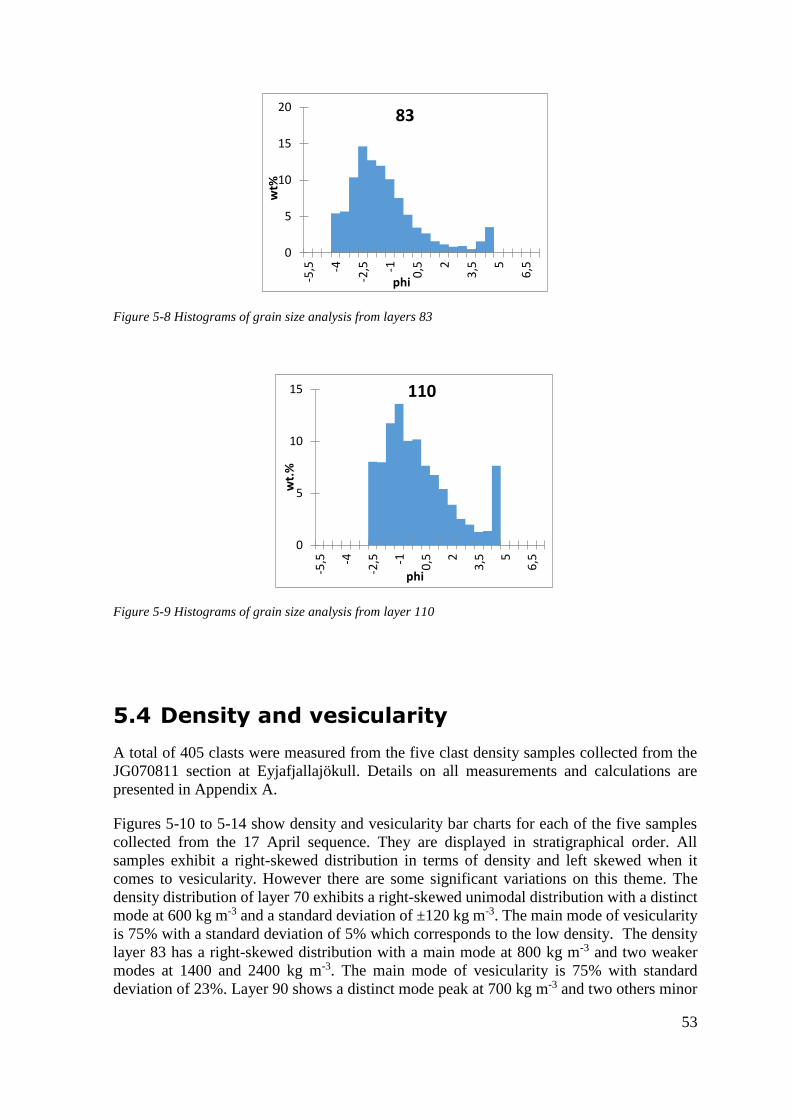
53
Figure 5-8 Histograms of grain size analysis from layers 83
Figure 5-9 Histograms of grain size analysis from layer 110
5.4 Density and vesicularity
A total of 405 clasts were measured from the five clast density samples collected from the
JG070811 section at Eyjafjallajökull. Details on all measurements and calculations are
presented in Appendix A.
Figures 5-10 to 5-14 show density and vesicularity bar charts for each of the five samples
collected from the 17 April sequence. They are displayed in stratigraphical order. All
samples exhibit a right-skewed distribution in terms of density and left skewed when it
comes to vesicularity. However there are some significant variations on this theme. The
density distribution of layer 70 exhibits a right-skewed unimodal distribution with a distinct
mode at 600 kg m-3 and a standard deviation of ±120 kg m-3. The main mode of vesicularity
is 75% with a standard deviation of 5% which corresponds to the low density. The density
layer 83 has a right-skewed distribution with a main mode at 800 kg m-3 and two weaker
modes at 1400 and 2400 kg m-3. The main mode of vesicularity is 75% with standard
deviation of 23%. Layer 90 shows a distinct mode peak at 700 kg m-3 and two others minor
0
5
10
15
20
-5,5 -4
-2,5 -1 0,5 2
3,5 5
6,5
wt%
phi
83
0
5
10
15
-5,5 -4
-2,5 -1 0,5 2
3,5 5
6,5
wt.
%
phi
110

54
peaks at 1500 kg m-3 and 1800 kg m-3 with no measured density values between 1100 kg m-
3 and 1450 kg m-3. Vesicularities range from ~24% to 78% with a main mode at 75% and a
standard deviation of 15%. Layer 97 has a total of 4 modes with a minor peak (1000 kg m-3)
following the first one at 800 kg m-3, another distinct peak at 1800 kg m-3 and a minor one
following at 2150 kg m-3. The vesicularities follow the density trend with 4 modes at 20%,
35%, 50% and 75% and a standard deviation of 21%. These three layers had an average of
~70 clasts measured, with layer 83 including only 44 clasts. Layer 110 shows a bimodal
right-skewed distribution where modes peak at 800 kg m-3and 2100 kg m-3, although minor
peaks are visible at 1900 kg m-3 and 2300 kg m-3. The standard deviation of layer 110 is 580
kg m-3 and vesicularity modes peak at 10 %, 20%, 35% and 75% with a standard deviation
of 23% (Table 5-3).
Table 5-3 Density- and vesiculariy means and ranges of all samples measured.* Standard deviation.
Layer Number of
clasts
Density mean
and *std (kg m-
3)
Density range
(kg m-3)
Vesicularity
mean and *std
(%)
Vesicularity
range (%)
70 100 700 ±120 530-1370 71 ±5 45-79
83 44 1050 ±570 610-2320 44 ±23 6-76
90 85 800 ±370 530-1960 63 ±15 21-79
97 78 1370 ±520 580-2400 35 ±21 7-77
110 88 1110 ±580 550-2330 50 ±23 8-78
Figure 5-10. Density and Vesicularity of layer 70

55
Figure 5-11. Density and vesicularity of layer 83
Figure 5-12. Density and vesicularity of layer 90
Figure 5-13. Density and vesicularity of layer 97
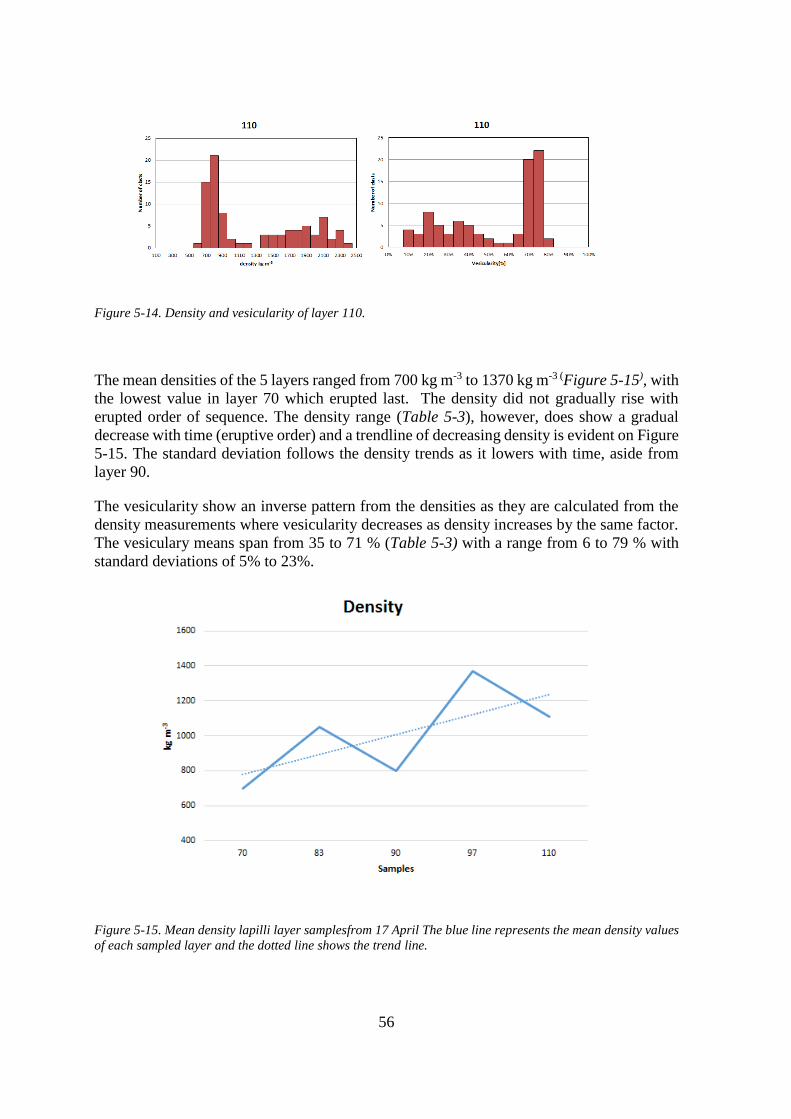
56
Figure 5-14. Density and vesicularity of layer 110.
The mean densities of the 5 layers ranged from 700 kg m-3 to 1370 kg m-3 (Figure 5-15), with
the lowest value in layer 70 which erupted last. The density did not gradually rise with
erupted order of sequence. The density range (Table 5-3), however, does show a gradual
decrease with time (eruptive order) and a trendline of decreasing density is evident on Figure
5-15. The standard deviation follows the density trends as it lowers with time, aside from
layer 90.
The vesicularity show an inverse pattern from the densities as they are calculated from the
density measurements where vesicularity decreases as density increases by the same factor.
The vesiculary means span from 35 to 71 % (Table 5-3) with a range from 6 to 79 % with
standard deviations of 5% to 23%.
Figure 5-15. Mean density lapilli layer samplesfrom 17 April The blue line represents the mean density values
of each sampled layer and the dotted line shows the trend line.
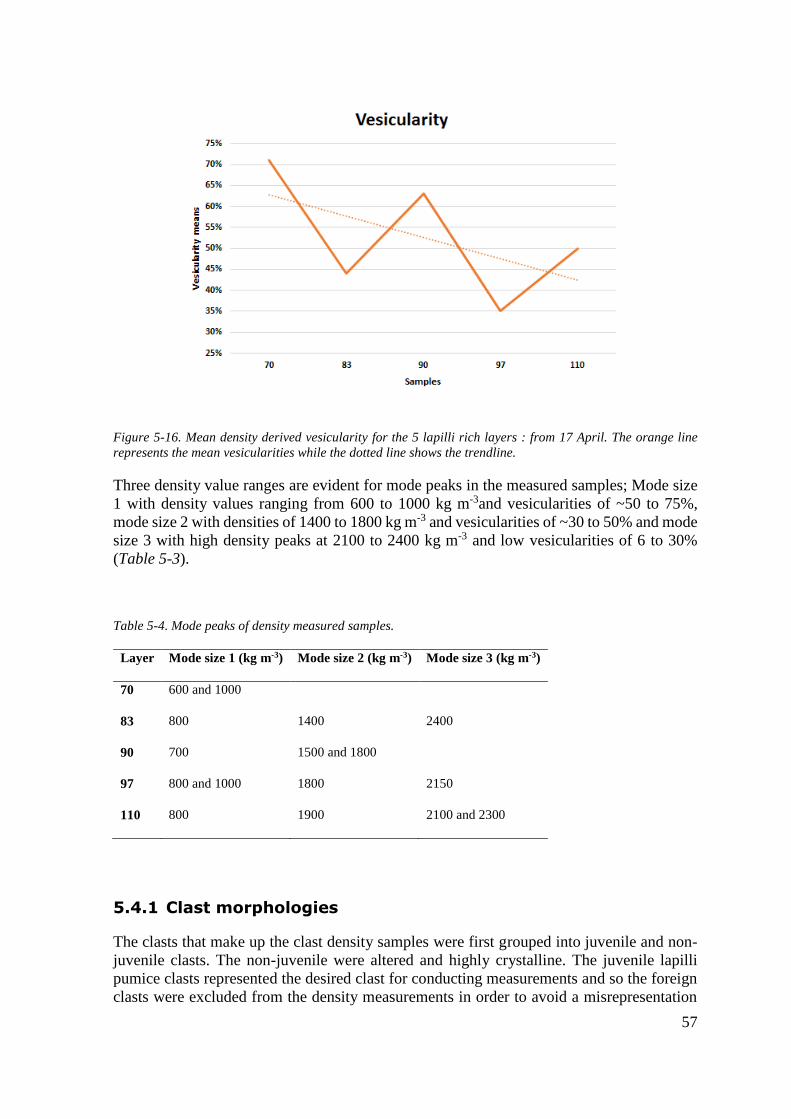
57
Figure 5-16. Mean density derived vesicularity for the 5 lapilli rich layers : from 17 April. The orange line
represents the mean vesicularities while the dotted line shows the trendline.
Three density value ranges are evident for mode peaks in the measured samples; Mode size
1 with density values ranging from 600 to 1000 kg m-3and vesicularities of ~50 to 75%,
mode size 2 with densities of 1400 to 1800 kg m-3 and vesicularities of ~30 to 50% and mode
size 3 with high density peaks at 2100 to 2400 kg m-3 and low vesicularities of 6 to 30%
(Table 5-3).
Table 5-4. Mode peaks of density measured samples.
Layer Mode size 1 (kg m-3) Mode size 2 (kg m-3) Mode size 3 (kg m-3)
70 600 and 1000
83 800 1400 2400
90 700 1500 and 1800
97 800 and 1000 1800 2150
110 800 1900 2100 and 2300
5.4.1 Clast morphologies
The clasts that make up the clast density samples were first grouped into juvenile and non-
juvenile clasts. The non-juvenile were altered and highly crystalline. The juvenile lapilli
pumice clasts represented the desired clast for conducting measurements and so the foreign
clasts were excluded from the density measurements in order to avoid a misrepresentation

58
of the mean values. The juvenile clasts are further divided into highly vesicular (= pumice)
clasts, medium vesicular (scoria) and dense juvenile lithics. The pumices are ragged, fragile
and brown-greyish in colour (Figure 5-17) and as shown in the previous section
characterized considerably lower in density than the juvenile lithics. The juvenile lithics are
less vesiculated and light-brown-greyish in colour (Figure 5-18).
Layer 70, the only one that contained 100 clasts, has a relatively uniform clast population in
terms of colour and shape. It also features the tightest density and vesicularity distributions
and is predominantly made up of pumice clasts (Figure 5-10). The other four layers included
some juvenile lithics which is evident in the density and vesicularity graphs (Figure 5-11 to
Figure 5-14).
Clast 7 (Figure 5-17a) represented the mean mode of densities from layer 7 and displayed
larger bubbles than clast 8 (Figure 5-17b), which was later confirmed with image analysis
(chapter 5.5). Clast 43 and 54 (Figure 5-18) have vesicularities of 30 to 40% and represent
a lower vesiculated lapillis and lithics. Non-juvenile lithics and foreign clasts with limited
or no vesicularity (Figure 5-19) made their way into the sample bulk, however they were
removed from the results and play no further role in this thesis.
Figure 5-17. The two clasts chosen for image analysis from layer 97 . a) Represents the mean mode of density
of clast 7 (790 kg m-3) with vesicularity of 68%. b) Represents a low mode of density of clast 8 (990 kg m-3) and
vesicularity of 60%
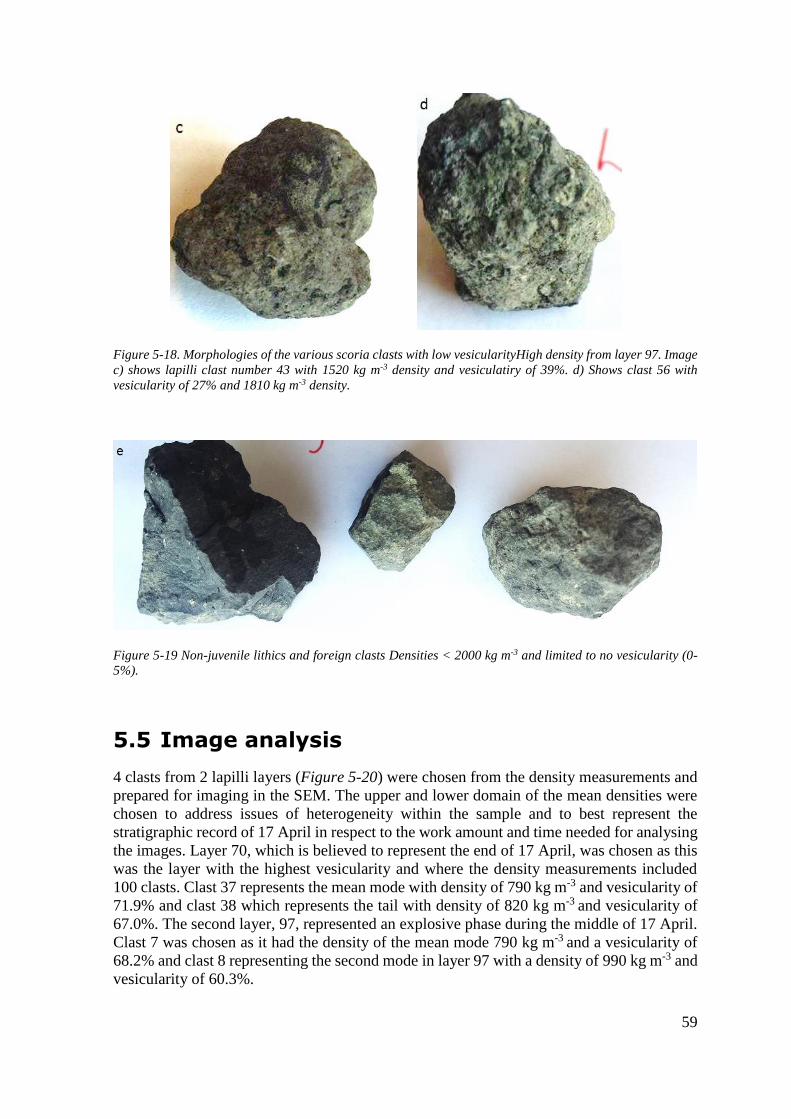
59
Figure 5-18. Morphologies of the various scoria clasts with low vesicularityHigh density from layer 97. Image
c) shows lapilli clast number 43 with 1520 kg m-3 density and vesiculatiry of 39%. d) Shows clast 56 with
vesicularity of 27% and 1810 kg m-3 density.
Figure 5-19 Non-juvenile lithics and foreign clasts Densities < 2000 kg m-3 and limited to no vesicularity (0-
5%).
5.5 Image analysis
4 clasts from 2 lapilli layers (Figure 5-20) were chosen from the density measurements and
prepared for imaging in the SEM. The upper and lower domain of the mean densities were
chosen to address issues of heterogeneity within the sample and to best represent the
stratigraphic record of 17 April in respect to the work amount and time needed for analysing
the images. Layer 70, which is believed to represent the end of 17 April, was chosen as this
was the layer with the highest vesicularity and where the density measurements included
100 clasts. Clast 37 represents the mean mode with density of 790 kg m-3 and vesicularity of
71.9% and clast 38 which represents the tail with density of 820 kg m-3 and vesicularity of
67.0%. The second layer, 97, represented an explosive phase during the middle of 17 April.
Clast 7 was chosen as it had the density of the mean mode 790 kg m-3 and a vesicularity of
68.2% and clast 8 representing the second mode in layer 97 with a density of 990 kg m-3 and
vesicularity of 60.3%.
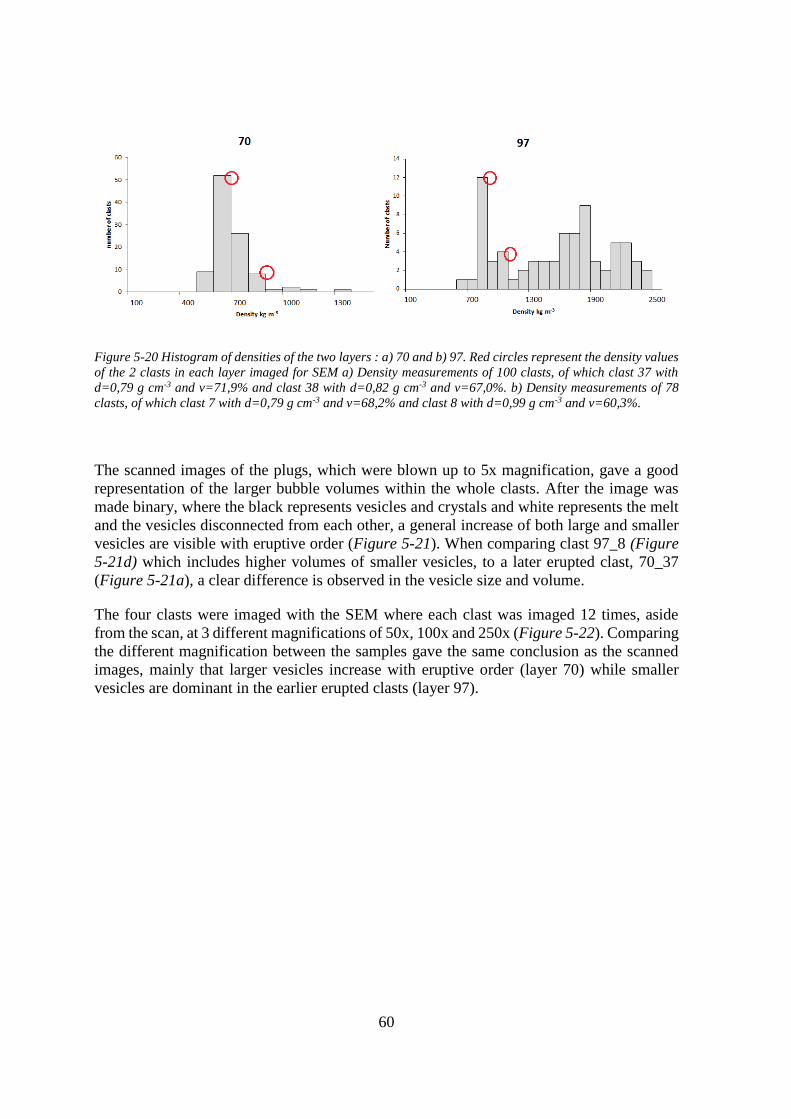
60
Figure 5-20 Histogram of densities of the two layers : a) 70 and b) 97. Red circles represent the density values
of the 2 clasts in each layer imaged for SEM a) Density measurements of 100 clasts, of which clast 37 with
d=0,79 g cm-3 and v=71,9% and clast 38 with d=0,82 g cm-3 and v=67,0%. b) Density measurements of 78
clasts, of which clast 7 with d=0,79 g cm-3 and v=68,2% and clast 8 with d=0,99 g cm-3 and v=60,3%.
The scanned images of the plugs, which were blown up to 5x magnification, gave a good
representation of the larger bubble volumes within the whole clasts. After the image was
made binary, where the black represents vesicles and crystals and white represents the melt
and the vesicles disconnected from each other, a general increase of both large and smaller
vesicles are visible with eruptive order (Figure 5-21). When comparing clast 97_8 (Figure
5-21d) which includes higher volumes of smaller vesicles, to a later erupted clast, 70_37
(Figure 5-21a), a clear difference is observed in the vesicle size and volume.
The four clasts were imaged with the SEM where each clast was imaged 12 times, aside
from the scan, at 3 different magnifications of 50x, 100x and 250x (Figure 5-22). Comparing
the different magnification between the samples gave the same conclusion as the scanned
images, mainly that larger vesicles increase with eruptive order (layer 70) while smaller
vesicles are dominant in the earlier erupted clasts (layer 97).
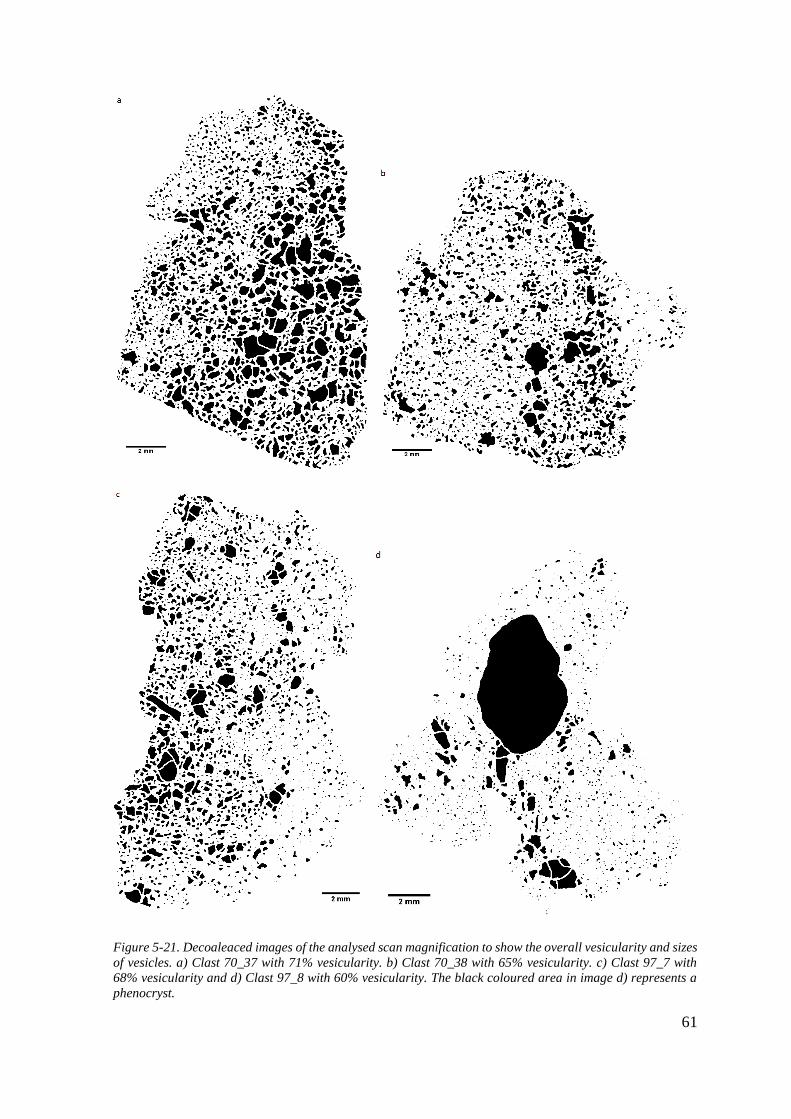
61
Figure 5-21. Decoaleaced images of the analysed scan magnification to show the overall vesicularity and sizes
of vesicles. a) Clast 70_37 with 71% vesicularity. b) Clast 70_38 with 65% vesicularity. c) Clast 97_7 with
68% vesicularity and d) Clast 97_8 with 60% vesicularity. The black coloured area in image d) represents a
phenocryst.
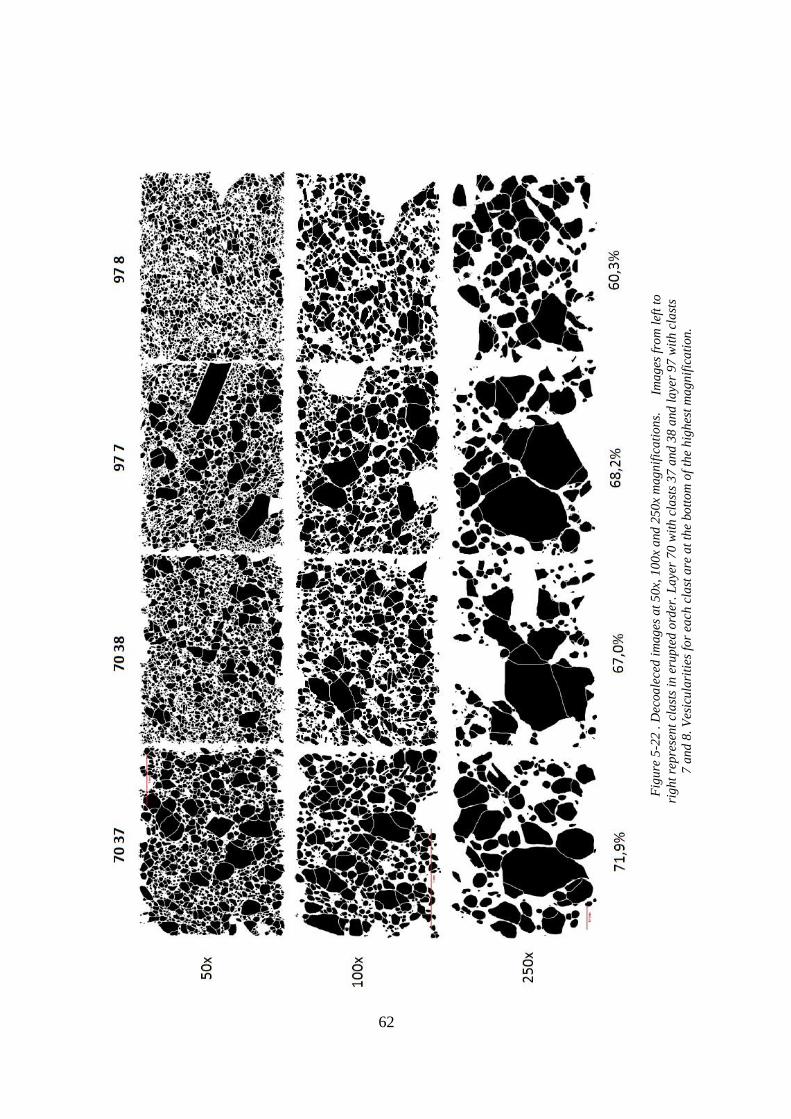
62
Fig
ure
5-2
2 .
Dec
oa
lece
d i
mag
es a
t 5
0x,
10
0x
and
250
x m
ag
nif
ica
tio
ns.
Im
ag
es f
rom
lef
t to
rig
ht
rep
rese
nt
cla
sts
in e
rup
ted
ord
er.
La
yer
70
wit
h c
last
s 3
7 a
nd
38
and
la
yer
97
wit
h c
last
s
7 a
nd 8
. V
esic
ula
riti
es f
or
each
cla
st a
re a
t th
e bo
tto
m o
f th
e h
igh
est
ma
gn
ific
ati
on
.
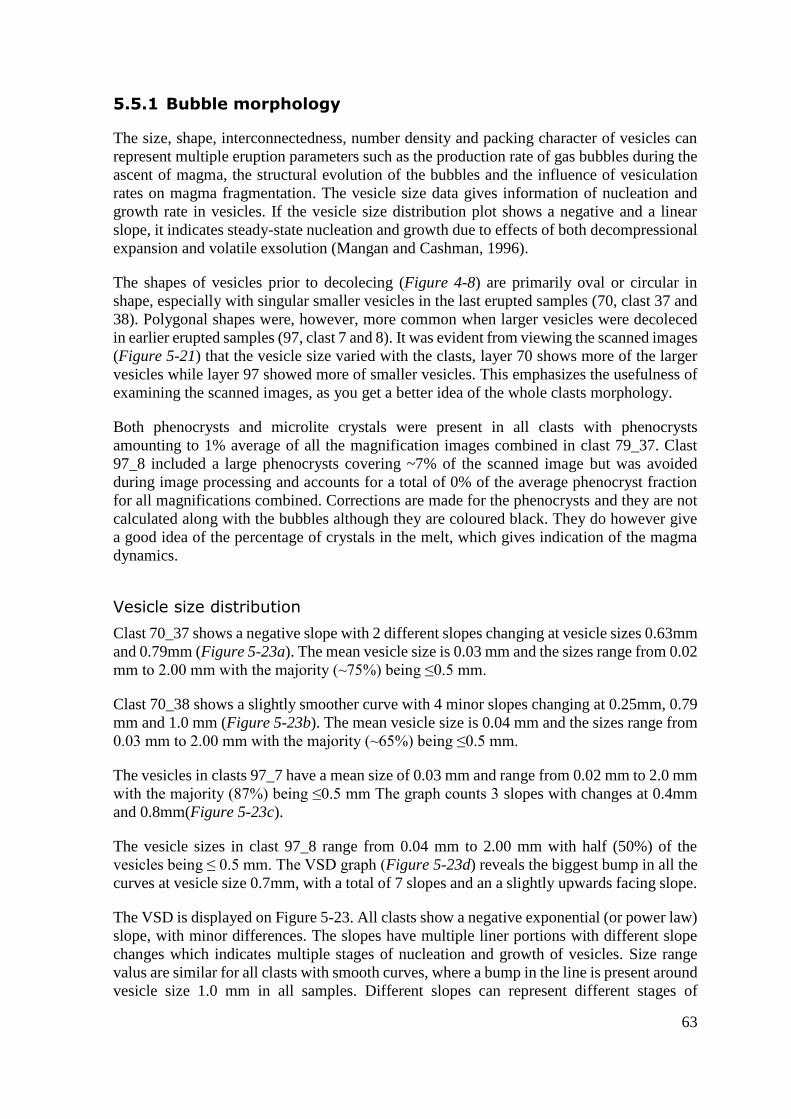
63
5.5.1 Bubble morphology
The size, shape, interconnectedness, number density and packing character of vesicles can
represent multiple eruption parameters such as the production rate of gas bubbles during the
ascent of magma, the structural evolution of the bubbles and the influence of vesiculation
rates on magma fragmentation. The vesicle size data gives information of nucleation and
growth rate in vesicles. If the vesicle size distribution plot shows a negative and a linear
slope, it indicates steady-state nucleation and growth due to effects of both decompressional
expansion and volatile exsolution (Mangan and Cashman, 1996).
The shapes of vesicles prior to decolecing (Figure 4-8) are primarily oval or circular in
shape, especially with singular smaller vesicles in the last erupted samples (70, clast 37 and
38). Polygonal shapes were, however, more common when larger vesicles were decoleced
in earlier erupted samples (97, clast 7 and 8). It was evident from viewing the scanned images
(Figure 5-21) that the vesicle size varied with the clasts, layer 70 shows more of the larger
vesicles while layer 97 showed more of smaller vesicles. This emphasizes the usefulness of
examining the scanned images, as you get a better idea of the whole clasts morphology.
Both phenocrysts and microlite crystals were present in all clasts with phenocrysts
amounting to 1% average of all the magnification images combined in clast 79_37. Clast
97_8 included a large phenocrysts covering ~7% of the scanned image but was avoided
during image processing and accounts for a total of 0% of the average phenocryst fraction
for all magnifications combined. Corrections are made for the phenocrysts and they are not
calculated along with the bubbles although they are coloured black. They do however give
a good idea of the percentage of crystals in the melt, which gives indication of the magma
dynamics.
Vesicle size distribution
Clast 70_37 shows a negative slope with 2 different slopes changing at vesicle sizes 0.63mm
and 0.79mm (Figure 5-23a). The mean vesicle size is 0.03 mm and the sizes range from 0.02
mm to 2.00 mm with the majority (~75%) being ≤0.5 mm.
Clast 70_38 shows a slightly smoother curve with 4 minor slopes changing at 0.25mm, 0.79
mm and 1.0 mm (Figure 5-23b). The mean vesicle size is 0.04 mm and the sizes range from
0.03 mm to 2.00 mm with the majority (~65%) being ≤0.5 mm.
The vesicles in clasts 97_7 have a mean size of 0.03 mm and range from 0.02 mm to 2.0 mm
with the majority (87%) being ≤0.5 mm The graph counts 3 slopes with changes at 0.4mm
and 0.8mm(Figure 5-23c).
The vesicle sizes in clast 97_8 range from 0.04 mm to 2.00 mm with half (50%) of the
vesicles being ≤ 0.5 mm. The VSD graph (Figure 5-23d) reveals the biggest bump in all the
curves at vesicle size 0.7mm, with a total of 7 slopes and an a slightly upwards facing slope.
The VSD is displayed on Figure 5-23. All clasts show a negative exponential (or power law)
slope, with minor differences. The slopes have multiple liner portions with different slope
changes which indicates multiple stages of nucleation and growth of vesicles. Size range
valus are similar for all clasts with smooth curves, where a bump in the line is present around
vesicle size 1.0 mm in all samples. Different slopes can represent different stages of
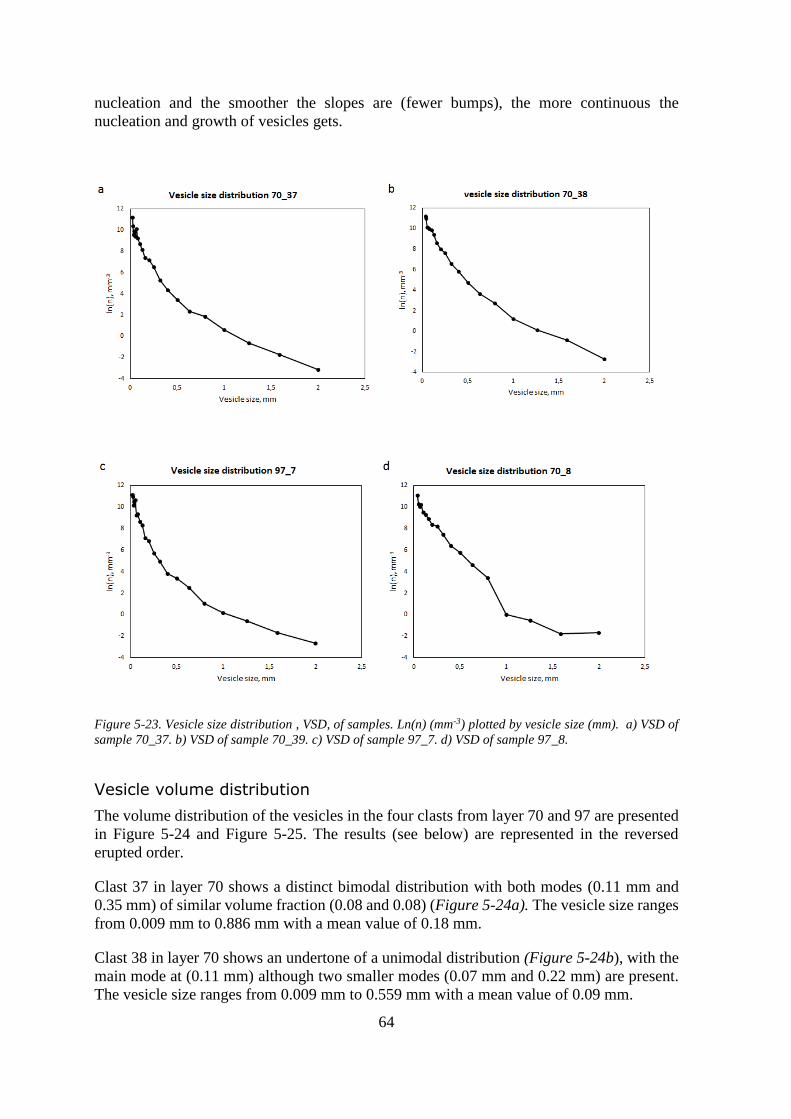
64
nucleation and the smoother the slopes are (fewer bumps), the more continuous the
nucleation and growth of vesicles gets.
Figure 5-23. Vesicle size distribution , VSD, of samples. Ln(n) (mm-3) plotted by vesicle size (mm). a) VSD of
sample 70_37. b) VSD of sample 70_39. c) VSD of sample 97_7. d) VSD of sample 97_8.
Vesicle volume distribution
The volume distribution of the vesicles in the four clasts from layer 70 and 97 are presented
in Figure 5-24 and Figure 5-25. The results (see below) are represented in the reversed
erupted order.
Clast 37 in layer 70 shows a distinct bimodal distribution with both modes (0.11 mm and
0.35 mm) of similar volume fraction (0.08 and 0.08) (Figure 5-24a). The vesicle size ranges
from 0.009 mm to 0.886 mm with a mean value of 0.18 mm.
Clast 38 in layer 70 shows an undertone of a unimodal distribution (Figure 5-24b), with the
main mode at (0.11 mm) although two smaller modes (0.07 mm and 0.22 mm) are present.
The vesicle size ranges from 0.009 mm to 0.559 mm with a mean value of 0.09 mm.
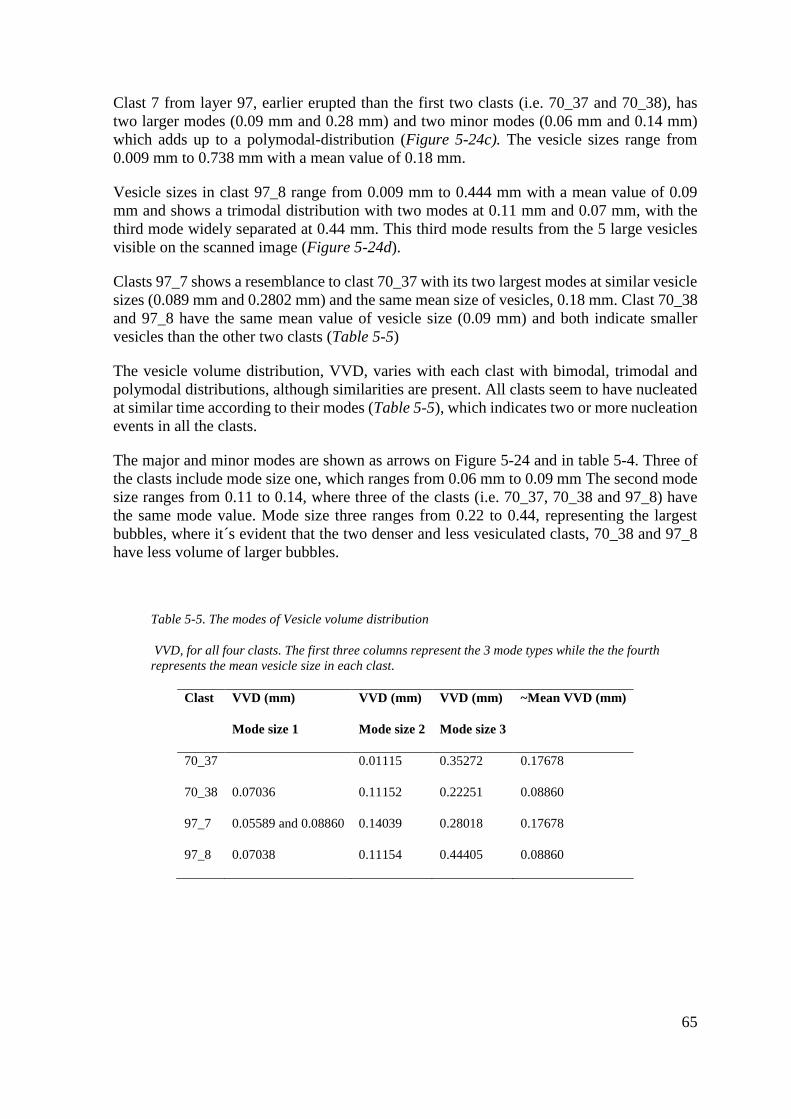
65
Clast 7 from layer 97, earlier erupted than the first two clasts (i.e. 70_37 and 70_38), has
two larger modes (0.09 mm and 0.28 mm) and two minor modes (0.06 mm and 0.14 mm)
which adds up to a polymodal-distribution (Figure 5-24c). The vesicle sizes range from
0.009 mm to 0.738 mm with a mean value of 0.18 mm.
Vesicle sizes in clast 97_8 range from 0.009 mm to 0.444 mm with a mean value of 0.09
mm and shows a trimodal distribution with two modes at 0.11 mm and 0.07 mm, with the
third mode widely separated at 0.44 mm. This third mode results from the 5 large vesicles
visible on the scanned image (Figure 5-24d).
Clasts 97_7 shows a resemblance to clast 70_37 with its two largest modes at similar vesicle
sizes (0.089 mm and 0.2802 mm) and the same mean size of vesicles, 0.18 mm. Clast 70_38
and 97_8 have the same mean value of vesicle size (0.09 mm) and both indicate smaller
vesicles than the other two clasts (Table 5-5)
The vesicle volume distribution, VVD, varies with each clast with bimodal, trimodal and
polymodal distributions, although similarities are present. All clasts seem to have nucleated
at similar time according to their modes (Table 5-5), which indicates two or more nucleation
events in all the clasts.
The major and minor modes are shown as arrows on Figure 5-24 and in table 5-4. Three of
the clasts include mode size one, which ranges from 0.06 mm to 0.09 mm The second mode
size ranges from 0.11 to 0.14, where three of the clasts (i.e. 70_37, 70_38 and 97_8) have
the same mode value. Mode size three ranges from 0.22 to 0.44, representing the largest
bubbles, where it´s evident that the two denser and less vesiculated clasts, 70_38 and 97_8
have less volume of larger bubbles.
Table 5-5. The modes of Vesicle volume distribution
VVD, for all four clasts. The first three columns represent the 3 mode types while the the fourth
represents the mean vesicle size in each clast.
Clast VVD (mm)
Mode size 1
VVD (mm)
Mode size 2
VVD (mm)
Mode size 3
~Mean VVD (mm)
70_37 0.01115 0.35272 0.17678
70_38 0.07036 0.11152 0.22251 0.08860
97_7 0.05589 and 0.08860 0.14039 0.28018 0.17678
97_8 0.07038 0.11154 0.44405 0.08860
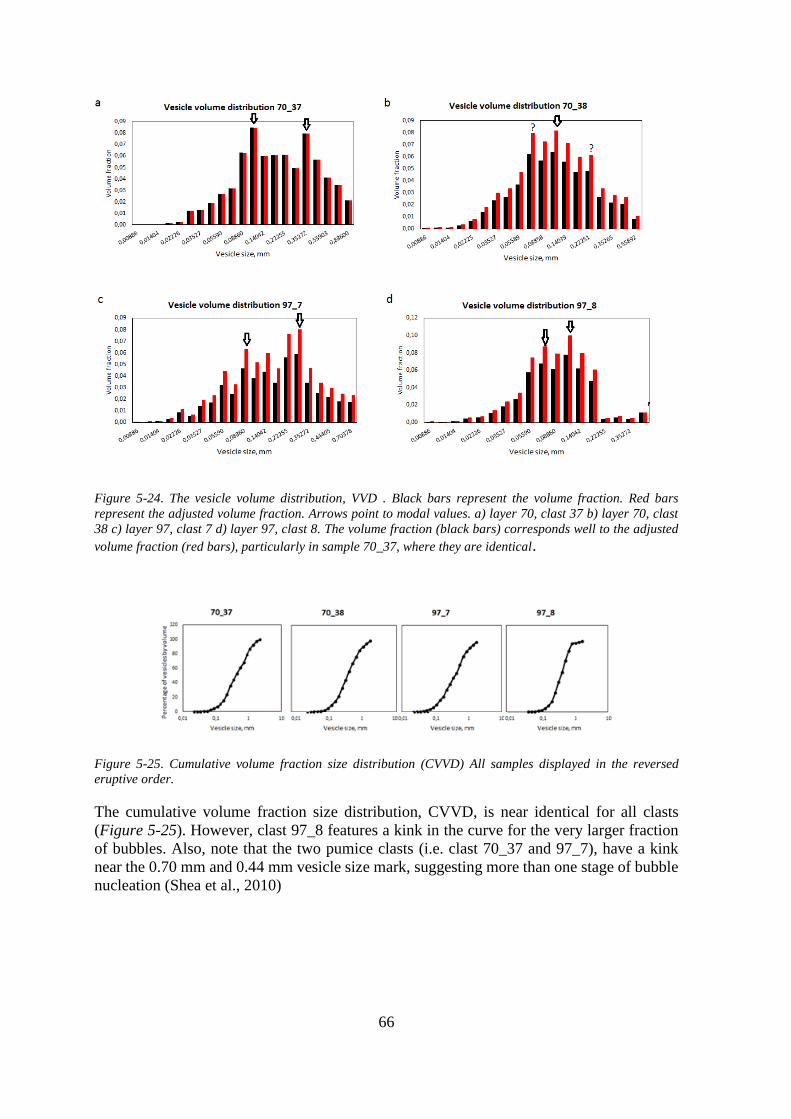
66
Figure 5-24. The vesicle volume distribution, VVD . Black bars represent the volume fraction. Red bars
represent the adjusted volume fraction. Arrows point to modal values. a) layer 70, clast 37 b) layer 70, clast
38 c) layer 97, clast 7 d) layer 97, clast 8. The volume fraction (black bars) corresponds well to the adjusted
volume fraction (red bars), particularly in sample 70_37, where they are identical.
Figure 5-25. Cumulative volume fraction size distribution (CVVD) All samples displayed in the reversed
eruptive order.
The cumulative volume fraction size distribution, CVVD, is near identical for all clasts
(Figure 5-25). However, clast 97_8 features a kink in the curve for the very larger fraction
of bubbles. Also, note that the two pumice clasts (i.e. clast 70_37 and 97_7), have a kink
near the 0.70 mm and 0.44 mm vesicle size mark, suggesting more than one stage of bubble
nucleation (Shea et al., 2010)
67
Final results of image analysis
Clast 37, which represented the mean density derived vesicularity of layer 70, which was
erupted latest on 17 April of all the samples considered in this study. This clast has the overall
highest vesicularity (corresponding lowest density) but slightly lower NVm values (Table
5-6). It shows a distinct bimodal vesicle volume distribution (Figure 5-24a) which implies
two events of nucleation. This is consistent with the vesicle size distribution (Figure 5-23a)
and the CVVD (Figure 5-25), which features distinct breaks in the slope of their curves, also
implying two nucleation events. This clast has on average the largest vesicles and Figure
5-26 suggests evolution by growth. One event at an early stage where the vesicles had time
to grow large and another one later in the eruption, likely close to surface.
Clast 70_38 has relatively low vesicularity (67.0%) and corresponding high density. The
vesicle size distribution shows a smooth negatively sloping curve (Figure 5-23b). The clast
also exhibits a unimodal vesicle volume distribution (Figure 5-24) and the CVVD shows the
same (Figure 5-25). This data is consistent with continuous growth after one burst of
nucleation
Clast 7 mirrors clast 70_37 in a way that it represents the mean density derived vesicularity
of layer 97, which erupted earlier in the day of 17 April. It had a density of 770 kg m-3 and
vesicularity of 68.2%. It has a negative logarithmic slope in the vesicle size distribution
(Figure 5-23) which had 3 minor slopes with changes at 0.4 mm and 0.8 mm. The vesicle
volume distribution (Figure 5-24c) reveals a polymodal-distribution. It shows a resemblance
to clast 70_37 with a predominantly bimodal distribution and modes at same vesicle sizes
(Table 5-5). CVVD reveals the same, indicating at least 2 events of nucleation and growth
(Figure 5-25).
The vesicle size distribution of clast 97_8 reveals the clast has the biggest bump in all the
curves at vesicle size 0.7 mm, with a total of 7 slopes and an almost upwards facing slope
where largest vesicles are (Figure 5-23). The vesicle volume distribution is semi-polymodal
distribution with high volumes at 0.085 mm and 0.111 mm and a widely separated minor
mode at 0.444 mm (Figure 5-24). This third mode results from the 5 large vesicles visible
on the scanned image. The CVVD (Figure 5-25) might indicate coalescence with an upward
facing curve and all the data combined suggest at least 3 events of nucleation.
The checked adjusted sum of the clasts vesicularity from the image analysis was equal to the
density derived vesicularities in all cases with the corrector factor always remaining below
1.4 (Table 5-6). The phenocryst fraction varied between 0-1percent although phenocrysts
were present in all clasts as seen on scanned images. The corrector factor adjusts the
calculation for the phenocrysts, and therefor do they not play a role in the results.
The number density, NVm, is the number of objects is given size classes (1 to i) per unit
volume adjusted for the melt. The vesicle number density values are similar between the
measured clasts although slight differences are observed. The NVm does not exhibit
correlation with stradigraphical order, although the earlier erupted clasts (from layer 97)
during 17 April have higher number densities (3.29 x 10⁻⁷ cm-3 and 2.98 x 10⁻⁷ cm-3) than
those erupted later in the day (2.66 x 10⁻⁷ cm-3 and 4.04 x 10⁻⁷ cm-3) (Table 5-6). The error
value for the NMv estimated around 3%, based on the decoalecence process in GIMP,
therefor the error is smaller than the difference between the values which implies that,
although small, there is some minor difference between the NVm values.
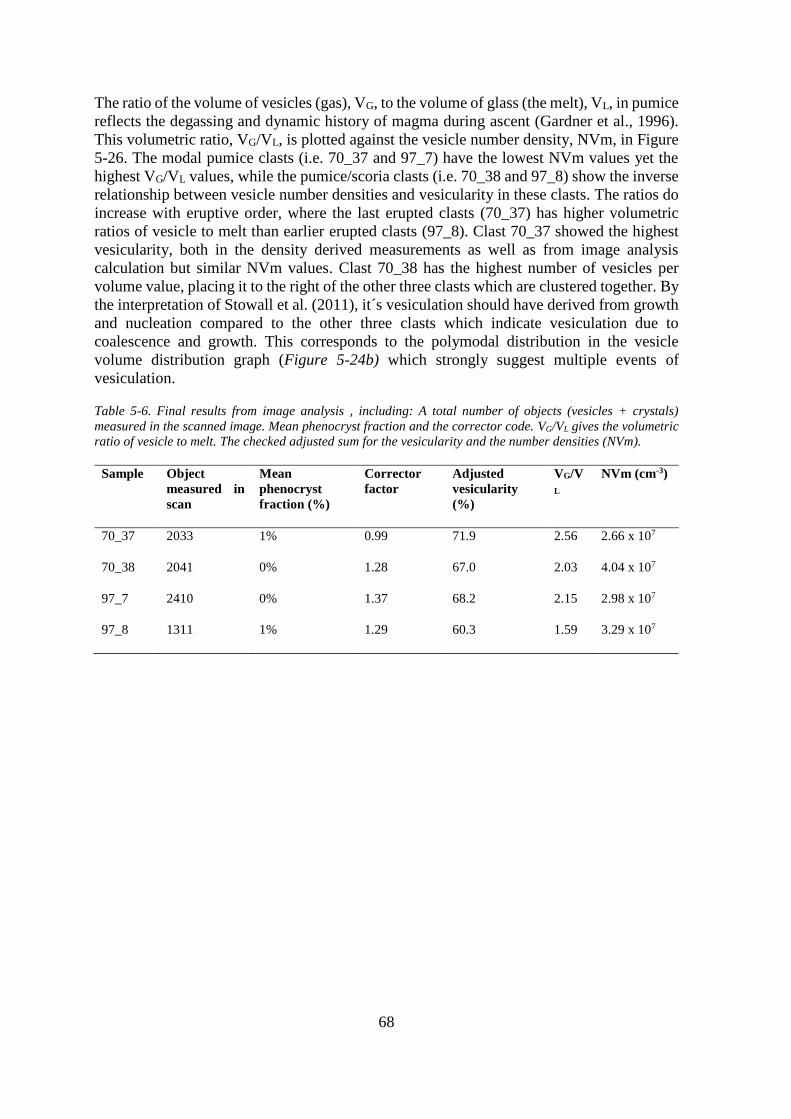
68
The ratio of the volume of vesicles (gas), VG, to the volume of glass (the melt), VL, in pumice
reflects the degassing and dynamic history of magma during ascent (Gardner et al., 1996).
This volumetric ratio, VG/VL, is plotted against the vesicle number density, NVm, in Figure
5-26. The modal pumice clasts (i.e. 70_37 and 97_7) have the lowest NVm values yet the
highest VG/VL values, while the pumice/scoria clasts (i.e. 70_38 and 97_8) show the inverse
relationship between vesicle number densities and vesicularity in these clasts. The ratios do
increase with eruptive order, where the last erupted clasts (70_37) has higher volumetric
ratios of vesicle to melt than earlier erupted clasts (97_8). Clast 70_37 showed the highest
vesicularity, both in the density derived measurements as well as from image analysis
calculation but similar NVm values. Clast 70_38 has the highest number of vesicles per
volume value, placing it to the right of the other three clasts which are clustered together. By
the interpretation of Stowall et al. (2011), it´s vesiculation should have derived from growth
and nucleation compared to the other three clasts which indicate vesiculation due to
coalescence and growth. This corresponds to the polymodal distribution in the vesicle
volume distribution graph (Figure 5-24b) which strongly suggest multiple events of
vesiculation.
Table 5-6. Final results from image analysis , including: A total number of objects (vesicles + crystals)
measured in the scanned image. Mean phenocryst fraction and the corrector code. VG/VL gives the volumetric
ratio of vesicle to melt. The checked adjusted sum for the vesicularity and the number densities (NVm).
Sample Object
measured in
scan
Mean
phenocryst
fraction (%)
Corrector
factor
Adjusted
vesicularity
(%)
VG/V
L
NVm (cm-3)
70_37 2033 1% 0.99 71.9 2.56 2.66 x 10⁷
70_38 2041 0% 1.28 67.0 2.03 4.04 x 10⁷
97_7 2410 0% 1.37 68.2 2.15 2.98 x 10⁷
97_8 1311 1% 1.29 60.3 1.59 3.29 x 10⁷
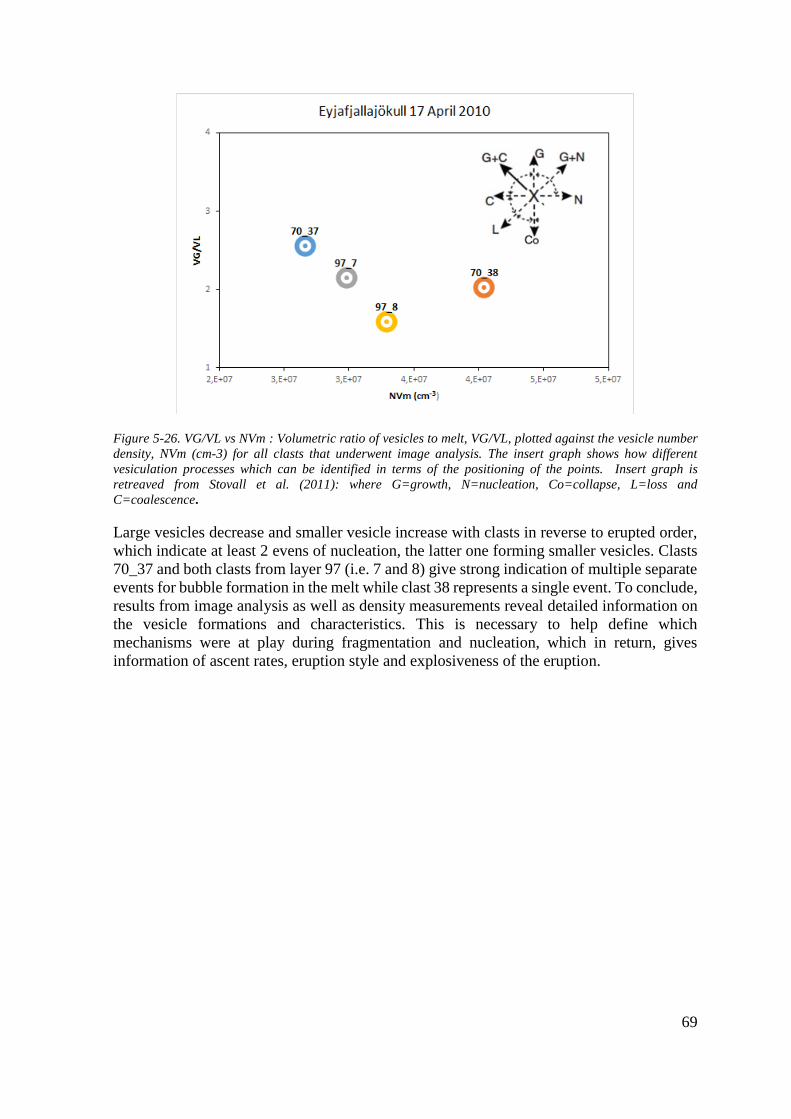
69
Figure 5-26. VG/VL vs NVm : Volumetric ratio of vesicles to melt, VG/VL, plotted against the vesicle number
density, NVm (cm-3) for all clasts that underwent image analysis. The insert graph shows how different
vesiculation processes which can be identified in terms of the positioning of the points. Insert graph is
retreaved from Stovall et al. (2011): where G=growth, N=nucleation, Co=collapse, L=loss and
C=coalescence.
Large vesicles decrease and smaller vesicle increase with clasts in reverse to erupted order,
which indicate at least 2 evens of nucleation, the latter one forming smaller vesicles. Clasts
70_37 and both clasts from layer 97 (i.e. 7 and 8) give strong indication of multiple separate
events for bubble formation in the melt while clast 38 represents a single event. To conclude,
results from image analysis as well as density measurements reveal detailed information on
the vesicle formations and characteristics. This is necessary to help define which
mechanisms were at play during fragmentation and nucleation, which in return, gives
information of ascent rates, eruption style and explosiveness of the eruption.

70

71
6. Discussion
6.1 Stratigraphy and plume observations
The stratigraphic record of JG070811 (Figure 4-2) represents the tephra produced in the
summit eruption of Eyjafjallajökull 2010. The tephra sequence produced on 17 April is
demarcated by centi- to decimeter thick lapilli layers alternating with centimetre thick ash-
rich layers (see Figure 5-6). It is taken to have started at layer 110, and to layer 70 which
marked the offset of thick lapilli layers and start of a new phase.
The lapilli and ash-rich layers present in the 17 April sequence is consistent with pulsating
explosive activity, similar to that observed in relation to the plume behaviour in the afternoon
on 17 April. Each of the prominent lapilli layer was believed to represent an explosive
episode and the sequence taken on in this study contains six dominant medium lapilli layers
and 11 smaller layers, each separated by a package of ash-rich layers (Figure 6-2). These
alternations of lapilli layers and ash layers is most likely linked to changes in the eruption
behaviour, which is evident from plume observations (see section 5.1), where the lapilli
layers represent the high intensity dark plume intervals and the ash-packages the lulls in the
activity in-between the more energetic pulses.
Detailed observations of the plume behaviour during the 7 hours of good visibility 17 April
revealed episodes of high explosivity with the plume reaching over 5 km in height and
episodes of no activity in between. These sudden bursts of high energetic pulses, following
a period of almost no activity, could indicate that the flow was ceased by a closure of the
conduit when no activity occurred, and started again as the closure was removed, when the
dark explosive phases started. A clear behaviour pattern was evident where episodes of a
dark, presumably ash rich, plume were followed by milder episodes of a hybrid plume (light
grey) and little or no activity at the vent until a burst of white coloured plume emerged from
the vent. These cycles of periodic behaviour continued for the seven hours with 8 distinct
episodes of the dark plume events (Figure 5-3). The pattern of activity on 17 April may be
reflecting changes of magma discharge (Carey and Sigurðsson, 1989). On 17 April, the mean
magma discharge is estimated at 6.0 x 10⁵ kg s-1 but differences between magma discharge
rates within minute long pulses are more difficult to estimate. A second possibility is where
the lapilli layers are formed by magmatic fragmentation activity and the ash layers by
quenched granulation from magma-water interactions (Kokelaar, 1986). Both of these
processes might play a role in the pulsating behaviour evident in the stratigraphic record.
Although significant ice-water interaction occurred while the magma broke through the ice
during the initial phase of the summit of Eyjafjallajökull, the melting was mostly confined
to 14-16 April and was low with limited flooding later in the eruption (Guðmundsson et al.,
2012). A new cauldron was formed on 15 April and resulted in renew melting of ice, however
as there is no data on fluctuating water discharge into the active went erupting on 17 April
we can neither confirm nor rule out the process of explosive interaction of magma and
external water.

72
An attempt was made to cross-reference the plume´s behaviour with the stratigraphic record
(Figure 6-1). An uncertainty is clear where the plume observations only cover a total of 7
hours during 17 April and the stratigraphic unit is supposed to represent the entire day. As
such, this proposal is to be taken with caution, although similarities are undoubtedly visible.
Figure 6-1. A proposal : Linkage of the stratigraphic record and the plume observations from the afternoon of
17 April. The thick, coarse grainy units indicate the lapilli layers and the thinner stripy horizons indicate the
ash-rich layers. The stratigraphic sequence in section JG070811 is shown on the left in centimetres. In the
plume graph on the right, the dark grey columns represent dark (tephra-rich) plumes, the light grey hybrid
plumes and the light blue a white (tephra-free) plumes. Duration of plume observations are displayed on the
right as hours. The red lines connect distinct lapilli rich layers with dark plume events.

73
6.2 Grain size
The summit eruption of 2010 was ash-rich and as demonstrated by Guðmundsson et al.
(2012), the eruption produced significant amounts of fine ash (see section 3.3.1) during the
explosive phases where most of the material was dispersed during strong winds in the upper
troposphere.
All of the layers measured in this study give a hint at a bimodal distribution with a main
mode at -2.5 or -1, a second weak peak in the very fine ash (<3.5 phi = 0.090 mm) and
absence of grain sizes over -4 phi (16 mm). This demonstrates that both the lapilli clasts and
fraction of the very fine ash were deposited together at the same location. Hence, the
presence of the secondary ash mode implies premature deposition of the very fine ash (Rose
and Durant, 2009). This could be explained by particle aggregation playing an important role
in deposition, where growth is controlled by collision of liquid-coated particles due to
differences in fall velocities and binding as a result of tension forces (Gilbert and Lane,
1994). The steam from the melting glacial ice injected into the plume along with the tephra
acts as glue when binding the fine ash together. At medial sites (5-10 km from source vents)
the tephra fall from the 17th April contained a horizons of accretionary lapilli (Figure 6-2)
demonstrating that aggregation was an important process for premature deposition of ash
during the initial phase of the 2010 Eyjafjallajökull summit eruption.
Figure 6-2. Accretionary lapilli found near Seljavallalaug , a few km south of the eruption site (Photograph
by Ármann Höskuldsson).
6.3 Density and vesicularity
Density and vesicularity measurements were conducted from the 5 largest lapilli layers from
17 April using methods of Houghton and Wilson (1989) by determining weights in water
and air. Interpretation of the vesicularity relies on the fact that the measured clast densities

74
are representative of the magma at the time of fragmentation. The vesiculary means spans
the range of 35 to 71% (Figure 5-15) and the range of vesicularities are 6 to 78.9% (Table
5-3). The 17 April lapilli tephra features three clast vesicularity modes: Mode 1 with highest
vesicularities (~50 to 75%), Mode 2 (~30 to 50% vesicularity) and mode 3 with lowest
vesicularities (6 to 30%). Less vesicular pumice may have formed via bubble collapse due
to outgassing in a slowly ascending magma or from shear at the conduit walls (Hammer et
al., 1999).
6.4 Image analysis
The upper and lower domain of the main modes of densities from layers 70 and 97 were
selected to address issues of heterogeneity within the sample and best represent the
stradigraphic record of 17 April for analysing the images. 12 SEM images and a scan, per
sample, were processed with an IMR (Image Magnification ratio) of 1:1 50x, 1:1 100x and
2:1 250x (Figure 4-7). As the clasts were not homogeneous with varying bubble size
volumes, a larger set of images would be preferable in order to fully capture each size class
well. As such, the 4 images of the highest magnification (250x) in the clasts containing high
volumes of smaller bubbles, might have been as insufficient. However with the work hours
needed in mind and the size of the thesis, the threshold was set to 12 images per clast.
All vesicle size distributions, VSD, showed a negative linear slope, which indicates a steady-
state nucleation and growth due to effects of both decompressional expansion and volatile
exsolution (Mangan and Cashman, 1996).
Three out of the four clast’s vesicle size distributions (VSDs) had several different slopes,
revealing Power law BSD, which is associated with highly non-equilibrium degassing where
bubbles nucleate repeatedly and causes the VSDs to change, (Figure 5-23). Clast 70_38 had
the smoothest slope (exponential), which could indicate a single stage of nucleation (Shea et
al., 2010). The vesicle volume distribution (VVD) and the cumulative vesicle volume
distribution (CVVD) curves (Figure 5-25) further supports this.
All the data from image analysis point to two to three different scenarios for the clasts,
depending on the interpretation of Figure 5-26. Clasts 70_37 and 97_7, which represented
the mean modes for each layer (Table 5-6), both indicated at least 2 distinct events of
nucleation (Figure 5-23; Figure 5-24; Figure 5-25). The VG/VL vs NVm graph indicated
events of growth and coalescence for these two clasts (Figure 5-26). They included fewer
and larger vesicles and greater vesicularity, indicating longer vesicle growth time. This
implies that the vesicle expansion was relatively unconstrained, or unlimited, during slow
ascent. When bubble nucleation happens the pressure overcomes the tensile strength of the
plug and it fails, resulting in sudden release of the fresh/pristine magma, which can
vesiculate and ascend in a more unconstrained environment and thus forming the pumice of
clast 70_37 and 97_7.
All image data (Figure 5-23; Figure 5-24; Figure 5-25) from clast 97_8, which included
higher number and smaller bubbles per unit value than the other two (Table 5-6) revealed
multiple events of nucleation and the VG/VL vs NVm graph (Figure 5-26) indicated multiple
events of collapse. The three mode types (Table 5-5), further support a rhythmic behaviour
pattern of bubble nucleation events, which could correlate with the rhythmic pulsating
75
behaviour during the 17th. The high number of smaller vesicles along with low vesicularity
is consistent with higher degree of bubble nucleation during either a shorter time for growth
or a more difficult growth process.
Clast 70_38 revealed 1 distinct event of nucleation (Figure 5-24) where the graph (Figure
5-26) indicated growth and nucleation as a cause although several more indicators of
nucleation’s events were observed (Figure 5-23) (Stowall et al., 2011), however as it is
situated to the right of clast 97_8 (Figure 5-26), it could be interpreted as event of bubble
collapse. The high NVm and low vesicularity of clast 70_38 possibly represents the top of
the pristine magma batch when its rise is hampered by the overlying stiffer plug. This would
allow for pressure to build up in the tip of the rising magma.
6.5 Eruption scenario
Similar eruptions of such hybrid nature and pulsating explosive activity have been observed
at volcanoes which are located at convergent margins where in situ observations of continues
monitoring of dome activity have been made at Merapi volcano, Indonesia and on
Monsterrat. Merapi has produced periods of both low and high extrusion events since 1972,
with an average magma discharge rate of 105 m3 per month (Hort et al., 2006), which is
considerably lower to the daily rate of Eyjafjallajökull 17 April ~5 x 10⁵ kg s-1
(Guðmundsson et al., 2012) where these events occurred within hours. On 20 March 2000,
Monsterrat produced around 40 pyroclastic flows during ~5 hours from a collapse event with
an ash cloud reaching altitudes of ~9 km (Carn et al., 2004), similar to the plume height 17
April in Eyjafjallajökull. Burgisser et al. (2010) indicated that the 1997 eruption of Soufriere
Hills on Montserrat Island had similar behaviour of pulsation, which had a count of 88
explosions during three months which were interpreted to be the result of pressurisation
within the conduit formed by a highly crystalline and degassed magma plug located in the
upper part of the system. All of these eruptions included a lava dome collapse which had
sealed the conduit, trapping the magma in the conduit and building up internal pressure.
Although the 2010 summit eruption at Eyjafjallajökull did produce lava, it did not feature a
sealing lava dome (Guðmudsson et al., 2012). Therefore, another explanation has to be
developed. Slow ascent of magma can induce degassing of volatiles, which in return, causes
crystallisation of the magma. The result is that the magma becomes stiffer due to increase in
viscosity and yield strength (Sparks, 2003). When a batch of degassing magma is expelled
from the vent, it may leave behind a fraction of outgassed and stiff magma, which, if it is
large enough, can result in formation of a plug that temporarily seals of the shallow conduit
in a similar manner as a lava domes mentioned above. The plug can slow down or even stall
ascent of new fresh magma batches, pressurizing it until it is high enough to overcome the
tensile strength of the plug and subsequently dislodge it via explosive activity (e.g. Hammer
et al., 1999). A few different scenarios can result in dislodging of the plug. Cycles of
deflation and inflation in the magma flowage can build overpressures to the point of
explosions that brake through the cap and gas accumulation below a cap can be to an extent
where it can trigger explosions through the plug in spite of magma flowage. If the magma
comes in contact with water, turning it into steam (Kokelaar, 1986), the pressure can increase
beneath the plug where the vaporization can dislodge the plug (Fagents and Wilson, 1993),
which then forces the underlying trapped magma to suddenly decompress and fragment.
None-explosive fragmentations can occur near the conduit walls, as presented to be the case

76
of the 1991-1995 Unzen earthquakes (e.g. Fujji, 1999; Hozisumi, 1999) where magmatic
fragmentation of ascending magma was believed to have generated the volcanic earthquakes
(Gotto, 1999). The shear-induced fragmentation can generate intermittent permeable
fracture networks which allows degassing to occur (Gonnermann and Manga, 2003).
Degassing of the trapped magma beneath the plug could have happened through the conduit
and the roof (plug), resulting in a breakage through fracture networks in the plug as it was
attacked by the escaping gas (Figure 6-3). These three scenarios: 1) magma deflation and
inflation, 2) water-ice interactions and 3) shear-induced fragmentation through the plug may
all have played a part in the dislodgement.
The initial dark plume pulses in each phase (Table 5-2) possibly represent the first breakage
of materials through the plug. With time, the activity increases until the cork is fully
dislodged and a steady flow continues until the formation of a new cork begins. The white
plume is presumably the result of glacial melt leaking into the conduit, resulting in steam
explosions (Kokelaar, 1986). As calculated by Magnusson et al. (2012) the total volume of
melted ice during 14-20 April to be ~0.08 km3 or ~10% of the ice volume measured previous
to the eruption (~0,8 km3). In this case, the water might have played a bigger role in inducing
tephra deposition from the plumes via aggregation (Gilbert and Lane, 1994) rather than in
inducing fragmentation and explosive activity in the shallow conduit. The plug would
presumably contain higher density clasts than the trapped magma below, as in the case of
juvenile lithic clasts found in the samples (Figure 5-18), whereas lower density clasts, with
higher vesicularity, (70_37 and 97_7) would have originated from the trapped degassed
magma.
The data presented in this thesis supports the theory of a plug controlling the activity 17
April 2010 in Eyjafjallajökull:
Plume observations: Reveals pulsating behaviour of the eruption, where intense
explosive tephra producing activity (plug release) are alternated with lulls (plug
present) in the activity of significant length (Figure 5-3).
The stratigraphic record: Reveals alternating lapilli tephra and ash-rich layers
(Figure 5-6).
Correlation of the plume observations and stratigraphical record shows correlation
(Figure 6-1).
Density: The very wide clast density range where all clast groups (pumice, scoria
and juvenile lithics clasts) are present in significant amounts in the same layers
(Figure 5-11 to Figure 5-14).
Image analysis: The pumice vesicularities and VSDs + VVDs (Figure 5-23 and
Figure 5-24) which reveal vesiculation under pressurized conditions (plug present)
followed by open and unconfined vesicle growth (plug release).
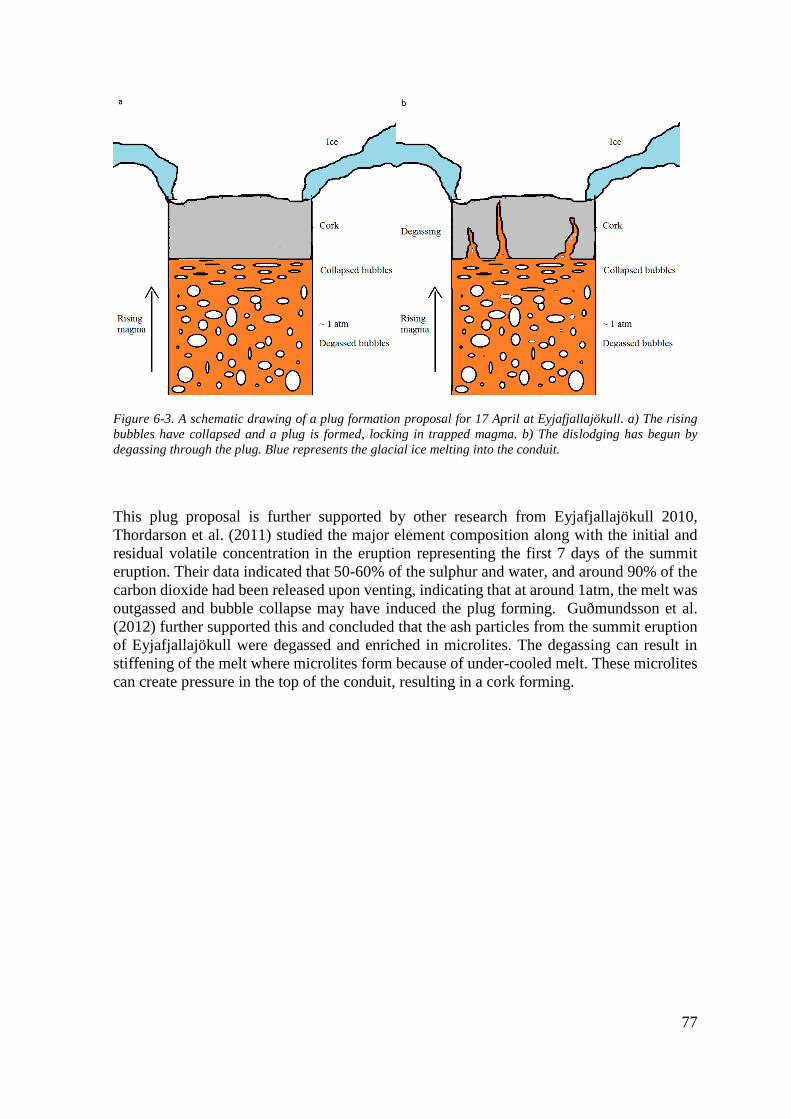
77
Figure 6-3. A schematic drawing of a plug formation proposal for 17 April at Eyjafjallajökull. a) The rising
bubbles have collapsed and a plug is formed, locking in trapped magma. b) The dislodging has begun by
degassing through the plug. Blue represents the glacial ice melting into the conduit.
This plug proposal is further supported by other research from Eyjafjallajökull 2010,
Thordarson et al. (2011) studied the major element composition along with the initial and
residual volatile concentration in the eruption representing the first 7 days of the summit
eruption. Their data indicated that 50-60% of the sulphur and water, and around 90% of the
carbon dioxide had been released upon venting, indicating that at around 1atm, the melt was
outgassed and bubble collapse may have induced the plug forming. Guðmundsson et al.
(2012) further supported this and concluded that the ash particles from the summit eruption
of Eyjafjallajökull were degassed and enriched in microlites. The degassing can result in
stiffening of the melt where microlites form because of under-cooled melt. These microlites
can create pressure in the top of the conduit, resulting in a cork forming.

78

79
7. Conclusions
The 2010 summit eruption of Eyjafjallajökull started with a 4-day explosive phase which
resulted in a 5 day disruption to aviation over Europe (Guðmundsson et al., 2012),
highlighting the importance of volcanic research and deeper knowledge of such events. 17
April, represents the latter stage of the initial phase, which was of particular interest as it
erupted in a hybrid explosive manner with periodic and pulsating activity. We set out to
answer the following questions:
Can the pulsating behaviour observed in the eruption column be witnessed within the
stratigraphic column?
What is the density and vesicularity of these pumice clasts and what is the vesicle
size distribution?
What mechanism and/or conditions inside the conduit contributed to these explosive
pulses?
To investigate the pulsating behaviour, we analyse plume image data along with the tephra
sequence from 17 April. The plume data, amounting up to 7 hours, reveals a repeated
behaviour pattern of pulsating episodes consisting either of dark (tephra-laden) plume, white
(steam-rich) plume or a light grey hybrid plume (steam and tephra). Periods of no activity
are also visible within these cycles. Eight peaks of dark plume were evident in the data each
separated by significant lull in the activity. The stratigraphic record from the 17 April reveals
a sequence of alternating lapilli- and ash-rich units: with six dominant medium lapilli layers
and 11 smaller layers, each separated by a package of ash-rich layers. The match between
the stratigraphical sequence and the plume record is such that it is reasonable to assume that
these records are correlated.
Five lapilli layers were analysed for clast density had a highly variable density distributions,
although all contained the three modal clast types, pumice, scoria and juvenile lithics and
their joint presence in each layer is related to the pulsating activity that typified the eruption
on 17 April. The four clasts that were analysed by SEM were from the lowest density mode
(< 1000 kg m-3; >60% vesicularity) is typical for densities of pumice (Hammer et al., 1999)
and was present in all samples. The second mode, scoria (1400 to 2000 kg m-3; 20-40%
vesicularity) is present in four of the layers analysed in this study and the third mode, juvenile
lithics (2000 kg m-3; <20% vesicularity) in three. All of the juvenile tephra clasts are
degassed and the denser clasts, in particular the juvenile lithics, are outgassed often featuring
partly collapsed bubble structures (e.g. Thordarson,et al., 2011). All the vesicle size
distribution (VSD) revealed negative and linear slopes, differentiating between double and
multiple slopes which indicates multiple stages of nucleation and growth. The vesicle
volume distribution (VVD) and cumulative vesicle volume distribution (CVVD) agree with
these observations with either bimodal or polymodal distribution and an upward facing curve
with minor kinks. When comprising all the image analysis data and with the help of the

80
volumetric ratio of vesicles to melt (VG/VL) plotted against the vesicle number density NVm
(mm-3) graph, it revealed that two clasts chosen from the mean density of each layer paired
in most results and were believed to have formed through at least 2 events of growth during
unconstrained vesicle expansion, where the plug was either released or not present, in a
relatively slow ascent.
The two denser clasts differed from each other, with one revealing a single event of
nucleation while the other indicated multiple events. The high number of smaller vesicles
along with lower vesicularitiy indicates higher degree of bubble nucleation during a difficult
growth process when the rise is hampered by the overlying stiffer plug. This would allow
for pressure to build up in the tip of the rising magma and consequently more supersaturation
of H2O is required for bubble nucleation. When bubble nucleation happens the pressure
overcomes the tensile strength of the plug and it fails, resulting in sudden release of the
fresh/pristine magma, which now can vesiculate and ascend in a more unconstrained
environment and thus forming the two low density pumices.
When the data outlined above is considered collectively the logical conclusion for the
mechanism driving the pulsating explosive activity on 17 April 2010 is a periodic
clogging/plugging of the shallow conduit by outgassed magma and subsequent clearance of
this plug via forceful explosive pulse, driven by pressurization associated with rise and
degassing of a fresh batch of magma from below.
81
8. References
Alidibirov, M., & Dingwell, D. B. (1996). Magma fragmentation by rapid decompression.
Letters to nature, 380, 146-148.
Alidibirov, M., & Dingwell, D. B. (2000). Three fragmenation mechanisms for highly
viscous magma under rapid decompression. Journal of Volcanology and Geothermal
Research, 100, 413-421.
Anderson Jr., A. T., & Brown, G. G. (1993). CO2 and formation pressures of some Kileauean
melt inclusions. American Mineralogist, 78, 794-803.
Applegarth, L. J., Tuffen, H., James, M. R., Pinkerton, H., & Cashman, K. V. (2013). Direct
observations of degassing-induced crystallization in basalts. The Geological Society
of America. The Geological Society of America. doi:10.1190/G33641.1
Arason, P., Petersen, G. N., & Bjornsson, H. (2011, September 3). Observations of the
altitude of the volcanic plume during the eruption of Eyjafjallajökull, April-May
2010. Earth System Science Data(3), 9-17. doi:10.5194/essd-3-9-2011
Árnadóttir, T., Geirsson, H., & Jiang, W. (2008). Crustal deformation in Iceland: Plate
spreading and earthquake deformation. Jökull, 58.
Bjarnason, I. T., & Schmeling, H. (2009). The lithosphere and asthenosphere of the Iceland
hotspot from surface waves. Geophysical Journal, 178, 394-418.
doi:10.1111/j.1365-246X.2009.04155.x
Bjarnason, I. T., & Schmeling, H. (2009). The lithosphere and asthenosphere of the Iceland
hotspot from surface waves. Geophysical Journal(178), 394-418.
doi:10.1111/j.1365-246X.2009.04155x
Bjarnason, I. Þ. (2008). An island hotspot saga. Jökull, 58, 3-16.
Bjornsson, H., Magnusson, S., Arason, P., & Petersen, G. N. (2013, October 22). Velocities
in the plume of the 2010 Eyjafjallajökull eruption. Journal of Geophysical research:
Atmospheres, 118, 11,698-11,711. doi:10.1002/jgrd.50876, 2013
Björnsson, H., & Pálsson, F. (2008). Icelandic Glaciers. Jökull(58), 365-382.
Blott, S. J., & Pye, K. (2001, June 21). Gradistat: A grain size distribution and statistics
package for the analysis of unconsolidated sediments. Earth Surface Processes and
Landforms(26), 1237-1248. doi:10.1002/esp.261

82
Brandsdóttir, B., & Menke, W. H. (2008). The seismic structure of Iceland. Jökull, 58, 17-
34.
Burgisser, A., Arbaret, L., Druitt, T. H., & Giachetti, T. (2010). Pre-explosive conduit
conditions of the 1997 Volcanian explosions at Soufriére Hills Volcano, Monsterrat:
II Overpressure and depth distributions. Journal of Volcanology and Geothermal
Research, 13. doi:10.1016/j.jvolgeores.2010.11.014
Carey, R. J., & Houghton, B. F. (2010). " Inheritance"; An influence on the particle on the
particle size of pyroclastic deposits. Geology, 38(4), 347-350. doi:10.1130/G30573.1
Carey, S., & Sigurðsson, H. (1989). The intensity of plinian eruptions. Bulletin of
Volcanology, 51(1), 28-40.
Carn, S. A., Watts, R. B., Thompson, G., & Norton, G. E. (2004). Anatomy of a lava dome
collapse: the 20 March 2000 event at Soufriére Hills Volcano, Montserrat. Journal
of Volcanology and Geothermal Research, 131, 241-264. doi:10.1016/S0377-
0273(03)004364-0
Cashman, K. V., Sturtevantm, B., Papale, P., & Navon, O. (2000). Magmatic Fragmentation.
In Encyclopedia of Volcanoes (pp. 421-430). Academic Press.
Cioni, R., Marianelli, P., Santacroce, R., & Sbrana, A. (2000). Plinian and subplinian
eruptions. In B. H. H. Sigurdsson, Encyclopedia of Volcanoes (pp. 477-494). San
Diego: Academic Press.
Cioni, R., Pistolesi, M., Bertagnini, A., Bonadonna, C., Hoskuldsson, A., & Scateni, B.
(2014, February 26). Insights into the dynamics and evulution of the 2010
Eyjafjallajökull summir eruption (Iceland) provided by volcanic ash textures.
(T.Elliott, Ed.) Earth and Planetary Science Letters(394), 111-123.
doi:10.1016/j.epsl.2014.02.051
Crosweller, S. H., Arora, B., Brown, S. K., Cottrell, E., Deligne, N. I., Guerrero, N. O., &
Venzke, E. (2012). Global database on large magnitude explosive volcanic eruptions
(LaMEVE). Journal of Applied Volcanology, 2-13. doi:10.1186/2191-5040-1-4
Darbyshire, F. A., White, R. S., & Priestley, K. F. (2000, June 6). Structure of the crust and
uppermost mantla of Iceland from a combined seismic and gravity study. Earth and
Planetary Science Letters(181), 409-428.
Davies, S. M., Larsen, G., Wastegard, S., Turney, C. S., Hall, V. A., Coyle, L., &
Thordarson, T. (2010, June 5). Widespread dispersal of Icelandic tephra: how does
Eyjafjöll eruption of 2010 compare to past Icelandic events? Journal of Quaternary
Science, 5(25), 605-611. doi:10.1002/jqs.1421
Dellino, P., Gudmundsson, M. T., Larsen, G., Mele, D., Stevenson, J. A., Thordarson, T., &
Zimanowski, B. (2012, January 4). Ash from the Eyjafjallajökull eruption (Iceland):
Fragmentation processes and aerodynamic behavior. Journal of Geophysical
Research, 117, 1-10. doi:10.1029/2011JB008726
83
Edwards, B., Magnússon, E., Thordarson, T., Guðmundsson, M. T., Höskuldsson, Á.,
Oddson, B., & Haklar, J. (2012). Interactions between lava and snow/ice during the
2010 Fimmvörðuháls eruption, south-central Iceland. Journal of Geophysical
Research, 117, 1-21. doi:10.1029/2011JB008985
Einarsson, P. (2008). Plate boundaries, rifts and transforms in Iceland. Jökull(58), 35-58.
(2014). Eruption classification. MemoVolc workshop on "The dynamics of volcanic
explosive eruptions", University of Geneva, Faculte des sciences, Geneva.
Fagents, S. A., & Wilson, L. (1993, May). Explosive volcanic eruptions -VII. The range of
pyroclasts ejected in the transient volcanic explosions. Geophysical Journal
International, 113(2), 359-370.
Fitton, J. G., Saunders, A. D., Norry, M. J., Hardarson, B. S., & Taylor, R. N. (1997).
Thermal and chemical structure of the Iceland plume. Earth and Planetary Science
Letters(153), 197-208.
Fujii, T., & Nakada, S. (1999). The 15 September 1991 pyroclastic flows at Unzen Volcano
(Japan): a flow model for associated ash-cloud surges. Journal of Volcanology and
Geothermal Research(89), 159-172.
Gaonac'h, H., Lovejoy, S., & Schertzer, D. (2004). Scaling vesicle distribution and volcanic
eruptions. Bull. Volcanology, 67, 350-357. doi:10.1007/s00445-004-0376-4
Gardner, J. E., Jaupart, C., & Thomas, R. M. (1996). Fragmentation of magma during Plinian
volcanic eruptions. Bulletin of Volcanology, 144-162.
Genareau, K., Mulukutla, G. K., Proussevitch, A. A., Durant, A. J., Rose, W. I., & Sahagian,
D. L. (2013). The size range of bubbles that produce ash during explosive volcanic
eruptions. Journal of Applied Volcanology, 2:4. doi:10.1186/2191-5040-2-4
Gilbert, J. S., & Lane, S. J. (1994). The origin of accreationary lapilli. Bulletin of
Volcanology, 56, 398-411.
Goldstein, J. I., Newbury, D. E., Echilin, P., Joy, D. C., Romig Jr, A. D., Lyman, C. E., &
Lifshin, E. (1992). Scanning Electron Microscopy and X-Ray Microanalysis; A text
for Biologists, Material Scientists and Geologists (Second ed.). New York: Plenium
Press. doi:10.1007/978-1-4613-0491-3
Gonnermann, H. M., & Manga, M. (2003). Explosive volcanismn may not be an inevitable
consequence of magma fragmentation. Letters to nature, 426, 432-435.
Gonnermann, H. M., & Manga, M. (2012). Dynamics of magma ascent in the volcanic
conduit. In C. U. Press (Ed.), Modeling Volcanic Processes: The physics and
Mathematics of Volcanism (pp. 55-84).
Gotto, A. (1999). A new model for volcanic earhquakes at Unzen volcano; Melt rupture
model. Geophysical Reasearch Letter, 26, 2541-2544.
84
Guðbjartsson, S. (2010, December 10). www.mbl.is. Retrieved from
http://www.mbl.is/greinasafn/grein/1360884/.
Guðmundsson, Á. (2000). Dynamics of Volcanic Systems in Iceland: Example of Tectonism
and Volcanism at Juxtaposed Hot Spot and Mid-Ocean Ridge Systems. Annual
Reviews. Earth Planet(28), 107-140.
Guðmundsson, M. T., & Pedersen, R. (2010, May). Eruptions of Eyjafjallajökull Volcano,
Iceland. Eos, 91, 190-191. doi:10.1029/2010EO210002
Guðmundsson, M. T., Elíasson, J., Larsen, G., Gylfason, Á. G., Einarsson, P., Jóhannesson,
T., & Torfason, H. (2005). Yfirlit um hættu vegna eldgosa og hlaupa frá vesturhluta
Mýrdalsjökuls og Eyjafjallajökli. Reykjavík: Ríkslögreglustjóri.
Guðmundsson, M. T., Thordarson, T., Höskuldsson, Á., Larsen, G., Björnsson, H., Prata, F.
J., & Jónsdóttir, I. (2012, August). Ash generation and distribution from April-May
2010 eruption of Eyjafjallajökull, 2010. Scientific Reports, 2(572), 1-12.
doi:10.1038/srep00572
Guðmundsson, M. T., Thordarson, T., Höskuldsson, Á., Larsen, G., Björnsson, H., Prata, F.
J., . . . Jónsdóttir, I. (2012). Ash generation and distribution from the April-May 2010
eruption of Eyjafjallajökull, Iceland. Scientific Reports, 572(2), 1-12.
doi:10.1038/srep00572
Haflidason, H., Eiriksson, J., & Kreveld, V. S. (2000). The tephrochronology of Iceland and
the North Atlantic region during the Middle and Late Quaternary: a review. Journal
of Quaternary Science, 3-22.
Hammer, J. E., Cashman, K. V., Hoblitt, R. P., & Newman, S. (1999). Degassing and
microlite crystallization during pre-climatic events of the 1991 eruption of Mt.
Pinatubo, Philippines. Bulletin of Volcanology, 60, 355-380.
Herd, R. A., & Pinkerton, H. (1997). Bubble coalescence in basaltic lava: Its impact on the
evolution of bubble populations. Journal of Volcanology and Geothermal Research,
75(1-2), 137-157. doi:10.1016/S0377-0273(96)00039-X
Hildreth, W., & Fierstein, J. (2012). The Novarupta-Katmai eruption of 1912: Largest
eruption of the twentieth century. Centennial Perspectives. Alaska: USGS.
Hjaltadottir, S. (2009). Use of relatively located microearthquakes to map fault patterns and
estimate the thickness of the brittle crust in Southwest Iceland. Faculty of Earth
Sciences. Reykjavik: University of Iceland. Retrieved from
http://hdl.handle.net/1946/3990
Hort, M., Vöge, M., Seyfried, R., & Ratdomopurbo, A. (2006). In situ observation of dome
instabilities at Merapi volcano, Indonesia: A new model tool for volcanic hazard
mitigation. Journal of Volcanology and Geothermal Research, 153, 301-312.
doi:10.1016/j.volgeores.2005.12.007
85
Hoshizumi, H., Uto, K., & Watanabe, K. (1999). Geology and euptive history of Unzen
volcano, Shimabara Peninsula, Kyushu, SW Japan. Journal of Volcanology and
Geothermal Research(89), 81-94.
Houghton, B. F., & Wilson, C. J. (1989). A vesicularity index for pyroclastic deposits.
Bulletin of Volcanology, 51(6), 451-462.
Houghton, B. F., & Wilson, C. J. (1989). A Vesicularity index for pyroclastic deposits.
Bulletin of Volcanology(51), 451-462.
Houghton, B. F., Carey, R. J., & Rosenberg, M. D. (2014). The 1800a Taupo eruption "III
wind" blows the ultraplinian type event down to Plinian. Geology, 42(5), 459-461.
doi:10.1030/G35400.1
Hreinsdóttir, S., Sigmundsson, F., Robert, M. J., Björnsson, H., Grapenthin, R., Arason, T.,
& Óladóttir, B. A. (2014). Volcanic plume height corrilated with magma-pressure
change in Grímsvötn Volcano, Iceland. Nature Geoscience, 7, 214-318.
doi:10.1038/ngeo2044
I.M.O. (IMO). (2012). The 2010 Eyjafjallajökull eruption, Iceland. Institute of Earth
Sciences, University of Iceland. Icelandic Meteorological Office, The National
Commissioner of the Icelandic Police. Reykjavik: IMO.
Jacoby, W., & Gudmundsson, M. T. (2007, July 25). Hotspot Iceland: An introduction.
Journal of Geodynamics(43), 1-5.
Jakobsson, S. P., & Gudmundsson, M. T. (2008). Subglacial and intraglacial volcanic
formations in Iceland. Jökull, 58, 179-196.
Jakobsson, S. P., & Gudmundsson, M. T. (2008). Subglacial and intraglacial volcanic
formations in Iceland. Jokull(58), 179-196.
Jakobsson, S. P., Jónasson, K., & Sigurdsson, I. A. (2008). The three igneous rock series of
Iceland. Jökull, 58, 117-138.
Jerram, D. A., & Martin, V. M. (2008). Understanding crystal populations and their
significance through the magma plumbing system. Geological Society, 304, 133-148.
doi:10.1144/SP304.7
Johannesson, H., & Saemundsson, K. (1998). Geological map of Iceland, 1:500.000 Bedrock
geology. Reykjavik: Icelandic Insitute of Natural History and Iceland Geodetic
Survey.
Jude-Eton, T. C., Thordarson, T., Guðmundsson, M. T., & Oddson, B. (2012). Dynamics,
stradigraphy and proximal dispersal of supraglacial tephra during the ice-confines
2004 eruption at Grímsvötn Volcano, Iceland. Bulletin of Volcanology.
doi:10.1007/s00445-012-0583-3
Keiding, J. K., & Sigmarsson, O. (2012, March 14). Geothermobarometry of the 2010
Eyjafjallajökull eruption: New constraints on Icelandic magma plumbing systems.
Journal of Geophysical research, 117(B9). doi:10.1029/2011JB008829
86
Kokelaar, P. (1986). Magma-water interactions in subaqueous and emergent basaltic
volcanism. Bulletin of Volcanology, 48, 275-289.
Larsen, G. (1999). Gosið í Eyjafjallajökli 1821-1823. Raunvísindastofnun Háskólans.
Reykjavík: Raunvísindastofnun Háskólans.
Lin, J.-F., Gregoryanz, E., Struzhkin, V. V., Somayazulu, M., Mao, H.-K., & Hemley, R. J.
(2005). Melting behaviour of H2O at high pressures and temperatures. Geophysical
Reasearch letters, 32, 32. doi:10.1029/2005GL022499
Loughlin, S. C. (2002). Facies analysis of proximal subglacial and proglacial volcaniclastic
successions at the Eyjafjallajökull central volcano, southern Iceland. In Volcano-Ice
interaction on Earth and Mars (pp. 149-178). London: The Geological Society.
Lúðvíksson, A. Þ. (2015, May 6). Mila cameras during the Eyjafjallajökull 2010 eruption.
(E. Pálmadóttir, Interviewer)
Magnússon, E., Guðmundsson, M. T., Roberts, M. J., Sigurðsson, G., Höskuldsson, F., &
Oddson, B. (2012, July 14). Ice-volcano interactions during the 2010 Eyjafjallajökull
eruption, as revealed by airborne imaging radar. Journal of Geophysical Research,
117, B07405. doi:10.1029/2012JB009250
Mangan, M. T., & Cashman, K. V. (1996). The structure of basaltic scoria and reticulite and
inferences for vesiculation, foam formation, and fragmentation in lava fountains.
Journal of Volcanology and Geothermal Research, 73, 1-18.
Martin, E., Paquette, J. L., Bosse, V., Ruffet, G., Tiepolo, M., & Sigmarsson, O. (2011).
Geodynamics of rift-plume interaction in Iceland as constrained by new 40 Ar/39 Ar
and in situ U-Pb zircon ages. Earth and Planetary Research, 311(1), 28-38.
Mastin, L. G. (2002). Insights into volcanic conduit flow from an open-source numerical
model. Geochemistry, Geophysics, Geosystems., 3, 1-18. doi:10.1029/2001GC00192
Mattsson, H., & Höskuldsson, Á. (2003). Geology of the Heimaey volcanic centre, south
Iceland: early evolution of a central volcano in a propagating rift? Journal of
volcanology and geothermal research, 127, 55-71. doi:10.10116/S0377-
0273(03)00178-1
Melnik, O. (2000). Dynamics of two-phase conduit flow of high-viscosity gas-saturated
magma: large variations of sustained explosive eruption intensity. Bulletin of
Volcanology, 62, 153-170.
Morrissey, M., Zimanowski, B., Wohletz, K., & Buettner, R. (2000). Phreatomagmatic
fragmentaion. In Enclopedia of Volcanoes (pp. 431-444). Academic Press.
Moune, S., Sigmarsson, O., Schiano, P., Thordarson, T., & Keiding, J. K. (2012, February
24). Melt inclusions constrains on the magma source of Eyjafjallajökull 2010 flank
eruption. Journal of Geophysical Research, 117, B00C07.
doi:10.1029/2011JB008718
87
Möller, R., Möller, M., Björnsson, H., Guðmundsson, S., Pálsson, F., Oddsson, B., &
Schneider, C. (2014). MODIS-derived albedo changes of Vatnajökull (Iceland) due
to tephra deposition from the 2004 Grimsvötn eruption. International Journal of
Applied Earth and Observation and Geoinformation, 26, 256-269.
doi:10.1016/j.jag.2013.08.005
Newhall, C. G., & Stephen, S. (1982). The volcanic explisivity index (VEI) an estimate of
explosive magnitude for historical volcanism. Journal of Geophysical research.
doi:10.1029/JC087iC02p01231
Óskarsson, B. V. (2009). The Skering ridge on Eyjafjallajökull, south Iceland: Morphology
and magma-ice interaction in an ice-confined silicic fissure eruption. Reykjavik:
University of Iceland.
Parfitt, E. A., & Wilson, L. (2008). The role of volatiles. In Fundamentals of Physical
Volcanology (pp. 64-77). Blackwell Publishing.
Pedersen, R., Sigmundsson, F., & Einarsson, P. (2007). Controlling factors on earthquake
swarms associated with magmatic intrusions; Constraints from Iceland. Journal of
Volcanology and Geothermal Research, 162(1-2), 73-80.
Petersen, G. (2012). The impact of the atmosphere on the Eyjafjallajökull 2010 eruption
plume. Journal of Geophysical Research, D00U07. doi:10.1029/2011JD016762
Proussevitch, A. A., & Sahagian, D. L. (1998). Dynamics and energetics of bubble growth
in magmas: Analytical formulation and numerical modelling. Journal of Geophysical
Research, 103, 18223-18251.
Pyle, D. M. (1989). The Thera Foundation. Thera and the Aegean World III. Volume Two:
"Earth Sciences" Proceedings of the Third International Congress., (pp. 113-121).
Santorini, Greece.
Rasband, W. (1997-2014). https://imagej.nih.gov/ij/. Retrieved from https://imagej.nih.gov.
Rose, W. I., & Durant, A. J. (2009). Fine ash content of explosive eruptions. Journal of
Volcanology and Geothermal Research. doi:10.1016/j.jvolgeores.2009.01.010
Rutten, M. G. (1968). The Eruptions of hekla in 1947-1948. Tectonophysics, 6(3), 271.
doi:10.1016/0040-1951(68)90054-1
Sahagian, D. L., & Proussevitch, A. A. (1998). 3D particle size distribution from 2D
observations; stereology for natural applications. Journal of Volcanology and
Geothermal Research(84), 173-196. doi:10.1016/S0377-0273(98)00043-2
Saunders, A. D., Fitton, J. G., Kerr, A. C., Norry, M. J., & Kent, R. W. (1997). The North
Atlantic igneous Provance. In J. M. Coffin (Ed.), Large Igneous Provinces;
Continental, Oceanic and Planetary flood volcanism. Washington D.C.: American
Geophysical Union.
Shea, T. (2009-2016). http://www2.hawaii.edu/~tshea/foams/foamsintro.html. Retrieved
from http://www2.hawaii.edu/~tshea/foams.
88
Shea, T., Houghton, B. F., Gurioli, L., Cashman, K. V., Hammer, J. E., & Hobden, B. J.
(2010, December). Textural studies of vesicles in volcanic rocks: An intergrated
methodology. Journal of Volcanology and Geothermal Research(190), 271-289.
doi:10.1016/j.jvolgeores.2009.12.003
Sheppard, D. S., Janik, C. J., & Keith, T. E. (1992, November). A comparison of gas
geochemistry of fumaroles in the 1912 ash-flow sheet and on active stratovolcanoes,
Katmai National Park, Alaska. Journal of Volcanology and Geothermal Research,
53(1-4), 185-197. doi:10.1016/0377-0273(92)90081-N
Sigmarsson, O., Vlastelic, I., Andreasen, R., Bindeman, I., Devidal, J. L., Moune, S., . . .
Thordarson, T. (2011). Remobilization of silic intrusion by mafic magmas during the
2010 Eyjafjallajökull eruption. In Solid Earth (Vol. 2, pp. 271-281). Copernicus
Publications.
Sigmundsson, F., Hreinsdottir, S., Hooper, A., Árnadóttir, T., Pedersen, R., Roberts, M. J.,
& Feigl, K. L. (2010, November 18). Intrusion triggering of the 2010 Eyjafjallajökull
explosive eruption. Nature, 468, 426-432. doi:10.1038/nature09558
Sobradelo, R. (2015, January 1). Short-term volcanic hazard assessment through Bayesian
inference: retrospective application to the Pinatubo 1991 volcanic crisis. Journal of
Volcanology and Geothermal Research, 290, 1-11.
doi:10.1016/j.volgeores.2014.11.011
Sparks, R. S. (1978). The dynamics of bubble formation and growth in magmas: a review
and analysis. Journal of Volcanology and Geochemistry, 1-38.
Sparks, R. S. (1986, February). The dimensions and dynamics of volcanic eruption columns.
Bulletin of Volcanology, 48(1), 3-15. doi:10.1007/BF01073509
Sparks, R. S. (1997). Causes and consequences of pressurization in lava dome eruptiond.
Earth and Planetary Science Letters, 150, 177-189.
Sparks, R. S. (2003). Dynamics of magma degassing. Geological Society, London, 213, 5-
22. doi:10.1144/GSL.SP.2003.213.01.02
Stevenson, J. (2012, June 6). Distal deposition of tephra from the Eyjafjallajökull 2010
summit eruption. Journal of Geophysical Research, 117, B00C10.
doi:10.1029/2011JB008904
Stowall, W. K., Houghton, B. F., Gonnermann, H., Fagents, S. A., & Swanson, D. A. (2011).
Eruption dynamics of Hawaiian-style fountains: the case study episode 1 of the
Kilauea Iki 1959 eruption. Bulletin of Volcanology, 73, 511-529.
doi:10.1007/s00445-010-0426-z
Sturkell, E., Einarsson, P., Sigmundsson, F., Geirsson, H., Ólafsson, H., Pedersen, R., &
Stefánsson, R. (2006). Volcano geodesy and magma dynamics in Iceland. Journal of
Volcanology and Geothermal Research, 150, 14-34.
doi:10.1016/j.jvolgeores.2005.07.010
Sæmundsson, K. (1979). Outline of the geology of Iceland. Jökull, 29, 7-28.
89
Thordarson, T. (2016, May). Verbal discussion for M.Sc. thesis. (E. Palmadottir,
Interviewer)
Thordarson, T., & Höskuldsson, Á. (2008). Postglacial Volcanismn in Iceland. Jökull(58),
197-228.
Thordarson, T., & Larsen, G. (2007). Volcanism in Iceland in historical time: Volcano types,
eruption styles and eruptive history. Journal of Geodynamics, 43, 118-152.
doi:10.1016/j.jog.2006.09.005
Thordarson, T., Hayward, C., & Höskuldsson, Á. (2011). Sulfur degassing in the April-May
The 2010 summit eruption at Eyjafjallajökull volcano, Iceland. Abstract #5787,
IUGG General Assembly , Melbourne.
Torfason, H., & Jónsson, H. B. (2005). Jarðfræði við norðvestanverðan Mýrdalsjökul.
Reykjavík: Almannavarnir.
Trusdell, F. A., Moore, R. B., Sako, M., White, R. A., Koyanagi, R. C., & Camacho, J. T.
(2005). The 2003 eruption of Anatahan colcano, Commonwealth of the Northern
Mariana Islands: Chronology, volcanology, and deformation. Journal of
Volcanology and Geothermal Research(146), 184-207.
unknown. (2016, March 26). cressington.com. Retrieved from
cressington.com/spec.108a.html.
Unlisted. (2015). http://melts.ofm-research.org/. Retrieved from http://melts.ofm-
research.org/.
Walker, G. P. (1973). Explosive volcanic eruptions -a new classification scheme. Journal of
Earth Sciences, 62(2), 431-446.
Wallace, K. (2016). www.geo.mtu.edu/~raman/Ashfall.html. Retrieved from
www.geo.mtu.edu.
Wallace, P., & Anderson, A. T. (1999). Volatiles in Magmas. In Encyclopedia of Volcanoes
(pp. 149-170). Academic Press.
Watkins, N. D., & Walker, G. P. (1977). Magnetostratigraphy of eastern Iceland. American
Journal of Science, 277, 513-584.
Wilson, C. (2001, December). The 26.5 ka Oruanui eruption, New Zealand: an introduction
and overview. Journal of Volcanology and Geothermal Research, 112(1-4), 133-
174. doi:10.1016/S0377-0273(01)00239-6
Wilson, C. J. (1991). Ash-fall deposits from large-scale phreatomagmatic volcanism:
limitations of available eruption-column models. Seattle: U.S. Geological Survey.
Wohletz, K. (1986). Explosive magma-water interactions. Thermodynamics, explosion
mechanism, and field studies. Bulletin of Volcanology, 48, 245-264.

90
Wright, J. V., & Walker, G. P. (1981). Eruption, transport and deposition of ignimbrite: A
case study from Mexico. Journal of Volcanology and Geothermal research, 9(2-3),
111-131. doi:10.1016/0377-0273(81)90001-9
Zimanowski, B., & Wohletz, K. H. (2000). Physics of Phreatomagmatism. Terra Nostra, 6,
515-523.
Þórarinsson, S. (1970). Heklugosið 1970. Reykjavík: Almenna bókafélagið.
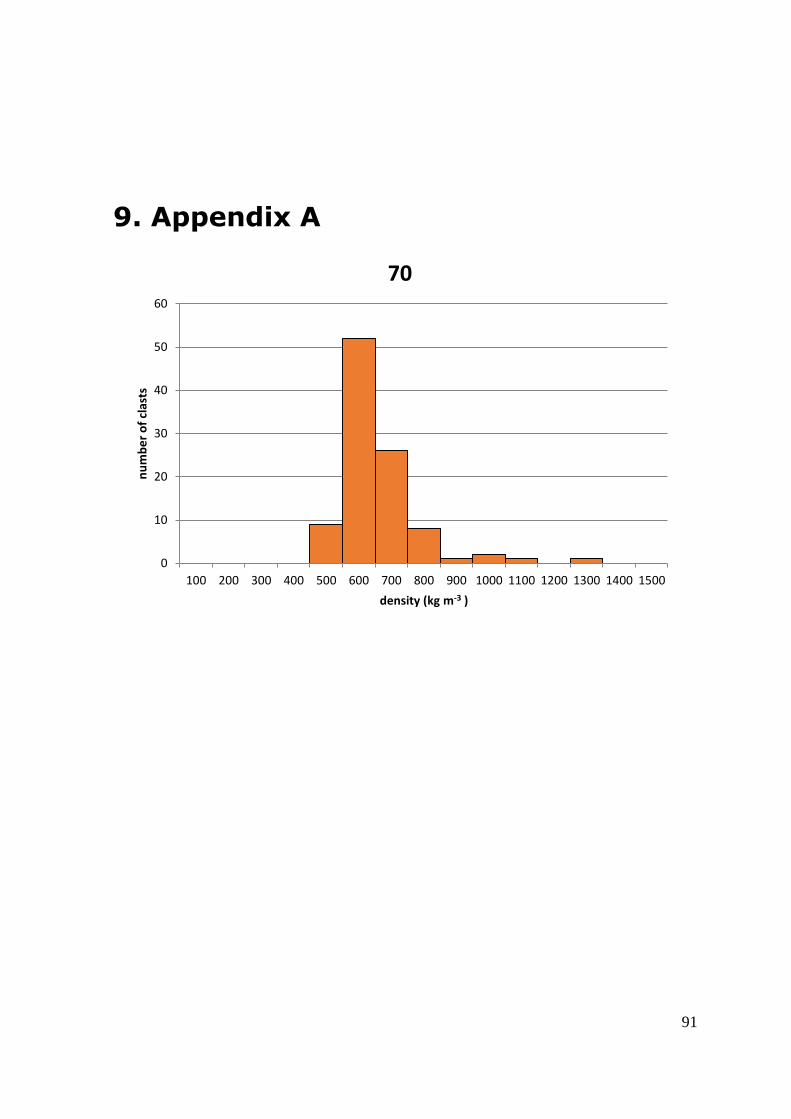
91
9. Appendix A
0
10
20
30
40
50
60
100 200 300 400 500 600 700 800 900 1000 1100 1200 1300 1400 1500
nu
mb
er
of
clas
ts
density (kg m-3 )
70

92
0
2
4
6
8
10
12
100 300 500 700 900 1100 1300 1500 1700 1900 2100 2300 2500
Nu
mb
er
of
clas
ts
Density kg m-3
83
0
5
10
15
20
25
30
100 300 500 700 900 1100 1300 1500 1700 1900 2100 2300 2500
Nu
mb
er
of
clas
ts
Density kg m-3
90

93
0
2
4
6
8
10
12
14
100 400 700 1000 1300 1600 1900 2200 2500
Nu
mb
er
of
clas
ts
Density kg m-3
97
0
5
10
15
20
25
100 300 500 700 900 1100 1300 1500 1700 1900 2100 2300 2500
Nu
mb
er
of
clas
ts
density kg m-3
110