Embed Size (px)
Citation preview

Characterization of Eyjafjallajökull volcanic ashparticles and a protocol for rapid risk assessmentS. R. Gislasona, T. Hassenkamb, S. Nedelb, N. Bovetb, E. S. Eiriksdottira, H. A. Alfredssona, C. P. Hemb, Z. I. Baloghb,K. Dideriksenb, N. Oskarssona, B. Sigfussonc, G. Larsena, and S. L. S. Stippb,1
aInstitute of Earth Sciences, University of Iceland, Sturlugata 7, 101 Reykjavik, Iceland; bNano-Science Center, Department of Chemistry, University ofCopenhagen, 2100 Copenhagen, Denmark; and cReykjavik Energy, Baejarhalsi 1, 110 Reykjavik, Iceland
Edited* by Robert A. Berner, Yale University, New Haven, CT, and approved March 15, 2011 (received for review October 24, 2010)
On April 14, 2010, when meltwaters from the Eyjafjallajökullglacier mixed with hot magma, an explosive eruption sent unu-sually fine-grained ash into the jet stream. It quickly dispersed overEurope. Previous airplane encounters with ash resulted in sand-blasted windows and particles melted inside jet engines, causingthem to fail. Therefore, air traffic was grounded for several days.Concerns also arose about health risks from fallout, because ashcan transport acids as well as toxic compounds, such as fluoride,aluminum, and arsenic. Studies on ash are usually made on materi-al collected far from the source, where it could have mixed withother atmospheric particles, or after exposure to water as rainor fog, which would alter surface composition. For this study, aunique set of dry ash samples was collected immediately afterthe explosive event and comparedwith fresh ash from a later, moretypical eruption. Using nanotechniques, custom-designed forstudying natural materials, we explored the physical and chemicalnature of the ash to determine if fears about health and safetywere justified and we developed a protocol that will serve forassessing risks during a future event. On single particles, we iden-tified the composition of nanometer scale salt coatings and mea-sured the mass of adsorbed salts with picogram resolution. Theparticles of explosive ash that reached Europe in the jet streamwere especially sharp and abrasive over their entire size range,from submillimeter to tens of nanometers. Edges remained sharpeven after a couple of weeks of abrasion in stirred water suspen-sions.
Iceland volcano ∣ European airspace ∣ grain size distribution ∣ atomic forcemicroscopy ∣ X-ray photoelectron spectroscopy
The recent volcanic activity in south Iceland, that began lateevening on March 20, 2010, had been preceded for some
weeks by intense seismic activity and deformation (1). Lava flo-wed from a fissure on the ice-free flank of the Eyjafjallajökullvolcano, but ashfall from its 1-km high plume was insignificant.After a hiatus of about a couple of days, during which earth-quakes signaled rising magma, eruption recommenced earlymorning, April 14, this time from within the caldera, under200–300 m of ice. Jökulhlaups, floods of meltwater, flowed downthe northern and southern slopes and reached the lowlandsaround noon. Roads, infrastructure, and farmlands were de-stroyed but people had been evacuated so there was no loss oflife. This second phase was explosive, sending exceptionallyfine-grained ash almost 10 km through the troposphere, intothe stratosphere (1).
Animals were kept inside or evacuated as plumes blackenedthe Icelandic sky. From April 15, when the very fine ash blew eastand south, airspace closed over most of Europe. Effusion rate wasmaximum during the first 3 d. The ash was gray, trachyandesitic,with 58 mass % silica (Table S1). After April 18, ash productiondecreased by 1–2 orders of magnitude. Composition was essen-tially the same, 57% SiO2, but the ash took on a more typicalcharacter, namely larger particles, black and glassy. During May,a few forceful explosions projected ash to the jet stream andbefore activity decreased on May 23, lava reached halfway to
the glacial outwash plain. The plumes that caused the 7 d air traf-fic disruption resulted directly from the explosive nature of theash, caused by the interaction of magma and water. By aboutApril 20, water flow into the crater and fine ash productionhad ceased, and air traffic returned to normal. Reuters reportedlosses estimated between 1.5 and 2.5 billion € and 10 milliontravelers were affected.
Fears about danger to aircraft arose from an incident when aBritish Airways 747 flew through an ash cloud during the 1982eruption of Mount Galunggung in Indonesia. The pilot reportedsparks from the windows and wings as ash sandblasted all surfacesand all four jet engines failed when melted ash coated their inter-ior (2). Luckily for the 263 passengers and crew, the pilot couldrestart three of the engines after they cooled during descent andhe landed while peeking through a strip a couple of inches wideon the side window that had avoided sandblasting. This eventprovided powerful motivation for the international aviationcommunity.
Ash ingestion and inhalation were also concerns in Iceland andacross Europe. Airborne particles and toxic gases (e.g., SO2, HF)pose respiratory hazards (3, 4). Particles < 10 nm diameter causeirritation on the short term and cancer on the long term. Silicosisis a chronic, often fatal, condition caused by micro- and nanoscaleparticles (3, 5). Health risk from the physical nature of the par-ticles is augmented by condensed salts, acids, and trace elementsand these also threaten surface waters and terrestrial ecosystems(6–10). In Iceland, extensive public education and assistanceminimized danger for people and animals. Across Europe, therewere discussions about the consequence of ash fallout on healthand on climate.
Such extensive airspace closure, completely unprecedented,had a huge economic impact and caused irritation and hardshipfor passengers, their families, and businesses. The general popu-lation felt insecure about health risks. Was it dangerous to inhalethe ash particles? Should nursery schools be closed? Were watersupplies at risk? Had correct decisions been made about airportclosures? Considering the economic costs, will correct decisionsbe made in the future? In general, authorities needed betterinformation about the ash and its effects, but scientific literaturewas unavailable and accepted protocols for characterizing the ashfor making decisions were simply nonexistent.
The purpose of this paper is to provide information aboutthe Eyjafjallajökull ash, from the physical and chemical perspec-tives, and to suggest a protocol consisting of several rapid and
Author contributions: S.L.S.S. planned the project; S.R.G. and H.A.A. collected thesamples; S.R.G. and S.L.S.S. organized the research; T.H, S.N. and N.B. developed methods;S.R.G., T.H., S.N., N.B., E.S.E., H.A.A., C.P.H., Z.I.B., K.D., N.O., B.S., G.L., and S.L.S.S.performed research; S.R.G., T.H., S.N., N.B., E.S.E., H.A.A., C.P.H., Z.I.B., K.D., N.O., B.S.,G.L., and S.L.S.S. intepreted data; and S.L.S.S. wrote the paper.
The authors declare no conflict of interest.
*This Direct Submission article had a prearranged editor.1To whom correspondence should be addressed. E-mail: [email protected].
This article contains supporting information online at www.pnas.org/lookup/suppl/doi:10.1073/pnas.1015053108/-/DCSupplemental.
www.pnas.org/cgi/doi/10.1073/pnas.1015053108 PNAS ∣ May 3, 2011 ∣ vol. 108 ∣ no. 18 ∣ 7307–7312
GEO
LOGY

straightforward analyses that can provide data for judging risksfor aircraft operations and health in the future. To develop thisprotocol, we have gathered information from the methodstraditionally used to investigate tephra (volcanic ash) and com-bined it with observations from nanotechniques. We report onthe size, shape, and hardness (i.e., the ability of the nanoparticlesto put airplanes at risk) as well as the chemical composition of thesalt condensates on the particle surfaces (i.e., the toxic nature ofthe nanoparticles). We used ash that was absolutely fresh andanalyzed immediately, and then after exposure to pure waterand nitric acid, as models for behavior during exposure to rain,fog, and volcanic emissions. We compared two samples, one col-lected April 15, 2010, immediately after the explosive eruptionbegan, and another collected April 27, after glacier water inflowinto the crater had ceased. Both samples were collected andmaintained dry. Most previous studies have examined samplesweeks or years after eruption, or fresh samples but after exposureto rain or fog (11).
Physical Aspects of the Eyjafjallajökull AshThe early ash from the hydromagmatic, explosive phase (termedhere explosive ash, but often referred to as phreato-magmaticash) was surprisingly soft, light, and powdery. It fell absolutelysilently. In the sample bag, the particles were cohesive, the con-sistency of flour. The later, magmatic ash was more typical (calledtypical ash); it was granular with the consistency of dry sand andparticles could be heard falling on hard surfaces. BET (Brunauer,Emmett, Teller, ref. 12) surface area analysis confirmed the dif-ferences. The explosive ash was 4.3 m2∕g; the typical ash was0.45 m2∕g. Electron microprobe (EMPA) backscattered images(Fig. 1A), scanning electron microscopy (SEM), and X-raytomography (XT) showed that explosive ash particles range indiameter from approximately 300 μm to a few tens of nan-ometers, whereas the typical ash completely lacks the smalldiameter fraction (Fig. 1B). The explosive ash was also remark-able in its abundance of tiny particles attached to largergrains (Figs. 2A and 3A). Even after extensive abrasion in water(solid∶liquid ¼ 1∶1;000), much of this very fine material re-mained (Figs. 2B and 3B) and some grains were still entirelycomposed of aggregated nanoparticles (Fig. 2C). Atomic forcespectroscopy (AFS) explains why; the surfaces are particularlyadhesive (Fig. 2 D–F).
The explosive ash was bimodal in size distribution with peaksat about 25- and 200-μm diameter (Fig. 1C; >250 μm, dry sieving;<250 μm, laser absorption from dry air suspension). For thetypical ash, diameter peaked at approximately 500 μm. At least20 mass % of the explosive ash was <10 μm, the inhalation risk
limit. SEM and atomic force microscopy (AFM) demonstratethat particle size analysis underestimates the total <10-μm frac-tion because the resolution limit is approximately 1.8 μm, and asignificant portion of nanoparticles adhere on or aggregate aslarger particles. For more typical ash, the <10-μm fraction is<2 mass %, with much smaller surface area, consistent with pre-vious studies of Icelandic ash that had not reacted to form sec-ondary minerals (13) and samples collected from other sites.Explosive volcanic ash particles, smaller than 100 μm and notcontaining hydrothermal phases, from five volcanoes (posterup-tion age from 6 to 37 y) had surface area of 1–2 m2∕g (14), whichis the same range as for three samples from another study (20 and30 y and 11 My old; ref. 15). Only 10% of the ash from MountSaint Helens was <10 μm but 13–20% of ash from SoufrièreHills, Monserat was in the dangerous range, with considerablecristobalite (16). Submicrometer scale quartz is more dangerousthan generic volcanic ash and cristobalite is twice as hazardous asquartz (16). In the Eyjafjallajökull ash, there was very littlequartz, and cristobalite was not detected.
The exceptionally fine nature of the early ash was a directresult of its explosive origin. Glacial meltwater chilled the mag-ma, promoting strain disintegration. Shock waves from steamexplosions caused mechanical fragmentation and oxidation bysteam increased magma liquidus temperature, causing expulsionof dissolved volatiles during cooling, further fracturing the parti-cles. On the ground beneath the plume center, airborne materialwas so dense that sunlight was blocked; here, particles weresmallest, linking explosiveness with grain size. The extremely finenature and the explosive ejection to the stratosphere led directlyto long-range transport. In a dispersing plume, particles <63-μmdiameter can remain suspended for days (17, 18), allowing ashto reach Russia and the Mediterranean.
EMPA (Fig. 1A) and SEM (Figs. 2 A–C and 3 A and B) showthe asperity of the explosive ash. Even the nanoparticles are farfrom round. Their sharpness makes them particularly abrasive.We tested if exposure to water, such as rain or fog, could roundthem by stirring them vigorously in water for a couple of weeks.They remained sharp. Sandblasting studies prove that shape is animportant factor in abrasion, even more important than mass.The speed with which an airplane would interact with a plumeof very fine-grained ash would ensure that even nanoparticleswould have the necessary momentum to wear surfaces, especiallyparticles that are sharp and hard.
The hardness of a particle is determined by its composition andcrystal structure. EMPA and X-ray diffraction (XRD) demon-strated that Eyjafjallajökull ash is dominated by andesitic glass,which has Mohs scale hardness of about 5.5–6, and crystals of
Fig. 1. Particle size and shape (EMPA backscattered electron images; both same scale) for (A) the explosive ash, (B) typical ash, and (C) particle size distribution.The explosive ash particles are sharp, even at nanometer scale.
7308 ∣ www.pnas.org/cgi/doi/10.1073/pnas.1015053108 Gislason et al.

plagioclase, pyroxene, and olivine, with hardness of 6, 7, and 6.5.The ash particles are much harder than the exposed parts on anairplane: glass windows, aluminum, epoxy, and paint. Indeed,paint is usually removed from airplanes by jets of wheat starch
or polyacrylate to avoid damage. Clearly ash particles are harderand sharper—enough to turn a pilot’s window opaque. The Ey-jafjallajökull glass softens at approximately 890 °C and melting iscomplete at 1,147 °C. Pyroxene melts at approximately 1;100 °C,plagioclase at around 1;200 °C, and olivine at about 1;400 °C (19).Thus, the ash would easily melt in a jet engine, which reachestemperatures of 1,500–2,000 °C (20, 21). The smaller the parti-cles, the more easily they melt, creating fine droplets that con-dense on cooler engine parts.
Surface Composition of the Eyjafjallajökull AshThe bulk composition for the explosive and typical ash was thesame (Table S1), but their surface composition was vastly differ-ent (Table 1). X-ray photoelectron spectroscopy (XPS), whichcollects information from the top 10 nanometers of a solid, showsthat surface salts, clearly present initially, dissolve in distilledwater and dilute HNO3. Knowing surface composition makesit possible to estimate which salts condensed from the volcanicgases, which has not previously been possible. Indeed, Withamet al. (22) stated in their review that volatile condensation pro-cesses are not well understood.
The relative concentration (element %) of surface salts,particularly Cl and F, is lower on the explosive ash (Table 1)because the volume of volatiles available for condensationwas lower during the initial eruptions. Instead of being ejectedinto the plume, the volatiles were dissolved in the meltwaterand transported away as solutes. Total dissolved concentrationsfor F, Al, Fe, Mn and Br in the floodwaters on April 14 werehigh, well above EU drinking water standards. After exposureto water, the typical ash had higher surface concentration ofSi and O, elements indicative of the bulk; removal of surfacecondensates brought the bulk particle into XPS range. In con-trast, composition change after rinsing the explosive ash wasminimal, consistent with a much thinner layer of surface salts.Treatment with 10−3 M HNO3 further removes surface material,particularly F. The increase in surface C, called adventitious car-bon, results from hydrocarbon contamination that comes fromair or solution and is normal for samples exposed to ambientconditions (23).
Fig. 2. (A–C) SEM images of (A) fresh explosive ash; edges are sharp, even on the adhering nanoparticles; (B) after stirring in pure water for 90 min; edges arestill sharp and particles still adhere; (C) nanoparticles remain aggregated even after stirring, suggesting they are sintered. (D–F) AFS maps of thesurface of one particle, such as that shown in A, constructed from data from 10;000 force∕distance curves, collected using a standard silicon tip; (D) imagerepresenting topography frommaximum force data (dark marks the smooth particle surface) with adhering nanoparticles (closer to the observer, lighter color);(E) the same area constructed with adhesion force data; the large particle surface (pink to red) is most adhesive, black represents the middle adhesion range,and the adhering particles (blue) are not sticky; (F) the same area showing elasticity; the surface (green to pale blue) is most elastic and the particles (dark blue)are rigid. Hassenkam et al. (37) explain AFS in more detail.
Fig. 3. An explosive ash particle glued to an AFM cantilever (A) fresh and(B) after exposure to water for a total of 45 s; particles remain attached while(C) salt is lost. The tiny mass gain (approximately 4 pg) results when the epoxyabsorbs water. SEM images of (D) a fresh, typical ash particle with layers androunded salt condensates; (E) the surface of another particle before, and(F) the same site after exposure to water; material has been removed onthe terraces above and below the step edge. A slightly different angle ofview for E and F produces slight distortion.
Gislason et al. PNAS ∣ May 3, 2011 ∣ vol. 108 ∣ no. 18 ∣ 7309
GEO
LOGY
In water–ash mixtures, pH remained relatively constant(Table S2); it was slightly basic for the explosive ash (pH ∼ 8),typical of waters at equilibrium with basalt, suggesting negligibleacidic gas condensate. Protons from solution exchange rapidlywith surface cations of glass and minerals (24), but if proton saltsare abundant, pH is low, as was reported for Mount Hekla ash(25) and as we observed for the typical ash (pH ∼ 5).
SEM images of glassy particles from the typical ash showlayers and rounded nanoparticles (Fig. 3D) that disappear afterexposure to solution. Layers of salts (Fig. 3E) are eroded aswater dissolves them (Fig. 3F). Even on the surfaces of theexplosive ash, submicrometer scale AFM imaging shows smooth,flat salt layers (Fig. 4A) that dissolved during exposure to waterfor 24 h and small, secondary minerals formed (Fig. 4B).Geochemical speciation modeling of the leachates (PHREEQC;ref. 26) suggests these features to be Fe(III) oxides, probablygoethite, which forms from Fe(II) released from the ash incontact with oxygen.
In leachate experiments, typical ash surfaces give up Ca, Al,and Fe(II) and if pH is high, CO2 enters from air (Table S2).The water∶ash ratio was high (597–1,006) to minimize secondarymineral formation. Surface salts dissolve rapidly, after <15 min(Table S2). Salt release rate, estimated from Cl, SO4, and F con-centrations, was approximately 10−6.3, 10−7, and 10−7.6 mol∕m2 s,several orders of magnitude lower than expected for pure halite,gypsum, or fluorite (27, 28), confirming the presence of theseelements in other, less soluble minerals. Release rate was fasterthan for glass and olivine (29, 30), even considering enhancement
by F (31). Combining information from surface composition, spe-ciation modeling, and known volcanic fumarole incrustation andevaporite minerals (32, 33) provides estimates of the surface con-densates (Table S3). We can also use the data to estimate averagethickness of salt layers: approximately 0.6 nm for the explosiveash and approximately 4 nm for the typical ash. Calculationsconfirmed undersaturation in the leachates for all common vol-canic salts, primary minerals, and glasses. All data are consistentwith the presence of epsomite, MgSO4 · 7H2O; scacchite, MnCl2;melanterite, FeSO4 · 7H2O; Na-metaborate, NaBO2; Na-ortho-phosphate, Na3PO4; ralstonite, NaMgAlF4ðOHÞ2 · ðH2OÞ; hier-atite, K2SiF6; malladrite, Na2SiF6; thenardite, Na2SO4 · 10H2O;arkanite, K2SO4; halite, NaCl; and antarcite, CaCl2 · 6H2O(Table S3).
An interesting question is how much mass is available forrelease from the salts of an ash plume, if they are rinsed awayby rain or if the ash falls into lakes, rivers, or the ocean. It isnot possible to determine the difference in mass before and afterexposure to water, because the change is smaller than the errorintroduced by loss during filtration or centrifugation. A simpleestimate from the bulk dissolved concentration data (Tables S2and S3) gives an overall average (0.5% and 0.2% for the explosiveand typical ash), but it is not possible to know if the solution datarepresent salts rinsed from the surface, from dissolution of theash itself, from precipitation of secondary minerals, or from somecombination. Instead, we developed a method that provides massloss directly from a single particle, within tens of seconds, atpicogram (pg; 10−12 g) resolution.
Fig. 3 shows an AFM cantilever, to which a single particle ofexplosive ash had been glued. Oscillation of the cantilever beforeand after particle mounting provides total, initial particle mass.The particle-glue-cantilever assembly was exposed to 3 mL ofpure water for 15 s, then dried and oscillated again. Each rinsewas made in a fresh water aliquot to minimize secondary mineralprecipitation and each rinse-dry-oscillate cycle gave one datumon Fig. 3C. After only a few seconds, the salts were released. Massloss was 35 pg, 0.4% of the total initial mass, which corresponds toabout 10–20-nm thickness (assuming a salt density of about2.7 g∕cm3). Typical ash particles (such as Fig. 5D) are so exten-sively covered with salts that, in five experiments, the epoxy couldnever make contact with the particle, so after 10 s exposure towater, salt dissolved and the particles detached. Sometimes saltremnants could be seen on the cantilever. One such remnant(Fig. 5B) weighed approximately 6 pg, and dissolved in littleover a minute at a rate of approximately 40 femtograms per sec-ond (fg/s; 10−15 g∕s). The fragment, which probably does notrepresent the full salt thickness, was about 300-nm thick.
Volcanic gases that condense on ash particles reach the groundsooner than if they remain airborne, but not all volatiles adsorb tothe same degree or at the same temperature, so the concentra-tions measured in leachates do not represent volatile compositionand can be misleading if the volcanic gases react with the ash.
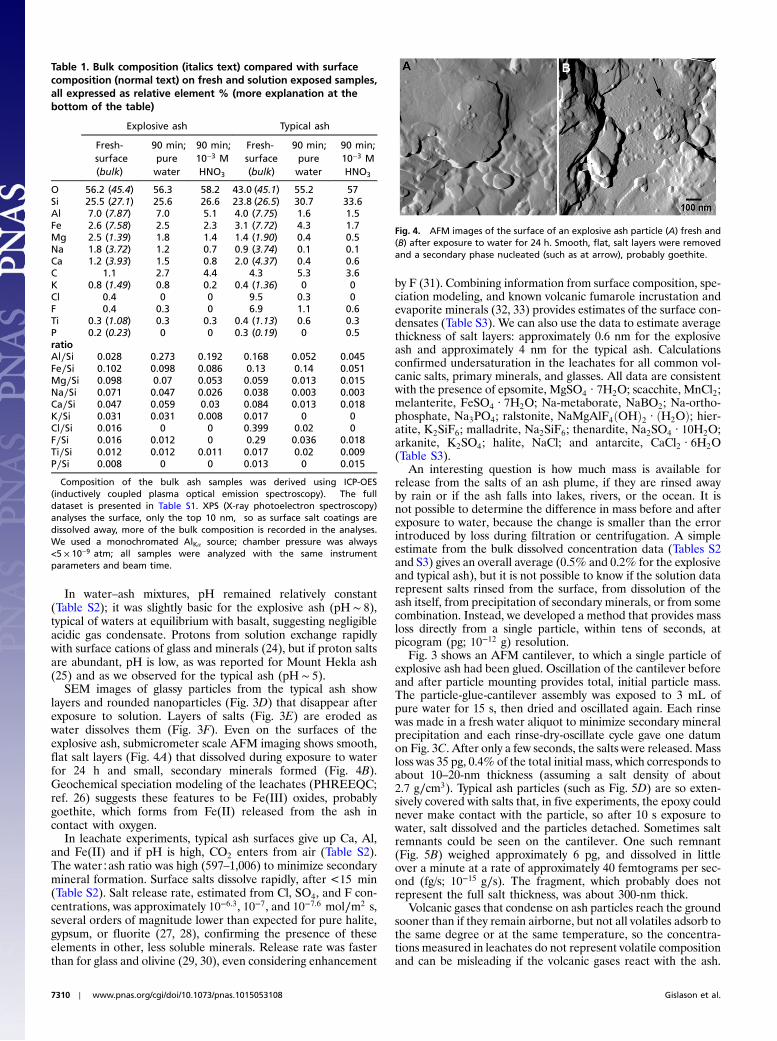
Table 1. Bulk composition (italics text) compared with surfacecomposition (normal text) on fresh and solution exposed samples,all expressed as relative element % (more explanation at thebottom of the table)
Explosive ash Typical ash
Fresh-surface(bulk)
90 min;purewater
90 min;10−3 MHNO3
Fresh-surface(bulk)
90 min;purewater
90 min;10−3 MHNO3
O 56.2 (45.4) 56.3 58.2 43.0 (45.1) 55.2 57Si 25.5 (27.1) 25.6 26.6 23.8 (26.5) 30.7 33.6Al 7.0 (7.87) 7.0 5.1 4.0 (7.75) 1.6 1.5Fe 2.6 (7.58) 2.5 2.3 3.1 (7.72) 4.3 1.7Mg 2.5 (1.39) 1.8 1.4 1.4 (1.90) 0.4 0.5Na 1.8 (3.72) 1.2 0.7 0.9 (3.74) 0.1 0.1Ca 1.2 (3.93) 1.5 0.8 2.0 (4.37) 0.4 0.6C 1.1 2.7 4.4 4.3 5.3 3.6K 0.8 (1.49) 0.8 0.2 0.4 (1.36) 0 0Cl 0.4 0 0 9.5 0.3 0F 0.4 0.3 0 6.9 1.1 0.6Ti 0.3 (1.08) 0.3 0.3 0.4 (1.13) 0.6 0.3P 0.2 (0.23) 0 0 0.3 (0.19) 0 0.5ratioAl∕Si 0.028 0.273 0.192 0.168 0.052 0.045Fe∕Si 0.102 0.098 0.086 0.13 0.14 0.051Mg∕Si 0.098 0.07 0.053 0.059 0.013 0.015Na∕Si 0.071 0.047 0.026 0.038 0.003 0.003Ca∕Si 0.047 0.059 0.03 0.084 0.013 0.018K∕Si 0.031 0.031 0.008 0.017 0 0Cl∕Si 0.016 0 0 0.399 0.02 0F∕Si 0.016 0.012 0 0.29 0.036 0.018Ti∕Si 0.012 0.012 0.011 0.017 0.02 0.009P∕Si 0.008 0 0 0.013 0 0.015
Composition of the bulk ash samples was derived using ICP-OES(inductively coupled plasma optical emission spectroscopy). The fulldataset is presented in Table S1. XPS (X-ray photoelectron spectroscopy)analyses the surface, only the top 10 nm, so as surface salt coatings aredissolved away, more of the bulk composition is recorded in the analyses.We used a monochromated AlKα source; chamber pressure was always<5 × 10⁻⁹ atm; all samples were analyzed with the same instrumentparameters and beam time.
Fig. 4. AFM images of the surface of an explosive ash particle (A) fresh and(B) after exposure to water for 24 h. Smooth, flat, salt layers were removedand a secondary phase nucleated (such as at arrow), probably goethite.
7310 ∣ www.pnas.org/cgi/doi/10.1073/pnas.1015053108 Gislason et al.

High concentrations of adsorbed elements such as F, As, heavymetals, and Al are toxic to organisms and plants (9, 25), whereasK, PO4, N, Fe, and Si are nutrients (11), especially for marineplankton. The XPS surface composition allows us to say thatthe explosive ash that fell over southern Iceland and that reachedEurope, as well as the typical, glassy ash, had hazardous F con-centrations. Abundant fluoride on vegetables or in drinking wateris of particular concern because high concentrations cause painfulbone disorders. Fluoride was clearly associated with significantloss of life during the Laki eruption in the late 1700’s, when50% of Iceland’s livestock perished, mainly from fluoride poison-ing (34–36).
ImplicationsThe ash from the initial, explosive stage was very fine grained andwas ejected more than 9-km high, so it traveled far. The verysharp, hard particles put aircraft at risk from abrasion on windowsand body and from melting in jet engines. In the lab, ash particlesdid not become less sharp during 2 wk of stirring in water, soairborne particles would remain sharp even after days of interac-tion with each other and water in clouds. Thus, concerns for airtransport were well grounded.
Ashfalls in Iceland were certainly hazardous for inhalation andingestion by grazing animals where particle density was high, butby the time the plume reached Europe, dispersion had signifi-cantly decreased density. Although much of the material thatreached Europe was <10 μm, thus in the hazardous range, longterm exposure to air with concentrations higher than thoseexperienced would be required for a real health risk. About0.5 mass % of the explosive ash was soluble.
From the results of this study, we can recommend a protocolfor rapidly assessing risk from volcanic ash in the future. Size,shape, and hardness are the key parameters for estimating ashabrasiveness, to determine risk for aircraft. BET surface areameasurements allow a fast estimate of relative particle size; SEMprovides pictures where the range of particle diameter and shapecan be observed; and XRD gives mineral composition, fromwhich hardness and melting temperatures can be derived. Thesetechniques are standard and widely available in Earth sciencelaboratories. Together with estimates of the mass of ash pro-duced, plume height, grain size distribution, and the dispersionrate, these data would provide input for modeling to predict the
hazard level for aircraft and the transport extent for assessinginhalation risks. For collecting additional parameters, such asthose necessary for decisions about chemical toxicity, we recom-mend standard leaching tests supplemented by XPS surface ana-lysis on fresh, water exposed, and nitric acid exposed samples.XPS is a routine technique in materials science laboratories.Definition of elemental identity and concentration for the saltscondensed on ash particles and their relative solubility takes lessthan a day per sample. These data, with particle size and flux,would allow estimation of toxicity for inhalation and ingestion.The effect of ash on albedo, such as for provoking climate in-stabilities, and fertilization of the oceans are longer term issueswhere rapid decisions are not necessary.
Materials and MethodsWe collected explosive ash on the ground at 12:30 PM GMT, April 15, 2010,approximately 55 km east of the crater. The ash was approximately 2-mmthick and had fallen during the previous hours. At the time of sampling,the plume was moving north, away from the site. The typical ash was col-lected about 10 km northwest of the summit crater on a clean plastic sheet(5 × 21 ft) as it fell from the plume on April 27, from 9:20 AM to 2:30 PMGMT.None of the material had been exposed to fog or rain. Fresh ash is hygro-scopic, so samples were analyzed immediately, in some cases within a dayor two. Samples were taken from the internal volume of the sample bags,to ensure minimal exposure to humidity. For long-term storage, sampleswere kept in desiccators.
Polished sections for EMPA were prepared by standard procedures,embedding the ash in epoxy and coating with carbon. SEM samples wereexamined without conductive coating so they could be returned to experi-ments for further reaction. For grain size distribution, the >250-μm fractionwas sieved and the ≤250-μm fraction was measured using laser absorptionin a dry dispersion, created using vibration, differential pressure, and air.The lower detection limit was 1.8 μm.
The leaching experiments were made in open polypropylene beakerswhere approximately 0.1 g ash was reacted with 100 mL doubly deionized(MilliQ) water that was stirred just enough to put the solid into suspensionand then left to settle. Reaction times ranged from 4 to 85 min. Leachatewas separated using 0.2 μm cellulose acetate filters. Major and some minoror trace elements were analyzed using ion chromatography (IC) and induc-tively coupled plasma optical emission spectroscopy (ICP-OES). The leachingprocedure was adapted slightly to prepare samples for XPS analysis. Dry ash(50 mg) was mixed with 50 g of either MilliQ water (initial pH ¼ 5.7� 0.1), asa model for rain or runoff water, or 10−3 M HNO3 (initial pH ¼ 3� 0.05), as amodel for acidic volcanic emissions, and placed in 50 mL polypropylene cen-trifuge tubes. The tubes were constantly agitated on a shaker table (175 rpm)for 90 min, then twice centrifuged (5 min at 4;500 × g) to remove thesupernatant. The remaining solids were dried for a day in a glove box(98% N2, 2% H2).
XPS samples were prepared by pressing ash into 3-mm diameter, 2-mmdeep cavities on stainless steel stubs and introduced into the analytical cham-ber when load lock pressure reached approximately 5 × 10⁻⁷ Torr. Spectrawere collected using monochromated AlKα (1,486.6 eV, 150 W) radiation.The analytical chamber base pressure was 5 × 10⁻¹⁰ Torr and never exceeded5 × 10−9 Torr during the experiments. The scan procedure was identical for allsamples to ensure comparability and no evidence of beam damage could befound. Data were treated with commercial software, CasaXPS, using Shirleybackground correction.
AFM and AFS data were collected using an Asylum MFP3D optimizedfor force∕volume analysis. We used DanLim 334 epoxy cured for 24 h, forattaching the single ash particles to standard silicon cantilevers. Picogrammass-loss experiments are very tricky; we made about 10 experiments toensure reproducibility.
ACKNOWLEDGMENTS. Thanks to Matthias Schroter, Max Planck Göttingen fortomography; Keld West and Kim Dalby, NanoGeoScience, Copenhagen,for BET analyses; Helene Almind, Alfons Berger, Hector Diaz, Klaus Qvortrup,Nicole MacDonald, and Andrew Burrows for help and access to equipment;Domenik Wolff-Boenisch, Snorri Gudbrandsson, Ármann Höskuldsson, andReynir Ragnarsson from the Iceland team for technical help; and Bob Bernerand two anonymous reviewers. Funding was provided by the IcelandicGovernment and the Institute of Earth Sciences, Reykjavik, and the Nano-GeoScience laboratory was founded with a grant from the Danish NationalResearch Council.
Fig. 5. SEM image of (A) a fresh particle of typical ash glued to an AFM tipwith epoxy; salt layers and rounded condensates are visible. After exposureto water, salt dissolved and the particle fell from the cantilever, leaving (B) asmall fragment of salt behind; its mass was approximately 6 pg. (C) After 100 sin water, the salt completely dissolved, leaving (D) only epoxy.
Gislason et al. PNAS ∣ May 3, 2011 ∣ vol. 108 ∣ no. 18 ∣ 7311
GEO
LOGY

1. Gudmundsson MT, et al. (2010) Eruptions of Eyjafjallajökull volcano. Eos 91:190–191.2. Moody E (2004) Gliding a B747 out of volcanic ash. Proceedings of the Second Inter-
national Conference on Volcanic Ash and Aviation Safety, June 21–24, 2004 (Office ofthe Federal Coordinator for Meteorological Services and Supporting Research, SilverSpring, MD).
3. Horwell CJ, Baxter PJ (2006) The respiratory health hazards of volcanic ash: A reviewfor volcanic risk mitigation. Bull Volcanol 69:1–24.
4. Fubini B, Fenoglio I (2007) Toxic potential of mineral dusts. Elements 3:407–414.5. Baxter PJ, et al. (1999) Cristobalite in volcanic ash of the Soufriere Hills Volcano,
Montserrat, British West Indies. Science 283:1142–1145.6. Cronin SJ, Hedley MJ, Neall VE, Smith RG (1998) Agronomic impact of tephra fallout
from the 1995 and 1996 Ruapehu volcano eruptions, New Zealand. Environ Geol34:21–30.
7. Cronin SJ, Neall VE, Lecointre JA, Hedley MJ, Loganathan P (2003) Environmentalhazards of fluoride in volcanic ash: A case study from Ruapehu volcano, New Zealand.J Volcanol Geotherm Res 121:271–291.
8. Mather T, Pyle DM, Oppenheimer C (2003) Volcanism and the Earth’s Atmosphere, edsA Robock and C Oppenheimer (Am Geophysical Union, Washington, DC), pp 189–212.
9. Kockum PCF, Herbert RB, Gislason SR (2006) A diverse ecosystem response to volcanicaerosols. Chem Geol 231:57–66.
10. Flaathen TK, Gislason SR (2007) The effect of volcanic eruptions on the chemistry ofsurface waters: The 1991 and 2000 eruptions of Mt. Hekla, Iceland. J VolcanolGeotherm Res 164:293–316.
11. Jones MT, Gislason SR (2008) Rapid releases of metal salts and nutrients following thedeposition of volcanic ash into aqueous environments. Geochim Cosmochim Acta72:3661–3680.
12. Brunauer S, Emmett PH, Teller E (1938) Adsorption of gases in multimolecular layers.J Am Chem Soc 60:309–319.
13. Wolff-Boenisch D, Gislason SR, Oelkers EH, Putnis CV (2004) The dissolution rates ofnatural glasses as a function of their composition at pH 4 and 10.6, and temperaturesfrom 25 to 74 degrees C. Geochim Cosmochim Acta 68:4843–4858.
14. Delmelle P, Villieras F, Pelletier M (2005) Surface area, porosity and water adsorptionproperties of fine volcanic ash particles. Bull Volcanol 67:160–169.
15. Riley CM, Rose WI, Bluth GJS (2003) Quantitative shape measurements of distalvolcanic ash. J Geophys Res 108:2504.
16. Baxter PJ (2005) Volcanoes and the Environment, eds J Marti and GG Ernst (CambridgeUniv Press, Cambridge, UK), pp 273–303.
17. Bursik MI, Sparks RSJ, Gilbert JS, Carey SN (1992) Sedimentation of tephra by volcanicplumes. 1. Theory and its comparison with a study of the Fogo-A plinian deposit,So-miguel (Azores). Bull Volcanol 54:329–344.
18. Durant A, Bonadonna C, Horwell CJ (2010) Atmospheric and environmental impacts ofvolcanic particulates. Elements 6:235–240.
19. Ghiorso MS, Sack RO (1995) Chemical mass transfer in magmatic processes. IV. Arevised and internally consistent thermodynamic model for the interpolation andextrapolation of liquid-solid equilibria in magmatic systems at elevated temperaturesand pressures. Contrib Mineral Petrol 119:197–212.
20. Hünecke K (1997) Fundamentals of Theory, Design and Operation (Airlife, Shrewsbury,UK) p 241.
21. Soares C (2007) Gas Turbines: A Handbook of Air, Land and Sea Application (Butter-worth-Heinemann, Oxford) p 776.
22. Witham CS, Oppenheimer C, Horwell CJ (2005) Volcanic ash-leachates: A review andrecommendations for sampling methods. J Volcanol Geotherm Res 141:299–326.
23. Stipp SL, Hochella MF (1991) Structure and bonding enviroments at the calcite surfaceas observed with X-ray photoelectron-spectroscopy (XPS) and low energy diffraction(LEED). Geochim Cosmochim Acta 55:1723–1736.
24. Oelkers EH, Gislason SR (2001) The mechanism, rates and consequences of basalticglass dissolution: I. An experimental study of the dissolution rates of basaltic glassas a function of aqueous Al, Si and oxalic acid concentration at 25 degrees C andpH ¼ 3 and 11. Geochim Cosmochim Acta 65:3671–3681.
25. Frogner P, Gislason SR, Oskarsson N (2001) Fertilizing potential of volcanic ash in oceansurface water. Geology 29:487–490.
26. Parkhurst DL, Appelo CAJ (1999) User’s guide to PHREEQC (Ver. 2). A ComputerProgram for Speciation, Batch-Reaction, One-Dimensional Transport, and InverseGeochemical Calculations, US Geol Surv Water Resour Invest Rep 99-4259.
27. Alkattan M, Oelkers EH, Dandurand JL, Schott J (1997) Experimental studies of halitedissolution kinetics. 1. The effect of saturation state and the presence of trace metals.Chem Geol 137:201–219.
28. Raines MA, Dewers TA (1997) Mixed transport reaction control of gypsum dissolutionkinetics in aqueous solutions and initiation of gypsum karst. Chem Geol 140:29–48.
29. Gislason SR, Oelkers EH (2003) Mechanism, rates, and consequences of basalticglass dissolution: II. An experimental study of the dissolution rates of basaltic glassas a function of pH and temperature. Geochim Cosmochim Acta 67:3817–3832.
30. Pokrovsky OS, Schott J (2000) Kinetics and mechanism of forsterite dissolution at 25degrees C and pH from 1 to 12. Geochim Cosmochim Acta 64:3313–3325.
31. Wolff-Boenisch D, Gislason SR, Oelkers EH (2004) The effect of fluoride on the dissolu-tion rates of natural glasses at pH 4 and 25 degrees C. Geochim Cosmochim Acta68:4571–4582.
32. Stoiber RE, Rose WI (1974) Fumarole incrustations at active Central Americanvolcanoes. Geochim Cosmochim Acta 38:495–516.
33. Doner HE, Lynn WC (1989) Minerals in Soil Enviroments, eds JB Dixon and SB Weed(Soil Science Soc of Am, Madison, WI), 2nd Ed,, pp 331–378.
34. Thorarinsson S (1969) The Lakagigar eruption of 1783. Bull Volcanol 33:910–929.35. Grattan JP, Charman DJ (1994) Non-climatic factors and the environmental impact of
volcanic volatiles: Implications of the Laki Fissure eruption of AD 1783. Holocene4:101–106.
36. Steingrimsson J, Kunz K (1998) Fires of the Earth, The Laki eruption 1783–1784 (Univ ofIceland Press, Reykjavik, Iceland) p 96.
37. Hassenkam T, Skovbjerg LL, Stipp SLS (2009) Probing the intrinsically oil-wet surfacesof pores in North Sea chalk at subpore resolution. Proc Natl Acad Sci USA106:6071–6076.
7312 ∣ www.pnas.org/cgi/doi/10.1073/pnas.1015053108 Gislason et al.