Embed Size (px)
Citation preview
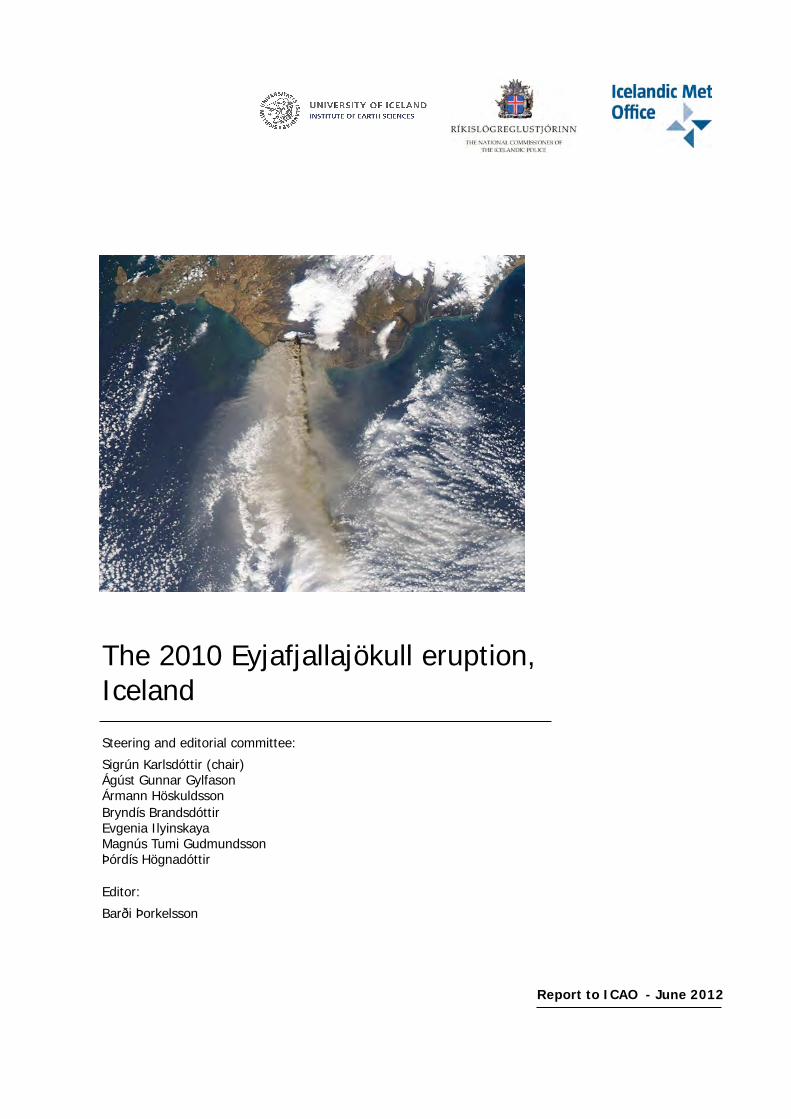
The 2010 Eyjafjallajökull eruption, Iceland
Steering and editorial committee:
Sigrún Karlsdóttir (chair) Ágúst Gunnar Gylfason Ármann Höskuldsson Bryndís Brandsdóttir Evgenia Ilyinskaya Magnús Tumi Gudmundsson Þórdís Högnadóttir
Editor:
Barði Þorkelsson
Report to ICAO - June 2012
List of authors Ágúst Gunnar Gylfason, NCIP-DCPEM – (ÁGG) Ármann Höskuldsson, IES – (ÁH) Árni Sigurðsson, IMO – (ÁS) Benedikt G. Ófeigsson, IMO – (BGÓ) Bergþóra S. Þorbjarnardóttir, IMO – (BSÞ) Bolli Pálmason, IMO – (BP) Bryndís Brandsdóttir, IES – (BB) Einar Kjartansson, IMO – (EK) Esther Hlíðar Jensen, IMO – (EHJ) Evgenia Ilyinskaya, IMO – (EI) Eydís S. Eiríksdóttir, IES – (ESE) Eyjólfur Magnússon, IES – (EM) Freysteinn Sigmundsson, IES – (FS) Guðrún Larsen, IES – (GL) Guðrún Pálsdóttir, IMO – (GP) Guðrún Nína Petersen, IMO – (GNP) Guðrún Sverrisdóttir, IES – (GSv) Gunnar B. Guðmundsson, IMO – (GBG) Gunnar Sigurðsson, IMO – (GS) Halldór Björnsson, IMO – (HB) Hróbjartur Þorsteinsson, IMO – (HÞ) Inga Dagmar Karlsdóttir, IMO – (IDK) Ingibjörg Jónsdóttir, IES – (IJ) Jóhanna M. Thorlacius, IMO – (JMTh) Jón Kristinn Helgason, IMO – (JKH) Kristín Hermannsdóttir, IMO – (KH) Magnús Tumi Guðmundsson, IES – (MTG) Matthew J. Roberts, IMO – (MJR) Olgeir Sigmarsson, IES – (OS) Óðinn Þórarinsson, IMO – (ÓÞ) Rósa Ólafsdóttir, IES – (RÓ) Rikke Pedersen, IES – (RP) Sigrún Hreinsdóttir, IES – (SHr) Sigrún Karlsdóttir, IMO – (SK) Sigurlaug Gunnlaugsdóttir, IMO – (SG) Sigurlaug Hjaltadóttir, IMO – (SHj) Steinunn S. Jakobsdóttir, IMO – (SSJ) Sibylle von Löwis, IMO – (SvL) Theodór Freyr Hervarsson, IMO – (TFH) Þórdís Högnadóttir, IES – (ÞH) Þórður Arason, IMO – (ÞA)
© Icelandic Meteorological Office – Bústaðavegur 7-9 IS 150 Reykjavik, Iceland ISBN 978-9979-9975-4-2 Cover photo: 2010 April 17, 13:17. © Modis/NASA
(4 pages) IVATF.4.IP
Agenda I
1. IN
1.1 disruptionwinds toweruption obetween tlasted untdisturbancEyjafjallajaviation swith delaymillions o
1.2 ambitiousmitigate tMeteorolo
P.003.8.en.docx
INTERN
Item 8: Any o
REPORT
The IcelUniversitManagemcompiledincludes detailed omain find
NTRODUCT
The en to aviation ward Europe on the northethe ice caps otil 12 April. ce to aviatio
ajökull on 14 since the Secoys and flight of travellers w
In ords program unthe effect of vogical Office
NATIONA
other busines
T ON THE 2
(Prese
landic Meteoty of Iceland ment of the d this report
information overview on dings and less
TION
eruptions of as ash from and the Nort
east flank of of EyjafjallajIt produced aon. The largApril and lasond World Wcancellations
were affected
der to draw ndertaken by volcanic erup(IMO), ICA
AL VOLCA
FOUR
Montréal,
ss
010 EYJAFJ
ented by Icela
SU
orological Ofand the DepNational Coon the Eyjaon the geopthe eruption
son learned.
the Eyjafjallthe April-M
th Atlantic arthe volcano,
ökull and Mýa small lava
ger explosivested 39 days,
War, as airspas occurring reall over the w
lessons fromthe Internatio
ptions on the AO approved
ANIC ASH
TH MEETIN
13 to 15 Jun
JALLAJÖKU
andic Meteoro
UMMARY
ffice, Institutartment of C
ommissioner afjallajökull physical mon, analysis of
lajökull volcMay summit e
rea. Activity , at a 2 km wýrdalsjökull. flow and mi
e eruption buntil 22 May
ace over largeepeatedly untiworld.
m this event, onal Volcanicaviation comin November
H TASK FO
NG
ne 2012
ULL ERUPT
ological Offic
te for Earth ivil Protectioof the Icelaeruption in nitoring systethe event wi
cano in the eruption was
began with awide strip ofThe flank eruniscule amouegan in the
y. This event e areas was cil the end of t
ICAO startec Ash Task F
mmunity. On r 2010 the co
ORCE (IVA
TION, ICEL
ce)
Sciences ofon and Emergandic Police 2010. The rem in Icelanith discussion
spring of 20transported w
a small lava-f land (nameduption beganunts of tephra
ice-filled sucaused the la
closed for sevthe eruption.
ed in the sumForce (IVATFthe suggestioompilation of
ATF)
LAND
f the gency
have report nd, a n and
010 caused mwith northweproducing bad Fimmvörðu
n on 20 Marca, not causinummit calde
argest disruptiveral days in As a consequ
mmer of 201F) with the aon of the Icelf a comprehe
IVATF/431/5/12
major esterly asaltic uháls) h and g any
era of ion to April
uence,
10 an aim to landic ensive
4-IP/3
IVATF/4-IP/3
- 2 -
report on the eruption from the institutes in Iceland that did monitoring and research on the eruption. These institutes are the IMO, the Institute of Earth Sciences of the University of Iceland and the Department of Civil Protection and Emergency Management of the National Commissioner of the Icelandic Police (NCIP-DCPEM).
2. THE REPORT
2.1 The report is divided into five chapters and 11 appendices:
1. Introduction
2. IMO, IES and NCIP-DCPEM - a short overview of the institutes
3. Overview of the geophysical monitoring systems in Iceland
4. The flank and summit eruption 2010
5. Analysis, discussion and main findings
6. Appendices
3. MAIN FINDINGS
3.1 First indications of magma movements under Eyjafjallajökull were detected as early as 1992-1994, with increased seismicity followed by episodes of unrest with ground inflation and earthquakes in 1996 and 1999-2000. Deep earthquakes were detected near the crust mantle-boundary (17–29 km depth) in late March and April 2009 suggesting magma transport into the crust. Intense seismicity and rapid inflation of the east flank of the volcano in January-March 2010 lead to the onset of the flank eruption on 20 March. Seismic activity and ground deformation suggests that magma continued flowing into the crust from the mantle during the eruption. The flank eruption in Fimmvörðuháls ceased on 12 April 2010. However, only a day and a half later, at 01:15 UTC on 14 April the second eruption started under 200 m thick ice within the summit caldera of Eyjafjallajökull. The onset of the eruption was preceded by a 2.5 hour long swarm of earthquakes. A volcanic plume was first observed at 05:55 UTC, and then it gradually rose during the day, reaching 9-10 km a.s.l. in the evening of 14 April. Northwesterly winds carried the ash erupted towards southeast with small amounts of ash reaching Europe in the following days. Magma-water interaction influenced the fragmentation of the rising magma in the first several days but gradually the influence of the external water declined and during the second explosive phase in May, the fragmentation was mainly magmatic in character. The eruption produced mainly trachyandesite, but became more silicic in May when trachyte was erupted. Activity fluctuated and is conveniently divided into four main phases:
3.2 Phase I: Ash-rich explosive eruption, 14-18 April. The most powerful phase of the eruption.
3.3 Phase II: Low discharge and hybrid effusive-explosive phase (18 April – 4 May). During this period a lava flow formed, melting its way 3 km down an outlet glacier.
IVATF/4-IP/3
- 3 -
3.4 Phase III: Second explosive phase (5-17 May). Renewed activity was preceded by one to two days of inflation and deep earthquakes.
3.5 Phase IV: Declining activity during the period 18-22 May when the eruption ended (there was minor activity on 4-8 June, and 17 June but only affecting the vicinity of the craters).
3.6 The periodic nature of the eruption and the type of magma erupted, can be explained by new basaltic magma mixing at a few kilometres depth with older more silicic magma residing in the crust, possibly a leftover from the most recent previous eruption in 1821-23. The eruption produced about 0.27 km3 of tephra, with about 50% deposited on land in Iceland and about 50% in the ocean to the south and southeast of the volcano. A tiny fraction was transported to Europe. A characteristic of this eruption was how fine grained the tephra was. In the first phase of the eruption as much as 50% of the erupted material were ash particles <63 µm in diameter. Measured as equivalent to dense rock (DRE), the volume of the erupted material is 0.18 km3. During the more powerful phases the plume was 7-9 km high but at other times lower. It was often bent over by wind. The eruption had a Volcanic Explosivity Index (VEI) of 3. For monitoring and tracking of subsurface magma and predicting the course of events, the geophysical monitoring systems were vital, i.e. the seismic stations, GPS and strain stations. Radar observations of the plume, river monitoring, aircraft monitoring on-ground tephra sampling and satellite images proved essential to follow the course of events.
3.7 A key lesson learned from the Eyjafjallajökull eruption was that improvements have to be made in monitoring of volcanic ash plumes, so that the input data into dispersion models will be as accurate as possible. Issues where improvements are needed and are in the various stages of consideration are:
• Aircraft availability for surveillance flights over the eruption area
• Improved facilities and instruments for geophysical and geochemical monitoring
• Operational plan for ash sampling and eruption products characterization
• Radar coverage
• Use of Lidar and ceilometers for volcanic ash detection
• Enhanced use of satellite information
• Increase in human resources at IMO regarding volcanic science
3.8 At the time of the eruption one C-band weather radar was operational in Iceland, located at Keflavík international airport. It was used for continuous monitoring of the ash plume and its height, which is the main input data into dispersion models. Regular surveillance flights during the eruption period (almost daily) were used for that purpose as well. The eruption highlighted the need for improvements in the radar network in Iceland. IMO had pointed this out to ICAO already in 2005 after the eruption in Grímsvötn in November 2004. Steps towards resolving this have already been taken, since a second C-band weather radar was acquired and located in eastern Iceland. It has been operational since April/May 2012. In addition ICAO has financed two mobile X-band radars. The first will be operational in June 2012 and the second is expected to be delivered and operational in January 2013.
IVATF/4-IP/3
- 4 -
3.9 The attention of the global media put intensive pressure on the Icelandic institutes. The institutes tried as much as possible to meet this demand by assigning several people to the task of giving interviews and answering questions. The Icelandic government responded to the pressure by establishing a media center under the supervision of NCIP-DCPEM. Regular press conferences were held at the media center. This proved to be invaluable and reduced considerably the pressure on the monitoring institutes. Web pages of IMO, IES and NCIP-DCPEM were also used extensively to release scientific information as quickly as possible.
3.10 Common exercises carried out regularly over the past decade by IMO, Isavia (Icelandic Air Navigation Service Provider) and London VAAC (Volcanic Ash Advisory Centre) were important in preparing the institutes, especially regarding the first actions taken during volcanic eruptions. Each institute works according to contingency plans. However, important steps were taken to improve the response during the Eyjafjallajökull eruption, e.g. by establishing the Volcanic Ash Status Report (VAR) issued by IMO every 3 hours, and enhanced communication between the institutes. Daily reports with overall assessment of the activity, composed by IMO and IES, started as well. These reports formed the basis for the daily report issued by NCIP-DCPEM with additional information for the local community. Other positive action taken during the eruption was the signing of a Memorandum of Understanding (MoU) on enhanced collaboration on volcanic eruptions between IMO, UK Met Office, BGS (British Geological Survey) and NCAS (National Centre for Atmospheric Science). Steps have since been taken in this direction, e.g. through research projects and improvements of geophysical monitoring, volcanic ash monitoring in the atmosphere, re-suspension of ash, and ash dispersion modelling. The benefit of this collaboration was clearly demonstrated during the week-long Grímsvötn eruption in May 2011. Further national and international projects involving the Icelandic institutes have been initiated since the end of the eruption.
— END —
3
Contents ABBREVIATIONS................................................................................................................8
GLOSSARY.........................................................................................................................111 INTRODUCTION..........................................................................................................13
1.1 GEOLOGICAL OVERVIEW........................................................................................142 IMO, IES AND NCIP-DCPEM – A SHORT OVERVIEW OF THE INSTITUTES ...20 2.1 Areas of expertise ................................................................................................ 20 2.1.1 Icelandic Meteorological Office............................................................... 20
2.1.2 Institute of Earth Sciences, University of Iceland.....................................212.1.3 Department of Civil Protection and Emergency Management .................22
2.2 Role of the institutes .............................................................................................222.2.1 Icelandic Meteorological Office ...............................................................22
2.2.2 Institute of Earth Sciences, University of Iceland.....................................232.2.3 Department of Civil Protection and Emergency Management .................23
2.3 IMO contingency plans .........................................................................................242.4 Communications between agencies ......................................................................24
3 OVERVIEW OF THE GEOPHYSICAL MONITORING SYSTEMS IN ICELAND .253.1 Seismic monitoring system (SIL) .........................................................................25
3.1.1 Portable seismometers...............................................................................27
3.2 Global Positioning System (GPS).........................................................................283.3 Borehole strain ......................................................................................................303.4 Hydrological measurements..................................................................................313.5 Geochemical monitoring.......................................................................................313.6 Glacier surface monitoring....................................................................................313.7 Weather stations ....................................................................................................333.8 Lightning detection ...............................................................................................353.9 InSAR....................................................................................................................363.10 Other systems ........................................................................................................37
3.10.1 Radar .........................................................................................................37
3.10.2 Web cameras .............................................................................................383.10.3 Use of satellite data in ash plume monitoring...........................................39
3.11 Operating systems and procedures........................................................................403.12 Data from IMO to London VAAC and the Icelandic civil aviation authorities....41
4 THE FLANK AND SUMMIT ERUPTION 2010 .........................................................454.1 The Eyjafjallajökull volcano.................................................................................45
4
4.1.1 Holocene volcanic history.........................................................................45
4.1.2 Jökulhlaups................................................................................................484.1.3 Ash dispersion 1821–1823 and 2010 ........................................................48
4.2 2010 pre-eruption phase........................................................................................494.2.1 Long term precursors: Seismicity .............................................................494.2.2 Long term precursors: Deformation..........................................................50
4.2.3 Geothermal changes ..................................................................................524.2.4 Magmatic degassing..................................................................................52
4.2.5 Seismicity and uplift .................................................................................534.2.5.1 Seismicity prior to the 2010 flank eruption...............................................53
4.3 Flank eruption at Fimmvörðuháls .........................................................................544.3.1 Course of events........................................................................................55
4.3.1.1 Eruption onset ...........................................................................................564.3.1.2 Activity description...................................................................................57
4.3.2 Observations and analysis .........................................................................574.3.2.1 Airborne observations ...............................................................................574.3.2.2 Onsite observations ...................................................................................584.3.2.3 GPS ...........................................................................................................584.3.2.4 Web cameras .............................................................................................594.3.2.5 Radar .........................................................................................................594.3.2.6 Tephra fall .................................................................................................594.3.2.7 Water chemistry in the Hruná river...........................................................604.3.2.8 Seismicity..................................................................................................604.3.2.9 Volcanic tremor.........................................................................................61
4.3.3 Response of IMO ......................................................................................614.3.3.1 Immediate measures and likelihood of explosive eruption.......................614.3.3.2 Measures taken to increase monitoring and predict lava runout...............62
4.3.4 Response of IES ........................................................................................62
4.3.5 Response of the NCIP-DCPEM................................................................634.3.6 Conclusions and decisions ........................................................................63
4.3.6.1 Not an aviation-threatening event – IMO decision making process .........634.3.6.2 Assessment of other hazards (jökulhlaup, lava flows, gas pollution) .......644.3.6.3 A large tourist attraction............................................................................64
4.4 Summit eruption....................................................................................................654.4.1 Course of events........................................................................................66
4.4.1.1 Short term precursors ................................................................................664.4.1.2 Subglacial eruption....................................................................................67
5
4.4.1.3 Phase I: Phreatomagmatic explosive eruption ..........................................684.4.1.4 Phase I: Jökulhlaups..................................................................................684.4.1.5 Phase I: Ash-rich explosive eruption ........................................................694.4.1.6 Phase II: Low discharge and hybrid effusive-explosive phase .................714.4.1.7 Phase III: Second explosive phase ............................................................714.4.1.8 Phase IV: Declining activity .....................................................................764.4.1.9 Renewed activity.......................................................................................76
4.4.2 Observations and analysis .........................................................................764.4.2.1 Deformation associated with renewed magma inflow..............................764.4.2.2 Plume observations, radar .........................................................................784.4.2.3 Summit eruption, tremor ...........................................................................794.4.2.4 Lightning ...................................................................................................804.4.2.5 Real-time hydrological measurements......................................................804.4.2.6 Ice cauldron formation and crater development........................................824.4.2.7 Visual and infrared photography and videos, from ground and aircraft ...844.4.2.8 Tephra fallout volume, total mass and mass eruption rate (MER) ...........844.4.2.9 Meteorological conditions and dispersal of ash, output rate and mass .....864.4.2.10 Local ash fall forecasting ..........................................................................874.4.2.11 Chemical pollution ....................................................................................884.4.2.12 Web cameras .............................................................................................884.4.2.13 Satellite observations ................................................................................884.4.2.14 Geochemistry, including petrology...........................................................91
4.4.3 Weather conditions....................................................................................914.4.4 Response of IMO ......................................................................................92
4.4.5 Response of IES ........................................................................................934.4.6 Response of the NCIP-DCPEM................................................................94
4.5 Post-eruption phase and follow-up .......................................................................954.5.1 Ash fallout distribution .............................................................................954.5.2 Lahar distribution ......................................................................................95
4.5.3 Re-suspension of ash.................................................................................975 ANALYSIS, DISCUSSION AND MAIN FINDINGS ...............................................101
5.1 Scientific aspects: Discussion and analysis ........................................................1015.1.1 Overview.................................................................................................101
5.1.2 Seismic and crustal deformation .............................................................1025.1.2.1 Tracking magma movements ..................................................................1025.1.2.2 The importance of seismic tremor...........................................................106
5.1.3 Tephra characteristics and conduit processes .........................................106
6
5.1.4 Plume observations .................................................................................107
5.1.4.1 Radar at Keflavík International Airport ..................................................1075.1.4.2 Aircraft monitoring .................................................................................109
5.1.5 Hydrological monitoring and glacial outbursts.......................................1115.1.6 Gas emission during the eruption............................................................114
5.2 Operations and communication between institutes.............................................1145.2.1 Communication between IMO, Isavia and Icelandic CAA ....................115
5.2.2 Communication between IMO and London VAAC ...............................1165.2.2.1 Dispersion model ....................................................................................118
5.2.3 Communication between IMO, IES and NCIP-DCPEM........................1205.2.4 Communication between IES and other institutes ..................................120
5.2.5 Other communication and discussion .....................................................1215.3 Communication with media and the general public............................................121
5.3.1 Communication with media ....................................................................121
5.3.2 Communication with the national administration ...................................1225.3.3 International response organizations.......................................................123
5.3.4 Dissemination through the internet .........................................................1235.4 Monitoring and analysis – shortcomings and lessons learned ............................124
5.4.1 Aircraft availability for surveillance flights over the eruption area........1245.4.2 Improvements of geophysical and geochemical monitoring ..................125
5.4.2.1 Seismic stations.......................................................................................1255.4.2.2 GPS stations ............................................................................................1255.4.2.3 Measurements of volcanic gases.............................................................1255.4.2.4 Borehole strain measurements ................................................................1265.4.2.5 Visualization of real-time monitoring data .............................................1265.4.2.6 Petrological analysis................................................................................126
5.4.3 Operational plan for ash sampling ..........................................................1275.4.4 Radar coverage........................................................................................128
5.4.5 Use of Lidars and ceilometers for volcanic ash detection.......................1285.4.6 Enhanced use of satellite information .....................................................129
5.4.7 Increase in human resources at IMO in volcano science and monitoring1305.5 Further plans .......................................................................................................130
5.5.1 Risk assessment of volcanic eruptions in Iceland ...................................131
5.5.2 Research projects ....................................................................................1315.5.2.1 WEZARD (WEather HaZARD for aeronautics) ....................................1315.5.2.2 FUTUREVOLC ......................................................................................132
7
6 APPENDICES..............................................................................................................1356.1 Stations installed to improve the monitoring ......................................................135
6.1.1 Stations around Eyjafjallajökull ..............................................................135
6.1.2 Weather radars ........................................................................................1356.2 Recorded field trips .............................................................................................1366.3 Surveillance flights .............................................................................................1426.4 List of information/analyses presented on IES web page during the eruption ...1456.5 List of information/analyses presented on IMO web page during the eruption..1476.6 Sessions and special meetings.............................................................................1496.7 MoU between IMO, UK Met Office, BGS and NCAS ......................................1496.8 Daily reports from IMO during the eruption (examples)....................................1556.9 Daily joint status reports from IMO and IES......................................................1596.10 Observations made by international research groups..........................................1936.11 Bibliography........................................................................................................198
6.11.1 Papers ......................................................................................................1986.11.2 Reports ....................................................................................................199
6.11.3 Presentations and posters ........................................................................199
8
Abbreviations a.s.l.: above sea level
ADG: Atmospheric Dispersion Group at the UK Met Office ANSP: Air Navigation Service Provider
ANSP: Air Navigation Service Provider ATDnet: Arrival Time Difference, a long range lightning location network, operated by the UK Met Office AVHRR: Advanced Very High Resolution Radiometer, satellite instrument operated by NOAA BGS: British Geological Survey, United Kingdom
BTD: Brightness Temperature Difference CAA: Civil Aviation Authority
CECIS: Common Emergency Communication and Information System of the European Commision
CIW: Carnegie Institution of Washington, USA CMFU: Central Flow Management Unit
CTA: aviation ConTrol Area DEM: Digital Elevation Map
DLR: the German Space Agency DRE: Dense Rock Equivalent
EADRCC: NATO’s Euro-Atlantic Disaster Response Coordination Centre EEA: European Economic Area
ESA: European Space Agency ESRI: Environmental Systems Research Institute, Inc., California, USA
EU FP7: European Union Seventh Framework Programme EU: European Union
EUMETSAT: European Organisation for the Exploitation of Meteorological Satellites EU-MIC: European Union´s Humanitarian Aid and Civil Protection Monitoring and Information Centre EVZ: Eastern Volcanic Zone in Iceland
FIR: Flight Information Region FUTUREVOLC: a European volcanological supersite in Iceland: a monitoring system and network for the future. An EU FP7 consortium project GIS: Global Information System
GPS: Global Positioning System
9
ICAA: see Isavia
ICAO: International Civil Aviation Organization ICE-SAR: Icelandic Association for Search and Rescue
IES: the Institute of Earth Sciences, an independent part of the University of Iceland’s Science Institute
IMO: the Icelandic Meteorological Office InSAR: Interferometric Synthetic Aperture Radar
IR: Infrared Radiation, electromagnetic radiation with wavelengths from 0.74 to 300 µm Isavia: formerly the Icelandic Civil Aviation Administration (ICAA)
ISGPS: a continuous GPS system operated by the IMO ISI: Thomson Reuters (formerly ISI) Web of Knowledge
ISOR: Iceland GeoSurvey KNMI: Royal Netherlands Meteorological Institute
Lidar: Light Detection And Ranging MET: METeorological
MoU: Memorandum of Understanding MWO: Meteorological Watch Offices
NAME: Numerical Atmospheric dispersion Modeling Environment NASA: National Aeronautics and Space Administration, USA
NAT/EUR: North ATlantic/EURopean) NATO: North Atlantic Treaty Organization
NCAS: National Centre for Atmospheric Science, UK NCCC: National Crisis Coordination Centre organized by NCIP-DCPEM in Iceland
NCIP: the National Commissioner of the Icelandic Police NCIP-DCPEM: the Department of Civil Protection and Emergency Management of the National Commissioner of the Icelandic Police, the national administrative body for civil protection matters in Iceland
NGO: Non-Governmental Organization NOAA: National Oceanic and Atmospheric Administration, USA
Nordvulk - Nordic Volcanological Institute, a research and training center in volcanology for the Nordic countries, part of the IES
OAC: Icelandic Aviation Oceanic Area Control Center OACC: Icelandic Aviation Oceanic Area Control Center
OMI is a Dutch-Finnish developed instrument on board NASA's satellite Aura. OPC: Optical Particle Counter
OP-FTIR: Open-Path Fourier Transform Infrared spectroscopy
10
RANNÍS: Icelandic Research Fund
SAF: Satellite Application Facilities SAR: Synthetic Aperture Radar
SAS: Scandinavian Airlines SEM: Scanning Electron Microscope
SIGMET: SIGnificant Meteorological Information, a weather advisory that contains meteorological information concerning the safety of all aircraft
SIL: Seismic network operated by the IMO with automatic, real-time data acquisition and earthquake locations. Acronym originally stands for South Iceland Lowlands network, but has since been expanded to other areas of Iceland. SISZ: South Iceland Seismic Zone
SLD: Supercooled Large Droplet USGS: United States Geological Survey
UTC: Coordinated Universal Time. Iceland is permanently on UTC VAA: Volcanic Ash Advisory
VAAC: Volcanic Ash Advisory Centre VAG: Volcanic Ash Graphics
VAR: Volcanic Ash status Report VEI: Volcanic Explosivity Index, a relative measure of the explosiveness of volcanic eruptions
VOLCEX: VOLcanic ash Crisis EXercise VOLCICE: VOLcanic ash crisis exercise in ICEland
WEZARD: WEather HaZARD for aeronautics, an EU FP7 Coordinated Support Action WMO: World Meteorological Organization
WVZ: Western Volcanic Zone in Iceland
11
Glossary Ash: ASH is divided into three groups, CORSE ASH all particles larger than 1000 micron. Particles smaller than 1000 micron are defined as FINE ASH and particles smaller than 30 micron are defined as VERY FINE ASH. Basalt: Relative to most common igneous rocks, basalt compositions are rich in MgO and CaO and low in SiO2 and the alkali oxides, i.e., Na2O+K2O. Basalt generally has a composition of 45-55 wt% SiO2, 2-6 wt% total alkalis, 0.5-2.0 wt% TiO2, 5-14 wt% FeO and 14 wt% or more Al2O3. Benmoreite: Benmoreite is a silica undersaturated volcanic rock of intermediate composition. It is a variant of trachyandesite and belongs to the alkalic suite of igneous rocks. An origin by fractionation from basanite through nepheline hawaiite to nepheline benmoreite has been demonstrated. Gauging station: A fixed monitoring point on a river where systematic observations of water height (stage) and other hydrological parameters, including electrical conductivity, are made automatically.
Hawaiian activity: Hawaiian eruptions are typically effusive eruptions, with basaltic magmas of low viscosity, low content of gases, and high temperature at the vent. Very little amount of volcanic ash is produced. Interferogram: The phase difference of two images is processed to obtain height and/or motion information of the Earth’s surface. For satellite interferometry of the repeated pass type, one image is taken one day, and a second image is taken of the same scene one or more days later, if there are changes in earth surface between the two images an interferogram is created illustrating those changes.
Jökulhlaup: Icelandic term, adopted by the international scientific community, referring to glacial outburst floods. In Iceland, jökulhlaups are mostly triggered by subglacial geothermal activity and volcanic eruptions underneath glaciers. They are the most destructive volcanogenic hazard in Iceland.
Lidar: Light Detection And Ranging, an optical remote sensing technology that can measure the distance to, or other properties of a target by illuminating the target with light, often using pulses from a laser. Phreatomagmatic activity: Phreatomagmatic eruptions are defined as juvenile forming eruptions as a result of interaction between water and magma. The products of phreatomagmatic eruptions contain juvenile clasts, unlike phreatic eruptions, and are the result of interaction between magma and water, unlike magmatic eruptions. It is very common for large and small explosive eruption to have magmatic and phreatomagmatic components.
Plume height: The volcanic plume will stop rising once it reaches an altitude where it is as dense as the surrounding air. In this report the reference level for plume altitude is the sea level, unless otherwise stated. Strain-meter: A borehole-based sensor used for continuous measurements of volumetric strain in the surrounding rock.
12
Strombolian activity: Strombolian eruptions are relatively low-level volcanic eruptions, consisting of ejection of incandescent cinder, lapilli and lava bombs to altitudes of tens to hundreds of meters. They are small to medium in volume, with sporadic violence, mildly explosive at discrete but fairly regular intervals of seconds to minutes. The tephra accumulates in the vicinity of the vent, forming a cinder cone. Cinder is the most common product, the amount of volcanic ash is typically rather minor. Synoptic weather observation: A surface weather observation, made at periodic times (usually at 3 hourly intervals), atmospheric pressure reduced to sea level, temperature, dew point, wind speed and direction, cloud cover and cloud height, amount and type of precipitation, visibility and other information that prevail at the time of observation or in between observations, e.g. tephra fall.
Synthetic Aperture Radar (SAR): A technique used to gain high azimuth resolution of radar signal from a moving body. The azimuth resolution of a radar signal is determined by the physical width of the antenna receiving the signal. By exploiting the Doppler effects when measuring electromagnetic waves in a moving body, a large antenna can be simulated (Synthetic Apperture), hence making it possible to reduce the physical size of the antenna but retaining the same azimuth resolution
Tephra: Tephra is defined as a pyroclast that fall to the ground from an eruption column. Pyroclasts are divided into large class groups of grain size. All particles larger than 64 mm are defined as BOMBS, particles larger than 2 mm are defined as LAPILLI and all particles smaller than 2 mm are defined as ASH.
Trachyandesite: Trachyandesite is an extrusive igneous rock. It has little or no free quartz, but is dominated by alkali feldspar and sodic plagioclase along with one or more of the following mafic minerals: amphibole, biotite or pyroxene. Small amounts of nepheline may be present and apatite is a common accessory mineral.
Trachyte: Trachyte is an igneous volcanic rock with an aphanitic to porphyritic texture. It is the volcanic equivalent of syenite. The mineral assemblage consists of essential alkali feldspar; relatively minor plagioclase and quartz or a feldspathoid such as nepheline may also be present. Biotite, clinopyroxene and olivine are common accessory minerals
Volcanic tremor: Describes a long-duration release of seismic energy, with distinct spectral (harmonic) lines, that often precedes or accompanies a volcanic eruption. More generally, a volcanic tremor is a sustained signal that may or may not possess these harmonic spectral features.
Vulcanian activity: Explosions like cannon fire at intervals of seconds to minutes. Their explosive nature is due to increased silica content of the magma. Almost all types of magma can be involved, but magma with about 55% or more silica is most common. Increasing silica levels increase the viscosity of the magma which means increased explosiveness. As the vent clears, ash clouds become grey-white and creamy in colour, with convolutions of the ash similar to those of plinian eruptions.
13
1 Introduction The explosive eruption of Eyjafjallajökull volcano in southern Iceland in April-May 2010 was of a moderate size, producing 0.27 km3 of tephra. The volcanic plume generated during the eruption never exceeded 10 km a.s.l. and most often its height varied between 4 and 8 km a.s.l. Nevertheless, for extended periods of time, ash was transported thousands of kilometers, being detected over the Atlantic Ocean and many parts of Europe. The eruption caused unprecedented disruption to aviation across Europe and the Atlantic, leading to considerable economic losses in the aviation industry. About 100,000 commercial flights were cancelled, the majority occurring during the first five days of the eruption. A change to the European aviation regulations regarding permissible ash concentration for operation of passenger jets was made on 19 April 2010, which reopened commercial aircraft routes in Europe. The monitoring of the eruption and the provision of information to the relevant authorities and the general public was primarily managed by the three institutes responsible for compiling this report. These are the Icelandic Meteorological Office (IMO), the Institute of Earth Sciences (IES) of the University of Iceland, and the Department of Civil Protection and Emergency Management of the National Commissioner of the Icelandic Police (NCIP-DCPEM). IMO has an official responsibility to monitor and issue warnings on natural hazards, including volcanic eruptions, and operates various monitoring systems covering the whole of Iceland. IES, which includes the Nordic Volcanological Center, is an academic institute without legal responsibilities for monitoring. However, volcanological research is one of its main foci, and during eruptions its equipment- and human resources are made available for monitoring and advice. NCIP-DCPEM oversees hazard mitigation in affected areas and has the authority to request the assistance of any public body in the time of crisis. The eruption issued from an ice-covered stratovolcano close to inhabited areas. Therefore, the initial response effort was largely directed at the local hazard. At the same time, the standard procedures for alerting of airborne ash were put into operation. The response to the local hazard was based on risk assessment and response plans completed in 2005. The assessment and planning stage was followed in 2006 by a public awareness campaign and drills which involved the participation of all inhabitants in the potentially threatened areas. During the eruption, the response plan proved successful with respect to evacuations and other planned mitigation measures. The extensive airspace closures due to the dispersion of the ash cloud over Europe greatly increased the pressure on the monitoring and mitigating bodies in Iceland. Noteworthy was the unprecedented attention of the global media which the eruption received. The institutes of IMO and IES collaborate closely, and complement one another with respect to the scientific aspects of volcanic eruptions. Together they accommodate most of the existing resources and expertise in Iceland necessary to deal with the multiple aspects of monitoring and interpreting a complex event like the Eyjafjallajökull eruption. The coordinating role of NCIP-DCPEM is vital in the Icelandic response system. In particular, it provides the necessary connections with the local authorities, and other government and voluntary bodies involved with natural hazard responses. Close collaboration is in place between the IMO, IES and NCIP-DCPEM. Similarly, this report is a collaborative product, with the majority of the chapters co-written by IES and IMO experts with relevant input from NCIP-DCPEM on hazard and operational issues.
14
The report is divided into six chapters, including this Introduction. Chapter 2 describes the operation of the three institutes (IMO, IES and NCIP-DCPEM) including their roles and areas of expertise. Chapter 3 describes the monitoring systems available in Iceland and which are of relevance to volcanic eruptions. Chapter 4 forms the heart of the report since it contains detailed descriptions and data analysis. The chapter is subdivided as follows: (4.1) introduction to Eyjafjallajökull volcano, (4.2) the pre-eruption phase, (4.3) the flank eruption at Fimmvörðuháls in March-April, (4.4) the main ash-producing eruption in the summit crater in April-May, (4.5) the post-eruption phase. In order to make the report more accessible for readers that are not fully versed in volcanology, the subchapters on both the flank and the summit eruptions (4.3 and 4.4) are further subdivided into Course of Events (4.3.1 and 4.4.1) and the more in-depth sections of Observations and Analysis (4.3.2 and 4.4.2). Chapter 5 is subdivided into (5.1) an overview and analysis of the scientific aspects of the eruption, (5.2) operational aspects and communication between institutes, (5.3) media and public communication, (5.4) shortcomings and lessons learned in monitoring and analysis, and (5.5) future plans. Chapter 6 provides various supplementary information. Abbreviations and brief explanations of volcanological terms (glossary) are listed at the beginning of this report.
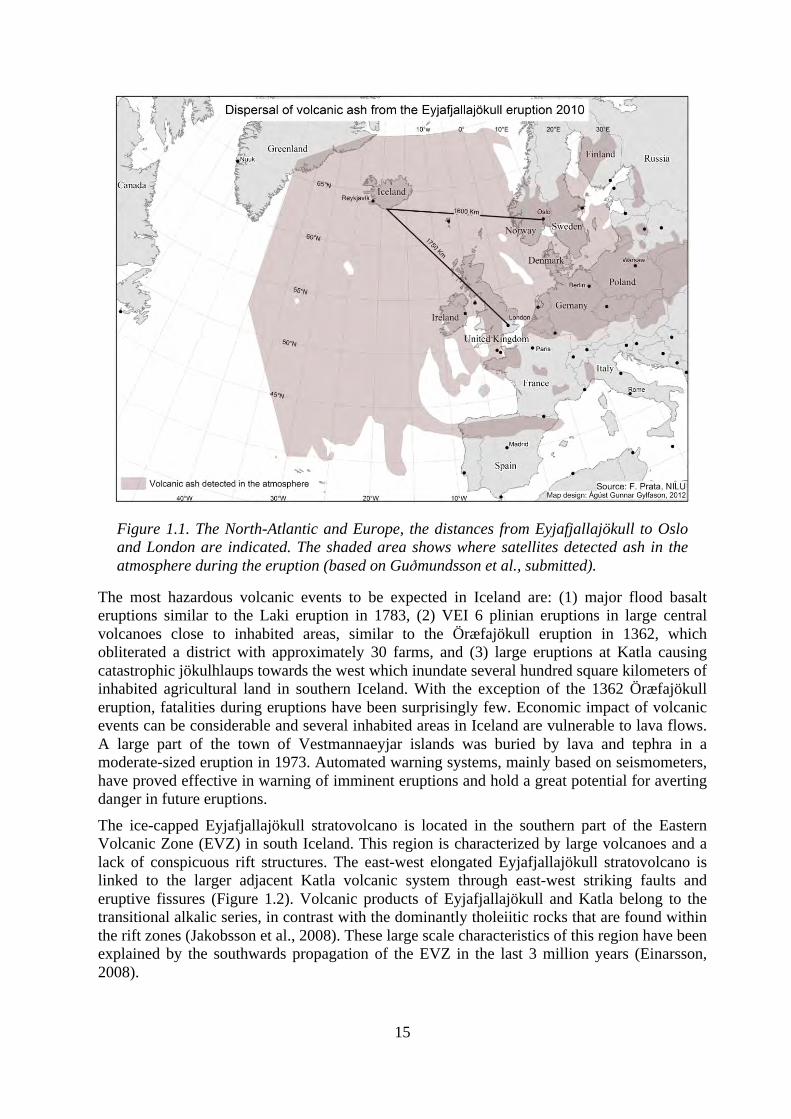
1.1 Geological overview Iceland lies in the North Atlantic Ocean, its nearest neighbor to the west is Greenland, 287 km away (Figure 1.1). Iceland lies 970 km due west of Norway and 798 km northwest of Scotland. The volcano Eyjafjallajökull is situated approximately in the center of the southern shore of Iceland. The distance from Eyjafjallajökull to London, United Kingdom is 1,750 km and the distance to Oslo, Norway is 1,600 km.
In Iceland the mid-Atlantic plate boundary is expressed as a series of seismic and volcanic zones (Figure 1.2). In southern Iceland the plate boundary is divided into two spreading segments, the Western and Eastern Volcanic zones (WVZ and EVZ respectively), with the EVZ as the current main locus of spreading (Árnadóttir et al., 2008). The South Iceland Seismic Zone (SISZ) is a transform zone connecting the two spreading segments. Each volcanic system is characterized by a central volcano and a transecting fissure swarm (Figure 1.2). Out of 30 volcanic systems identified in Iceland (Thorðarson & Larsen, 2007), 16 have been active after 870 AD. Most eruptions occur within central volcanoes, with Grímsvötn, Hekla and Katla having the highest eruption frequencies. Together with their associated fissure systems they have also the highest volcanic productivity in terms of erupted magma volume (Thorðarson & Larsen, 2007). Volcanic eruptions are common, with small eruptions (<0.1 km3 Dense Rock Equivalent - DRE) happening about once every 4–5 years while the largest flood-basalt eruptions (>10 km3 DRE) occur at a 500–1000 year interval. Explosive eruptions are more common than effusive, since eruptions frequently occur in intraglacial settings giving rise to phreatomagmatic explosive activity. The largest explosive eruptions (Volcanic Explosivity Index – VEI 6) occur once or twice per millennium, while VEI 3 eruptions have recurrence times of 10–20 years. No evidence for VEI 7 or larger eruptions has been found in the geological history of Iceland (Guðmundsson et al, 2008). Jökulhlaups caused by volcanic or geothermal activity under glaciers are the most frequent volcanically related hazard, while fallout of tephra and fluorine poisoning of crops, leading to decimation of livestock and famine, killed several thousand people prior to 1800 A.D.
15
Figure 1.1. The North-Atlantic and Europe, the distances from Eyjafjallajökull to Oslo and London are indicated. The shaded area shows where satellites detected ash in the atmosphere during the eruption (based on Guðmundsson et al., submitted).
The most hazardous volcanic events to be expected in Iceland are: (1) major flood basalt eruptions similar to the Laki eruption in 1783, (2) VEI 6 plinian eruptions in large central volcanoes close to inhabited areas, similar to the Öræfajökull eruption in 1362, which obliterated a district with approximately 30 farms, and (3) large eruptions at Katla causing catastrophic jökulhlaups towards the west which inundate several hundred square kilometers of inhabited agricultural land in southern Iceland. With the exception of the 1362 Öræfajökull eruption, fatalities during eruptions have been surprisingly few. Economic impact of volcanic events can be considerable and several inhabited areas in Iceland are vulnerable to lava flows. A large part of the town of Vestmannaeyjar islands was buried by lava and tephra in a moderate-sized eruption in 1973. Automated warning systems, mainly based on seismometers, have proved effective in warning of imminent eruptions and hold a great potential for averting danger in future eruptions.
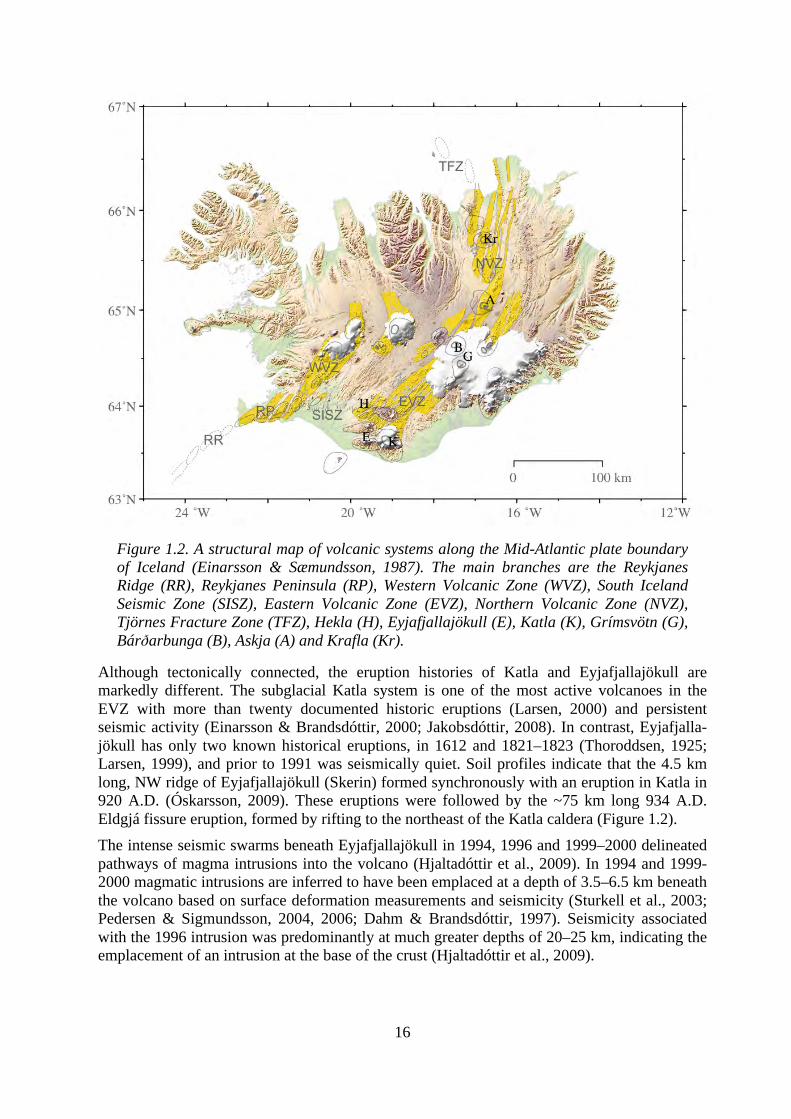
The ice-capped Eyjafjallajökull stratovolcano is located in the southern part of the Eastern Volcanic Zone (EVZ) in south Iceland. This region is characterized by large volcanoes and a lack of conspicuous rift structures. The east-west elongated Eyjafjallajökull stratovolcano is linked to the larger adjacent Katla volcanic system through east-west striking faults and eruptive fissures (Figure 1.2). Volcanic products of Eyjafjallajökull and Katla belong to the transitional alkalic series, in contrast with the dominantly tholeiitic rocks that are found within the rift zones (Jakobsson et al., 2008). These large scale characteristics of this region have been explained by the southwards propagation of the EVZ in the last 3 million years (Einarsson, 2008).
16
Figure 1.2. A structural map of volcanic systems along the Mid-Atlantic plate boundary of Iceland (Einarsson & Sæmundsson, 1987). The main branches are the Reykjanes Ridge (RR), Reykjanes Peninsula (RP), Western Volcanic Zone (WVZ), South Iceland Seismic Zone (SISZ), Eastern Volcanic Zone (EVZ), Northern Volcanic Zone (NVZ), Tjörnes Fracture Zone (TFZ), Hekla (H), Eyjafjallajökull (E), Katla (K), Grímsvötn (G), Bárðarbunga (B), Askja (A) and Krafla (Kr).
Although tectonically connected, the eruption histories of Katla and Eyjafjallajökull are markedly different. The subglacial Katla system is one of the most active volcanoes in the EVZ with more than twenty documented historic eruptions (Larsen, 2000) and persistent seismic activity (Einarsson & Brandsdóttir, 2000; Jakobsdóttir, 2008). In contrast, Eyjafjalla-jökull has only two known historical eruptions, in 1612 and 1821–1823 (Thoroddsen, 1925; Larsen, 1999), and prior to 1991 was seismically quiet. Soil profiles indicate that the 4.5 km long, NW ridge of Eyjafjallajökull (Skerin) formed synchronously with an eruption in Katla in 920 A.D. (Óskarsson, 2009). These eruptions were followed by the ~75 km long 934 A.D. Eldgjá fissure eruption, formed by rifting to the northeast of the Katla caldera (Figure 1.2). The intense seismic swarms beneath Eyjafjallajökull in 1994, 1996 and 1999–2000 delineated pathways of magma intrusions into the volcano (Hjaltadóttir et al., 2009). In 1994 and 1999-2000 magmatic intrusions are inferred to have been emplaced at a depth of 3.5–6.5 km beneath the volcano based on surface deformation measurements and seismicity (Sturkell et al., 2003; Pedersen & Sigmundsson, 2004, 2006; Dahm & Brandsdóttir, 1997). Seismicity associated with the 1996 intrusion was predominantly at much greater depths of 20–25 km, indicating the emplacement of an intrusion at the base of the crust (Hjaltadóttir et al., 2009).
17
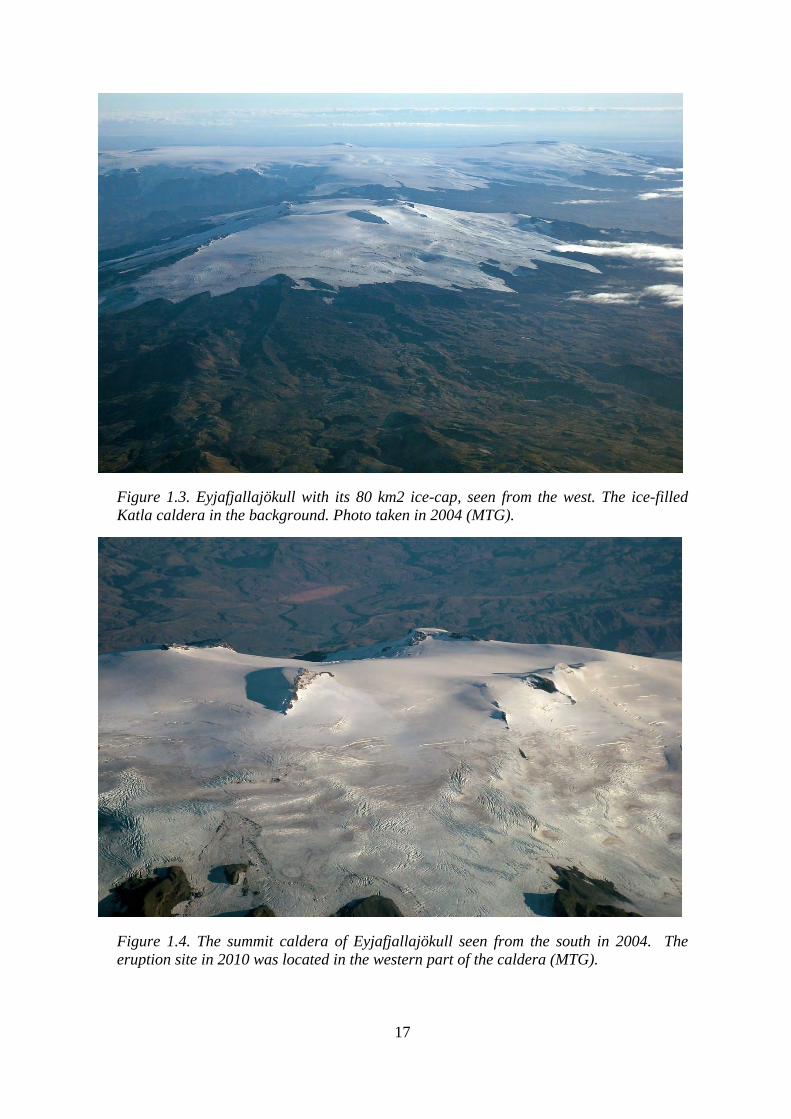
Figure 1.3. Eyjafjallajökull with its 80 km2 ice-cap, seen from the west. The ice-filled Katla caldera in the background. Photo taken in 2004 (MTG).
Figure 1.4. The summit caldera of Eyjafjallajökull seen from the south in 2004. The eruption site in 2010 was located in the western part of the caldera (MTG).
18
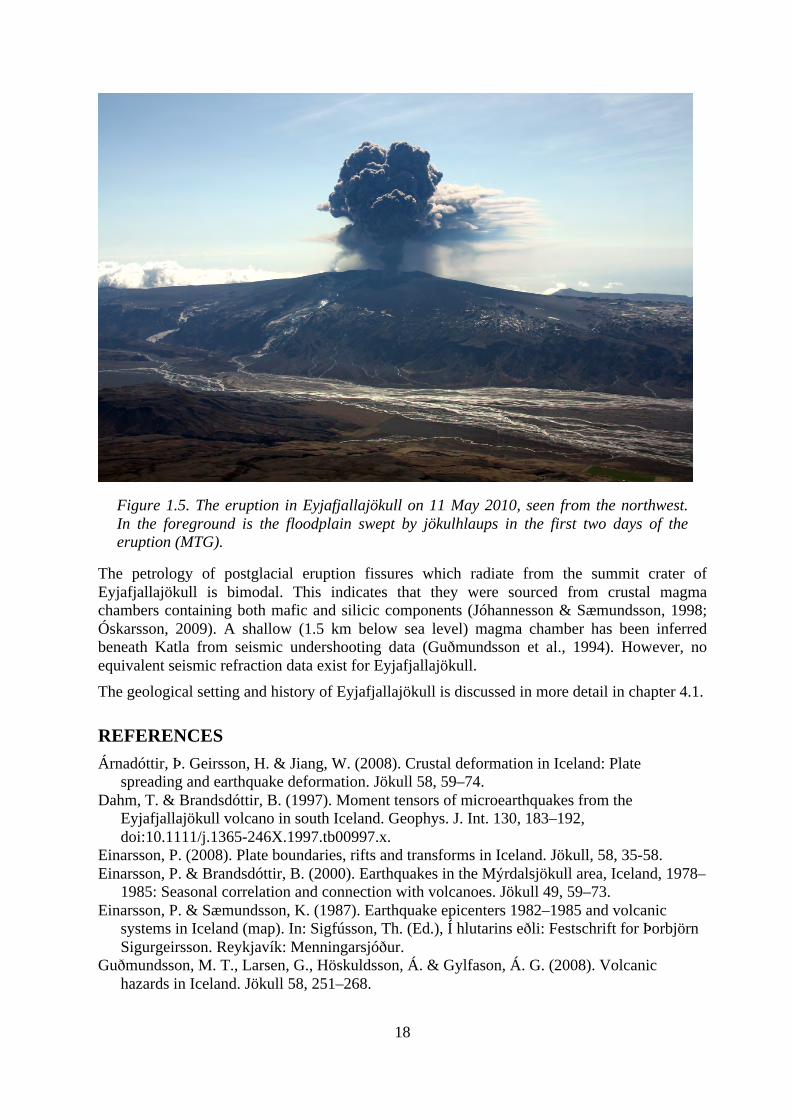
Figure 1.5. The eruption in Eyjafjallajökull on 11 May 2010, seen from the northwest. In the foreground is the floodplain swept by jökulhlaups in the first two days of the eruption (MTG).
The petrology of postglacial eruption fissures which radiate from the summit crater of Eyjafjallajökull is bimodal. This indicates that they were sourced from crustal magma chambers containing both mafic and silicic components (Jóhannesson & Sæmundsson, 1998; Óskarsson, 2009). A shallow (1.5 km below sea level) magma chamber has been inferred beneath Katla from seismic undershooting data (Guðmundsson et al., 1994). However, no equivalent seismic refraction data exist for Eyjafjallajökull. The geological setting and history of Eyjafjallajökull is discussed in more detail in chapter 4.1.
REFERENCES Árnadóttir, Þ. Geirsson, H. & Jiang, W. (2008). Crustal deformation in Iceland: Plate
spreading and earthquake deformation. Jökull 58, 59–74. Dahm, T. & Brandsdóttir, B. (1997). Moment tensors of microearthquakes from the
Eyjafjallajökull volcano in south Iceland. Geophys. J. Int. 130, 183–192, doi:10.1111/j.1365-246X.1997.tb00997.x.
Einarsson, P. (2008). Plate boundaries, rifts and transforms in Iceland. Jökull, 58, 35-58. Einarsson, P. & Brandsdóttir, B. (2000). Earthquakes in the Mýrdalsjökull area, Iceland, 1978–
1985: Seasonal correlation and connection with volcanoes. Jökull 49, 59–73. Einarsson, P. & Sæmundsson, K. (1987). Earthquake epicenters 1982–1985 and volcanic
systems in Iceland (map). In: Sigfússon, Th. (Ed.), Í hlutarins eðli: Festschrift for Þorbjörn Sigurgeirsson. Reykjavík: Menningarsjóður.
Guðmundsson, M. T., Larsen, G., Höskuldsson, Á. & Gylfason, Á. G. (2008). Volcanic hazards in Iceland. Jökull 58, 251–268.
19
Gudmundsson, M. T., Thordarson, T., Höskuldsson, Á, Larsen, G., Björnsson, H., Prata, F., Oddsson, B., Magnússon, E., Högnadóttir, Þ., Petersen, G. N., Hayworth, C., Stevenson, J. & Jónsdóttir, I. (submitted). Ash generation and distribution from the April-May 2010 eruption of Eyjafjallajökull, Iceland. Submitted to Scientifc ReportsEPSL.
Hjaltadóttir, S., Vogfjörð, K. S. & Slunga, R. (2009). Seismic signs of magma pathways through the crust in the Eyjafjallajökull volcano, south Iceland. Rep. VI 2009-13, Icelandic Meteorol. Off., Reykjavík, 33 pp.
Jakobsdóttir, S. S. (2008). Seismicity in Iceland: 1994–2007. Jökull 58, 75–100. Jakobsson, S.P., Fitton, J.G. & Sigurdsson, I.A. (2008). The three igneous rock series of
Iceland. Jökull, 58, 117-138. Jóhannesson, H. & Sæmundsson, K. (1998). Geological map of Iceland, bedrock geology,
scale 1:500,000, Icelandic Inst. of Natl. Hist. and Icelandic Geod. Surv., Reykjavík. Larsen, G. (1999). Gosið í Eyjafjallajökli 1821–23. Rep. RH-28-99, Sci. Inst., Univ. of
Iceland, Reykjavík, 13 pp. Larsen, G. (2000). Holocene eruptions within the Katla volcanic system, south Iceland:
Characteristics and environmental impact. Jökull 49, 1–28. Óskarsson, B. V. (2009). The Skerin ridge on Eyjafjallajökull, south Iceland: Morphology and
magma-ice interaction in an ice-confined silicic fissure eruption. MS thesis, Fac. of Earth Sci., Univ. of Iceland, Reykjavík.
Pedersen, R. & Sigmundsson, F. (2004). InSAR based sill model links spatially offset areas of deformation and seismicity for the 1994 unrest episode at Eyjafjallajökull volcano, Iceland. Geophys. Res. Lett. 31, L14610, doi:10.1029/2004GL020368.
Pedersen, R. & Sigmundsson, F. (2006). Temporal development of the 1999 intrusive episode in the Eyjafjallajökull volcano, Iceland, derived from InSAR images. Bull. Volcanol. 68, 377- 393, doi:10.1007/s00445-005-0020-y.
Sigmundsson, F. et al. (2010). Intrusion triggering of the 2010 Eyjafjallajökull explosive eruption. Nature 468, 426–430, doi:10.1038/nature09558.
Sturkell, E., Sigmundsson, F. & Einarsson, P. (2003). Recent unrest and magma movements at Eyjafjallajökull and Katla volcanoes, Iceland. J. Geophys. Res. 108(B8), 2369, doi:10.1029/2001JB000917.
Thordarson, T. &. Larsen, G. (2007). Volcanism in Iceland in historical time: Volcano types, eruption styles and eruptive history. J. Geodynamics 43, 118–152.
Thoroddsen, T. (1925). Die Geschichte der Isländischen Vulkane, 458 pp., Copenhagen: A. F. Høst.
20
2 IMO, IES and NCIP-DCPEM – a short overview of the institutes
The institutes collaborating on this report are the Icelandic Meteorological Office, the Institute of Earth Sciences, University of Iceland, and the Department of Civil Protection and Emergency Management of the National Commissioner of the Icelandic Police.
The Icelandic Meteorological Office (IMO) is a public institute, historically based on the Icelandic Meteorological Office (est. 1920) and the Icelandic Hydrological Survey (est. 1948). The two institutes merged 1 January 2009, with the responsibility of monitoring natural hazards in Iceland and issuing forecasts and warnings. IMO conducts research in related fields, as well as participating in international monitoring and research. The institute has a staff of 138 people, of which 60 staff members work on research-related activities.
The Institute of Earth Sciences (IES), an independent part of the University of Iceland’s Science Institute, is the main site of academic research in earth sciences in Iceland. It was established in 2004 by the merger of the Nordic Volcanological Institute (est. 1974) and the departments of geology and geophysics at the University’s Science Institute (est. 1964). The Institute provides research facilities for the about 30 teaching and research faculty members, 5-6 Nordic research fellows, several postdoctoral fellows and about 50 graduate students. Research within the Institute is organized into three broadly defined themes: Understanding volcanoes; Environment and climate; and Crustal processes. The Institute hosts the Nordic Volcanological Center (Nordvulk), a research and training center in volcanology for the Nordic countries.
The Department of Civil Protection and Emergency Management of the National Commissioner of the Icelandic Police (NCIP-DCPEM) is the national administrative body for civil protection matters.
2.1 Areas of expertise
2.1.1 Icelandic Meteorological Office IMO’s main areas of expertise are as follows:
• Monitoring, analyzing, interpreting, informing, giving advice and counsel, providing warnings and forecasts and where possible, predicting natural physical processes and related natural hazards.
• Issuing public and aviation alerts about impending natural hazards, such as volcanic ash, extreme weather and flooding.
• Conducting research on the physics of air, land and sea, specifically in the fields of meteorology, hydrology, glaciology, climatology, seismology and volcanology.
• Maintaining high quality service and efficiency in providing information in the interest of the economy, of security affairs, of sustainable usage of natural resources and with regard to other needs of the public and private sector.
21
• Ensuring the accumulation and preservation of data and knowledge regarding the long-term development of natural physical processes such as climate, glacier changes, crustal movements and other environmental issues that fall under IMO’s responsibility.
IMO runs nationwide monitoring systems consisting of manual and automatic weather stations, a network of hydrological gauges in lakes, rivers and groundwater, a seismic station network (SIL) with automatic, real-time data acquisition and earthquake location, a continuous GPS (ISGPS) network, some with high sample rate. A borehole strain meter network is operated in southern Iceland, and weather radars, which can also monitor volcanic plumes, are located in south-western Iceland (since January 1991) and in eastern Iceland (since April 2012) giving almost full coverage of Icelandic land area. In addition, IMO conducts extensive manned monitoring of glacial rivers and jökulhlaup events, of glacier mass balance and margin positions and participates in nationwide GPS campaign measurements. IMO has a long-term advisory role with the NCIP-DCPEM and issues public alerts about impending natural hazards. The institute participates in international weather and aviation alert systems, such as London Volcanic Ash Advisory Centre (VAAC), the Icelandic Aviation Oceanic Area Control Center (OAC Reykjavík) and the European alarm system for extreme weather, Meteoalarm.
IMO has participated in several European and Nordic funded research projects, having the role of lead partner in some of them. This includes for example the recently completed "Climate and Energy Systems" project, whose goal was to look at climate impacts on renewable energy and assess the development of the Nordic electricity system for the next 20-30 years.
The main research focus of IMO is on earthquake and volcanic processes and hazards, glacial studies, ice-volcano interaction and climate change. IMO also focuses on research in multi-parameter geophysical monitoring to develop better forecasts of hazardous events.
2.1.2 Institute of Earth Sciences, University of Iceland Over 50% of the staff of IES is active in volcanology-related research, not least through the Nordic Volcanological Center. Besides, IES has expertise in several areas of earth sciences but the following fields are particularly relevant for research and monitoring of volcanoes and eruptions.
• Physical volcanology: studies of volcanic activity, including conduit processes, mechanisms of explosive eruptions, lava emplacement, fallout of tephra, tephrochronology, geological studies of past eruptions and the physical properties of volcanic products. Studies of eruption histories of individual volcanic systems.
• Petrology: the Institute has a large petrology lab which allows analysis of major and trace elements in volcanic products, as well as their isotope composition.
• Geochemistry: a range of studies of fluid-rock interaction and volatiles are done in the geochemistry labs and through field studies. These techniques are applied to geothermal areas, volcanoes, river geochemistry and weathering.
• Crustal deformation and geodesy: GPS and InSAR studies of crustal deformation, with emphasis on volcanoes. Application and development of models of crustal deformation and subsurface magma migration.
• Geophysics and seismology: application of seismology to the study of crustal structure, use of a range of geophysical techniques to study the structure of volcanoes. An array of geophysical instruments are used for field studies.
• Glaciology and glacier monitoring: Mass balance studies, glacier variations and climate, radio-echo soundings of bedrock, including at ice-covered volcanoes,
22
jökulhlaups and volcano-ice interactions. Airborne radar profiling of ice surfaces for monitoring purposes.
• Glacial geology and palaeoclimate: Studies of palaeoenvironments and climate from sedimentary and volcanic rock sequences, including lake and ocean bottom sediment cores, often done by applying tephrochronology for dating.
2.1.3 The Department of Civil Protection and Emergency Management of the National Commissioner of the Icelandic Police
The Department of Civil Protection and Emergency Management of the National Commissioner of the Icelandic Police (NCIP-DCPEM) is the national administrative body for civil protection matters. The area of expertise is within the areas of crisis coordination, crisis management and rescue and relief operations, in particular through:
organizing and implementing measures to protect the wellbeing and safety of the public and prevent them from harm, the protection of property and the environment from disasters, caused by natural or manmade hazards, pandemics, military action or other types of disasters; This includes prevention, preparedness and reductions of hazards and recovery.
rendering relief and assistance due to any losses that have occurred, assist people during emergencies, unless the responsibility for his assistance rests with other authorities or organizations.
2.2 Role of the institutes
2.2.1 Icelandic Meteorological Office The main role of IMO is to monitor, forecast and issue warnings in the field of:
• Meteorology • Hydrology • Glaciology • Seismology and volcanology
In addition, the institute conducts risk assessment in the field of natural hazard.
IMO monitors weather, earth and water processes by data acquisition and data storage. The data are quality controlled, analyzed and research is conducted based on the data. The IMO distributes and provides access to information and also renders other related services to its customers.
Accumulation of knowledge: At IMO, systematic surveys and monitoring are executed to follow developments and gather information on natural physical processes in Iceland and surrounding areas. Data from both domestic and foreign collaborators are used as well as data from IMO’s monitoring systems.
Quality control and the preservation of data: Intensive quality control is practiced at IMO in data acquisition and documentation, ensuring secure and reliable data at all stages of use. IMO is responsible for the long-term preservation and accessibility of data used in both real-time operations as well as research. IMO preserves both raw and processed data in secure data storages and ensures access to the data for the public and collaborators, both domestic and foreign.
23
Data analysis and research: Data from the monitoring systems are analyzed and interpreted at IMO. Data processing provides bases for forecasts and warnings, thereby increasing public safety. IMO also offers consultation in construction design and risk analysis relating to natural hazards. Research at IMO aims to improve its expertise in its fields of specialization, thereby enhancing its ability to fulfill its obligations. IMO participates in domestic and international projects, advancing the development, acquisition and dissemination of information and knowledge. Moreover, the information and knowledge acquired are used to improve customer service. Dissemination of information and service to users: IMO provides the public with general information and specialized services to specific customers. It plays an advisory role to the Icelandic government and works closely with NCIP-DCPEM during natural hazards events such as volcanic eruptions. IMO also participates in public alert and danger awareness programs and risk analysis of natural hazards. IMO conducts measurements and research according to customer contracts. It also handles interactions between various domestic and international institutions in which the daily exchange of data plays a big role.
2.2.2 Institute of Earth Sciences, University of Iceland IES and its predecessors have monitored and done research on all volcanic eruptions in Iceland since the Hekla eruption of 1947. A great deal of work has also been carried out over the decades to unravel the volcanic history of Iceland, not least through the application of tephrochronology. At present, IES is active in volcano monitoring in Iceland in the following areas, often in close cooperation with IMO:
• Aerial observations and inspection of erupting volcanoes, using methods such as airborne SAR, thermal and visual cameras.
• Estimates of magnitudes and styles of eruptions from studies of lava effusion and tephra fallout, characterization of eruptive products through grain size as well as petrological and geochemical analyses.
• Deformation surveying with GPS, both during campaigns and by running continuous GPS, usually in cooperation with IMO. Application of InSAR for the same purposes.
• Installation of portable seismic stations, often in cooperation with others. • River chemistry by regular sampling, including glacial rivers with subglacial
geothermal areas and volcanoes within their ice-covered drainage areas. • Variations in glacier surface over subglacial geothermal areas, especially at Katla and
Grímsvötn.
2.2.3 The Department of Civil Protection and Emergency Management of the National Commissioner of the Icelandic Police
The NCIP-DCPEM is responsible for emergency contingency planning regarding both natural and other hazards, risk communication to the public and coordinating risk and hazard analysis and mitigation. The NCIP-DCPEM is responsible for coordinating rescue and relief efforts and for these purposes it runs the National Crisis Coordination Centre in Reykjavík and has a duty officer on call 24/7 who is responsible for activating the civil protection response system. The NCIP-DCPEM is responsible for issuing warnings to the general public regarding hazards. The NCIP-DCPEM is the national focal or contact point for matters of civil protection and emergency management with respect to United Nations organizations, the European Union, NATO and Nordic cooperative bodies.
24
2.3 IMO contingency plans
Contingency plans are vital part of the activities at IMO. The first draft to a contingency plan with focus on ash dispersion was implemented in late 2002. This contingency plan was under revision and development for several years, during which the need for regular exercises became apparent (see further description in chapter 5.2.1). IMO, Isavia and London VAAC participate in quarterly exercises which help to maintain and update the contingency plans at each institute. The IMO’s contingency plan on volcanic eruptions describes working procedures with special focus on the initial phase of an eruption. It includes contact details for domestic and international institutes and stakeholders who must be notified, as well as contact details for various specialists within IMO. In addition, the plan gives information on the structure of SIGMET (standardized warning messages to the aviation community). At the start of the eruptions in Fimmvörðuháls and Eyjafjallajökull, the contingency plans for volcanic eruptions and dispersion of volcanic ash were in place and the relevant procedures were followed.
IMO implemented a quality management system (QMS) in 2006. Starting with the aviation weather services which got ISO 9001 certification in November 2006, the scope of the QMS has been gradually expanded to include all weather services, which were certified in June 2007, and several hazards that IMO monitors and responds to by issuing warnings. In recent years the contingency plans have been implemented into the QMS and their number has as well increased considerably. The aim of the institute is to finalize implementation of all contingency plans into the QMS system needed for any kind of operations that falls under the responsibility of IMO, before the end of 2012.
2.4 Communications between agencies
The NCIP-DCPEM maintains a Scientific Council which on average meets twice a year. This council meets more frequently during potentially imminent or ongoing catastrophic events. The Scientific Council is largely made up of experts from IES and IMO but it also includes experts from other university and government institutions. The role of the Scientific Council is to discuss trends and developments regarding natural hazards. The council also provides expert advice on developments for the duration of natural catastrophes or hazard events. It is also the responsibility of both the individual scientists as well as their respective institutes to issue warnings to the NCIP-DCPEM on imminent threats or newly identified hazards. The IMO and the IES keep Civil Protection abreast of developments on a regular basis.
25
3 Overview of the geophysical monitoring systems in Iceland
Authors: SSJ, BB, SHr, MJR, GS, ESE, MTG, ÞH, ÁS, ÞA, FS, GNP, HB, BP, HÞ, ÓÞ, ÁGG, SK, TFH Seismic and hydrological monitoring systems have been operated in Iceland since 1925 and 1947, respectively. At present, the IMO’s systems for monitoring Iceland’s volcanic zones consist of a 63-station seismic network (SIL) with automatic, real-time data acquisition and earthquake location, a continuous GPS (ISGPS) network of 70 stations (14 of them are in the ownership of IMO, the remaining stations are the property of other institutes and universities, but most of them are run and maintained by IMO), a 4-station borehole strain-meter network in southern Iceland, 170 hydrological gauging stations, 90 manual weather stations and 112 automatic weather stations. The Keflavík weather radar is also used to monitor volcanic plumes. Since April 2012 a second C-band weather radar has been installed in eastern Iceland, which will improve the monitoring of volcanic ash plumes, see further in chapter 5.4.4. In addition to the permanent IMO networks, IES carries out regular radar profiling flights over the Katla and Eyjafjallajökull to monitor changes in geothermal activity under the ice caps. Intermittently, IES samples glacial rivers for geochemical monitoring. Temporary seismic and GPS stations are operated by the IES in collaboration with the IMO and the Iceland GeoSurvey (ISOR). Six additional seismic stations were installed by IES three weeks prior to the Fimmvörðuháls flank eruption that began 20 March 2010. GPS and InSAR monitoring of Eyjafjallajökull were also intensified in early March 2010.
3.1 Seismic monitoring system (SIL)
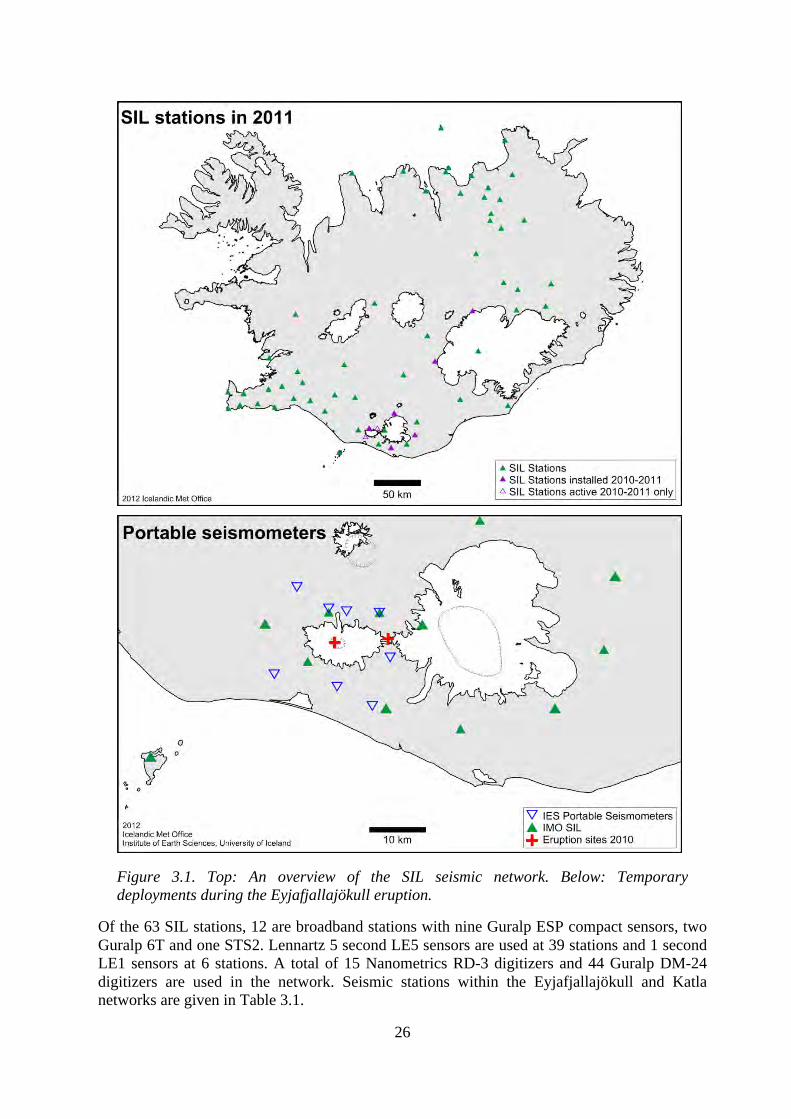
Monitoring of earthquake activity and tremor has had a fundamental role in eruption forecasts in Iceland (Einarsson et al., 1997; Vogfjörð et al., 2005; Höskuldsson et al., 2007, Guðmundsson et al., 2010). Since late 1996, low frequency (0.5–4 Hz) seismic tremor has been routinely monitored on all stations in the SIL system. Strong, unambiguous tremor signals have been observed during each of the six confirmed volcanic eruptions since 1996. Real-time processing of the tremor data consists of applying digital band-pass filters to the digitized signals for each of the three components (north, east and vertical), in three frequency bands: 0.5–1 Hz, 1–2 Hz and 2–4 Hz. One minute averages of the signal amplitude on each component and each frequency band are transmitted to the processing center and saved. The results can be displayed, for any or all stations, in near-real time. The maximum latency is about 6 minutes. Currently, the SIL-system consists of a network of 63 three component digital seismic stations (Figure 3.1) with automatic processing software, which detects and locates earthquakes, estimates magnitude and calculates fault plane solutions. The SIL system is designed to detect and process data for earthquakes down to magnitude less than zero (Stefánsson et al., 1993; Böðvarsson et al., 1996; Böðvarsson et al., 1999; Jakobsdóttir et al., 2002). The sensitivity of the system depends on the station spacing, which is densest within the rift zones where earthquakes down to magnitudes less than 0.5 are detected and even down to -0.5 in the best covered areas. The system detects both tectonic and volcanic earthquakes.
26
Figure 3.1. Top: An overview of the SIL seismic network. Below: Temporary deployments during the Eyjafjallajökull eruption.
Of the 63 SIL stations, 12 are broadband stations with nine Guralp ESP compact sensors, two Guralp 6T and one STS2. Lennartz 5 second LE5 sensors are used at 39 stations and 1 second LE1 sensors at 6 stations. A total of 15 Nanometrics RD-3 digitizers and 44 Guralp DM-24 digitizers are used in the network. Seismic stations within the Eyjafjallajökull and Katla networks are given in Table 3.1.
27
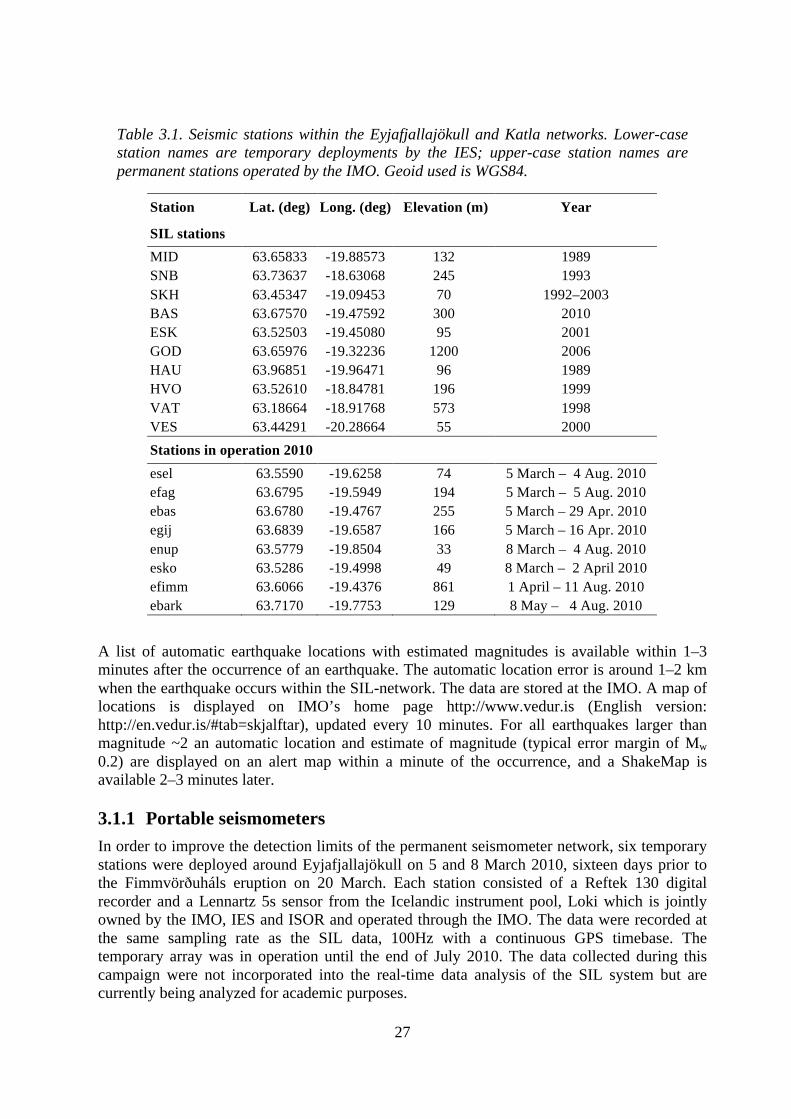
Table 3.1. Seismic stations within the Eyjafjallajökull and Katla networks. Lower-case station names are temporary deployments by the IES; upper-case station names are permanent stations operated by the IMO. Geoid used is WGS84.
Station Lat. (deg) Long. (deg) Elevation (m) Year SIL stations MID 63.65833 -19.88573 132 1989 SNB 63.73637 -18.63068 245 1993 SKH 63.45347 -19.09453 70 1992–2003 BAS 63.67570 -19.47592 300 2010 ESK 63.52503 -19.45080 95 2001 GOD 63.65976 -19.32236 1200 2006 HAU 63.96851 -19.96471 96 1989 HVO 63.52610 -18.84781 196 1999 VAT 63.18664 -18.91768 573 1998 VES 63.44291 -20.28664 55 2000 Stations in operation 2010 esel 63.5590 -19.6258 74 5 March – 4 Aug. 2010 efag 63.6795 -19.5949 194 5 March – 5 Aug. 2010 ebas 63.6780 -19.4767 255 5 March – 29 Apr. 2010 egij 63.6839 -19.6587 166 5 March – 16 Apr. 2010 enup 63.5779 -19.8504 33 8 March – 4 Aug. 2010 esko 63.5286 -19.4998 49 8 March – 2 April 2010 efimm 63.6066 -19.4376 861 1 April – 11 Aug. 2010 ebark 63.7170 -19.7753 129 8 May – 4 Aug. 2010
A list of automatic earthquake locations with estimated magnitudes is available within 1–3 minutes after the occurrence of an earthquake. The automatic location error is around 1–2 km when the earthquake occurs within the SIL-network. The data are stored at the IMO. A map of locations is displayed on IMO’s home page http://www.vedur.is (English version: http://en.vedur.is/#tab=skjalftar), updated every 10 minutes. For all earthquakes larger than magnitude ~2 an automatic location and estimate of magnitude (typical error margin of Mw 0.2) are displayed on an alert map within a minute of the occurrence, and a ShakeMap is available 2–3 minutes later.
3.1.1 Portable seismometers In order to improve the detection limits of the permanent seismometer network, six temporary stations were deployed around Eyjafjallajökull on 5 and 8 March 2010, sixteen days prior to the Fimmvörðuháls eruption on 20 March. Each station consisted of a Reftek 130 digital recorder and a Lennartz 5s sensor from the Icelandic instrument pool, Loki which is jointly owned by the IMO, IES and ISOR and operated through the IMO. The data were recorded at the same sampling rate as the SIL data, 100Hz with a continuous GPS timebase. The temporary array was in operation until the end of July 2010. The data collected during this campaign were not incorporated into the real-time data analysis of the SIL system but are currently being analyzed for academic purposes.
28
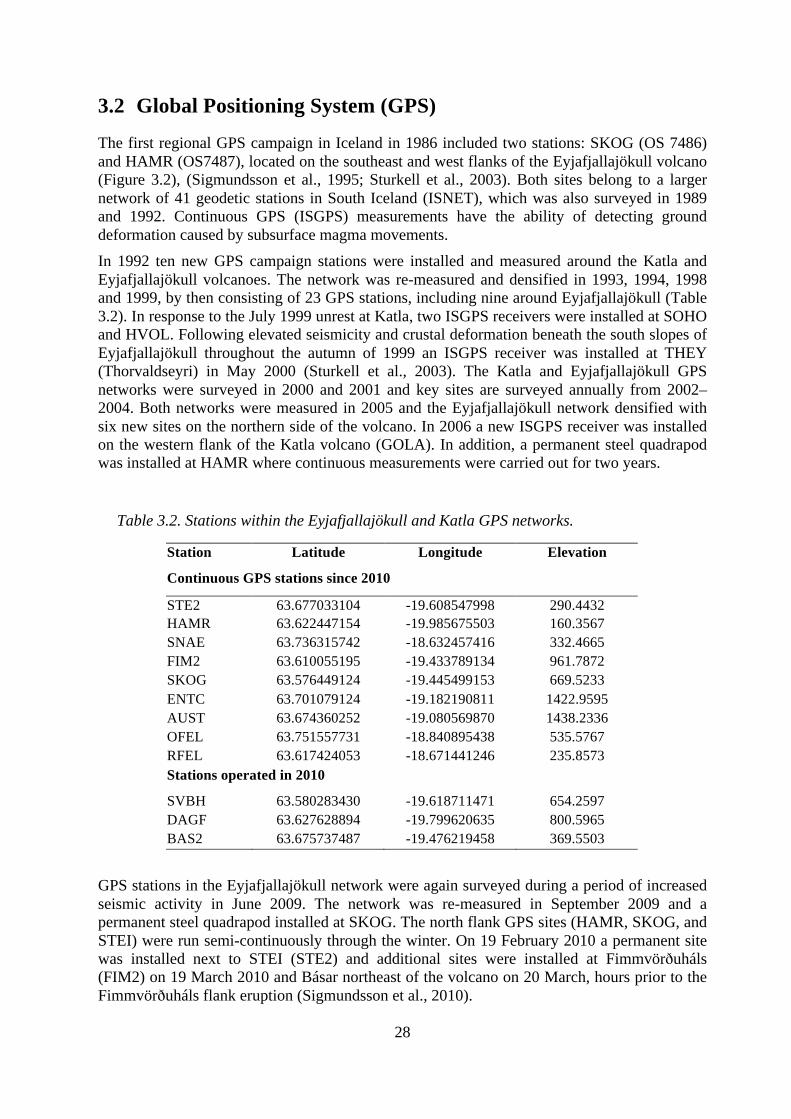
3.2 Global Positioning System (GPS)
The first regional GPS campaign in Iceland in 1986 included two stations: SKOG (OS 7486) and HAMR (OS7487), located on the southeast and west flanks of the Eyjafjallajökull volcano (Figure 3.2), (Sigmundsson et al., 1995; Sturkell et al., 2003). Both sites belong to a larger network of 41 geodetic stations in South Iceland (ISNET), which was also surveyed in 1989 and 1992. Continuous GPS (ISGPS) measurements have the ability of detecting ground deformation caused by subsurface magma movements. In 1992 ten new GPS campaign stations were installed and measured around the Katla and Eyjafjallajökull volcanoes. The network was re-measured and densified in 1993, 1994, 1998 and 1999, by then consisting of 23 GPS stations, including nine around Eyjafjallajökull (Table 3.2). In response to the July 1999 unrest at Katla, two ISGPS receivers were installed at SOHO and HVOL. Following elevated seismicity and crustal deformation beneath the south slopes of Eyjafjallajökull throughout the autumn of 1999 an ISGPS receiver was installed at THEY (Thorvaldseyri) in May 2000 (Sturkell et al., 2003). The Katla and Eyjafjallajökull GPS networks were surveyed in 2000 and 2001 and key sites are surveyed annually from 2002–2004. Both networks were measured in 2005 and the Eyjafjallajökull network densified with six new sites on the northern side of the volcano. In 2006 a new ISGPS receiver was installed on the western flank of the Katla volcano (GOLA). In addition, a permanent steel quadrapod was installed at HAMR where continuous measurements were carried out for two years.
Table 3.2. Stations within the Eyjafjallajökull and Katla GPS networks.
Station Latitude Longitude Elevation Continuous GPS stations since 2010
STE2 63.677033104 -19.608547998 290.4432 HAMR 63.622447154 -19.985675503 160.3567 SNAE 63.736315742 -18.632457416 332.4665 FIM2 63.610055195 -19.433789134 961.7872 SKOG 63.576449124 -19.445499153 669.5233 ENTC 63.701079124 -19.182190811 1422.9595 AUST 63.674360252 -19.080569870 1438.2336 OFEL 63.751557731 -18.840895438 535.5767 RFEL 63.617424053 -18.671441246 235.8573 Stations operated in 2010 SVBH 63.580283430 -19.618711471 654.2597 DAGF 63.627628894 -19.799620635 800.5965 BAS2 63.675737487 -19.476219458 369.5503
GPS stations in the Eyjafjallajökull network were again surveyed during a period of increased seismic activity in June 2009. The network was re-measured in September 2009 and a permanent steel quadrapod installed at SKOG. The north flank GPS sites (HAMR, SKOG, and STEI) were run semi-continuously through the winter. On 19 February 2010 a permanent site was installed next to STEI (STE2) and additional sites were installed at Fimmvörðuháls (FIM2) on 19 March 2010 and Básar northeast of the volcano on 20 March, hours prior to the Fimmvörðuháls flank eruption (Sigmundsson et al., 2010).
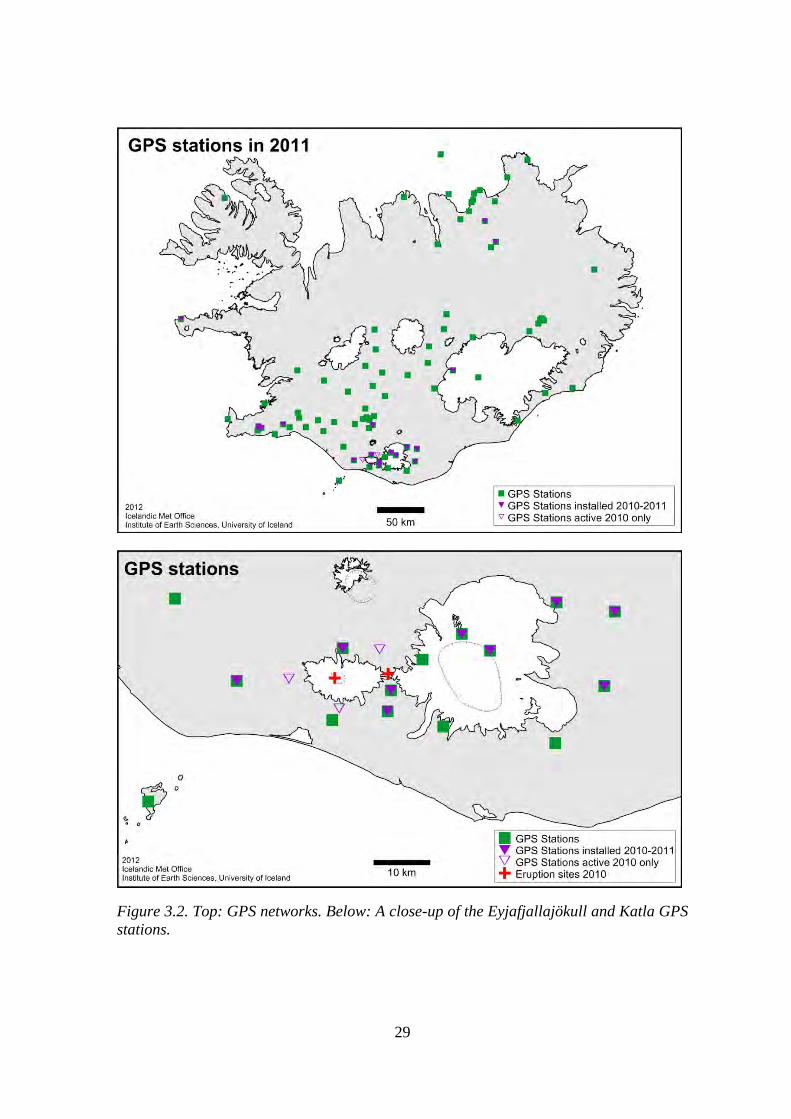
29
Figure 3.2. Top: GPS networks. Below: A close-up of the Eyjafjallajökull and Katla GPS stations.
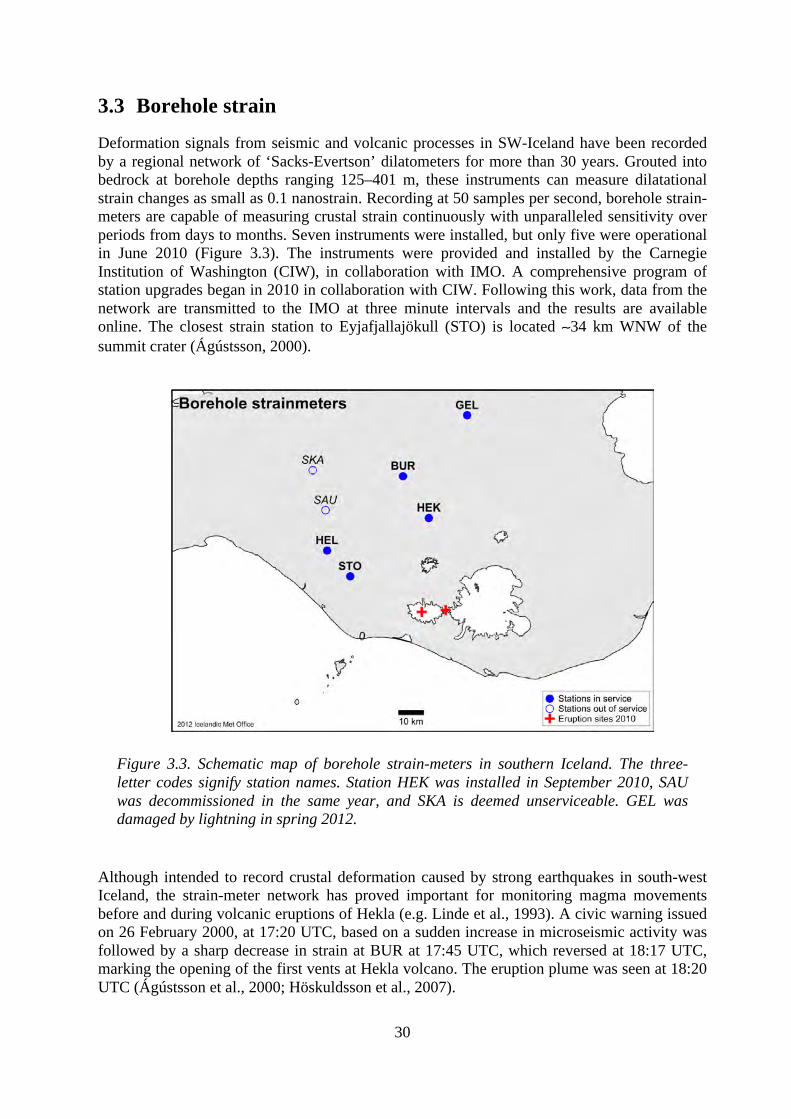
30
3.3 Borehole strain
Deformation signals from seismic and volcanic processes in SW-Iceland have been recorded by a regional network of ‘Sacks-Evertson’ dilatometers for more than 30 years. Grouted into bedrock at borehole depths ranging 125–401 m, these instruments can measure dilatational strain changes as small as 0.1 nanostrain. Recording at 50 samples per second, borehole strain-meters are capable of measuring crustal strain continuously with unparalleled sensitivity over periods from days to months. Seven instruments were installed, but only five were operational in June 2010 (Figure 3.3). The instruments were provided and installed by the Carnegie Institution of Washington (CIW), in collaboration with IMO. A comprehensive program of station upgrades began in 2010 in collaboration with CIW. Following this work, data from the network are transmitted to the IMO at three minute intervals and the results are available online. The closest strain station to Eyjafjallajökull (STO) is located ∼34 km WNW of the summit crater (Ágústsson, 2000).
Figure 3.3. Schematic map of borehole strain-meters in southern Iceland. The three-letter codes signify station names. Station HEK was installed in September 2010, SAU was decommissioned in the same year, and SKA is deemed unserviceable. GEL was damaged by lightning in spring 2012.
Although intended to record crustal deformation caused by strong earthquakes in south-west Iceland, the strain-meter network has proved important for monitoring magma movements before and during volcanic eruptions of Hekla (e.g. Linde et al., 1993). A civic warning issued on 26 February 2000, at 17:20 UTC, based on a sudden increase in microseismic activity was followed by a sharp decrease in strain at BUR at 17:45 UTC, which reversed at 18:17 UTC, marking the opening of the first vents at Hekla volcano. The eruption plume was seen at 18:20 UTC (Ágústsson et al., 2000; Höskuldsson et al., 2007).
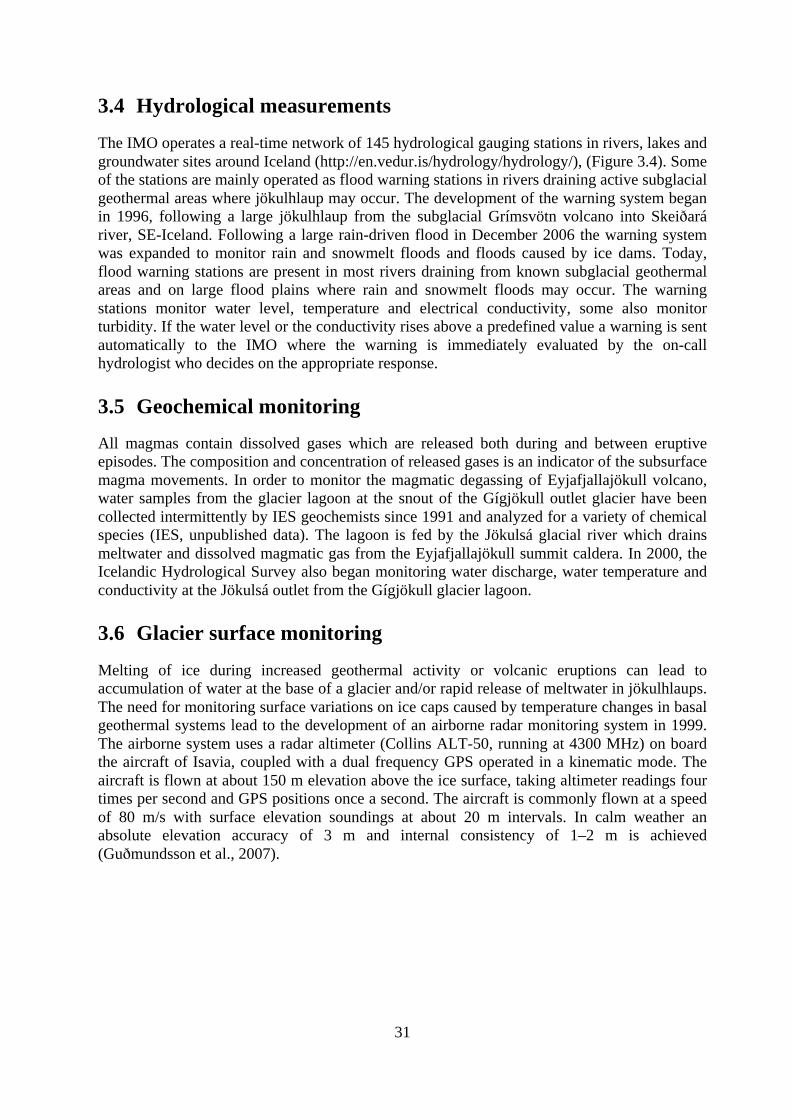
31
3.4 Hydrological measurements
The IMO operates a real-time network of 145 hydrological gauging stations in rivers, lakes and groundwater sites around Iceland (http://en.vedur.is/hydrology/hydrology/), (Figure 3.4). Some of the stations are mainly operated as flood warning stations in rivers draining active subglacial geothermal areas where jökulhlaup may occur. The development of the warning system began in 1996, following a large jökulhlaup from the subglacial Grímsvötn volcano into Skeiðará river, SE-Iceland. Following a large rain-driven flood in December 2006 the warning system was expanded to monitor rain and snowmelt floods and floods caused by ice dams. Today, flood warning stations are present in most rivers draining from known subglacial geothermal areas and on large flood plains where rain and snowmelt floods may occur. The warning stations monitor water level, temperature and electrical conductivity, some also monitor turbidity. If the water level or the conductivity rises above a predefined value a warning is sent automatically to the IMO where the warning is immediately evaluated by the on-call hydrologist who decides on the appropriate response.
3.5 Geochemical monitoring
All magmas contain dissolved gases which are released both during and between eruptive episodes. The composition and concentration of released gases is an indicator of the subsurface magma movements. In order to monitor the magmatic degassing of Eyjafjallajökull volcano, water samples from the glacier lagoon at the snout of the Gígjökull outlet glacier have been collected intermittently by IES geochemists since 1991 and analyzed for a variety of chemical species (IES, unpublished data). The lagoon is fed by the Jökulsá glacial river which drains meltwater and dissolved magmatic gas from the Eyjafjallajökull summit caldera. In 2000, the Icelandic Hydrological Survey also began monitoring water discharge, water temperature and conductivity at the Jökulsá outlet from the Gígjökull glacier lagoon.
3.6 Glacier surface monitoring
Melting of ice during increased geothermal activity or volcanic eruptions can lead to accumulation of water at the base of a glacier and/or rapid release of meltwater in jökulhlaups. The need for monitoring surface variations on ice caps caused by temperature changes in basal geothermal systems lead to the development of an airborne radar monitoring system in 1999. The airborne system uses a radar altimeter (Collins ALT-50, running at 4300 MHz) on board the aircraft of Isavia, coupled with a dual frequency GPS operated in a kinematic mode. The aircraft is flown at about 150 m elevation above the ice surface, taking altimeter readings four times per second and GPS positions once a second. The aircraft is commonly flown at a speed of 80 m/s with surface elevation soundings at about 20 m intervals. In calm weather an absolute elevation accuracy of 3 m and internal consistency of 1–2 m is achieved (Guðmundsson et al., 2007).
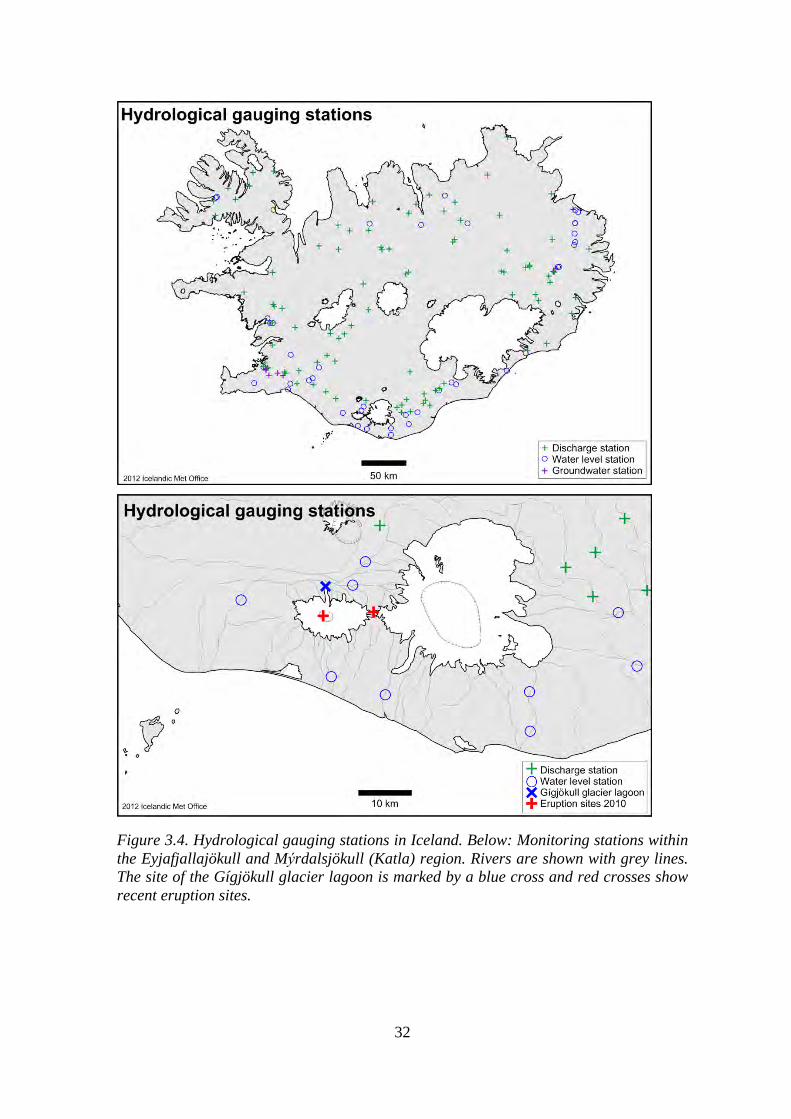
32
Figure 3.4. Hydrological gauging stations in Iceland. Below: Monitoring stations within the Eyjafjallajökull and Mýrdalsjökull (Katla) region. Rivers are shown with grey lines. The site of the Gígjökull glacier lagoon is marked by a blue cross and red crosses show recent eruption sites.
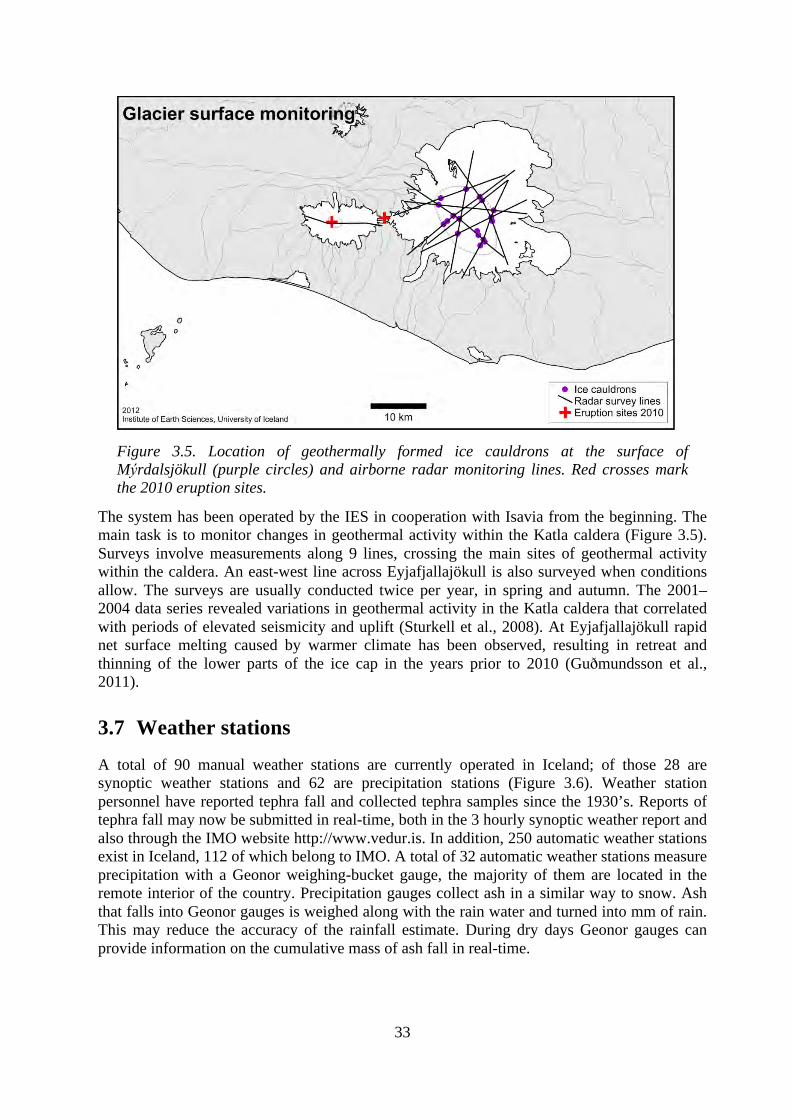
33
Figure 3.5. Location of geothermally formed ice cauldrons at the surface of Mýrdalsjökull (purple circles) and airborne radar monitoring lines. Red crosses mark the 2010 eruption sites.
The system has been operated by the IES in cooperation with Isavia from the beginning. The main task is to monitor changes in geothermal activity within the Katla caldera (Figure 3.5). Surveys involve measurements along 9 lines, crossing the main sites of geothermal activity within the caldera. An east-west line across Eyjafjallajökull is also surveyed when conditions allow. The surveys are usually conducted twice per year, in spring and autumn. The 2001–2004 data series revealed variations in geothermal activity in the Katla caldera that correlated with periods of elevated seismicity and uplift (Sturkell et al., 2008). At Eyjafjallajökull rapid net surface melting caused by warmer climate has been observed, resulting in retreat and thinning of the lower parts of the ice cap in the years prior to 2010 (Guðmundsson et al., 2011).
3.7 Weather stations
A total of 90 manual weather stations are currently operated in Iceland; of those 28 are synoptic weather stations and 62 are precipitation stations (Figure 3.6). Weather station personnel have reported tephra fall and collected tephra samples since the 1930’s. Reports of tephra fall may now be submitted in real-time, both in the 3 hourly synoptic weather report and also through the IMO website http://www.vedur.is. In addition, 250 automatic weather stations exist in Iceland, 112 of which belong to IMO. A total of 32 automatic weather stations measure precipitation with a Geonor weighing-bucket gauge, the majority of them are located in the remote interior of the country. Precipitation gauges collect ash in a similar way to snow. Ash that falls into Geonor gauges is weighed along with the rain water and turned into mm of rain. This may reduce the accuracy of the rainfall estimate. During dry days Geonor gauges can provide information on the cumulative mass of ash fall in real-time.
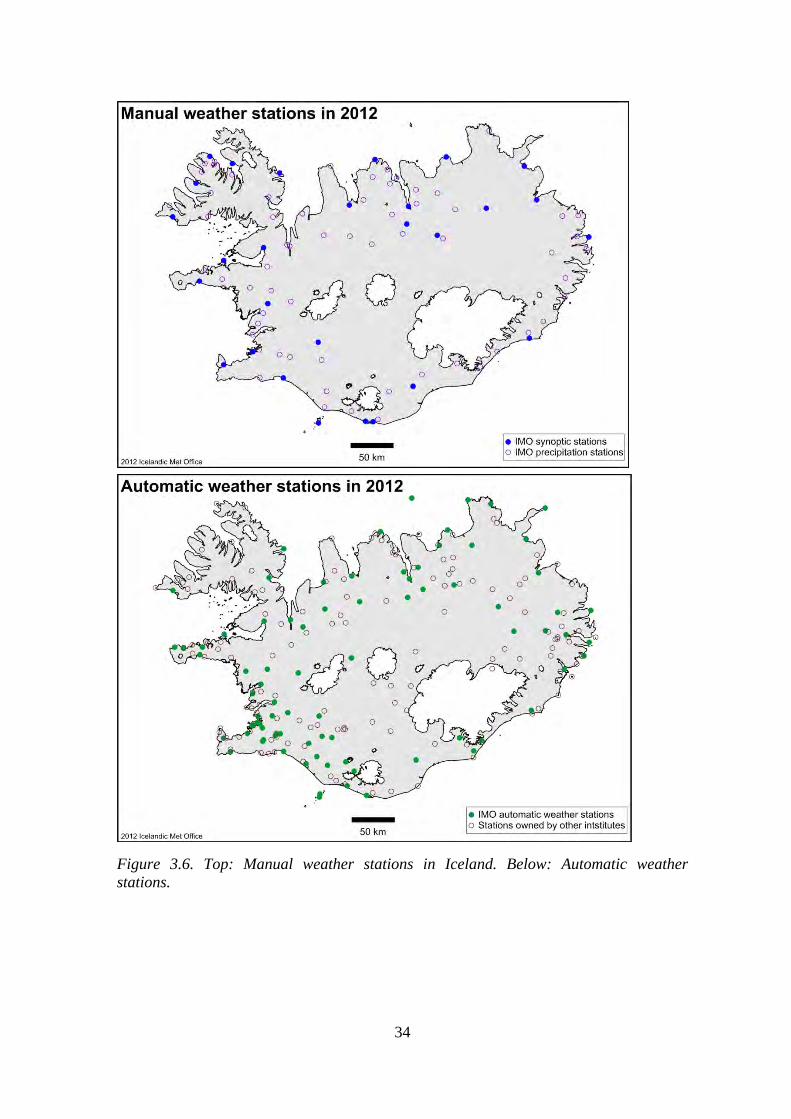
34
Figure 3.6. Top: Manual weather stations in Iceland. Below: Automatic weather stations.
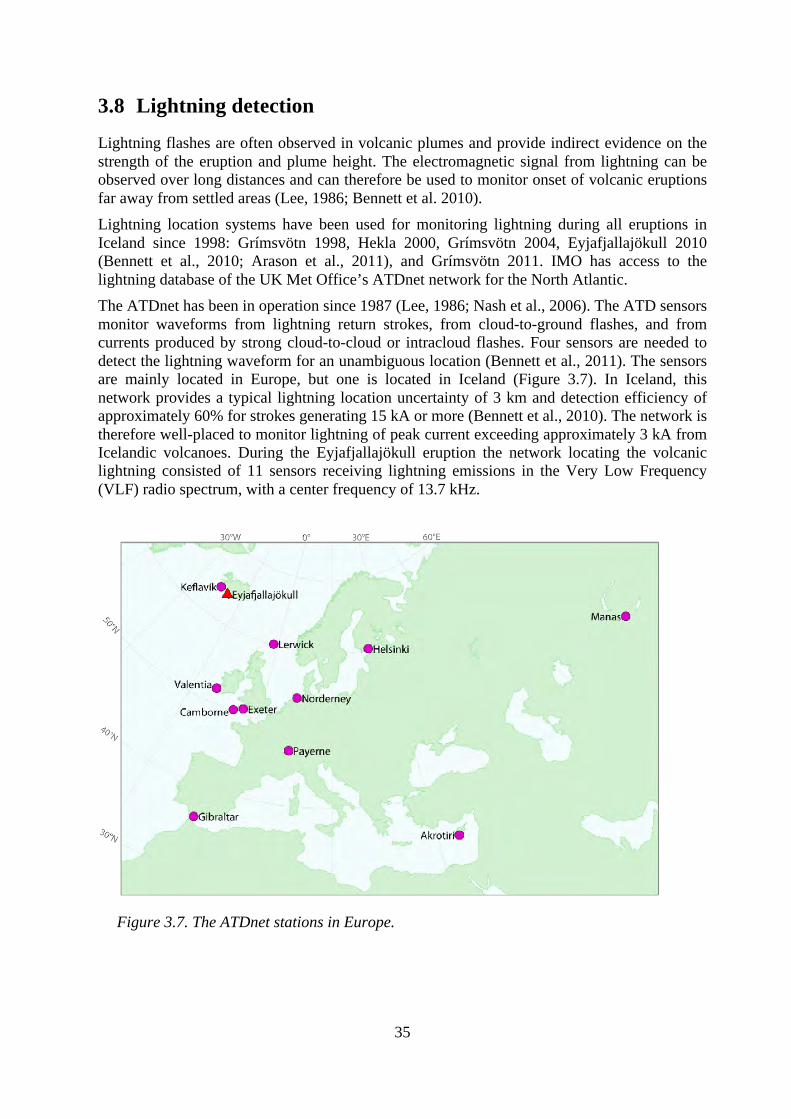
35
3.8 Lightning detection
Lightning flashes are often observed in volcanic plumes and provide indirect evidence on the strength of the eruption and plume height. The electromagnetic signal from lightning can be observed over long distances and can therefore be used to monitor onset of volcanic eruptions far away from settled areas (Lee, 1986; Bennett et al. 2010). Lightning location systems have been used for monitoring lightning during all eruptions in Iceland since 1998: Grímsvötn 1998, Hekla 2000, Grímsvötn 2004, Eyjafjallajökull 2010 (Bennett et al., 2010; Arason et al., 2011), and Grímsvötn 2011. IMO has access to the lightning database of the UK Met Office’s ATDnet network for the North Atlantic. The ATDnet has been in operation since 1987 (Lee, 1986; Nash et al., 2006). The ATD sensors monitor waveforms from lightning return strokes, from cloud-to-ground flashes, and from currents produced by strong cloud-to-cloud or intracloud flashes. Four sensors are needed to detect the lightning waveform for an unambiguous location (Bennett et al., 2011). The sensors are mainly located in Europe, but one is located in Iceland (Figure 3.7). In Iceland, this network provides a typical lightning location uncertainty of 3 km and detection efficiency of approximately 60% for strokes generating 15 kA or more (Bennett et al., 2010). The network is therefore well-placed to monitor lightning of peak current exceeding approximately 3 kA from Icelandic volcanoes. During the Eyjafjallajökull eruption the network locating the volcanic lightning consisted of 11 sensors receiving lightning emissions in the Very Low Frequency (VLF) radio spectrum, with a center frequency of 13.7 kHz.
Figure 3.7. The ATDnet stations in Europe.
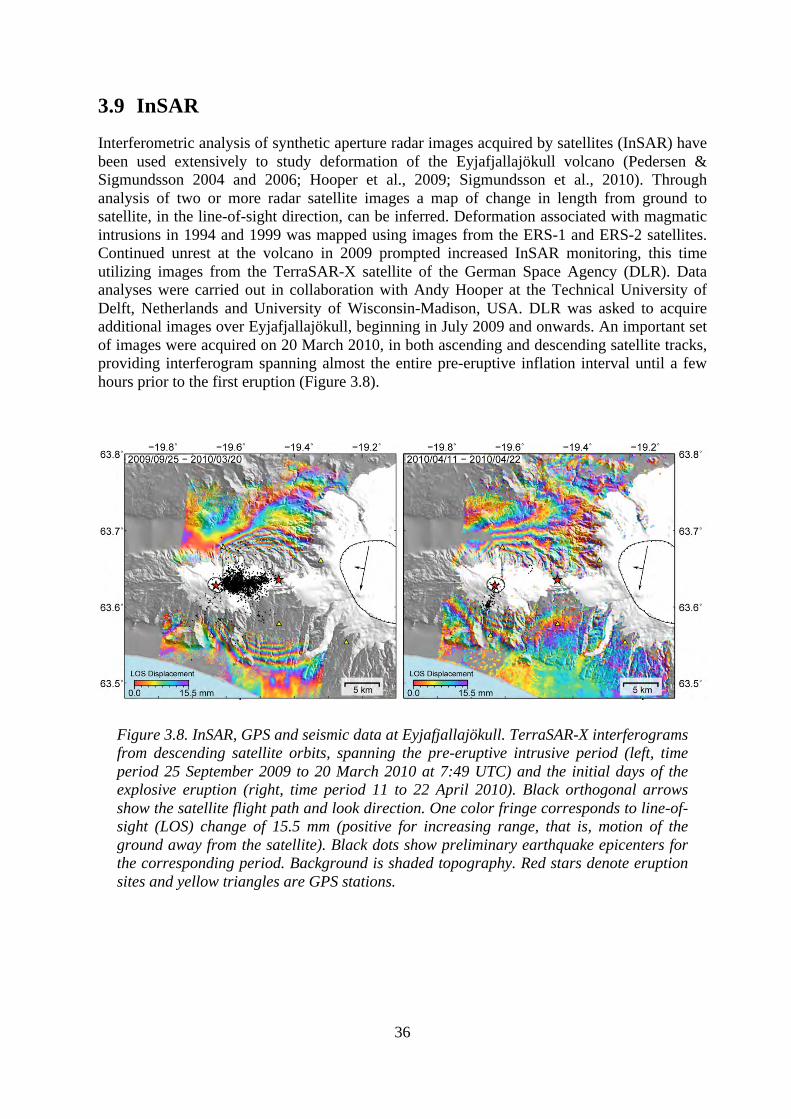
36
3.9 InSAR
Interferometric analysis of synthetic aperture radar images acquired by satellites (InSAR) have been used extensively to study deformation of the Eyjafjallajökull volcano (Pedersen & Sigmundsson 2004 and 2006; Hooper et al., 2009; Sigmundsson et al., 2010). Through analysis of two or more radar satellite images a map of change in length from ground to satellite, in the line-of-sight direction, can be inferred. Deformation associated with magmatic intrusions in 1994 and 1999 was mapped using images from the ERS-1 and ERS-2 satellites. Continued unrest at the volcano in 2009 prompted increased InSAR monitoring, this time utilizing images from the TerraSAR-X satellite of the German Space Agency (DLR). Data analyses were carried out in collaboration with Andy Hooper at the Technical University of Delft, Netherlands and University of Wisconsin-Madison, USA. DLR was asked to acquire additional images over Eyjafjallajökull, beginning in July 2009 and onwards. An important set of images were acquired on 20 March 2010, in both ascending and descending satellite tracks, providing interferogram spanning almost the entire pre-eruptive inflation interval until a few hours prior to the first eruption (Figure 3.8).
Figure 3.8. InSAR, GPS and seismic data at Eyjafjallajökull. TerraSAR-X interferograms from descending satellite orbits, spanning the pre-eruptive intrusive period (left, time period 25 September 2009 to 20 March 2010 at 7:49 UTC) and the initial days of the explosive eruption (right, time period 11 to 22 April 2010). Black orthogonal arrows show the satellite flight path and look direction. One color fringe corresponds to line-of-sight (LOS) change of 15.5 mm (positive for increasing range, that is, motion of the ground away from the satellite). Black dots show preliminary earthquake epicenters for the corresponding period. Background is shaded topography. Red stars denote eruption sites and yellow triangles are GPS stations.
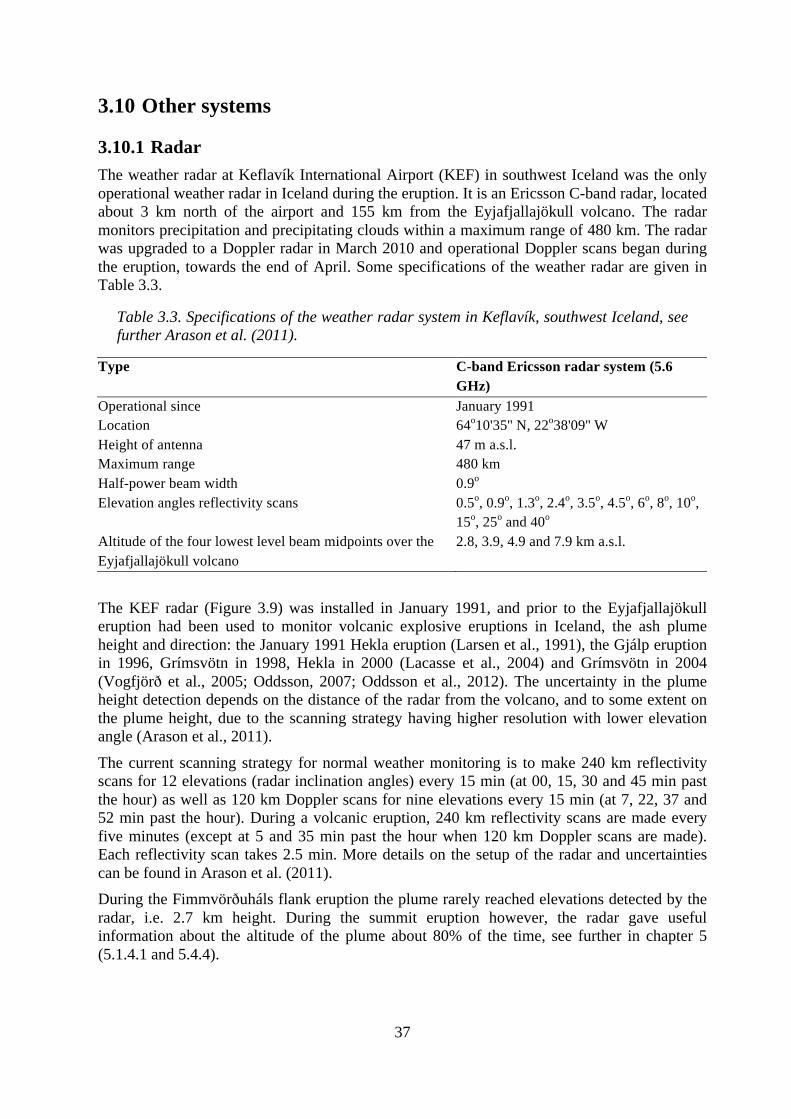
37
3.10 Other systems
3.10.1 Radar The weather radar at Keflavík International Airport (KEF) in southwest Iceland was the only operational weather radar in Iceland during the eruption. It is an Ericsson C-band radar, located about 3 km north of the airport and 155 km from the Eyjafjallajökull volcano. The radar monitors precipitation and precipitating clouds within a maximum range of 480 km. The radar was upgraded to a Doppler radar in March 2010 and operational Doppler scans began during the eruption, towards the end of April. Some specifications of the weather radar are given in Table 3.3.
Table 3.3. Specifications of the weather radar system in Keflavík, southwest Iceland, see further Arason et al. (2011).
Type C-band Ericsson radar system (5.6 GHz)
Operational since January 1991 Location 64o10'35'' N, 22o38'09'' W Height of antenna 47 m a.s.l. Maximum range 480 km Half-power beam width 0.9o
Elevation angles reflectivity scans 0.5o, 0.9o, 1.3o, 2.4o, 3.5o, 4.5o, 6o, 8o, 10o, 15o, 25o and 40o
Altitude of the four lowest level beam midpoints over the Eyjafjallajökull volcano
2.8, 3.9, 4.9 and 7.9 km a.s.l.
The KEF radar (Figure 3.9) was installed in January 1991, and prior to the Eyjafjallajökull eruption had been used to monitor volcanic explosive eruptions in Iceland, the ash plume height and direction: the January 1991 Hekla eruption (Larsen et al., 1991), the Gjálp eruption in 1996, Grímsvötn in 1998, Hekla in 2000 (Lacasse et al., 2004) and Grímsvötn in 2004 (Vogfjörð et al., 2005; Oddsson, 2007; Oddsson et al., 2012). The uncertainty in the plume height detection depends on the distance of the radar from the volcano, and to some extent on the plume height, due to the scanning strategy having higher resolution with lower elevation angle (Arason et al., 2011).
The current scanning strategy for normal weather monitoring is to make 240 km reflectivity scans for 12 elevations (radar inclination angles) every 15 min (at 00, 15, 30 and 45 min past the hour) as well as 120 km Doppler scans for nine elevations every 15 min (at 7, 22, 37 and 52 min past the hour). During a volcanic eruption, 240 km reflectivity scans are made every five minutes (except at 5 and 35 min past the hour when 120 km Doppler scans are made). Each reflectivity scan takes 2.5 min. More details on the setup of the radar and uncertainties can be found in Arason et al. (2011). During the Fimmvörðuháls flank eruption the plume rarely reached elevations detected by the radar, i.e. 2.7 km height. During the summit eruption however, the radar gave useful information about the altitude of the plume about 80% of the time, see further in chapter 5 (5.1.4.1 and 5.4.4).
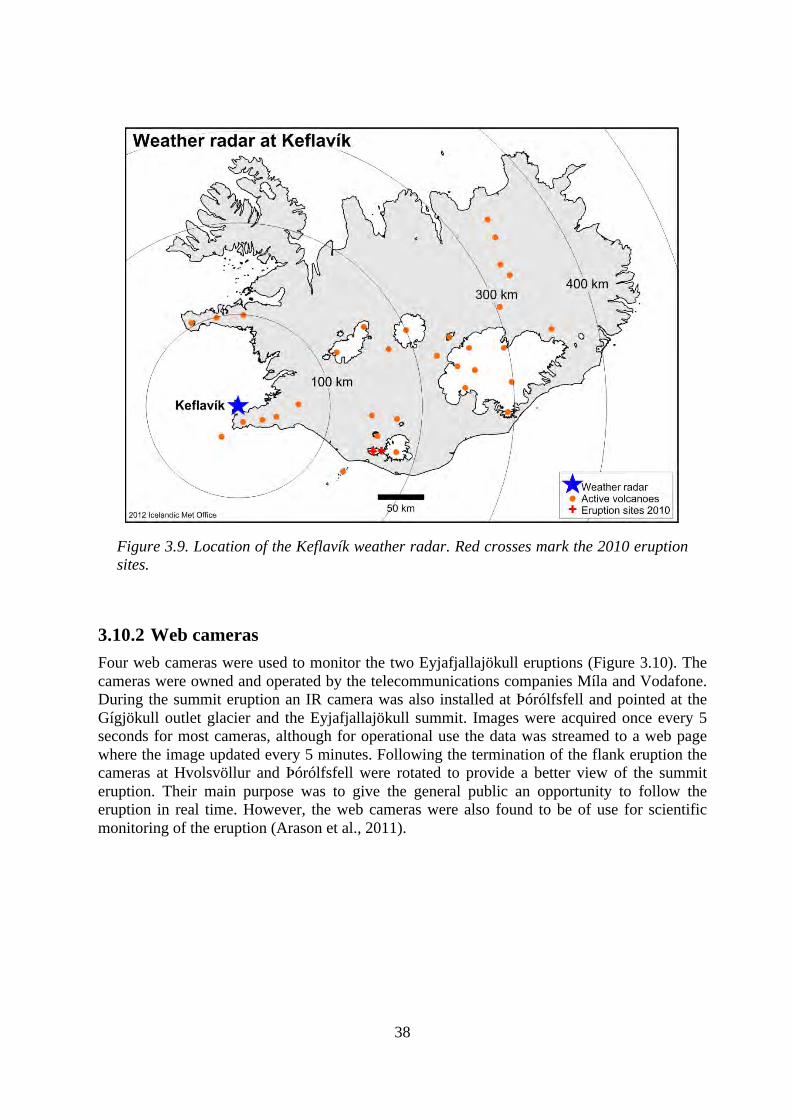
38
Figure 3.9. Location of the Keflavík weather radar. Red crosses mark the 2010 eruption sites.
3.10.2 Web cameras Four web cameras were used to monitor the two Eyjafjallajökull eruptions (Figure 3.10). The cameras were owned and operated by the telecommunications companies Míla and Vodafone. During the summit eruption an IR camera was also installed at Þórólfsfell and pointed at the Gígjökull outlet glacier and the Eyjafjallajökull summit. Images were acquired once every 5 seconds for most cameras, although for operational use the data was streamed to a web page where the image updated every 5 minutes. Following the termination of the flank eruption the cameras at Hvolsvöllur and Þórólfsfell were rotated to provide a better view of the summit eruption. Their main purpose was to give the general public an opportunity to follow the eruption in real time. However, the web cameras were also found to be of use for scientific monitoring of the eruption (Arason et al., 2011).
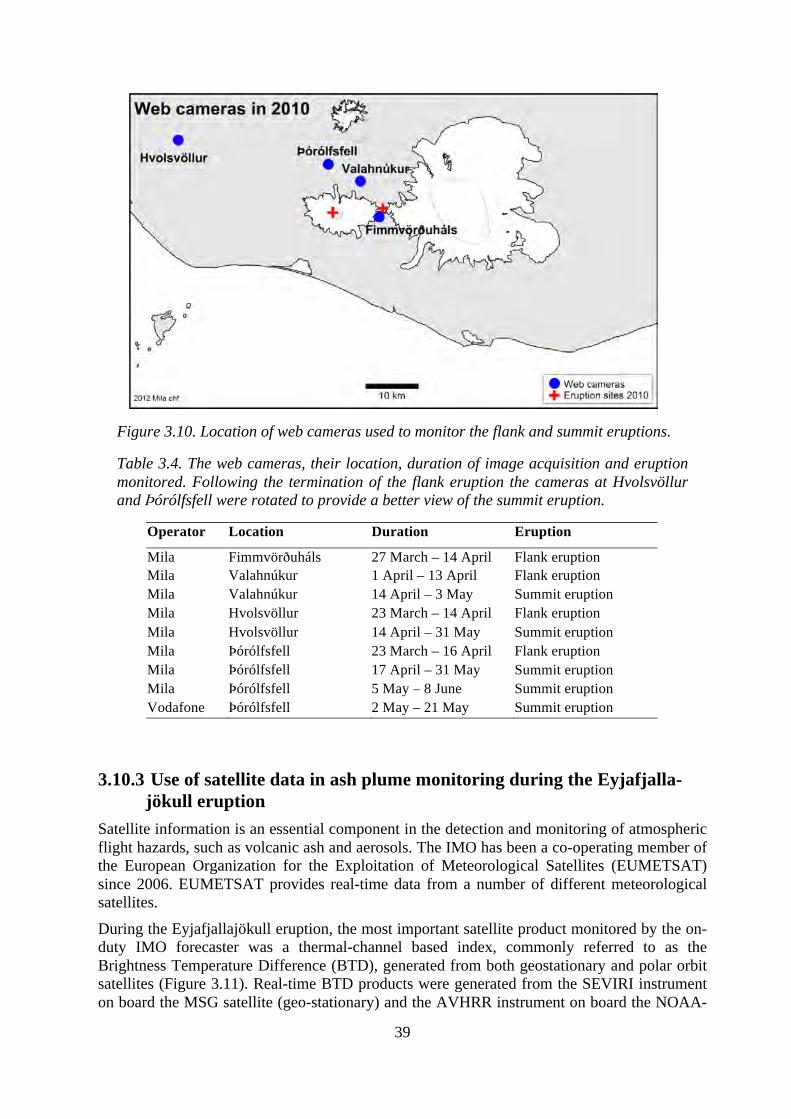
39
Figure 3.10. Location of web cameras used to monitor the flank and summit eruptions.
Table 3.4. The web cameras, their location, duration of image acquisition and eruption monitored. Following the termination of the flank eruption the cameras at Hvolsvöllur and Þórólfsfell were rotated to provide a better view of the summit eruption.
Operator Location Duration Eruption Mila Fimmvörðuháls 27 March – 14 April Flank eruption Mila Valahnúkur 1 April – 13 April Flank eruption Mila Valahnúkur 14 April – 3 May Summit eruption Mila Hvolsvöllur 23 March – 14 April Flank eruption Mila Hvolsvöllur 14 April – 31 May Summit eruption Mila Þórólfsfell 23 March – 16 April Flank eruption Mila Þórólfsfell 17 April – 31 May Summit eruption Mila Þórólfsfell 5 May – 8 June Summit eruption Vodafone Þórólfsfell 2 May – 21 May Summit eruption
3.10.3 Use of satellite data in ash plume monitoring during the Eyjafjalla-jökull eruption
Satellite information is an essential component in the detection and monitoring of atmospheric flight hazards, such as volcanic ash and aerosols. The IMO has been a co-operating member of the European Organization for the Exploitation of Meteorological Satellites (EUMETSAT) since 2006. EUMETSAT provides real-time data from a number of different meteorological satellites.
During the Eyjafjallajökull eruption, the most important satellite product monitored by the on-duty IMO forecaster was a thermal-channel based index, commonly referred to as the Brightness Temperature Difference (BTD), generated from both geostationary and polar orbit satellites (Figure 3.11). Real-time BTD products were generated from the SEVIRI instrument on board the MSG satellite (geo-stationary) and the AVHRR instrument on board the NOAA-
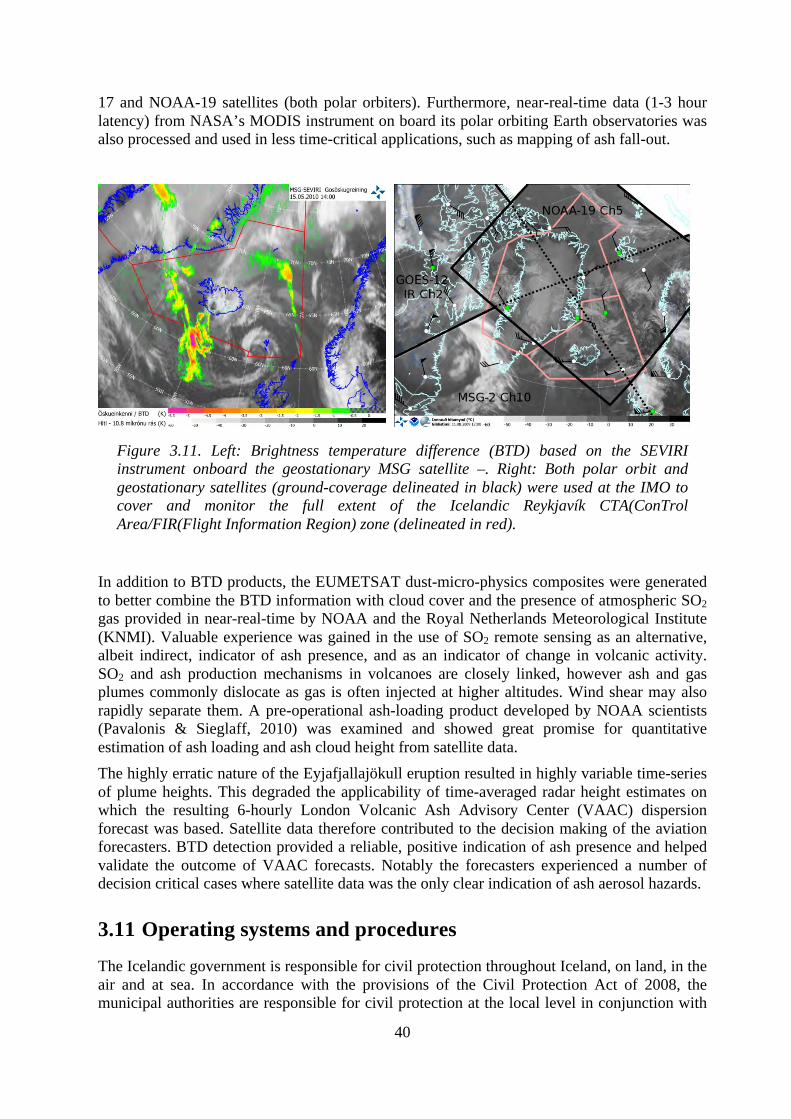
40
17 and NOAA-19 satellites (both polar orbiters). Furthermore, near-real-time data (1-3 hour latency) from NASA’s MODIS instrument on board its polar orbiting Earth observatories was also processed and used in less time-critical applications, such as mapping of ash fall-out.
Figure 3.11. Left: Brightness temperature difference (BTD) based on the SEVIRI instrument onboard the geostationary MSG satellite –. Right: Both polar orbit and geostationary satellites (ground-coverage delineated in black) were used at the IMO to cover and monitor the full extent of the Icelandic Reykjavík CTA(ConTrol Area/FIR(Flight Information Region) zone (delineated in red).
In addition to BTD products, the EUMETSAT dust-micro-physics composites were generated to better combine the BTD information with cloud cover and the presence of atmospheric SO2 gas provided in near-real-time by NOAA and the Royal Netherlands Meteorological Institute (KNMI). Valuable experience was gained in the use of SO2 remote sensing as an alternative, albeit indirect, indicator of ash presence, and as an indicator of change in volcanic activity. SO2 and ash production mechanisms in volcanoes are closely linked, however ash and gas plumes commonly dislocate as gas is often injected at higher altitudes. Wind shear may also rapidly separate them. A pre-operational ash-loading product developed by NOAA scientists (Pavalonis & Sieglaff, 2010) was examined and showed great promise for quantitative estimation of ash loading and ash cloud height from satellite data. The highly erratic nature of the Eyjafjallajökull eruption resulted in highly variable time-series of plume heights. This degraded the applicability of time-averaged radar height estimates on which the resulting 6-hourly London Volcanic Ash Advisory Center (VAAC) dispersion forecast was based. Satellite data therefore contributed to the decision making of the aviation forecasters. BTD detection provided a reliable, positive indication of ash presence and helped validate the outcome of VAAC forecasts. Notably the forecasters experienced a number of decision critical cases where satellite data was the only clear indication of ash aerosol hazards.
3.11 Operating systems and procedures
The Icelandic government is responsible for civil protection throughout Iceland, on land, in the air and at sea. In accordance with the provisions of the Civil Protection Act of 2008, the municipal authorities are responsible for civil protection at the local level in conjunction with
41
the national government. The Minister of the Interior is the supreme authority in the field of Civil Protection and the National Commissioner of Police (NCIP) handles civil protection issues on behalf of the Minister of the Interior. The NCIP makes decisions regarding actions to implement civil protection alert levels in consultation with the respective regional police commissioner. The NCIP maintains a National Crisis Command Center (NCCC) in Reykjavík. This center is responsible for coordinating rescue and relief operations during emergencies such as volcanic eruptions.
3.12 Data flow from IMO to London VAAC and the Icelandic civil aviation authorities
The IMO is responsible by Icelandic law to monitor, forecast and issue warnings in the fields of meteorology, glaciology, hydrology, seismology and volcanology (see chapter 2). IMO is also a State Volcano Observatory, nominated by the Icelandic Civil Aviation Authority (CAA). As such, the institute is responsible for issuing information about the status of volcanoes to the NCIP-DCPEM, London VAAC and Isavia.
According to the contingency plan of IMO prior to the Fimmvörðuháls and Eyjafjallajökull eruptions, the following actions were taken:
• Information about an imminent or commenced eruption, and information on the possible or confirmed plume height as measured by the radar is given through telephone calls to:
o Isavia o London VAAC o Tromsö MWO (to start a telephone chain to the Nordic MWO)
• SIGMET is issued • Information on the eruption progress and plume height is given via telephone 60
minutes prior to issuance of new SIGMETs, i.e. every 3 hours to o London VAAC o Isavia
• Very close communication is maintained between o the meteorologists (forecasters) and geophysicists at IMO o IMO forecasters and London VAAC forecasters
During the Eyjafjallajökull eruption changes were made to the above contingency plan; see further description in chapter 5.2.2, when the Volcanic Ash status Report (VAR) was implemented. The VAR reports were produced by IMO to ensure documentation of the information provided by IMO, as well as to decrease the number of telephone calls and for post-eruption review of procedures and information given. The contingency plan changed as follows:
• Information about an imminent eruption, and information on possible plume height, or plume height detected by radar is given through telephone call to
o Isavia o London VAAC o Tromsö MWO (to start a telephone chain to the Nordic MWO)
• SIGMET is issued
42
• VAR issued every three hours (02:00, 05:00, 08:00, 11:00, 14:00, 17:00, 20:00, 23:00 UTC) with information on
o plume height o plume behavior o color of plume o atmospheric parameters o any other information that might be of interest such as satellite imagery, etc.
• London VAAC calls at 11:00 and 23:00 UTC, prior to their model runs, to get the newest information on the eruption, in particular the height of the ash plume
• IMO calls as frequently as needed to London VAAC with new information • When there is reliable information about changes in the plume height, or the mass of
ash emitted into the atmosphere, IMO informs via telephone: o Isavia o London VAAC
• Very close communication is maintained between o meteorologists (forecasters), geophysicists and hydrologists at IMO o IMO forecasters and London VAAC forecasters
REFERENCES Ágústsson, K. (2000). Katla og Eyjafjallajökull – nokkur líkön og hugleiðingar. Report,
Icelandic Meteorological Office, 00002, 21 p. Ágústsson, K., Stefánsson, R., Linde, A. T., Einarsson, P., Sacks, I. S., Guðmundsson, G. B. & Þorbjarnardóttir, B. (2000). Successful prediction and warning of the 2000 eruption of Hekla based on seismicity and strain changes. Eos Transactions AGU, 81, Fall meeting supplement, abstract V11B-30.
Arason, P., Bennett, A. J. & Burgin, L. E. (2011). Charge mechanism of volcanic lightning revealed during the 2010 eruption of Eyjafjallajökull, J. Geophys. Res., 116, B00C03, 15 pp., doi:10.1029/2011JB008651.
Arason, P., Petersen, G. N., & Björnsson, H. (2011). Observations of the altitude of the volcanic plume during the eruption of Eyjafjallajökull, April–May 2010, Earth Syst. Sci. Data, 3, 9-17, doi:10.5194/essd-3-9-2011.
Bennett, A., Odams, J. P., Edwards, D. & Arason, P. (2010). Monitoring of lightning from the April-May 2010 Eyjafjallajökull volcanic eruption using a very low frequency lightning location network, Environ. Res. Lett., 5, 044013, 8 pp., doi:10.1088/1748-9326/5/4/044013.
Bennett, A. J., Gaffard, C., Nash, J., Callaghan, G. & Atkinson, N. C. (2011). The effect of modal interference on VLF long range lightning location networks using the waveform correlation technique, J. Atmos. Ocean Tech. (in press).
Böðvarsson, R., Rögnvaldsson, S. Th., Jakobsdóttir, S. S., Slunga, R. & Stefánsson, R. (1996). The SIL data acquisition and monitoring system. Seism. Res. Lett. 67, 35–46.
Böðvarsson, R., Rögnvaldsson, S. Th., Slunga, R. & Kjartansson, E. (1999). The SIL data acquisition system at present and beyond year 2000. Phys. Earth Planet. Inter. 113, 89–101.
Einarsson, P., Brandsdóttir, B., Guðmundsson, M. T., Björnsson, H., Grönvold, K. & Sigmundsson, F. (1997). Center of the Iceland Hotspot experiences volcanic unrest. Eos Transactions 78, 369–375.
43
Guðmundsson, M.T., Högnadóttir, Þ., Kristinsson, A.B., Gudbjörnsson, S. (2007). Geothermal activity in the subglacial Katla caldera, Iceland, 1999-2005, studied with radar altimetry. Annals of Glaciology, 45, 66-72.
Guðmundsson, M. T., Pedersen, R. Vogfjörð, K. S., Thorbjarnardóttir, B., Jakobsdóttir, S. S. & Roberts, M. J. (2010). Eruptions of Eyjafjallajökull Volcano, Iceland, Eos Trans. AGU, 91(21), 190, doi:10.1029/2010EO210002.
Guðmundsson, S., Björnsson, H. Magnússon, E., Berthier, E., Pálsson, F. Guðmundsson, M. T. et al. (2011). Glacier mass balance response to regional warming, deduced by remote sensing on three ice caps in S-Iceland. Polar Research,30, 7282.
Hooper, A., Pedersen, R. & Sigmundsson, F. (2009). Constraints on magma intrusion at Eyjafjallajökull and Katla volcanoes in Iceland, from time series SAR interferometry. The VOLUME project – Volcanoes: Understanding subsurface mass movement (eds. Bean, C. J., et al.) 13–24 (University College Dublin).
Höskuldsson, Á., Óskarsson, N., Pedersen, R., Grönvold, K., Vogfjörð, K. S. & Ólafsdóttir, R. (2007). The millennium eruption of Hekla in February 2000. Bull. Volcanol., 70, 169–182, doi:10.1007/s00445-007-0128-3.
Jakobsdóttir S. S., Guðmundsson, G. B. & Stefánsson, R. (2002). Seismicity in Iceland 1991–2000 monitored by the SIL seismic system. Jökull 51, 87–94.
Lacasse, C., Karlsdóttir, S., Larsen, G., Soosalu, H., Rose, W. I. & Ernst, G. G. J. (2004). Weather radar observations of the Hekla 2000 eruption cloud, Iceland, Bull. Volcanol., 66, 457–473.
Larsen, G., Vilmundardóttir, E. & Þorkelsson, B. (1991). Heklugosið 1991: Gjóskufallið og gjóskulagið frá fyrsta degi gossins (The Hekla eruption of 1991 – The tephra fall), Náttúrufræðingurinn, 61, 159–176.
Lee, A. C. L. (1986). An operational system for the remote location of lightning flashes using a VLF arrival time difference technique, J. Atmos. Ocean. Tech., 3, 630-642.
Linde, A.T., Agústsson, K., Sacks, I. S. & Stefánsson, R. (1993). Mechanism of the 1991 eruption of Hekla from continuous borehole strain monitoring. Nature, 365, 737–740.
Nash, J., Atkinson, N. C., Hibbett, E., Callaghan, G., Taylor, P. L., Odams, P., Jenkins, D., Keogh, S., Gaffard, C. & Walker, E. (2006). The new Met Office ATDNET lightning detection system, Proc. WMO Technical Conf. on Instruments and Observing Methods (Geneva, Dec.), 94, paper 2(7).
Oddsson, B. (2007). The Grímsvötn eruption in 2004: Dispersal and total mass of tephra and comparison with plume transport models, Master‘s thesis, University of Iceland.
Oddsson B., Guðmundsson, M. T., Larsen, G. & Karlsdóttir, S. (2012). Monitoring of the plume from the basaltic phreatomagmatic 2004 Grímsvötn eruption - application of weather radar and comparison of plume models. Bulletin of Volcanology 74 doi:10.1007/s00445-012-0598-9.
Pavalonis, M. J. & Sieglaff, J. (2010). GOES-R Advanced Baseline Imager (ABI) Algorithm Theoretical Basis Document for Volcanic Ash: Detection and Height, Version 2.0., 72 pp.
Pedersen, R. & Sigmundsson, F. (2004). InSAR based sill model links spatially offset areas of deformation and seismicity for the 1994 unrest episode at Eyjafjallajökull volcano, Iceland. Geophys. Res. Lett. 31, L14610, doi:10.1029/2004GL020368.
Pedersen, R. & Sigmundsson, F. (2006). Temporal development of the 1999 intrusive episode in the Eyjafjallajökull volcano, Iceland, derived from InSAR images. Bull. Volcanol. 68, 377–393.
Sigmundsson, F., Einarsson, P., Bilham, R. & Sturkell, E. (1995). Rift-transform kinematics in south Iceland: Deformation from Global Positioning System measurements, 1986 to 1992, J. Geophys. Res., 100, 6235–6248.
44
Sigmundsson, F. et al. (2010). Intrusion triggering of the 2010 Eyjafjallajökull explosive eruption, Nature 468, 426–430, doi:10.1038/nature09558
Sturkell, E., Sigmundsson, F. & Einarsson, P. (2003). Recent unrest and magma movements at Eyjafjallajokull and Katla Volcanoes, Iceland. J. Geophys. Res. 108, 2369, doi:10.1029/2001JB000917.
Sturkell, E., Einarsson, P., Roberts, M. J., Geirsson, H., Guðmundsson, M. T., Sigmundsson, F. et al. (2008), Seismic and geodetic insights into magma accumulation at Katla subglacial volcano, Iceland: 1999 to 2005, J. Geophys. Res., 113, B03212, doi:10.1029/2006JB004851.
Vogfjörð, K. S., Jakobsdóttir, S. S., Guðmundsson, G. B., Roberts, M. J., Ágústsson, K., Arason, P. et al. (2005). Forecasting and monitoring a subglacial eruption in Iceland, Eos Trans. AGU, 86, 245–248, doi:10.1029/2005EO260001.
45
4 The flank and summit eruption 2010
4.1 The Eyjafjallajökull volcano
Authors: GL, RP, EI The Eyjafjallajökull central volcano has a relief of about 1.5 km, located at the eastern margin of the southern lowlands. It is 27 km long (E-W) with a maximum width of 14 km (N-S) and it encompasses an area of about 300 km2. Above 800–900 m a.s.l. it is covered by a small glacier, about 80 km2 in area and 14–15 km long in the east-west direction. The maximum thickness of the ice cover before the 2010 eruption was 200–250 m (Strachan, 2001). The small, ice-filled summit caldera is about 2.5 km across with a 1.4 km wide breach towards north. Maximum elevation is 1651 m a.s.l. at the Hámundur nunatak on the southern rim of the summit caldera. The largest outlet glacier, Gígjökull, flows through the breach in the caldera wall, down the northern slope in a steep-sided trench. Overview and toponymy maps of the Eyjafjallajökull region are shown in Figure 4.1.
The Eyjafjallajökull central volcano is mostly constructed by the products of subglacial eruptions, and the oldest rocks at the base of the massif are over 0.8 million years old (Jóhannesson & Sæmundsson, 1998). Here, we discuss Eyjafjallajökull’s Holocene eruptions, i.e. those during the past 12,000 years. Eyjafjallajökull is linked to the larger adjacent Katla volcanic system through east-west striking faults and eruptive fissures (Figure 4.2).
4.1.1 Holocene volcanic history Knowledge of the Holocene volcanic history of Eyjafjallajökull is still incomplete. However, it is recognized that eruptions in the Eyjafjallajökull volcanic system appear to have occurred during two widely separated time periods: (1) in the late glacial-early Holocene, and (2) in the last two millennia (i.e. the Holocene). The Holocene activity may be subdivided into three known kinds of volcanic eruptions:
1) Effusive eruptions on volcanic fissures outside the glacier, extruding lava of basaltic-andesite and occasionally of basaltic composition.
2) Summit eruptions extruding silicic magma (>55% SiO2), either in explosive eruptions as highly fragmented tephra or in mixed explosive and effusive eruptions producing tephra and viscous lava.
3) Eruptions on ice-covered, or partly ice-covered volcanic fissures outside the summit area, extruding silicic to basaltic magma. These eruptions have formed subglacial ridges of hyaloclastite and may also have had explosive subaerial phases. Where the fissures extended outside the glacier, lava effusion has been the dominant mode of eruption.
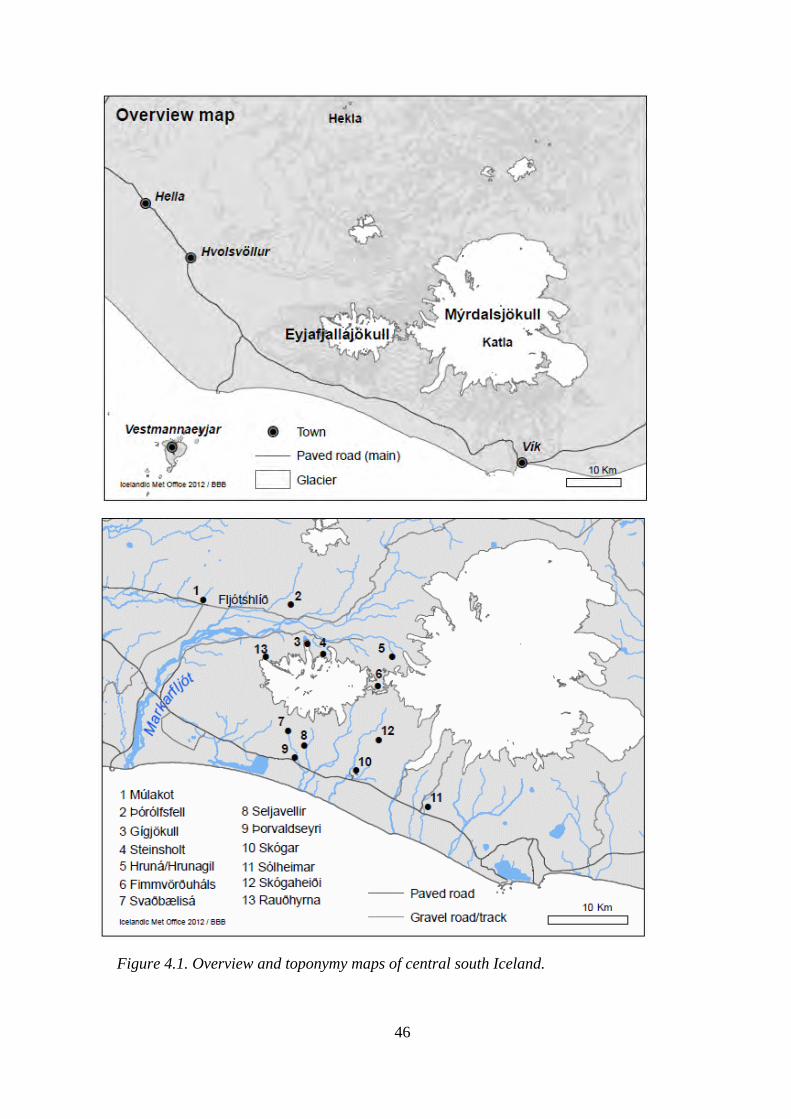
46
Figure 4.1. Overview and toponymy maps of central south Iceland.
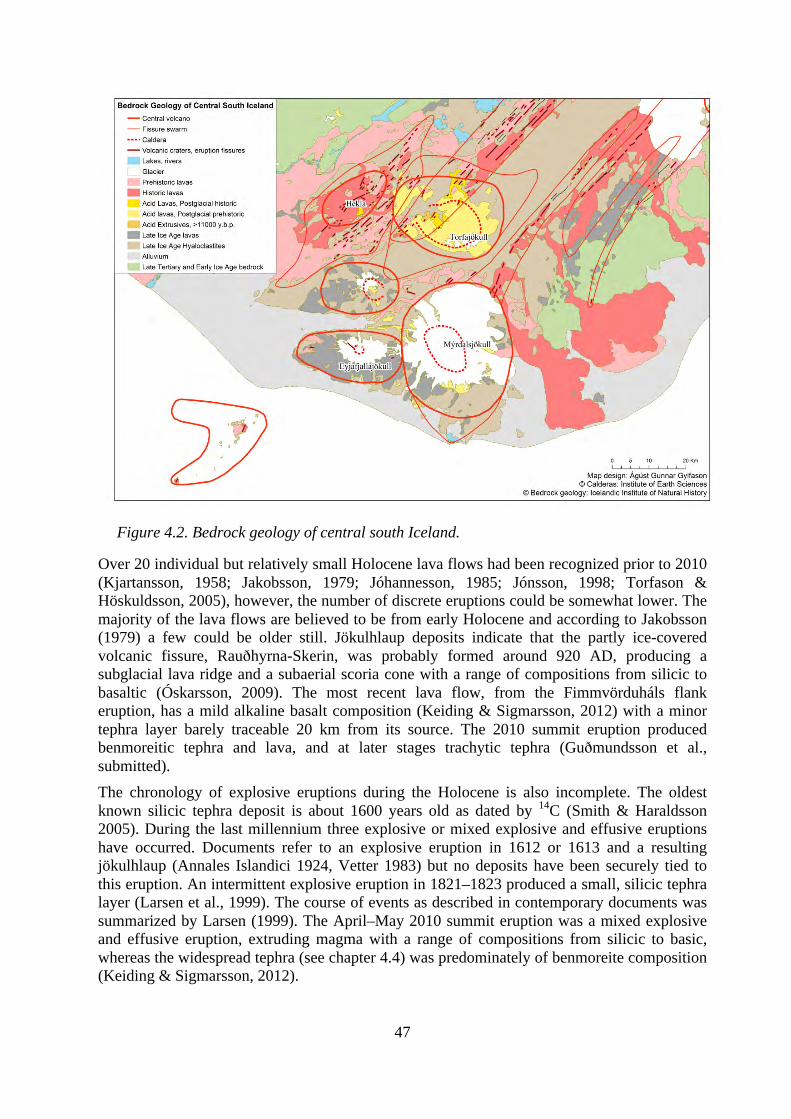
47
Figure 4.2. Bedrock geology of central south Iceland.
Over 20 individual but relatively small Holocene lava flows had been recognized prior to 2010 (Kjartansson, 1958; Jakobsson, 1979; Jóhannesson, 1985; Jónsson, 1998; Torfason & Höskuldsson, 2005), however, the number of discrete eruptions could be somewhat lower. The majority of the lava flows are believed to be from early Holocene and according to Jakobsson (1979) a few could be older still. Jökulhlaup deposits indicate that the partly ice-covered volcanic fissure, Rauðhyrna-Skerin, was probably formed around 920 AD, producing a subglacial lava ridge and a subaerial scoria cone with a range of compositions from silicic to basaltic (Óskarsson, 2009). The most recent lava flow, from the Fimmvörduháls flank eruption, has a mild alkaline basalt composition (Keiding & Sigmarsson, 2012) with a minor tephra layer barely traceable 20 km from its source. The 2010 summit eruption produced benmoreitic tephra and lava, and at later stages trachytic tephra (Guðmundsson et al., submitted). The chronology of explosive eruptions during the Holocene is also incomplete. The oldest known silicic tephra deposit is about 1600 years old as dated by 14C (Smith & Haraldsson 2005). During the last millennium three explosive or mixed explosive and effusive eruptions have occurred. Documents refer to an explosive eruption in 1612 or 1613 and a resulting jökulhlaup (Annales Islandici 1924, Vetter 1983) but no deposits have been securely tied to this eruption. An intermittent explosive eruption in 1821–1823 produced a small, silicic tephra layer (Larsen et al., 1999). The course of events as described in contemporary documents was summarized by Larsen (1999). The April–May 2010 summit eruption was a mixed explosive and effusive eruption, extruding magma with a range of compositions from silicic to basic, whereas the widespread tephra (see chapter 4.4) was predominately of benmoreite composition (Keiding & Sigmarsson, 2012).
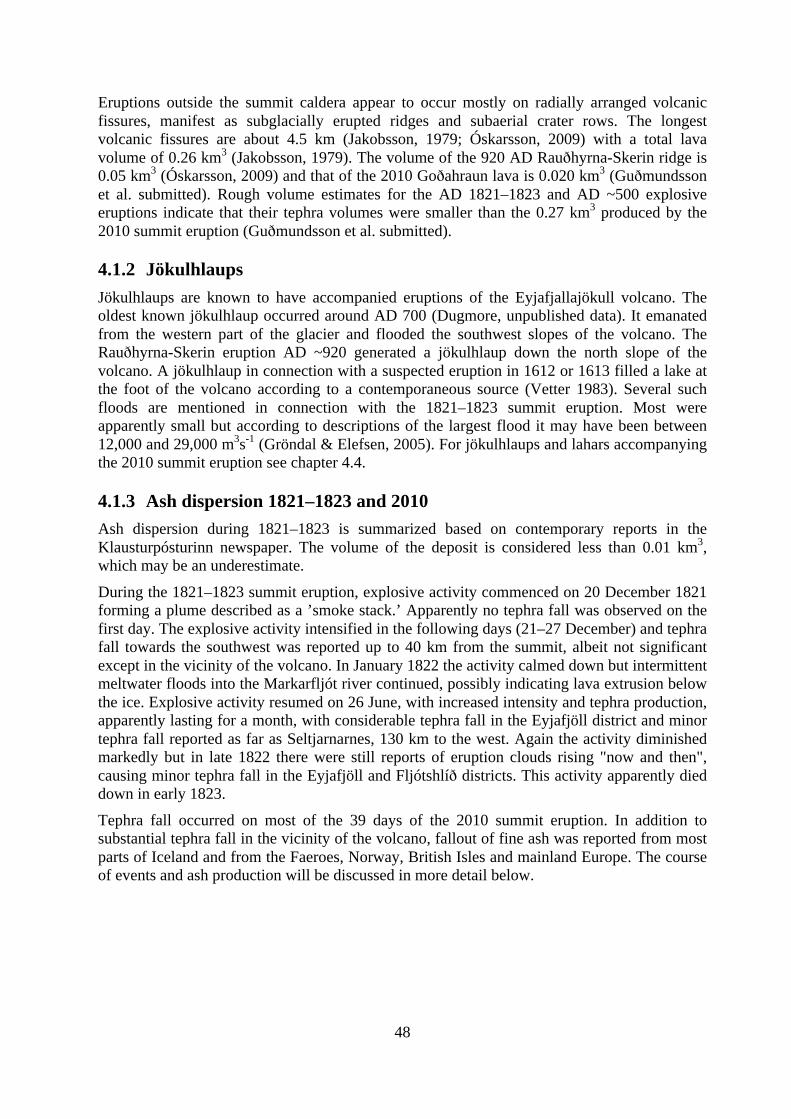
48
Eruptions outside the summit caldera appear to occur mostly on radially arranged volcanic fissures, manifest as subglacially erupted ridges and subaerial crater rows. The longest volcanic fissures are about 4.5 km (Jakobsson, 1979; Óskarsson, 2009) with a total lava volume of 0.26 km3 (Jakobsson, 1979). The volume of the 920 AD Rauðhyrna-Skerin ridge is 0.05 km3 (Óskarsson, 2009) and that of the 2010 Goðahraun lava is 0.020 km3 (Guðmundsson et al. submitted). Rough volume estimates for the AD 1821–1823 and AD ~500 explosive eruptions indicate that their tephra volumes were smaller than the 0.27 km3 produced by the 2010 summit eruption (Guðmundsson et al. submitted).
4.1.2 Jökulhlaups Jökulhlaups are known to have accompanied eruptions of the Eyjafjallajökull volcano. The oldest known jökulhlaup occurred around AD 700 (Dugmore, unpublished data). It emanated from the western part of the glacier and flooded the southwest slopes of the volcano. The Rauðhyrna-Skerin eruption AD ~920 generated a jökulhlaup down the north slope of the volcano. A jökulhlaup in connection with a suspected eruption in 1612 or 1613 filled a lake at the foot of the volcano according to a contemporaneous source (Vetter 1983). Several such floods are mentioned in connection with the 1821–1823 summit eruption. Most were apparently small but according to descriptions of the largest flood it may have been between 12,000 and 29,000 m3s-1 (Gröndal & Elefsen, 2005). For jökulhlaups and lahars accompanying the 2010 summit eruption see chapter 4.4.
4.1.3 Ash dispersion 1821–1823 and 2010 Ash dispersion during 1821–1823 is summarized based on contemporary reports in the Klausturpósturinn newspaper. The volume of the deposit is considered less than 0.01 km3, which may be an underestimate.
During the 1821–1823 summit eruption, explosive activity commenced on 20 December 1821 forming a plume described as a ’smoke stack.’ Apparently no tephra fall was observed on the first day. The explosive activity intensified in the following days (21–27 December) and tephra fall towards the southwest was reported up to 40 km from the summit, albeit not significant except in the vicinity of the volcano. In January 1822 the activity calmed down but intermittent meltwater floods into the Markarfljót river continued, possibly indicating lava extrusion below the ice. Explosive activity resumed on 26 June, with increased intensity and tephra production, apparently lasting for a month, with considerable tephra fall in the Eyjafjöll district and minor tephra fall reported as far as Seltjarnarnes, 130 km to the west. Again the activity diminished markedly but in late 1822 there were still reports of eruption clouds rising "now and then", causing minor tephra fall in the Eyjafjöll and Fljótshlíð districts. This activity apparently died down in early 1823.
Tephra fall occurred on most of the 39 days of the 2010 summit eruption. In addition to substantial tephra fall in the vicinity of the volcano, fallout of fine ash was reported from most parts of Iceland and from the Faeroes, Norway, British Isles and mainland Europe. The course of events and ash production will be discussed in more detail below.
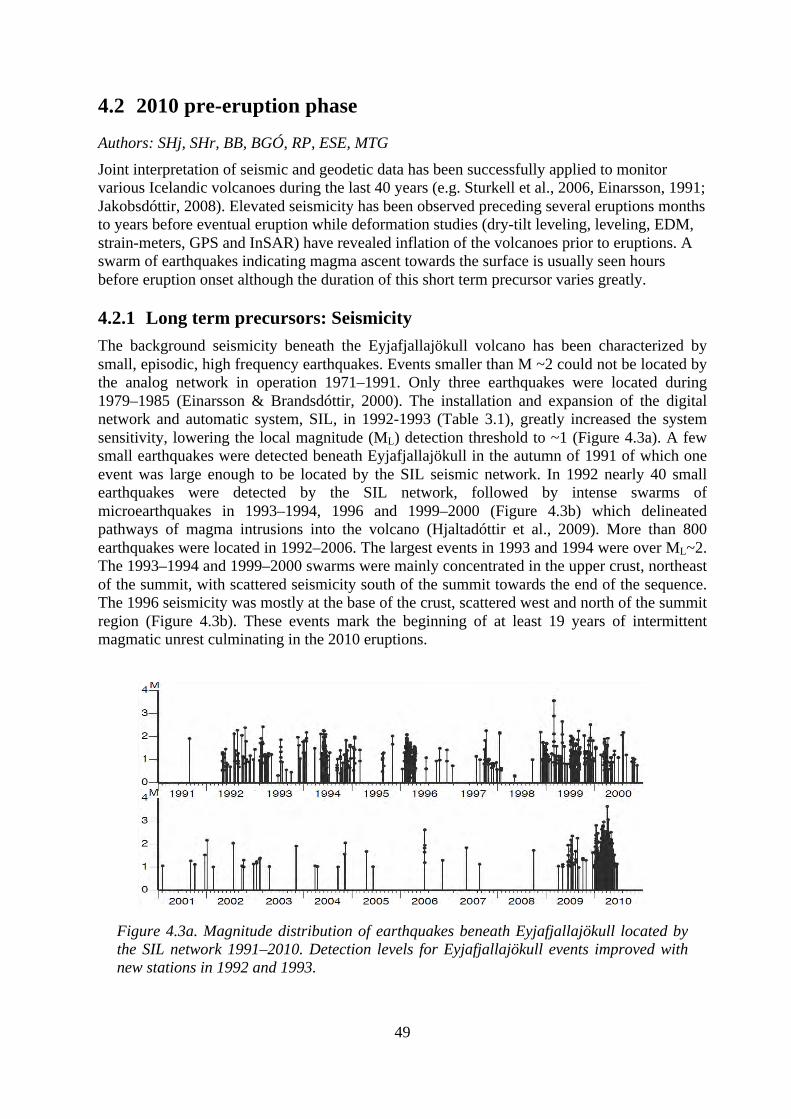
49
4.2 2010 pre-eruption phase
Authors: SHj, SHr, BB, BGÓ, RP, ESE, MTG Joint interpretation of seismic and geodetic data has been successfully applied to monitor various Icelandic volcanoes during the last 40 years (e.g. Sturkell et al., 2006, Einarsson, 1991; Jakobsdóttir, 2008). Elevated seismicity has been observed preceding several eruptions months to years before eventual eruption while deformation studies (dry-tilt leveling, leveling, EDM, strain-meters, GPS and InSAR) have revealed inflation of the volcanoes prior to eruptions. A swarm of earthquakes indicating magma ascent towards the surface is usually seen hours before eruption onset although the duration of this short term precursor varies greatly.
4.2.1 Long term precursors: Seismicity The background seismicity beneath the Eyjafjallajökull volcano has been characterized by small, episodic, high frequency earthquakes. Events smaller than M ~2 could not be located by the analog network in operation 1971–1991. Only three earthquakes were located during 1979–1985 (Einarsson & Brandsdóttir, 2000). The installation and expansion of the digital network and automatic system, SIL, in 1992-1993 (Table 3.1), greatly increased the system sensitivity, lowering the local magnitude (ML) detection threshold to ~1 (Figure 4.3a). A few small earthquakes were detected beneath Eyjafjallajökull in the autumn of 1991 of which one event was large enough to be located by the SIL seismic network. In 1992 nearly 40 small earthquakes were detected by the SIL network, followed by intense swarms of microearthquakes in 1993–1994, 1996 and 1999–2000 (Figure 4.3b) which delineated pathways of magma intrusions into the volcano (Hjaltadóttir et al., 2009). More than 800 earthquakes were located in 1992–2006. The largest events in 1993 and 1994 were over ML~2. The 1993–1994 and 1999–2000 swarms were mainly concentrated in the upper crust, northeast of the summit, with scattered seismicity south of the summit towards the end of the sequence. The 1996 seismicity was mostly at the base of the crust, scattered west and north of the summit region (Figure 4.3b). These events mark the beginning of at least 19 years of intermittent magmatic unrest culminating in the 2010 eruptions.
Figure 4.3a. Magnitude distribution of earthquakes beneath Eyjafjallajökull located by the SIL network 1991–2010. Detection levels for Eyjafjallajökull events improved with new stations in 1992 and 1993.
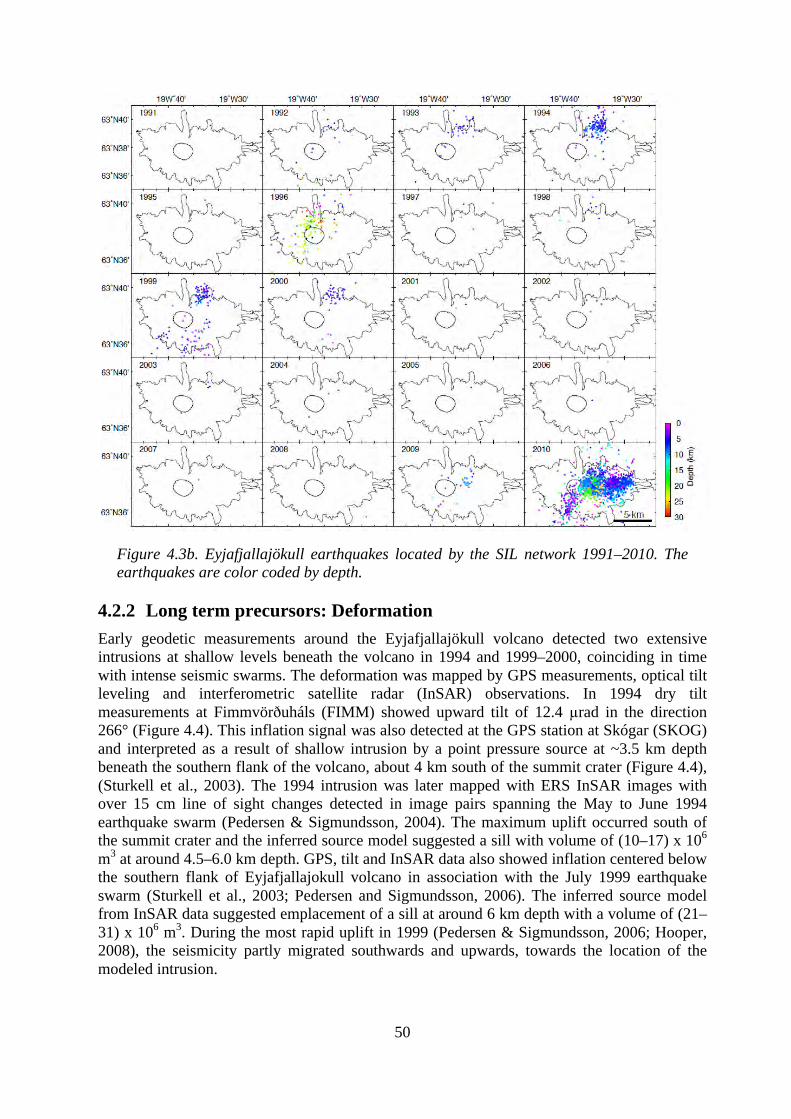
50
Figure 4.3b. Eyjafjallajökull earthquakes located by the SIL network 1991–2010. The earthquakes are color coded by depth.
4.2.2 Long term precursors: Deformation Early geodetic measurements around the Eyjafjallajökull volcano detected two extensive intrusions at shallow levels beneath the volcano in 1994 and 1999–2000, coinciding in time with intense seismic swarms. The deformation was mapped by GPS measurements, optical tilt leveling and interferometric satellite radar (InSAR) observations. In 1994 dry tilt measurements at Fimmvörðuháls (FIMM) showed upward tilt of 12.4 µrad in the direction 266° (Figure 4.4). This inflation signal was also detected at the GPS station at Skógar (SKOG) and interpreted as a result of shallow intrusion by a point pressure source at ~3.5 km depth beneath the southern flank of the volcano, about 4 km south of the summit crater (Figure 4.4), (Sturkell et al., 2003). The 1994 intrusion was later mapped with ERS InSAR images with over 15 cm line of sight changes detected in image pairs spanning the May to June 1994 earthquake swarm (Pedersen & Sigmundsson, 2004). The maximum uplift occurred south of the summit crater and the inferred source model suggested a sill with volume of (10–17) x 106 m3 at around 4.5–6.0 km depth. GPS, tilt and InSAR data also showed inflation centered below the southern flank of Eyjafjallajokull volcano in association with the July 1999 earthquake swarm (Sturkell et al., 2003; Pedersen and Sigmundsson, 2006). The inferred source model from InSAR data suggested emplacement of a sill at around 6 km depth with a volume of (21–31) x 106 m3. During the most rapid uplift in 1999 (Pedersen & Sigmundsson, 2006; Hooper, 2008), the seismicity partly migrated southwards and upwards, towards the location of the modeled intrusion.
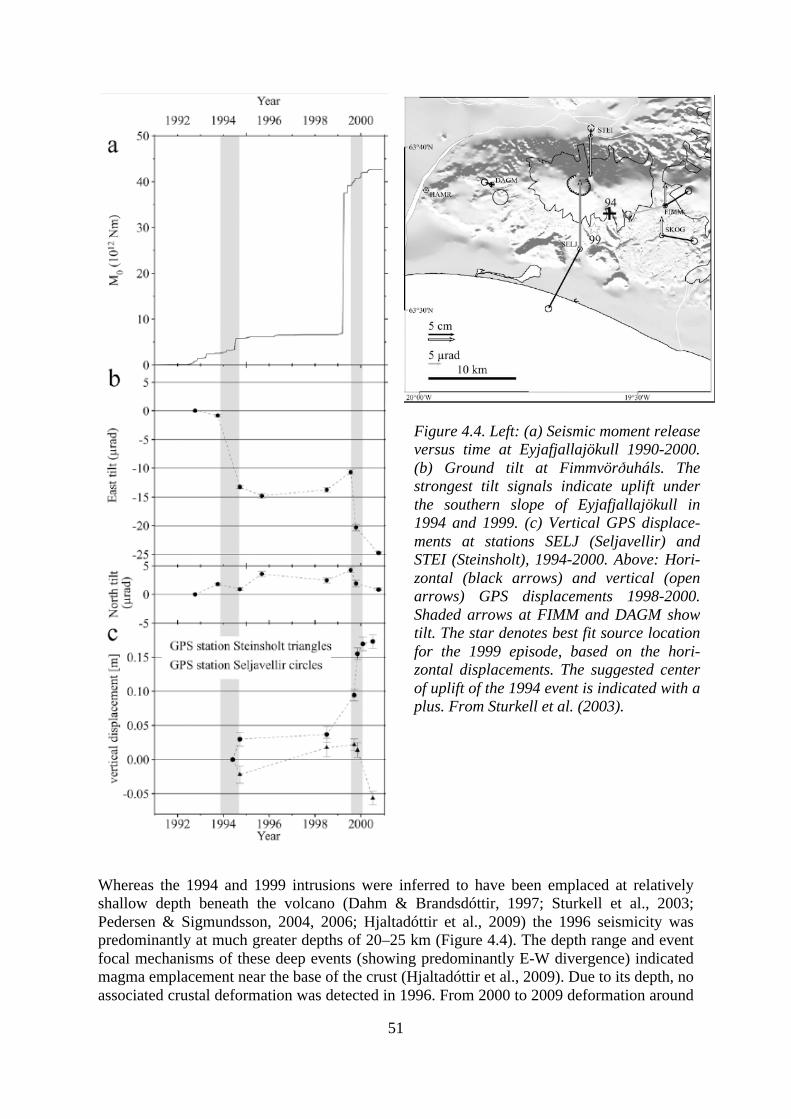
51
Whereas the 1994 and 1999 intrusions were inferred to have been emplaced at relatively shallow depth beneath the volcano (Dahm & Brandsdóttir, 1997; Sturkell et al., 2003; Pedersen & Sigmundsson, 2004, 2006; Hjaltadóttir et al., 2009) the 1996 seismicity was predominantly at much greater depths of 20–25 km (Figure 4.4). The depth range and event focal mechanisms of these deep events (showing predominantly E-W divergence) indicated magma emplacement near the base of the crust (Hjaltadóttir et al., 2009). Due to its depth, no associated crustal deformation was detected in 1996. From 2000 to 2009 deformation around
Figure 4.4. Left: (a) Seismic moment release versus time at Eyjafjallajökull 1990-2000. (b) Ground tilt at Fimmvörðuháls. The strongest tilt signals indicate uplift under the southern slope of Eyjafjallajökull in 1994 and 1999. (c) Vertical GPS displace-ments at stations SELJ (Seljavellir) and STEI (Steinsholt), 1994-2000. Above: Hori-zontal (black arrows) and vertical (open arrows) GPS displacements 1998-2000. Shaded arrows at FIMM and DAGM show tilt. The star denotes best fit source location for the 1999 episode, based on the hori-zontal displacements. The suggested center of uplift of the 1994 event is indicated with a plus. From Sturkell et al. (2003).
52
Eyjafjallajökull volcano remained small, with a slight deflation observed in ENVISAT InSAR images and GPS data presumably related to the cooling of the 1994 and 1999 sills. Based on differences in the locations of the intrusion source models from the events in the 1990’s no major magma chamber was considered to reside beneath the volcano.
4.2.3 Geothermal changes No active geothermal areas exist on Eyjafjallajökull and Fimmvörðuháls and no thermal precursors were detected in the weeks preceding the eruption on 20 March 2010. In particular, no signals of increased geothermal activity (e.g. out-of-season melting of snow cover) were detected during an inspection flight, in good visibility, on 19 March, about 30 hours before the onset of the eruption.
4.2.4 Magmatic degassing Meltwater from the Eyjafjallajökull summit caldera drains into the Jökulsá river, the outlet river from the Gígjökull lagoon and a short tributary of the main river Markarfljót. Water samples from Jökulsá have been collected intermittently since 1991. The pH oscillated from 5.45 to 6.94, increasing gradually from 1991 to 2004. The CO2 concentration fluctuated between 20 and 230 mg/kg with a CO2 flux from 0.4 to 4 tons per hour (Figure 4.5). The gradual increase in pH reflects decreased magmatic degassing or increased water/rock interaction between the degassing magma and the sampling site. No clear relationship seems to exist between monthly earthquake frequency and pH values whereas the CO2 concentration follows the earthquake frequency, with a time lag of approximately one year. In 2000, the Icelandic Hydrological Survey began monitoring water discharge, water temperature and conductivity at Jökulsá (see chapter 3.5). Conductivity is a simple measurement of charged ions in solution, reflecting the concentration of dissolved solids in the water. Conductivity measurements showed no change prior to or during the Fimmvörðuháls eruption and no increase in CO2 concentration was detected in the Gígjökull lagoon during the Fimmvörðuháls flank eruption. It was not until the summit eruption had begun and jökulhlaup water arrived in the lagoon that the conductivity increased. Unfortunately, shortly after the start of the jökulhlaup, the conductivity meter was swept away by the flood waters.
The eruptions in Fimmvörðuháls and Eyjafjallajökull thus had no precursors with respect to the chemical composition of the water draining the volcano. Although limited, the chemical data indicates that degassing of intrusive magma in sills or dikes may be detected in water composition by slow dissolution, months after an intrusive event, whereas fast rising magma which reaches the surface during an eruption does not have an immediate effect on the groundwater composition.
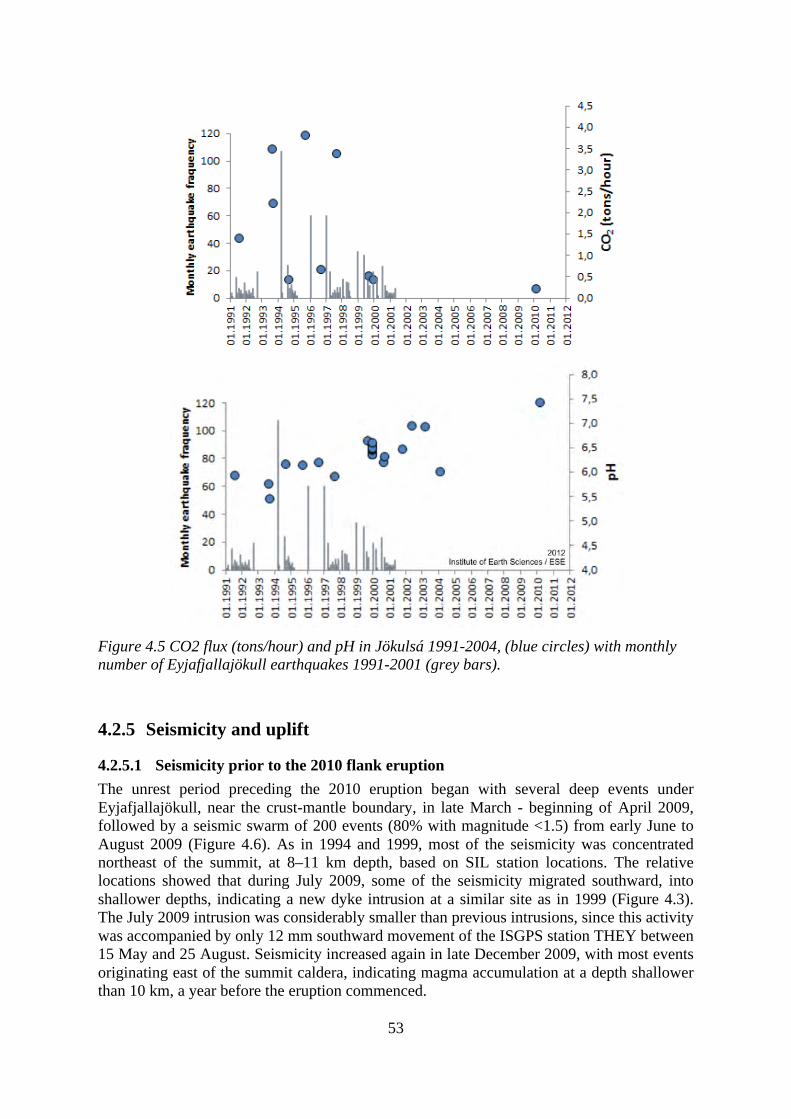
53
Figure 4.5 CO2 flux (tons/hour) and pH in Jökulsá 1991-2004, (blue circles) with monthly number of Eyjafjallajökull earthquakes 1991-2001 (grey bars).
4.2.5 Seismicity and uplift
4.2.5.1 Seismicity prior to the 2010 flank eruption The unrest period preceding the 2010 eruption began with several deep events under Eyjafjallajökull, near the crust-mantle boundary, in late March - beginning of April 2009, followed by a seismic swarm of 200 events (80% with magnitude <1.5) from early June to August 2009 (Figure 4.6). As in 1994 and 1999, most of the seismicity was concentrated northeast of the summit, at 8–11 km depth, based on SIL station locations. The relative locations showed that during July 2009, some of the seismicity migrated southward, into shallower depths, indicating a new dyke intrusion at a similar site as in 1999 (Figure 4.3). The July 2009 intrusion was considerably smaller than previous intrusions, since this activity was accompanied by only 12 mm southward movement of the ISGPS station THEY between 15 May and 25 August. Seismicity increased again in late December 2009, with most events originating east of the summit caldera, indicating magma accumulation at a depth shallower than 10 km, a year before the eruption commenced.
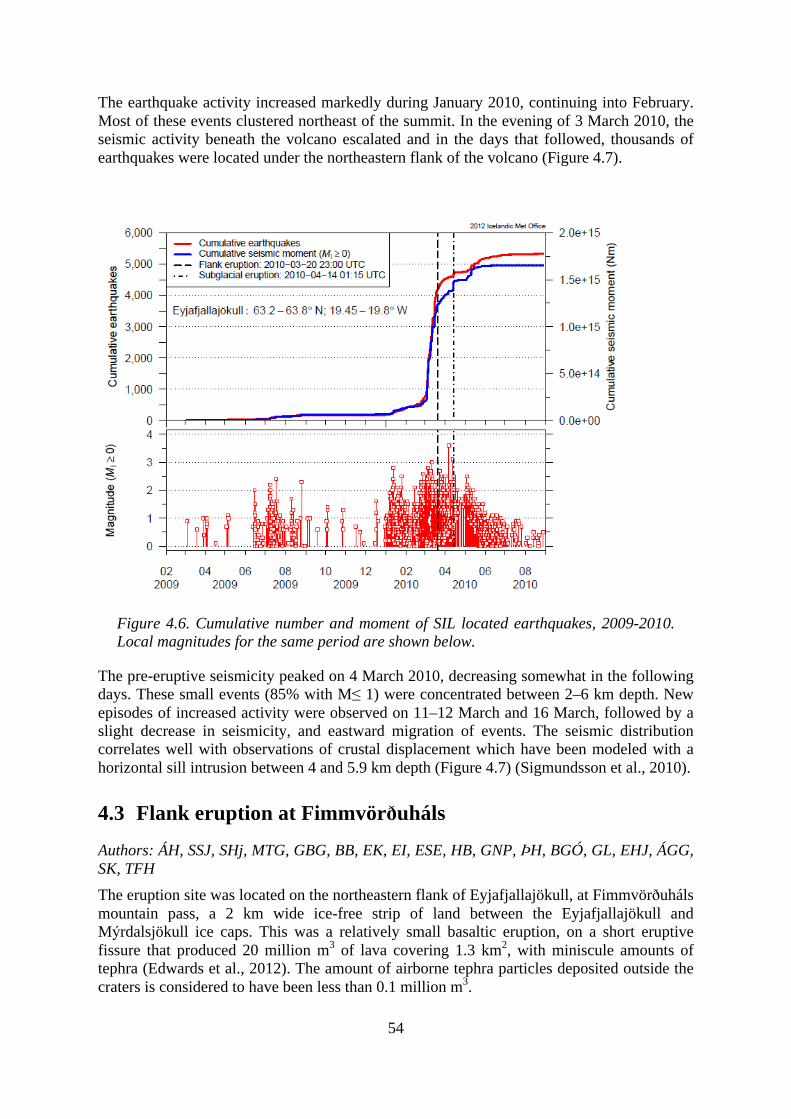
54
The earthquake activity increased markedly during January 2010, continuing into February. Most of these events clustered northeast of the summit. In the evening of 3 March 2010, the seismic activity beneath the volcano escalated and in the days that followed, thousands of earthquakes were located under the northeastern flank of the volcano (Figure 4.7).
Figure 4.6. Cumulative number and moment of SIL located earthquakes, 2009-2010. Local magnitudes for the same period are shown below.
The pre-eruptive seismicity peaked on 4 March 2010, decreasing somewhat in the following days. These small events (85% with M≤ 1) were concentrated between 2–6 km depth. New episodes of increased activity were observed on 11–12 March and 16 March, followed by a slight decrease in seismicity, and eastward migration of events. The seismic distribution correlates well with observations of crustal displacement which have been modeled with a horizontal sill intrusion between 4 and 5.9 km depth (Figure 4.7) (Sigmundsson et al., 2010).
4.3 Flank eruption at Fimmvörðuháls
Authors: ÁH, SSJ, SHj, MTG, GBG, BB, EK, EI, ESE, HB, GNP, ÞH, BGÓ, GL, EHJ, ÁGG, SK, TFH The eruption site was located on the northeastern flank of Eyjafjallajökull, at Fimmvörðuháls mountain pass, a 2 km wide ice-free strip of land between the Eyjafjallajökull and Mýrdalsjökull ice caps. This was a relatively small basaltic eruption, on a short eruptive fissure that produced 20 million m3 of lava covering 1.3 km2, with miniscule amounts of tephra (Edwards et al., 2012). The amount of airborne tephra particles deposited outside the craters is considered to have been less than 0.1 million m3.
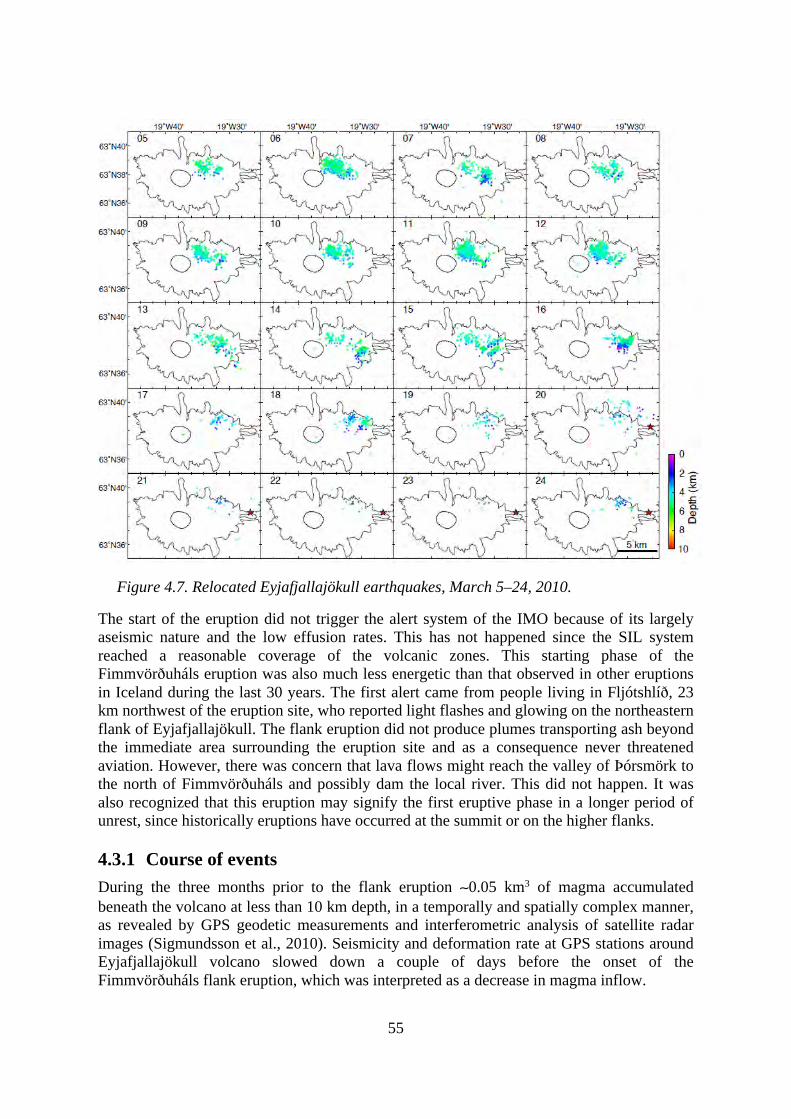
55
Figure 4.7. Relocated Eyjafjallajökull earthquakes, March 5–24, 2010.
The start of the eruption did not trigger the alert system of the IMO because of its largely aseismic nature and the low effusion rates. This has not happened since the SIL system reached a reasonable coverage of the volcanic zones. This starting phase of the Fimmvörðuháls eruption was also much less energetic than that observed in other eruptions in Iceland during the last 30 years. The first alert came from people living in Fljótshlíð, 23 km northwest of the eruption site, who reported light flashes and glowing on the northeastern flank of Eyjafjallajökull. The flank eruption did not produce plumes transporting ash beyond the immediate area surrounding the eruption site and as a consequence never threatened aviation. However, there was concern that lava flows might reach the valley of Þórsmörk to the north of Fimmvörðuháls and possibly dam the local river. This did not happen. It was also recognized that this eruption may signify the first eruptive phase in a longer period of unrest, since historically eruptions have occurred at the summit or on the higher flanks.
4.3.1 Course of events During the three months prior to the flank eruption ∼0.05 km3 of magma accumulated beneath the volcano at less than 10 km depth, in a temporally and spatially complex manner, as revealed by GPS geodetic measurements and interferometric analysis of satellite radar images (Sigmundsson et al., 2010). Seismicity and deformation rate at GPS stations around Eyjafjallajökull volcano slowed down a couple of days before the onset of the Fimmvörðuháls flank eruption, which was interpreted as a decrease in magma inflow.
56
4.3.1.1 Eruption onset At about 22:30 UTC on 20 March 2010, a slight increase in seismic tremor appeared on seismographs close to the volcano. This signal was, however, weak and not sufficient to trigger an alert by the SIL system, being of a magnitude commonly seen in relation to weather changes. Post analysis of photos from a web camera on Búrfell, close to the eruption site revealed that at 23:34 a red glow could be seen. The eruption site was observed at 04:00 UTC, from a Coast Guard helicopter, whereupon it could be confirmed that an eruption on a few hundred meter long fissure trending NNE was in progress on ice-free land, with fire fountains and minor tephra fall. A Coast Guard airplane inspected the eruption site further between 06:00 and 07:00 UTC establishing that 14 distinct fire fountains were active on the fissure and that the lava flowed north, in the direction of the Þórsmörk area. No eruption plume was observed until the 22 March when steam rich plumes from melting snow and ice, reached 4,000 m a.s.l. Observations until 24 March were done from aircraft, since unfavorable weather prevented the eruption site to be reached. The first land-based observations confirmed that the steam plumes originated in the Hrunagil gully. Fire fountains up to 180 m high were observed at the eruption site, associated with minor ash production.
Response to onset of flank eruption Response efforts were mobilized rapidly as observer reports were received by authorities and monitoring data were analyzed by scientists.
At 23:52 UTC on 20 March 2010, the police dispatch received a call from the farm Múlakot in Fljótshlíð, 15 km northwest of the summit of Eyjafjallajökull and 23 km WNW of the Fimmvörðuháls eruption site. The caller reported seeing fire on Mýrdalsjökull glacier. The NCIP-DCPEM duty officer was informed immediately. During the next few minutes both NCIP-DCPEM duty officer and the police dispatchers contacted the local police commissioner at Hvolsvöllur, the IMO and local residents in order to verify whether a volcanic eruption had commenced and what the correct response should be. The IMO reported no extraordinary earthquake activity in this region, but more people reported seeing fire, either on the western flank of Mýrdalsjökull or the eastern flank of Eyjafjallajökull. At about 00:10 UTC on 21 March the NCIP-DCPEM duty officer and the local commissioner jointly determined to activate the hazard response plan for Eyjafjallajökull. The first stage of the Eyjafjallajökull eruption response plan of the NCIP-DCPEM calls for an evacuation of the area around Eyjafjallajökull. Mass Care Centres are set up in nearby villages and the Area coordination and Command Centre at Hella is activated as well as the National Coordination Crisis Center (NCCC). Roads in the region under evacuation are closed and traffic in and out of the area is controlled.
Since the beginning of March the area had been under close surveillance by the seismologists at IMO and in the days following the eruption the earthquake movements were analyzed thoroughly where they were seen to move upwards and toward the east, but no volcanic tremor was detected in the data. On the day of the eruption NCIP-DCPEM was informed at noon about the situation. The first report to IMO about fire seen in Mýrdalsjökull came at 23:57 the same evening. The duty forecaster immediately called out seismologists, who analyzed the situation. The first analysis of the earthquake activity and tremor in the area did not indicate with certainty that an eruption had started. As more reports came in it became evident that an eruption had broken out. The contingency plan of IMO was activated which implements that more seismologists and meteorologists were called out. Two seismologists were stationed at the NCCC and took part in the operations
57
from there, e.g. in the surveillance flight. At 00:45 UTC on 21 March Civil Protection contacted IES requesting that a volcanologist with knowledge of the area would go on an emergency helicopter flight to locate the eruption site and assess potential hazards. The Coast Guard helicopter TF-LÍF left Reykjavík shortly before 02:00 UTC and reached the eruption site at 04:00 UTC, having diverted from a straight route by taking a very southerly course, 30 km south of Vestmannaeyjar islands, since it could not be ruled out at that the time that an ash cloud had formed and carried westwards by the easterly winds.
Following the discovery of a less than 1 km long eruption fissure at Fimmvörðuháls, the NCIP-DCPEM scaled back evacuations, in the afternoon on 21 March, to the immediate vicinity of the volcano. On 22 March all evacuation restrictions were lifted. As the eruption progressed people were allowed to visit the eruption site. As a result, the response of the NCIP-DCPEM consisted of an on-site supervision of tourist safety and coordination of assistance for exhausted hikers and people with broke-down vehicles.
4.3.1.2 Activity description The Fimmvörðuháls eruption was a typical basaltic fissure eruption. The alkali olivine basalt magma has relatively high temperature and density. It readily releases magmatic volatiles in a non-explosive manner and ash production is therefore low. The eruptive fissure was parasitic on the central Eyjafjallajökull volcano. Since the fissure opened up in an ice-free area between the glaciers of Eyjafjallajökull and Mýrdalsjökull external water interactions were minimal. External water interaction became important when the degassed lava flowed into the Hrunagil gully which resulted in explosive activity. However, this explosive activity produced relatively large tephra grain size and dense particles as well as low thermal plumes, minimizing ash transport away from the eruption site. A second fissure opened up on the 31 March west of the first fissure and almost perpendicular to it. This fissure slowly took over the activity at Fimmvörðuháls with eruptive behavior identical to the first fissure, but a lava flow towards northwest. Activity at the first fissure terminated in the afternoon of 6 April. The second fissure was still active at noon on 12 April (helicopter pilot observation) and seismic tremor amplitudes dropped to background level by the late afternoon, marking the termination of the eruption.
4.3.2 Observations and analysis
4.3.2.1 Airborne observations During 21–23 March, no ground observations were possible due to adverse weather conditions but aircraft observations were carried out. The first sighting of the volcanic fissure at 04:00 UTC on 21 March confirmed a dominantly effusive eruption with fire fountaining along a short fissure. Crater rims were starting to form on the western side of the fissure (Figure 4.8). It was possible to follow the advance of the lava flow for the next three days using the Dash 9 Coast Guard aircraft SAR radar, since the rough lava surface had a strong contrast with the snow-covered terrain (Edwards et al., 2012). Airborne observations from the Dash 9, smaller aircraft and occasionally from the Coast Guard helicopters were conducted throughout the flank eruption.
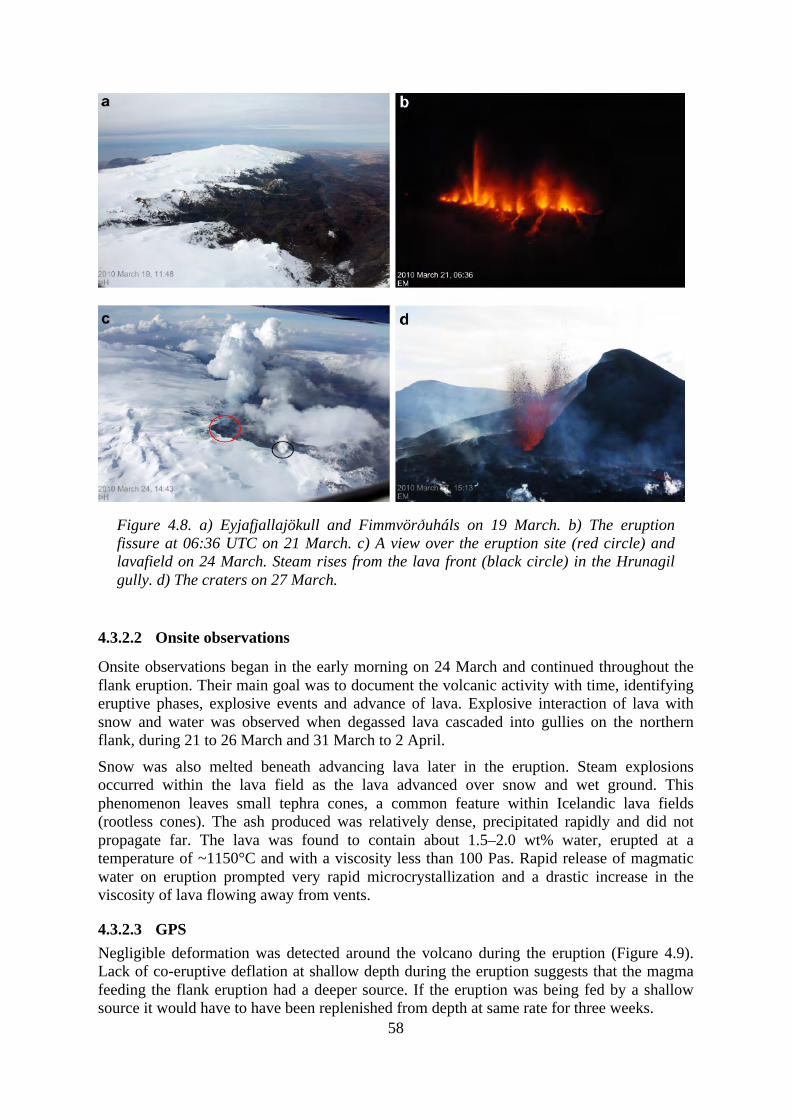
58
Figure 4.8. a) Eyjafjallajökull and Fimmvörðuháls on 19 March. b) The eruption fissure at 06:36 UTC on 21 March. c) A view over the eruption site (red circle) and lavafield on 24 March. Steam rises from the lava front (black circle) in the Hrunagil gully. d) The craters on 27 March.
4.3.2.2 Onsite observations
Onsite observations began in the early morning on 24 March and continued throughout the flank eruption. Their main goal was to document the volcanic activity with time, identifying eruptive phases, explosive events and advance of lava. Explosive interaction of lava with snow and water was observed when degassed lava cascaded into gullies on the northern flank, during 21 to 26 March and 31 March to 2 April.
Snow was also melted beneath advancing lava later in the eruption. Steam explosions occurred within the lava field as the lava advanced over snow and wet ground. This phenomenon leaves small tephra cones, a common feature within Icelandic lava fields (rootless cones). The ash produced was relatively dense, precipitated rapidly and did not propagate far. The lava was found to contain about 1.5–2.0 wt% water, erupted at a temperature of ~1150°C and with a viscosity less than 100 Pas. Rapid release of magmatic water on eruption prompted very rapid microcrystallization and a drastic increase in the viscosity of lava flowing away from vents.
4.3.2.3 GPS Negligible deformation was detected around the volcano during the eruption (Figure 4.9). Lack of co-eruptive deflation at shallow depth during the eruption suggests that the magma feeding the flank eruption had a deeper source. If the eruption was being fed by a shallow source it would have to have been replenished from depth at same rate for three weeks.
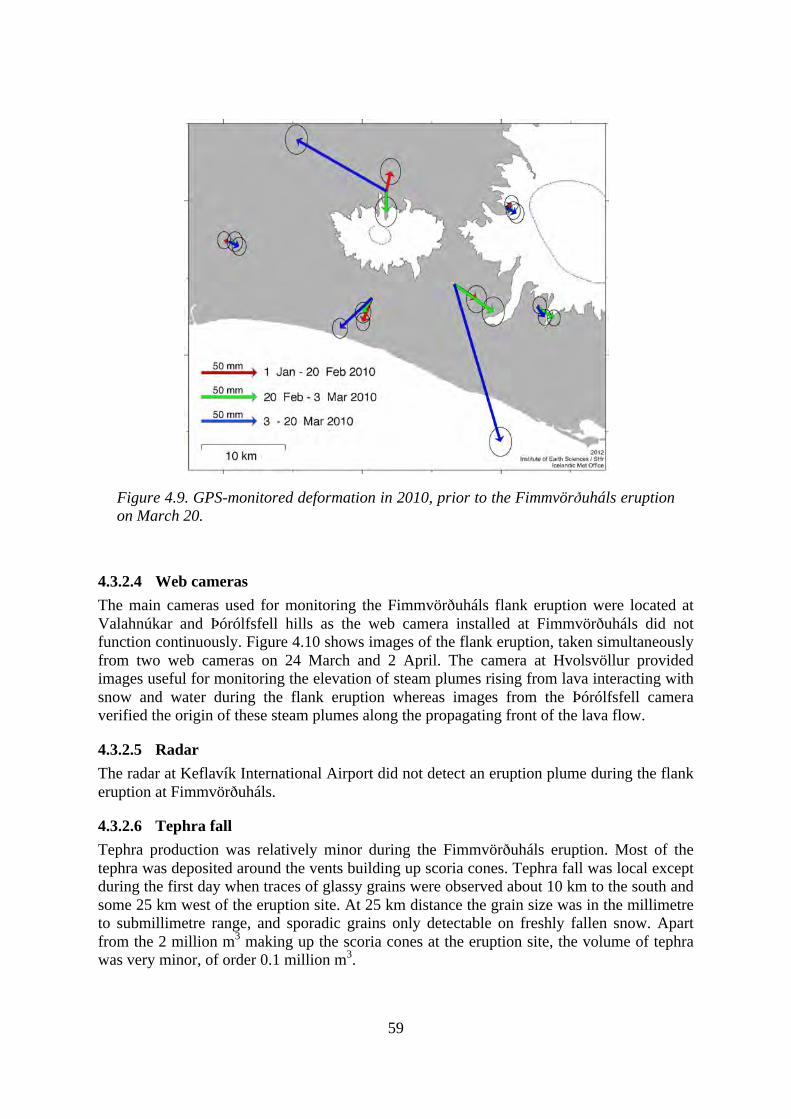
59
Figure 4.9. GPS-monitored deformation in 2010, prior to the Fimmvörðuháls eruption on March 20.
4.3.2.4 Web cameras The main cameras used for monitoring the Fimmvörðuháls flank eruption were located at Valahnúkar and Þórólfsfell hills as the web camera installed at Fimmvörðuháls did not function continuously. Figure 4.10 shows images of the flank eruption, taken simultaneously from two web cameras on 24 March and 2 April. The camera at Hvolsvöllur provided images useful for monitoring the elevation of steam plumes rising from lava interacting with snow and water during the flank eruption whereas images from the Þórólfsfell camera verified the origin of these steam plumes along the propagating front of the lava flow.
4.3.2.5 Radar The radar at Keflavík International Airport did not detect an eruption plume during the flank eruption at Fimmvörðuháls.
4.3.2.6 Tephra fall Tephra production was relatively minor during the Fimmvörðuháls eruption. Most of the tephra was deposited around the vents building up scoria cones. Tephra fall was local except during the first day when traces of glassy grains were observed about 10 km to the south and some 25 km west of the eruption site. At 25 km distance the grain size was in the millimetre to submillimetre range, and sporadic grains only detectable on freshly fallen snow. Apart from the 2 million m3 making up the scoria cones at the eruption site, the volume of tephra was very minor, of order 0.1 million m3.
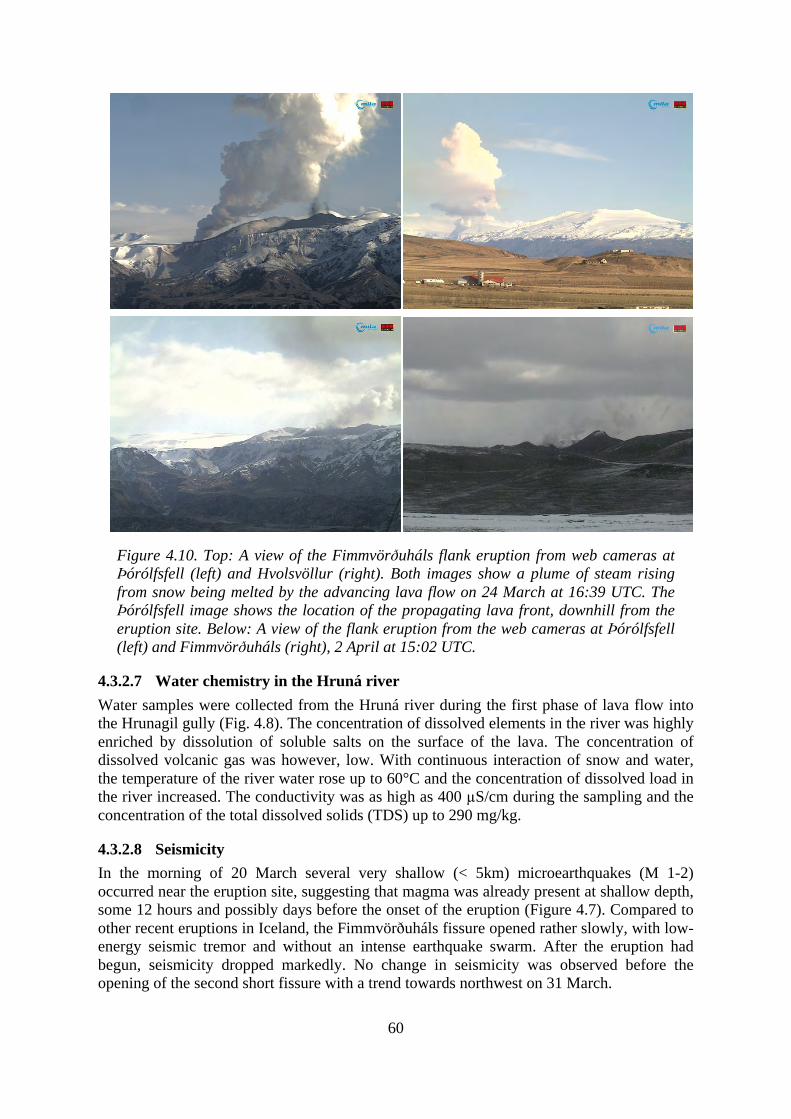
60
Figure 4.10. Top: A view of the Fimmvörðuháls flank eruption from web cameras at Þórólfsfell (left) and Hvolsvöllur (right). Both images show a plume of steam rising from snow being melted by the advancing lava flow on 24 March at 16:39 UTC. The Þórólfsfell image shows the location of the propagating lava front, downhill from the eruption site. Below: A view of the flank eruption from the web cameras at Þórólfsfell (left) and Fimmvörðuháls (right), 2 April at 15:02 UTC.
4.3.2.7 Water chemistry in the Hruná river Water samples were collected from the Hruná river during the first phase of lava flow into the Hrunagil gully (Fig. 4.8). The concentration of dissolved elements in the river was highly enriched by dissolution of soluble salts on the surface of the lava. The concentration of dissolved volcanic gas was however, low. With continuous interaction of snow and water, the temperature of the river water rose up to 60°C and the concentration of dissolved load in the river increased. The conductivity was as high as 400 µS/cm during the sampling and the concentration of the total dissolved solids (TDS) up to 290 mg/kg.
4.3.2.8 Seismicity In the morning of 20 March several very shallow (< 5km) microearthquakes (M 1-2) occurred near the eruption site, suggesting that magma was already present at shallow depth, some 12 hours and possibly days before the onset of the eruption (Figure 4.7). Compared to other recent eruptions in Iceland, the Fimmvörðuháls fissure opened rather slowly, with low-energy seismic tremor and without an intense earthquake swarm. After the eruption had begun, seismicity dropped markedly. No change in seismicity was observed before the opening of the second short fissure with a trend towards northwest on 31 March.
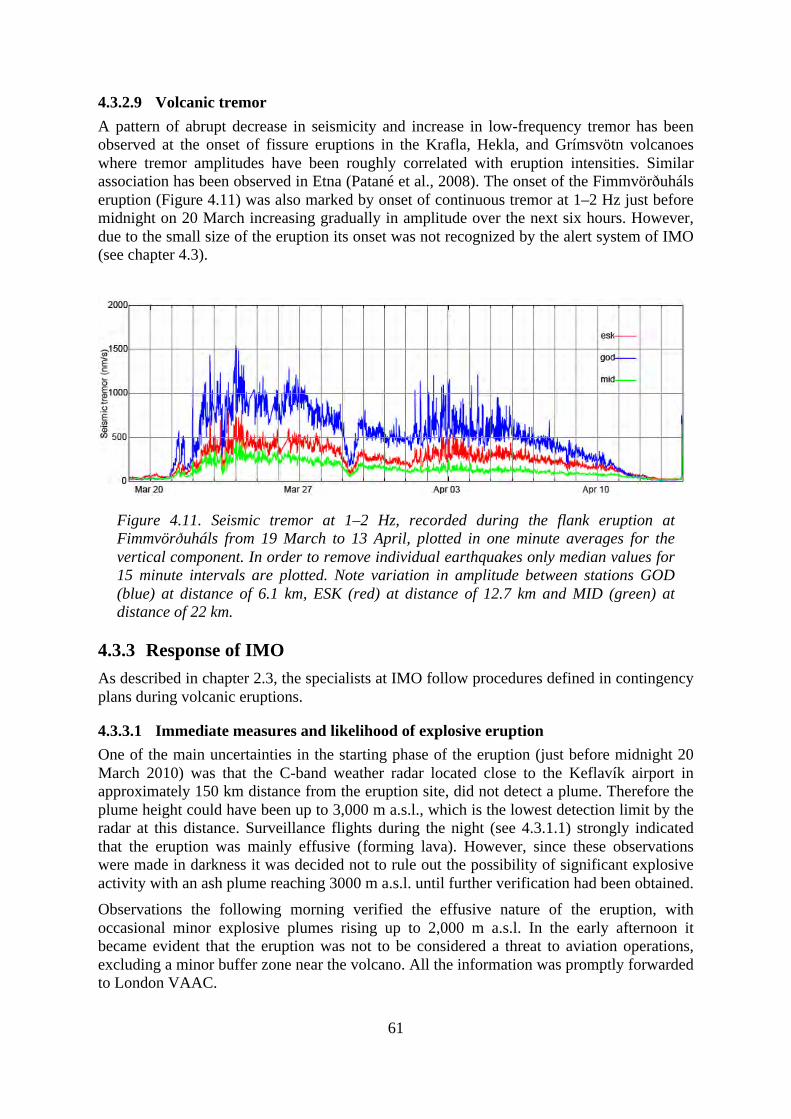
61
4.3.2.9 Volcanic tremor A pattern of abrupt decrease in seismicity and increase in low-frequency tremor has been observed at the onset of fissure eruptions in the Krafla, Hekla, and Grímsvötn volcanoes where tremor amplitudes have been roughly correlated with eruption intensities. Similar association has been observed in Etna (Patané et al., 2008). The onset of the Fimmvörðuháls eruption (Figure 4.11) was also marked by onset of continuous tremor at 1–2 Hz just before midnight on 20 March increasing gradually in amplitude over the next six hours. However, due to the small size of the eruption its onset was not recognized by the alert system of IMO (see chapter 4.3).
Figure 4.11. Seismic tremor at 1–2 Hz, recorded during the flank eruption at Fimmvörðuháls from 19 March to 13 April, plotted in one minute averages for the vertical component. In order to remove individual earthquakes only median values for 15 minute intervals are plotted. Note variation in amplitude between stations GOD (blue) at distance of 6.1 km, ESK (red) at distance of 12.7 km and MID (green) at distance of 22 km.
4.3.3 Response of IMO As described in chapter 2.3, the specialists at IMO follow procedures defined in contingency plans during volcanic eruptions.
4.3.3.1 Immediate measures and likelihood of explosive eruption One of the main uncertainties in the starting phase of the eruption (just before midnight 20 March 2010) was that the C-band weather radar located close to the Keflavík airport in approximately 150 km distance from the eruption site, did not detect a plume. Therefore the plume height could have been up to 3,000 m a.s.l., which is the lowest detection limit by the radar at this distance. Surveillance flights during the night (see 4.3.1.1) strongly indicated that the eruption was mainly effusive (forming lava). However, since these observations were made in darkness it was decided not to rule out the possibility of significant explosive activity with an ash plume reaching 3000 m a.s.l. until further verification had been obtained. Observations the following morning verified the effusive nature of the eruption, with occasional minor explosive plumes rising up to 2,000 m a.s.l. In the early afternoon it became evident that the eruption was not to be considered a threat to aviation operations, excluding a minor buffer zone near the volcano. All the information was promptly forwarded to London VAAC.
62
After the first day it was decided between IMO and London VAAC that advisories (VAA) and graphical information (VAG) were not necessary. However, all aviation charts over the north Atlantic were marked with a spot over Iceland indicating a volcanic eruption. This information was valid until the Eyjafjallajökull eruption began in the early hours of 14 April.
4.3.3.2 Measures taken to increase monitoring and predict lava runout A new seismometer was installed at Básar in Þórsmörk, just north of the eruption site and three hydrological gauges were installed in rivers from Eyjafjallajökull and Mýrdalsjökull.
During the flank eruption (21 March – 12 April 2010) a lava flow simulation was run for the area using a GIS-based tool called ‘Volcanic Risk Information System’ (VORIS). The simulation tool assumes that a lava will continue flowing as long as its neighboring area (cell) has lower elevation than the lava. The tool also simulates ash fall. The input is the digital elevation map (DEM), maximum flow length and correction height which translates into the lava thickness.
Although the lava flow simulation indicated that the most likely path of the lava would be to the west, in reality the flow was towards the east. The first suggestion was that this was the result of a flawed DEM. However, the tephra simulation from the first night of the eruption showed that tephra deposition in the vicinity of the craters, had blocked the western path of the lava, thereby diverting it to the east. There was a strong easterly wind that night, 21 m/s at sea level and most likely around 45 m/s up on Fimmvörðuháls (according to radio sounding in Keflavík). The model does not simulate well enough flow of a lava and it does allow lava flow along the same path twice. The model predicted much longer run-out of the lava within the Hrunagil gully than actually observed. Apparently, the model could not account for lava accumulation in the gully, thus overestimating its runout length.
4.3.4 Response of IES In the weeks preceding the eruption at Fimmvörðuháls, scientists at IES enhanced monitoring of seismic activity and deformation by installation of temporary stations around the volcano. The board of IES made funds available to set up new GPS and seismic stations, and these were subsequently installed. A flight with the Coast Guard Dash 9 over Eyjafjallajökull took place on 19 March, with several IES volcanologists on board. The area was photographed and the use of SAR and other instruments aboard the aircraft tested.
After the eruption started, observations from the air were made repeatedly on 21 and 22 March, continuing throughout the eruption, mainly from the Coast Guard Dash 9 aircraft (see chapter 6). IES volcanologists manned these flights. The use of SAR was tested, proving to be very effective in mapping the extent of the growing lava field, even though visibility was at times limited. In addition, Coast Guard helicopters were occasionally used, and in some instances commercial small single engine aircraft.
A team from IES drove to Skógaheiði during the early hours of 21 March, but was forced to stop about 10 km south of the eruption site and return to the lowlands. Bad weather at Fimmvörðuháls on 22 and 23 March, prevented direct observations at the eruption site, however, water samples were collected from the rivers north of the eruption site on 23 March. With the help of the Air Rescue Group from the town of Hella the group finally reached the craters in a snowmobile on 24 March. Repeated site visits from the south or east (by specially equipped vehicles across the Mýrdalsjökull glacier) took place after March 24 and into April. From 14 April, all available resources of IES were directed towards monitoring the explosive eruption with limited observations at Fimmvörðuháls.
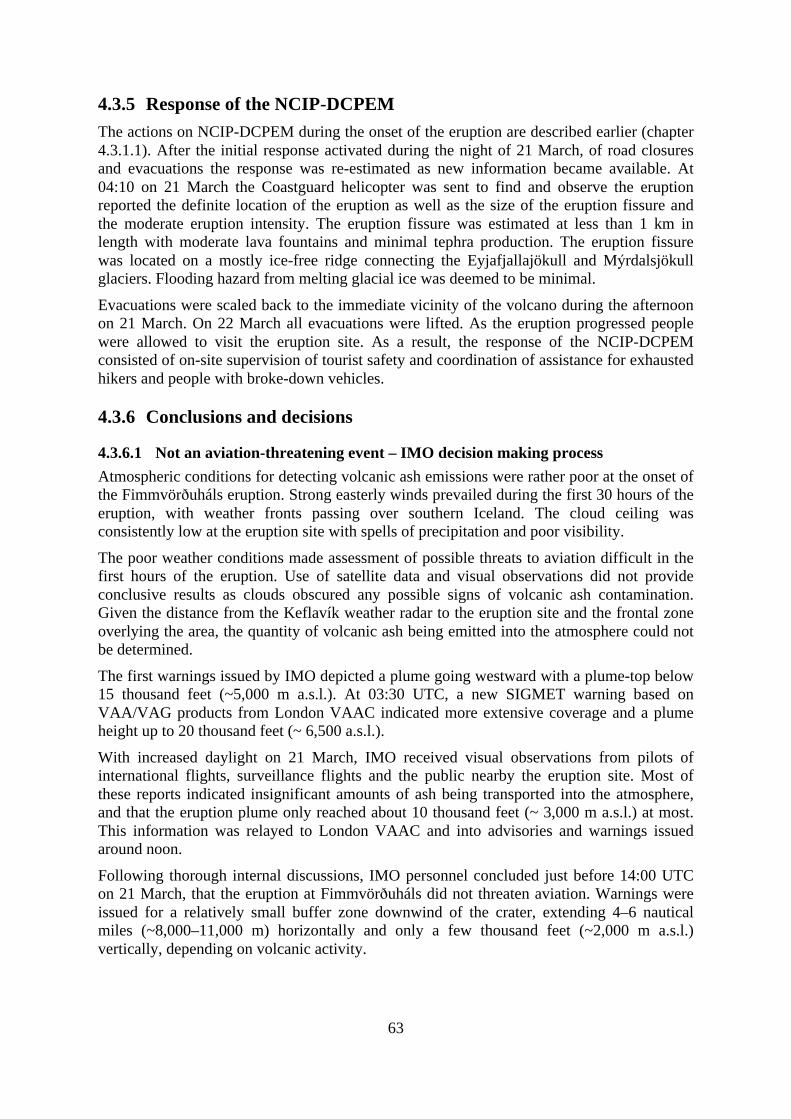
63
4.3.5 Response of the NCIP-DCPEM The actions on NCIP-DCPEM during the onset of the eruption are described earlier (chapter 4.3.1.1). After the initial response activated during the night of 21 March, of road closures and evacuations the response was re-estimated as new information became available. At 04:10 on 21 March the Coastguard helicopter was sent to find and observe the eruption reported the definite location of the eruption as well as the size of the eruption fissure and the moderate eruption intensity. The eruption fissure was estimated at less than 1 km in length with moderate lava fountains and minimal tephra production. The eruption fissure was located on a mostly ice-free ridge connecting the Eyjafjallajökull and Mýrdalsjökull glaciers. Flooding hazard from melting glacial ice was deemed to be minimal.
Evacuations were scaled back to the immediate vicinity of the volcano during the afternoon on 21 March. On 22 March all evacuations were lifted. As the eruption progressed people were allowed to visit the eruption site. As a result, the response of the NCIP-DCPEM consisted of on-site supervision of tourist safety and coordination of assistance for exhausted hikers and people with broke-down vehicles.
4.3.6 Conclusions and decisions
4.3.6.1 Not an aviation-threatening event – IMO decision making process Atmospheric conditions for detecting volcanic ash emissions were rather poor at the onset of the Fimmvörðuháls eruption. Strong easterly winds prevailed during the first 30 hours of the eruption, with weather fronts passing over southern Iceland. The cloud ceiling was consistently low at the eruption site with spells of precipitation and poor visibility.
The poor weather conditions made assessment of possible threats to aviation difficult in the first hours of the eruption. Use of satellite data and visual observations did not provide conclusive results as clouds obscured any possible signs of volcanic ash contamination. Given the distance from the Keflavík weather radar to the eruption site and the frontal zone overlying the area, the quantity of volcanic ash being emitted into the atmosphere could not be determined.
The first warnings issued by IMO depicted a plume going westward with a plume-top below 15 thousand feet (~5,000 m a.s.l.). At 03:30 UTC, a new SIGMET warning based on VAA/VAG products from London VAAC indicated more extensive coverage and a plume height up to 20 thousand feet (~ 6,500 a.s.l.).
With increased daylight on 21 March, IMO received visual observations from pilots of international flights, surveillance flights and the public nearby the eruption site. Most of these reports indicated insignificant amounts of ash being transported into the atmosphere, and that the eruption plume only reached about 10 thousand feet (~ 3,000 m a.s.l.) at most. This information was relayed to London VAAC and into advisories and warnings issued around noon.
Following thorough internal discussions, IMO personnel concluded just before 14:00 UTC on 21 March, that the eruption at Fimmvörðuháls did not threaten aviation. Warnings were issued for a relatively small buffer zone downwind of the crater, extending 4–6 nautical miles (~8,000–11,000 m) horizontally and only a few thousand feet (~2,000 m a.s.l.) vertically, depending on volcanic activity.
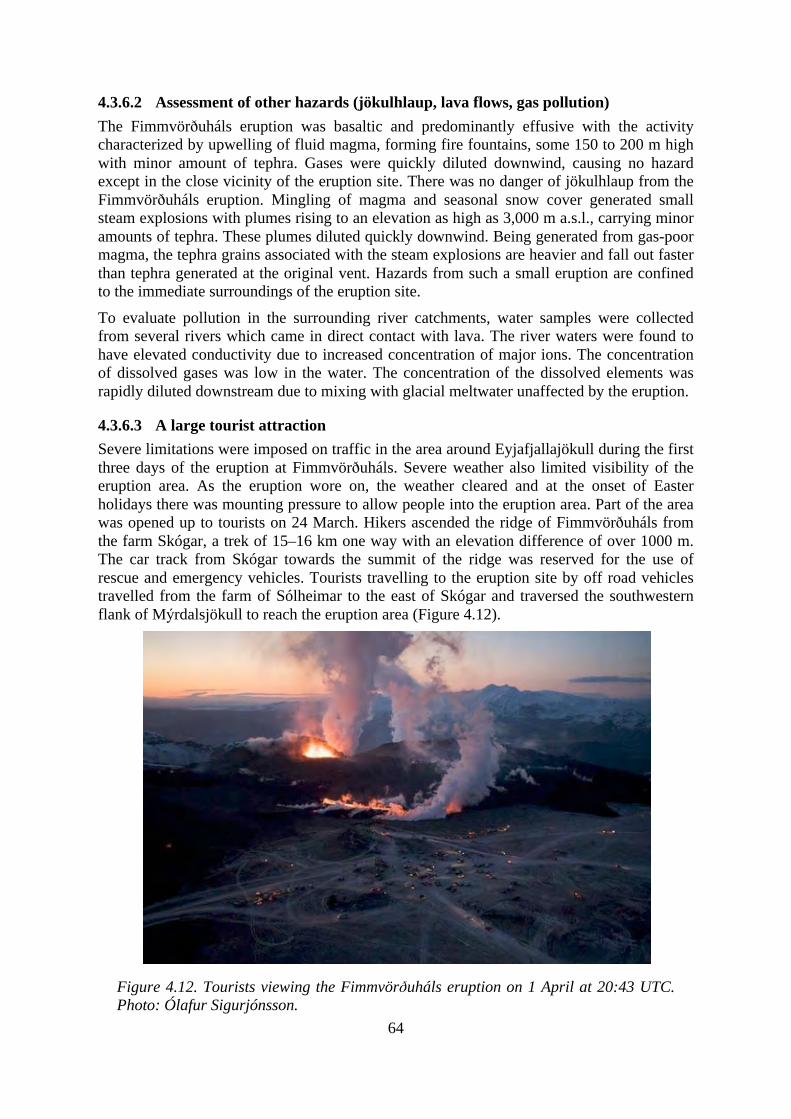
64
4.3.6.2 Assessment of other hazards (jökulhlaup, lava flows, gas pollution) The Fimmvörðuháls eruption was basaltic and predominantly effusive with the activity characterized by upwelling of fluid magma, forming fire fountains, some 150 to 200 m high with minor amount of tephra. Gases were quickly diluted downwind, causing no hazard except in the close vicinity of the eruption site. There was no danger of jökulhlaup from the Fimmvörðuháls eruption. Mingling of magma and seasonal snow cover generated small steam explosions with plumes rising to an elevation as high as 3,000 m a.s.l., carrying minor amounts of tephra. These plumes diluted quickly downwind. Being generated from gas-poor magma, the tephra grains associated with the steam explosions are heavier and fall out faster than tephra generated at the original vent. Hazards from such a small eruption are confined to the immediate surroundings of the eruption site.
To evaluate pollution in the surrounding river catchments, water samples were collected from several rivers which came in direct contact with lava. The river waters were found to have elevated conductivity due to increased concentration of major ions. The concentration of dissolved gases was low in the water. The concentration of the dissolved elements was rapidly diluted downstream due to mixing with glacial meltwater unaffected by the eruption.
4.3.6.3 A large tourist attraction Severe limitations were imposed on traffic in the area around Eyjafjallajökull during the first three days of the eruption at Fimmvörðuháls. Severe weather also limited visibility of the eruption area. As the eruption wore on, the weather cleared and at the onset of Easter holidays there was mounting pressure to allow people into the eruption area. Part of the area was opened up to tourists on 24 March. Hikers ascended the ridge of Fimmvörðuháls from the farm Skógar, a trek of 15–16 km one way with an elevation difference of over 1000 m. The car track from Skógar towards the summit of the ridge was reserved for the use of rescue and emergency vehicles. Tourists travelling to the eruption site by off road vehicles travelled from the farm of Sólheimar to the east of Skógar and traversed the southwestern flank of Mýrdalsjökull to reach the eruption area (Figure 4.12).
Figure 4.12. Tourists viewing the Fimmvörðuháls eruption on 1 April at 20:43 UTC. Photo: Ólafur Sigurjónsson.
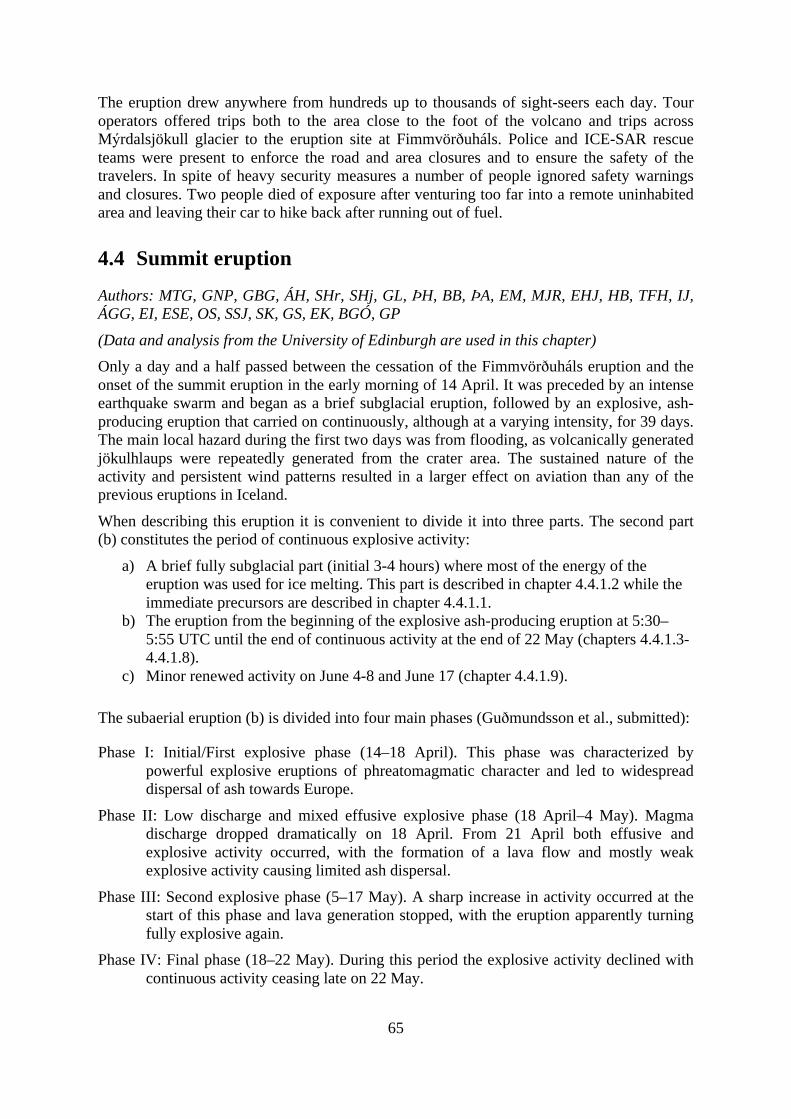
65
The eruption drew anywhere from hundreds up to thousands of sight-seers each day. Tour operators offered trips both to the area close to the foot of the volcano and trips across Mýrdalsjökull glacier to the eruption site at Fimmvörðuháls. Police and ICE-SAR rescue teams were present to enforce the road and area closures and to ensure the safety of the travelers. In spite of heavy security measures a number of people ignored safety warnings and closures. Two people died of exposure after venturing too far into a remote uninhabited area and leaving their car to hike back after running out of fuel.
4.4 Summit eruption
Authors: MTG, GNP, GBG, ÁH, SHr, SHj, GL, ÞH, BB, ÞA, EM, MJR, EHJ, HB, TFH, IJ, ÁGG, EI, ESE, OS, SSJ, SK, GS, EK, BGÓ, GP (Data and analysis from the University of Edinburgh are used in this chapter) Only a day and a half passed between the cessation of the Fimmvörðuháls eruption and the onset of the summit eruption in the early morning of 14 April. It was preceded by an intense earthquake swarm and began as a brief subglacial eruption, followed by an explosive, ash-producing eruption that carried on continuously, although at a varying intensity, for 39 days. The main local hazard during the first two days was from flooding, as volcanically generated jökulhlaups were repeatedly generated from the crater area. The sustained nature of the activity and persistent wind patterns resulted in a larger effect on aviation than any of the previous eruptions in Iceland.
When describing this eruption it is convenient to divide it into three parts. The second part (b) constitutes the period of continuous explosive activity:
a) A brief fully subglacial part (initial 3-4 hours) where most of the energy of the eruption was used for ice melting. This part is described in chapter 4.4.1.2 while the immediate precursors are described in chapter 4.4.1.1.
b) The eruption from the beginning of the explosive ash-producing eruption at 5:30–5:55 UTC until the end of continuous activity at the end of 22 May (chapters 4.4.1.3-4.4.1.8).
c) Minor renewed activity on June 4-8 and June 17 (chapter 4.4.1.9).
The subaerial eruption (b) is divided into four main phases (Guðmundsson et al., submitted):
Phase I: Initial/First explosive phase (14–18 April). This phase was characterized by powerful explosive eruptions of phreatomagmatic character and led to widespread dispersal of ash towards Europe.
Phase II: Low discharge and mixed effusive explosive phase (18 April–4 May). Magma discharge dropped dramatically on 18 April. From 21 April both effusive and explosive activity occurred, with the formation of a lava flow and mostly weak explosive activity causing limited ash dispersal.
Phase III: Second explosive phase (5–17 May). A sharp increase in activity occurred at the start of this phase and lava generation stopped, with the eruption apparently turning fully explosive again.
Phase IV: Final phase (18–22 May). During this period the explosive activity declined with continuous activity ceasing late on 22 May.
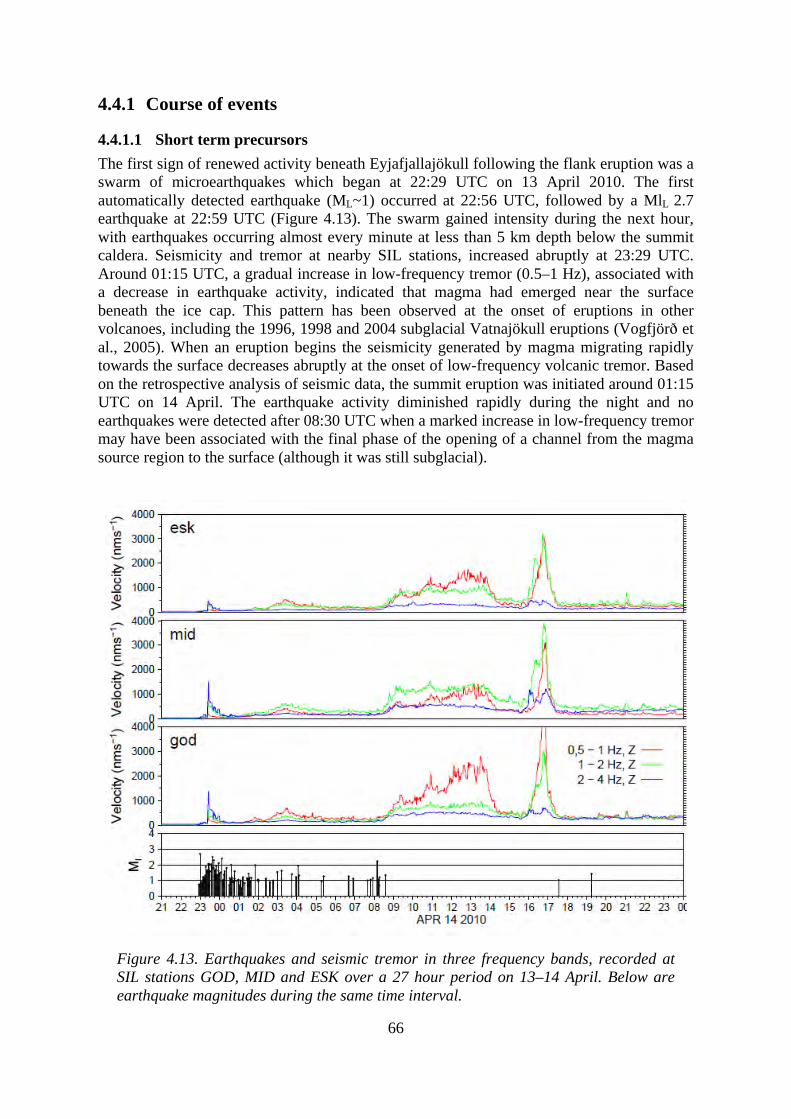
66
4.4.1 Course of events
4.4.1.1 Short term precursors The first sign of renewed activity beneath Eyjafjallajökull following the flank eruption was a swarm of microearthquakes which began at 22:29 UTC on 13 April 2010. The first automatically detected earthquake (ML~1) occurred at 22:56 UTC, followed by a MlL 2.7 earthquake at 22:59 UTC (Figure 4.13). The swarm gained intensity during the next hour, with earthquakes occurring almost every minute at less than 5 km depth below the summit caldera. Seismicity and tremor at nearby SIL stations, increased abruptly at 23:29 UTC. Around 01:15 UTC, a gradual increase in low-frequency tremor (0.5–1 Hz), associated with a decrease in earthquake activity, indicated that magma had emerged near the surface beneath the ice cap. This pattern has been observed at the onset of eruptions in other volcanoes, including the 1996, 1998 and 2004 subglacial Vatnajökull eruptions (Vogfjörð et al., 2005). When an eruption begins the seismicity generated by magma migrating rapidly towards the surface decreases abruptly at the onset of low-frequency volcanic tremor. Based on the retrospective analysis of seismic data, the summit eruption was initiated around 01:15 UTC on 14 April. The earthquake activity diminished rapidly during the night and no earthquakes were detected after 08:30 UTC when a marked increase in low-frequency tremor may have been associated with the final phase of the opening of a channel from the magma source region to the surface (although it was still subglacial).
Figure 4.13. Earthquakes and seismic tremor in three frequency bands, recorded at SIL stations GOD, MID and ESK over a 27 hour period on 13–14 April. Below are earthquake magnitudes during the same time interval.
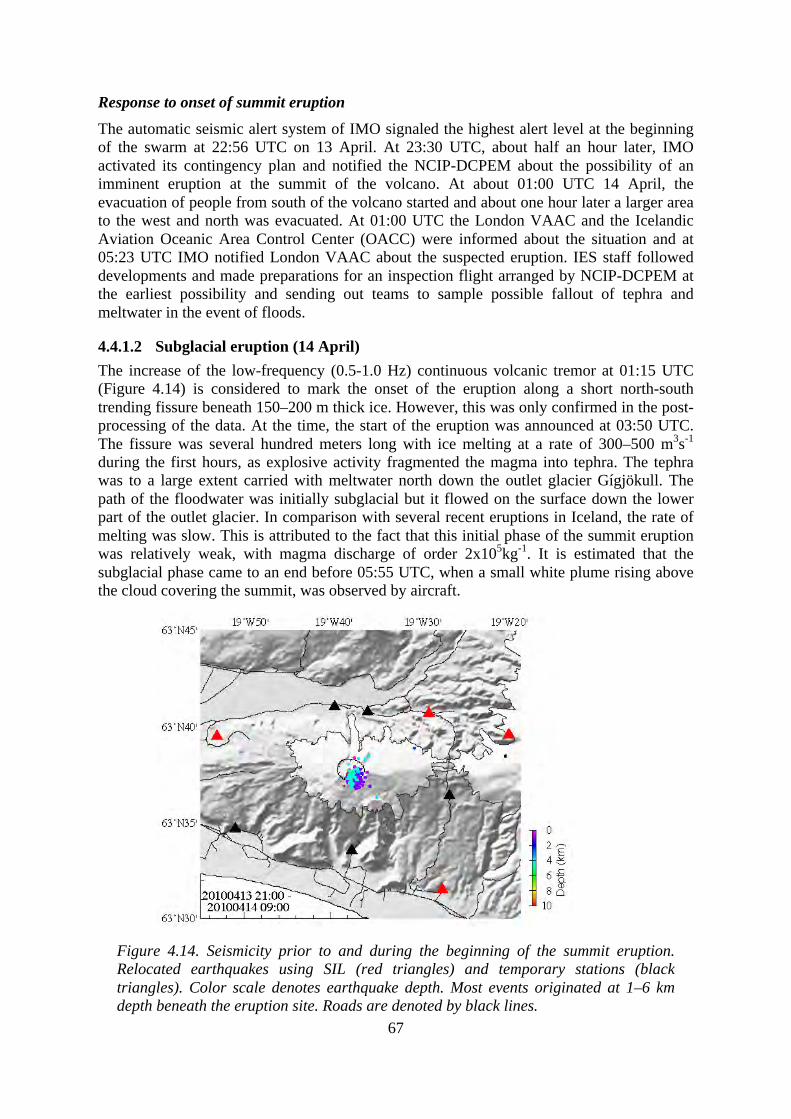
67
Response to onset of summit eruption The automatic seismic alert system of IMO signaled the highest alert level at the beginning of the swarm at 22:56 UTC on 13 April. At 23:30 UTC, about half an hour later, IMO activated its contingency plan and notified the NCIP-DCPEM about the possibility of an imminent eruption at the summit of the volcano. At about 01:00 UTC 14 April, the evacuation of people from south of the volcano started and about one hour later a larger area to the west and north was evacuated. At 01:00 UTC the London VAAC and the Icelandic Aviation Oceanic Area Control Center (OACC) were informed about the situation and at 05:23 UTC IMO notified London VAAC about the suspected eruption. IES staff followed developments and made preparations for an inspection flight arranged by NCIP-DCPEM at the earliest possibility and sending out teams to sample possible fallout of tephra and meltwater in the event of floods.
4.4.1.2 Subglacial eruption (14 April) The increase of the low-frequency (0.5-1.0 Hz) continuous volcanic tremor at 01:15 UTC (Figure 4.14) is considered to mark the onset of the eruption along a short north-south trending fissure beneath 150–200 m thick ice. However, this was only confirmed in the post-processing of the data. At the time, the start of the eruption was announced at 03:50 UTC. The fissure was several hundred meters long with ice melting at a rate of 300–500 m3s-1 during the first hours, as explosive activity fragmented the magma into tephra. The tephra was to a large extent carried with meltwater north down the outlet glacier Gígjökull. The path of the floodwater was initially subglacial but it flowed on the surface down the lower part of the outlet glacier. In comparison with several recent eruptions in Iceland, the rate of melting was slow. This is attributed to the fact that this initial phase of the summit eruption was relatively weak, with magma discharge of order 2x10⁵kg-1. It is estimated that the subglacial phase came to an end before 05:55 UTC, when a small white plume rising above the cloud covering the summit, was observed by aircraft.
Figure 4.14. Seismicity prior to and during the beginning of the summit eruption. Relocated earthquakes using SIL (red triangles) and temporary stations (black triangles). Color scale denotes earthquake depth. Most events originated at 1–6 km depth beneath the eruption site. Roads are denoted by black lines.
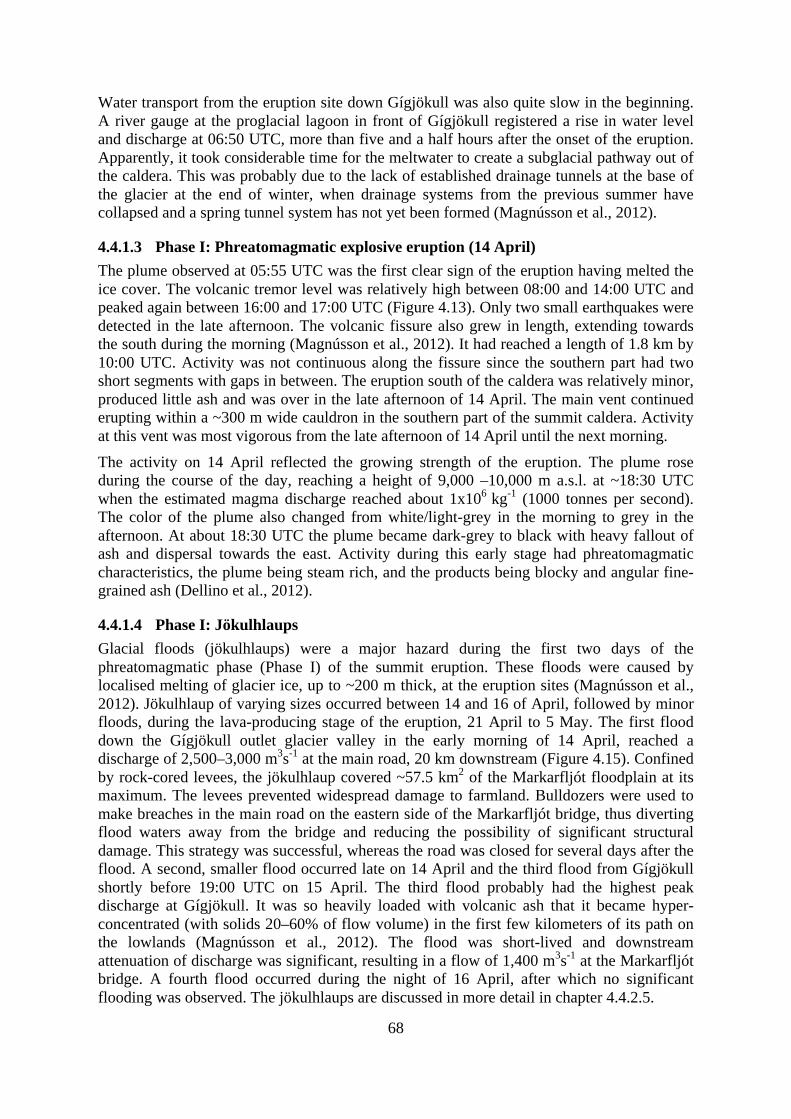
68
Water transport from the eruption site down Gígjökull was also quite slow in the beginning. A river gauge at the proglacial lagoon in front of Gígjökull registered a rise in water level and discharge at 06:50 UTC, more than five and a half hours after the onset of the eruption. Apparently, it took considerable time for the meltwater to create a subglacial pathway out of the caldera. This was probably due to the lack of established drainage tunnels at the base of the glacier at the end of winter, when drainage systems from the previous summer have collapsed and a spring tunnel system has not yet been formed (Magnússon et al., 2012).
4.4.1.3 Phase I: Phreatomagmatic explosive eruption (14 April) The plume observed at 05:55 UTC was the first clear sign of the eruption having melted the ice cover. The volcanic tremor level was relatively high between 08:00 and 14:00 UTC and peaked again between 16:00 and 17:00 UTC (Figure 4.13). Only two small earthquakes were detected in the late afternoon. The volcanic fissure also grew in length, extending towards the south during the morning (Magnússon et al., 2012). It had reached a length of 1.8 km by 10:00 UTC. Activity was not continuous along the fissure since the southern part had two short segments with gaps in between. The eruption south of the caldera was relatively minor, produced little ash and was over in the late afternoon of 14 April. The main vent continued erupting within a ~300 m wide cauldron in the southern part of the summit caldera. Activity at this vent was most vigorous from the late afternoon of 14 April until the next morning. The activity on 14 April reflected the growing strength of the eruption. The plume rose during the course of the day, reaching a height of 9,000 –10,000 m a.s.l. at ~18:30 UTC when the estimated magma discharge reached about 1x10⁶ kg-1 (1000 tonnes per second). The color of the plume also changed from white/light-grey in the morning to grey in the afternoon. At about 18:30 UTC the plume became dark-grey to black with heavy fallout of ash and dispersal towards the east. Activity during this early stage had phreatomagmatic characteristics, the plume being steam rich, and the products being blocky and angular fine-grained ash (Dellino et al., 2012).
4.4.1.4 Phase I: Jökulhlaups Glacial floods (jökulhlaups) were a major hazard during the first two days of the phreatomagmatic phase (Phase I) of the summit eruption. These floods were caused by localised melting of glacier ice, up to ~200 m thick, at the eruption sites (Magnússon et al., 2012). Jökulhlaup of varying sizes occurred between 14 and 16 of April, followed by minor floods, during the lava-producing stage of the eruption, 21 April to 5 May. The first flood down the Gígjökull outlet glacier valley in the early morning of 14 April, reached a discharge of 2,500–3,000 m3s-1 at the main road, 20 km downstream (Figure 4.15). Confined by rock-cored levees, the jökulhlaup covered ~57.5 km2 of the Markarfljót floodplain at its maximum. The levees prevented widespread damage to farmland. Bulldozers were used to make breaches in the main road on the eastern side of the Markarfljót bridge, thus diverting flood waters away from the bridge and reducing the possibility of significant structural damage. This strategy was successful, whereas the road was closed for several days after the flood. A second, smaller flood occurred late on 14 April and the third flood from Gígjökull shortly before 19:00 UTC on 15 April. The third flood probably had the highest peak discharge at Gígjökull. It was so heavily loaded with volcanic ash that it became hyper-concentrated (with solids 20–60% of flow volume) in the first few kilometers of its path on the lowlands (Magnússon et al., 2012). The flood was short-lived and downstream attenuation of discharge was significant, resulting in a flow of 1,400 m3s-1 at the Markarfljót bridge. A fourth flood occurred during the night of 16 April, after which no significant flooding was observed. The jökulhlaups are discussed in more detail in chapter 4.4.2.5.
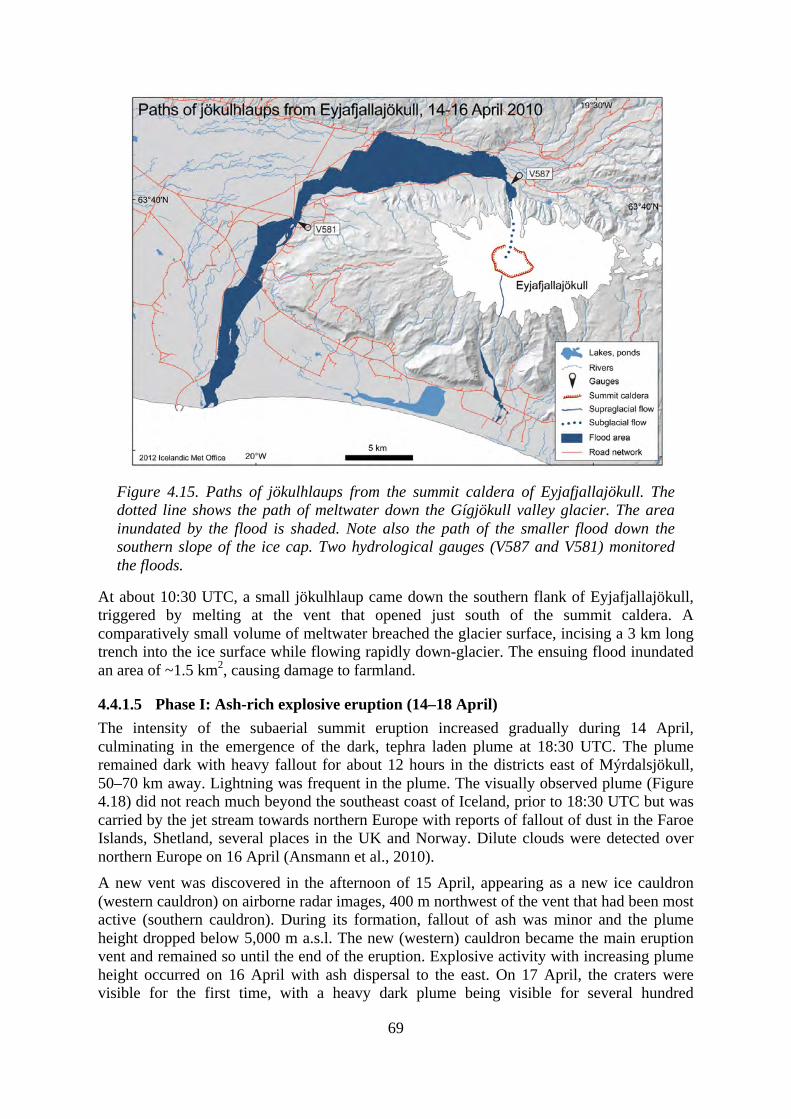
69
Figure 4.15. Paths of jökulhlaups from the summit caldera of Eyjafjallajökull. The dotted line shows the path of meltwater down the Gígjökull valley glacier. The area inundated by the flood is shaded. Note also the path of the smaller flood down the southern slope of the ice cap. Two hydrological gauges (V587 and V581) monitored the floods.
At about 10:30 UTC, a small jökulhlaup came down the southern flank of Eyjafjallajökull, triggered by melting at the vent that opened just south of the summit caldera. A comparatively small volume of meltwater breached the glacier surface, incising a 3 km long trench into the ice surface while flowing rapidly down-glacier. The ensuing flood inundated an area of ~1.5 km2, causing damage to farmland.
4.4.1.5 Phase I: Ash-rich explosive eruption (14–18 April) The intensity of the subaerial summit eruption increased gradually during 14 April, culminating in the emergence of the dark, tephra laden plume at 18:30 UTC. The plume remained dark with heavy fallout for about 12 hours in the districts east of Mýrdalsjökull, 50–70 km away. Lightning was frequent in the plume. The visually observed plume (Figure 4.18) did not reach much beyond the southeast coast of Iceland, prior to 18:30 UTC but was carried by the jet stream towards northern Europe with reports of fallout of dust in the Faroe Islands, Shetland, several places in the UK and Norway. Dilute clouds were detected over northern Europe on 16 April (Ansmann et al., 2010). A new vent was discovered in the afternoon of 15 April, appearing as a new ice cauldron (western cauldron) on airborne radar images, 400 m northwest of the vent that had been most active (southern cauldron). During its formation, fallout of ash was minor and the plume height dropped below 5,000 m a.s.l. The new (western) cauldron became the main eruption vent and remained so until the end of the eruption. Explosive activity with increasing plume height occurred on 16 April with ash dispersal to the east. On 17 April, the craters were visible for the first time, with a heavy dark plume being visible for several hundred
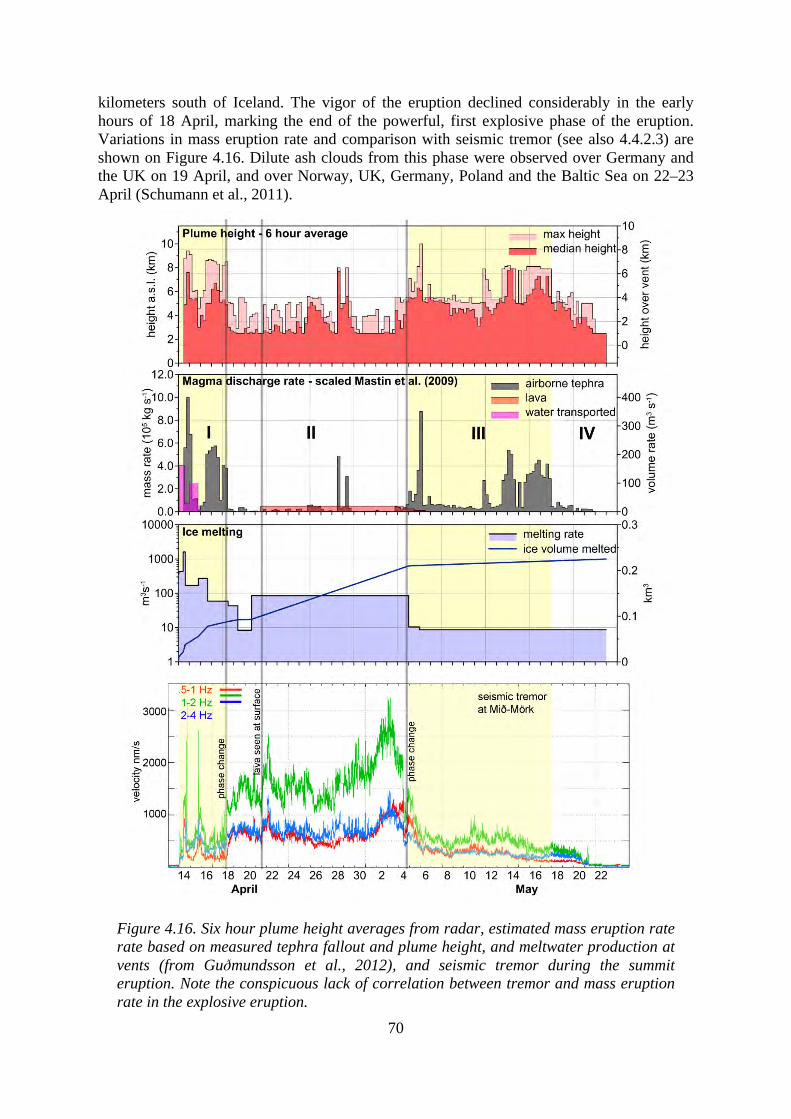
70
kilometers south of Iceland. The vigor of the eruption declined considerably in the early hours of 18 April, marking the end of the powerful, first explosive phase of the eruption. Variations in mass eruption rate and comparison with seismic tremor (see also 4.4.2.3) are shown on Figure 4.16. Dilute ash clouds from this phase were observed over Germany and the UK on 19 April, and over Norway, UK, Germany, Poland and the Baltic Sea on 22–23 April (Schumann et al., 2011).
Figure 4.16. Six hour plume height averages from radar, estimated mass eruption rate rate based on measured tephra fallout and plume height, and meltwater production at vents (from Guðmundsson et al., 2012), and seismic tremor during the summit eruption. Note the conspicuous lack of correlation between tremor and mass eruption rate in the explosive eruption.
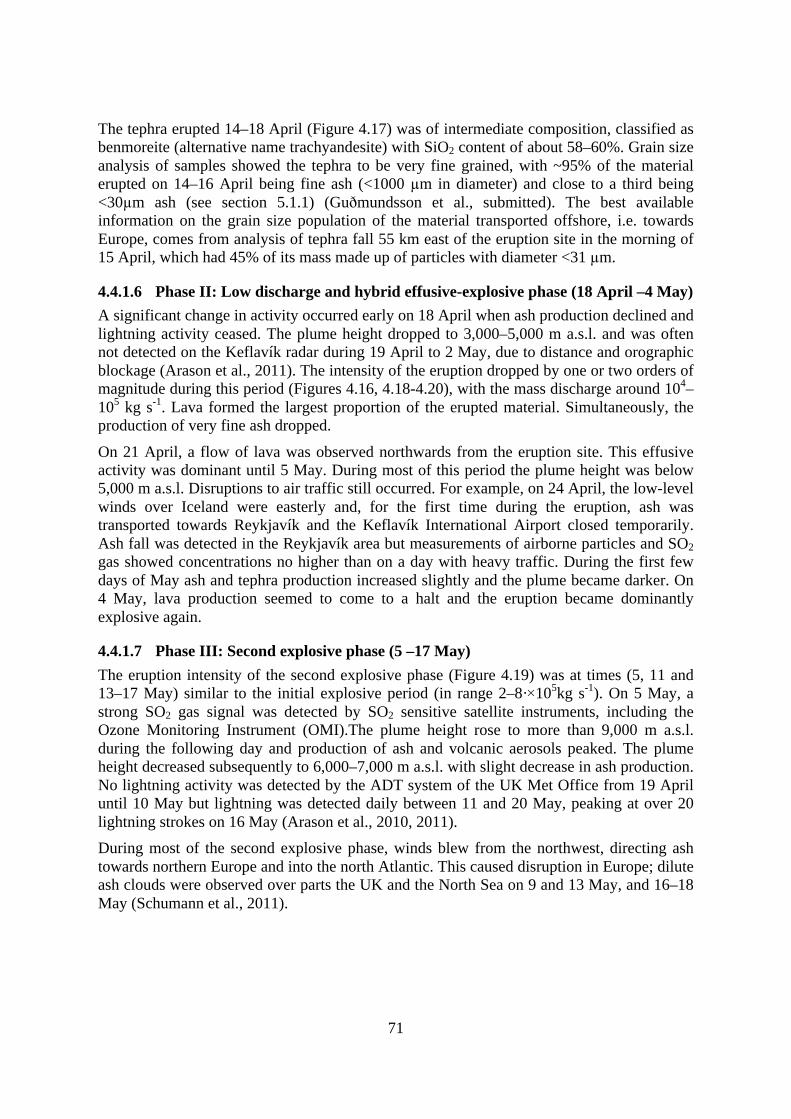
71
The tephra erupted 14–18 April (Figure 4.17) was of intermediate composition, classified as benmoreite (alternative name trachyandesite) with SiO2 content of about 58–60%. Grain size analysis of samples showed the tephra to be very fine grained, with ~95% of the material erupted on 14–16 April being fine ash (<1000 µm in diameter) and close to a third being <30µm ash (see section 5.1.1) (Guðmundsson et al., submitted). The best available information on the grain size population of the material transported offshore, i.e. towards Europe, comes from analysis of tephra fall 55 km east of the eruption site in the morning of 15 April, which had 45% of its mass made up of particles with diameter <31 µm.
4.4.1.6 Phase II: Low discharge and hybrid effusive-explosive phase (18 April –4 May) A significant change in activity occurred early on 18 April when ash production declined and lightning activity ceased. The plume height dropped to 3,000–5,000 m a.s.l. and was often not detected on the Keflavík radar during 19 April to 2 May, due to distance and orographic blockage (Arason et al., 2011). The intensity of the eruption dropped by one or two orders of magnitude during this period (Figures 4.16, 4.18-4.20), with the mass discharge around 104–105 kg s-1. Lava formed the largest proportion of the erupted material. Simultaneously, the production of very fine ash dropped.
On 21 April, a flow of lava was observed northwards from the eruption site. This effusive activity was dominant until 5 May. During most of this period the plume height was below 5,000 m a.s.l. Disruptions to air traffic still occurred. For example, on 24 April, the low-level winds over Iceland were easterly and, for the first time during the eruption, ash was transported towards Reykjavík and the Keflavík International Airport closed temporarily. Ash fall was detected in the Reykjavík area but measurements of airborne particles and SO2 gas showed concentrations no higher than on a day with heavy traffic. During the first few days of May ash and tephra production increased slightly and the plume became darker. On 4 May, lava production seemed to come to a halt and the eruption became dominantly explosive again.
4.4.1.7 Phase III: Second explosive phase (5 –17 May) The eruption intensity of the second explosive phase (Figure 4.19) was at times (5, 11 and 13–17 May) similar to the initial explosive period (in range 2–8·×105kg s-1). On 5 May, a strong SO2 gas signal was detected by SO2 sensitive satellite instruments, including the Ozone Monitoring Instrument (OMI).The plume height rose to more than 9,000 m a.s.l. during the following day and production of ash and volcanic aerosols peaked. The plume height decreased subsequently to 6,000–7,000 m a.s.l. with slight decrease in ash production. No lightning activity was detected by the ADT system of the UK Met Office from 19 April until 10 May but lightning was detected daily between 11 and 20 May, peaking at over 20 lightning strokes on 16 May (Arason et al., 2010, 2011). During most of the second explosive phase, winds blew from the northwest, directing ash towards northern Europe and into the north Atlantic. This caused disruption in Europe; dilute ash clouds were observed over parts the UK and the North Sea on 9 and 13 May, and 16–18 May (Schumann et al., 2011).
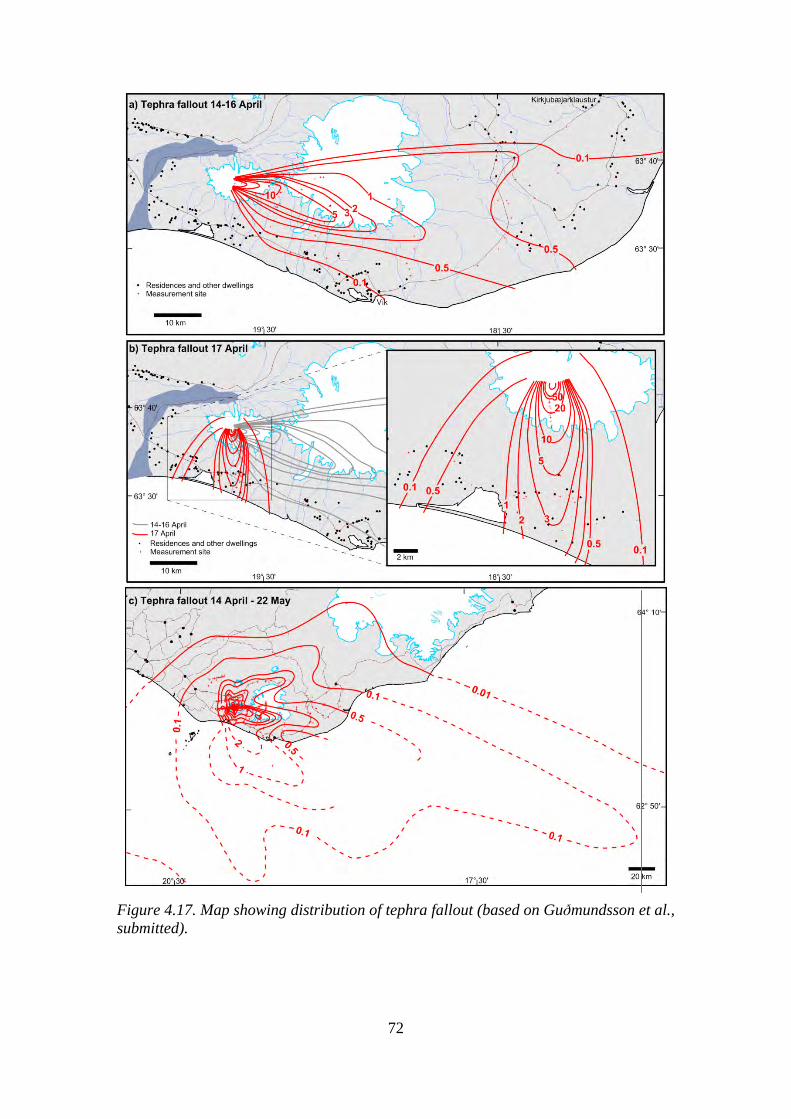
72
Figure 4.17. Map showing distribution of tephra fallout (based on Guðmundsson et al., submitted).
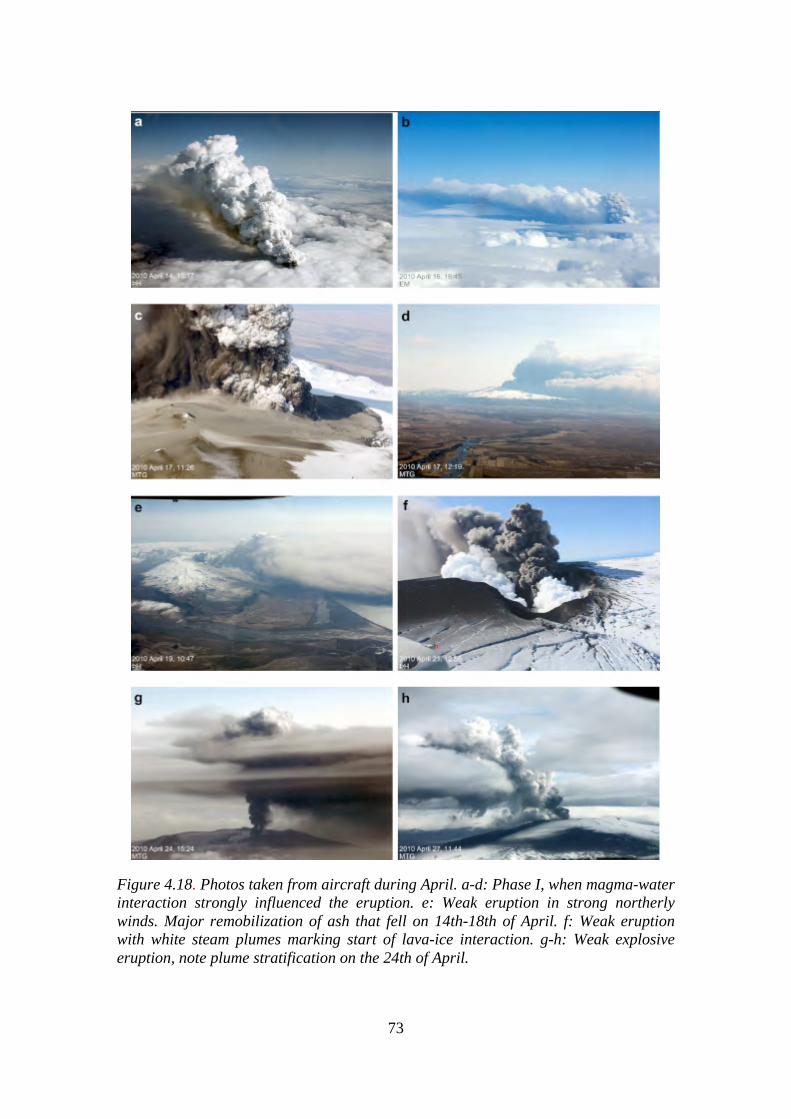
73
Figure 4.18. Photos taken from aircraft during April. a-d: Phase I, when magma-water interaction strongly influenced the eruption. e: Weak eruption in strong northerly winds. Major remobilization of ash that fell on 14th-18th of April. f: Weak eruption with white steam plumes marking start of lava-ice interaction. g-h: Weak explosive eruption, note plume stratification on the 24th of April.
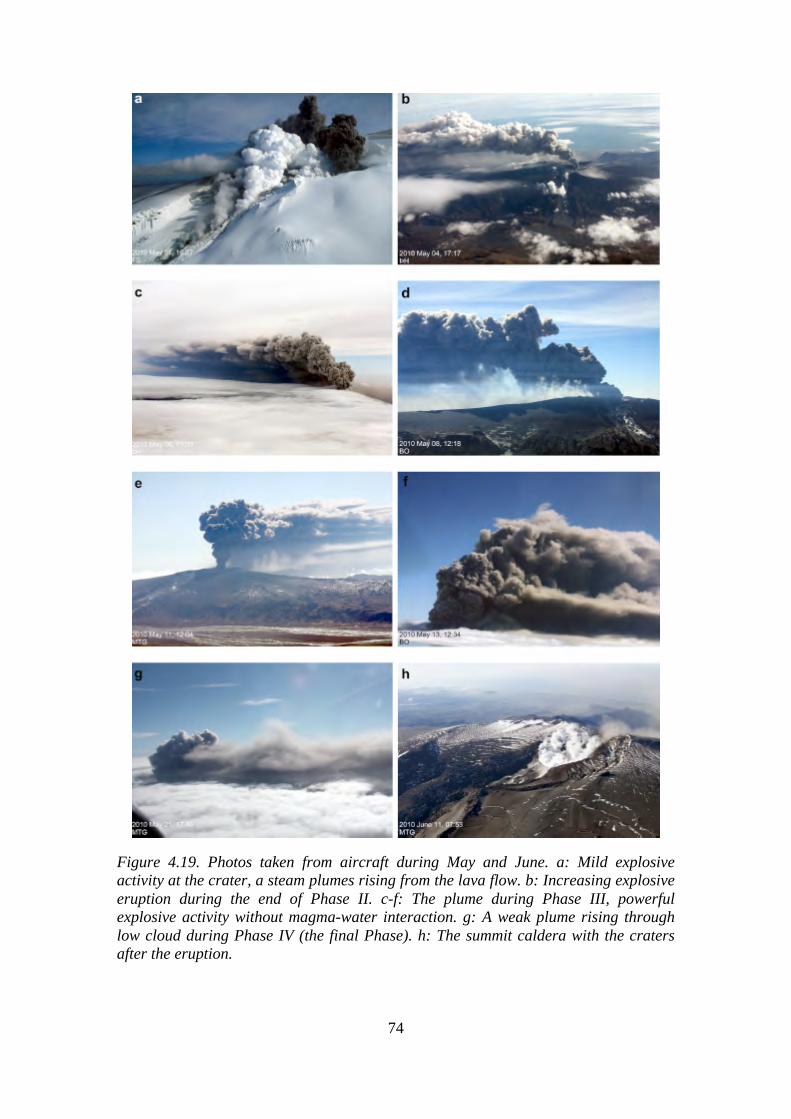
74
Figure 4.19. Photos taken from aircraft during May and June. a: Mild explosive activity at the crater, a steam plumes rising from the lava flow. b: Increasing explosive eruption during the end of Phase II. c-f: The plume during Phase III, powerful explosive activity without magma-water interaction. g: A weak plume rising through low cloud during Phase IV (the final Phase). h: The summit caldera with the craters after the eruption.
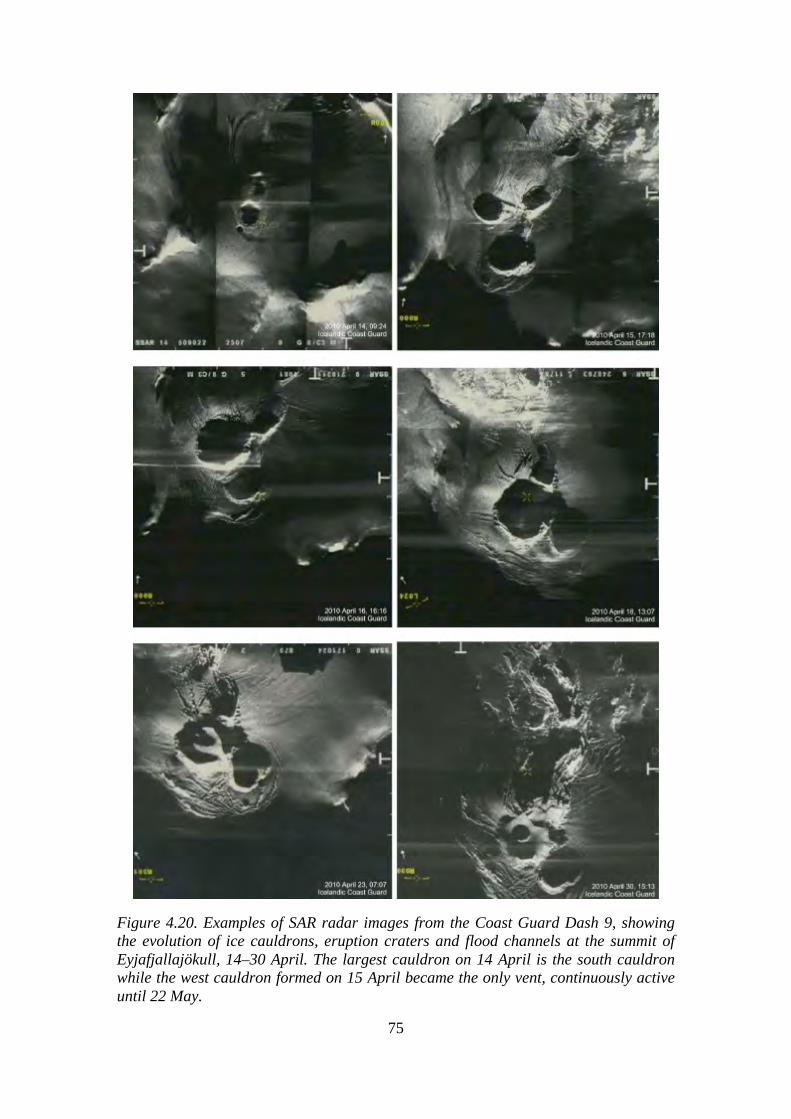
75
Figure 4.20. Examples of SAR radar images from the Coast Guard Dash 9, showing the evolution of ice cauldrons, eruption craters and flood channels at the summit of Eyjafjallajökull, 14–30 April. The largest cauldron on 14 April is the south cauldron while the west cauldron formed on 15 April became the only vent, continuously active until 22 May.
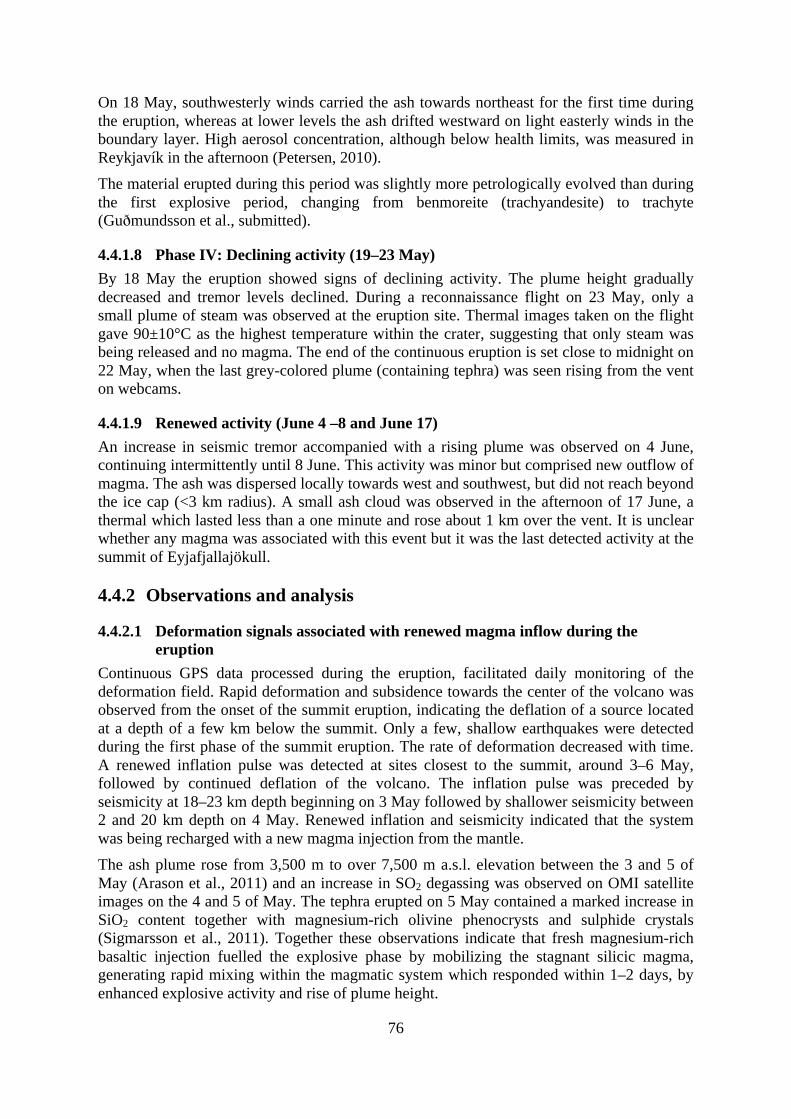
76
On 18 May, southwesterly winds carried the ash towards northeast for the first time during the eruption, whereas at lower levels the ash drifted westward on light easterly winds in the boundary layer. High aerosol concentration, although below health limits, was measured in Reykjavík in the afternoon (Petersen, 2010). The material erupted during this period was slightly more petrologically evolved than during the first explosive period, changing from benmoreite (trachyandesite) to trachyte (Guðmundsson et al., submitted).
4.4.1.8 Phase IV: Declining activity (19–23 May) By 18 May the eruption showed signs of declining activity. The plume height gradually decreased and tremor levels declined. During a reconnaissance flight on 23 May, only a small plume of steam was observed at the eruption site. Thermal images taken on the flight gave 90±10°C as the highest temperature within the crater, suggesting that only steam was being released and no magma. The end of the continuous eruption is set close to midnight on 22 May, when the last grey-colored plume (containing tephra) was seen rising from the vent on webcams.
4.4.1.9 Renewed activity (June 4 –8 and June 17) An increase in seismic tremor accompanied with a rising plume was observed on 4 June, continuing intermittently until 8 June. This activity was minor but comprised new outflow of magma. The ash was dispersed locally towards west and southwest, but did not reach beyond the ice cap (<3 km radius). A small ash cloud was observed in the afternoon of 17 June, a thermal which lasted less than a one minute and rose about 1 km over the vent. It is unclear whether any magma was associated with this event but it was the last detected activity at the summit of Eyjafjallajökull.
4.4.2 Observations and analysis
4.4.2.1 Deformation signals associated with renewed magma inflow during the eruption
Continuous GPS data processed during the eruption, facilitated daily monitoring of the deformation field. Rapid deformation and subsidence towards the center of the volcano was observed from the onset of the summit eruption, indicating the deflation of a source located at a depth of a few km below the summit. Only a few, shallow earthquakes were detected during the first phase of the summit eruption. The rate of deformation decreased with time. A renewed inflation pulse was detected at sites closest to the summit, around 3–6 May, followed by continued deflation of the volcano. The inflation pulse was preceded by seismicity at 18–23 km depth beginning on 3 May followed by shallower seismicity between 2 and 20 km depth on 4 May. Renewed inflation and seismicity indicated that the system was being recharged with a new magma injection from the mantle. The ash plume rose from 3,500 m to over 7,500 m a.s.l. elevation between the 3 and 5 of May (Arason et al., 2011) and an increase in SO2 degassing was observed on OMI satellite images on the 4 and 5 of May. The tephra erupted on 5 May contained a marked increase in SiO2 content together with magnesium-rich olivine phenocrysts and sulphide crystals (Sigmarsson et al., 2011). Together these observations indicate that fresh magnesium-rich basaltic injection fuelled the explosive phase by mobilizing the stagnant silicic magma, generating rapid mixing within the magmatic system which responded within 1–2 days, by enhanced explosive activity and rise of plume height.
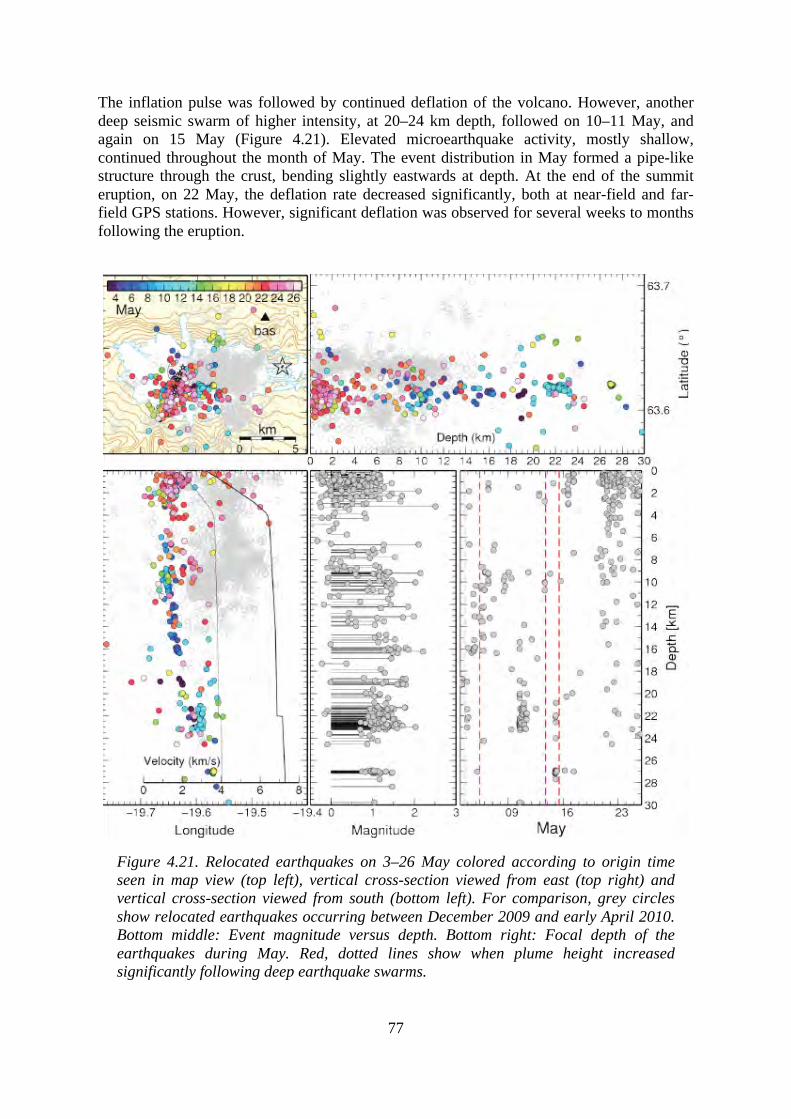
77
The inflation pulse was followed by continued deflation of the volcano. However, another deep seismic swarm of higher intensity, at 20–24 km depth, followed on 10–11 May, and again on 15 May (Figure 4.21). Elevated microearthquake activity, mostly shallow, continued throughout the month of May. The event distribution in May formed a pipe-like structure through the crust, bending slightly eastwards at depth. At the end of the summit eruption, on 22 May, the deflation rate decreased significantly, both at near-field and far-field GPS stations. However, significant deflation was observed for several weeks to months following the eruption.
Figure 4.21. Relocated earthquakes on 3–26 May colored according to origin time seen in map view (top left), vertical cross-section viewed from east (top right) and vertical cross-section viewed from south (bottom left). For comparison, grey circles show relocated earthquakes occurring between December 2009 and early April 2010. Bottom middle: Event magnitude versus depth. Bottom right: Focal depth of the earthquakes during May. Red, dotted lines show when plume height increased significantly following deep earthquake swarms.
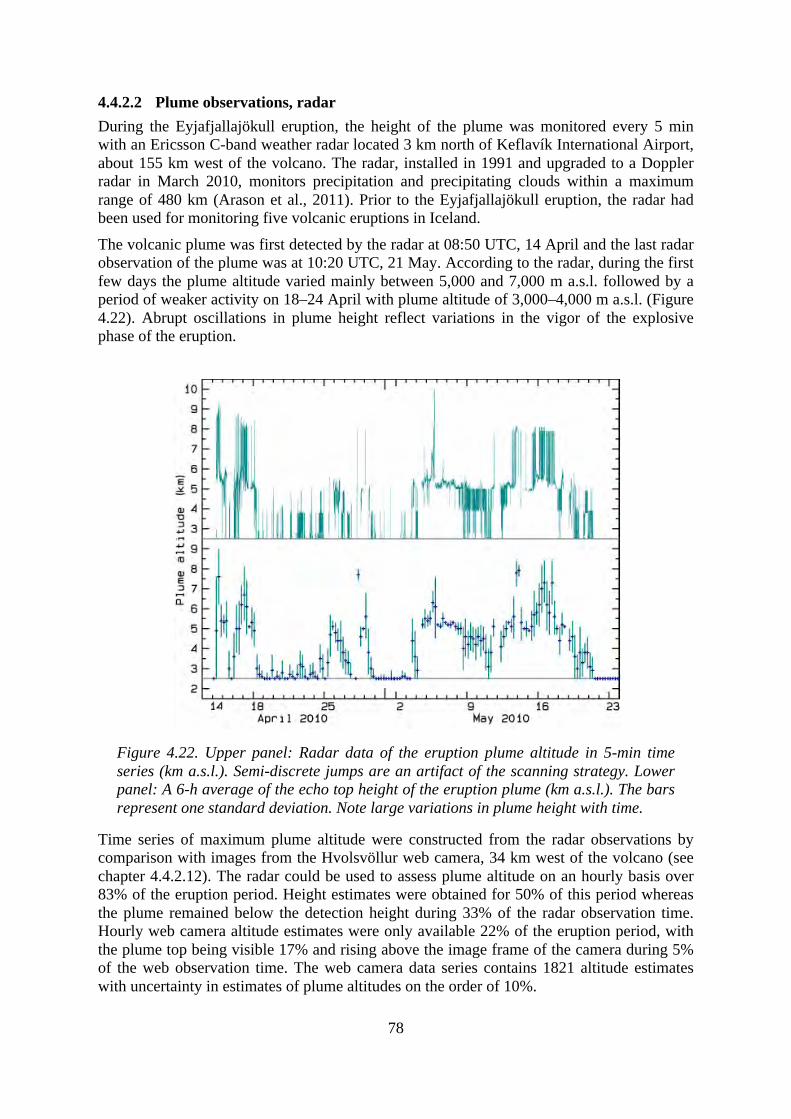
78
4.4.2.2 Plume observations, radar During the Eyjafjallajökull eruption, the height of the plume was monitored every 5 min with an Ericsson C-band weather radar located 3 km north of Keflavík International Airport, about 155 km west of the volcano. The radar, installed in 1991 and upgraded to a Doppler radar in March 2010, monitors precipitation and precipitating clouds within a maximum range of 480 km (Arason et al., 2011). Prior to the Eyjafjallajökull eruption, the radar had been used for monitoring five volcanic eruptions in Iceland.
The volcanic plume was first detected by the radar at 08:50 UTC, 14 April and the last radar observation of the plume was at 10:20 UTC, 21 May. According to the radar, during the first few days the plume altitude varied mainly between 5,000 and 7,000 m a.s.l. followed by a period of weaker activity on 18–24 April with plume altitude of 3,000–4,000 m a.s.l. (Figure 4.22). Abrupt oscillations in plume height reflect variations in the vigor of the explosive phase of the eruption.
Figure 4.22. Upper panel: Radar data of the eruption plume altitude in 5-min time series (km a.s.l.). Semi-discrete jumps are an artifact of the scanning strategy. Lower panel: A 6-h average of the echo top height of the eruption plume (km a.s.l.). The bars represent one standard deviation. Note large variations in plume height with time.
Time series of maximum plume altitude were constructed from the radar observations by comparison with images from the Hvolsvöllur web camera, 34 km west of the volcano (see chapter 4.4.2.12). The radar could be used to assess plume altitude on an hourly basis over 83% of the eruption period. Height estimates were obtained for 50% of this period whereas the plume remained below the detection height during 33% of the radar observation time. Hourly web camera altitude estimates were only available 22% of the eruption period, with the plume top being visible 17% and rising above the image frame of the camera during 5% of the web observation time. The web camera data series contains 1821 altitude estimates with uncertainty in estimates of plume altitudes on the order of 10%.
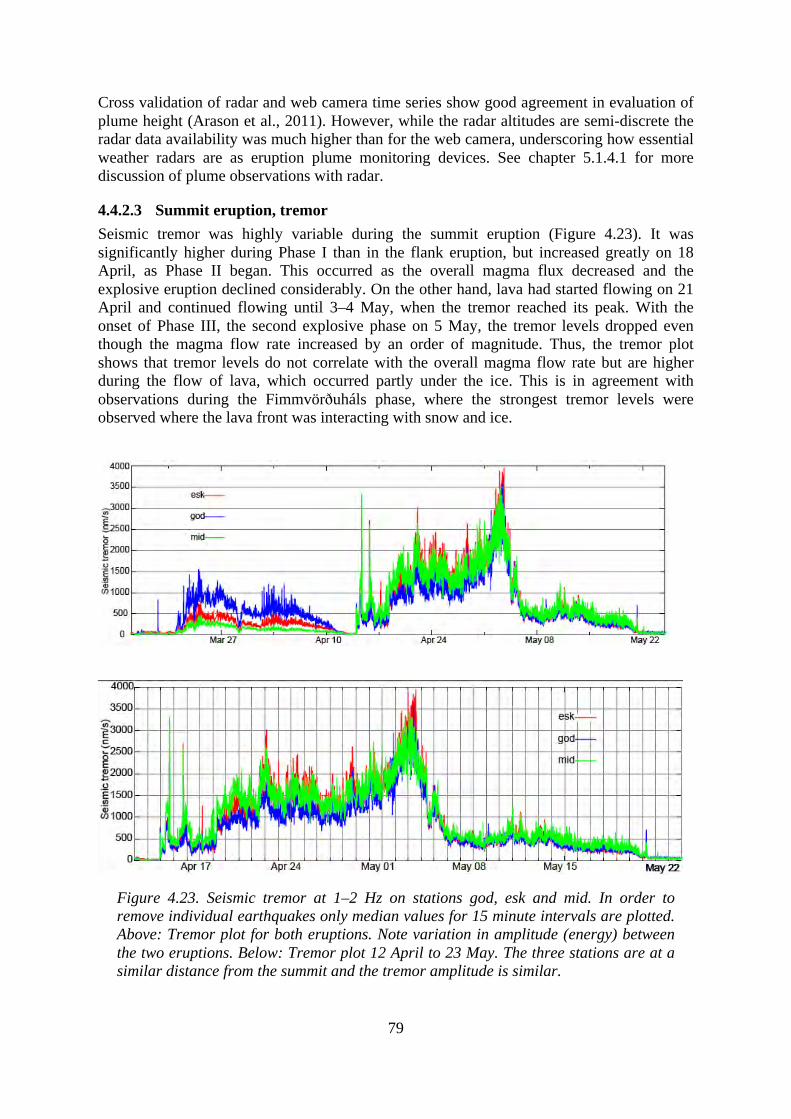
79
Cross validation of radar and web camera time series show good agreement in evaluation of plume height (Arason et al., 2011). However, while the radar altitudes are semi-discrete the radar data availability was much higher than for the web camera, underscoring how essential weather radars are as eruption plume monitoring devices. See chapter 5.1.4.1 for more discussion of plume observations with radar.
4.4.2.3 Summit eruption, tremor Seismic tremor was highly variable during the summit eruption (Figure 4.23). It was significantly higher during Phase I than in the flank eruption, but increased greatly on 18 April, as Phase II began. This occurred as the overall magma flux decreased and the explosive eruption declined considerably. On the other hand, lava had started flowing on 21 April and continued flowing until 3–4 May, when the tremor reached its peak. With the onset of Phase III, the second explosive phase on 5 May, the tremor levels dropped even though the magma flow rate increased by an order of magnitude. Thus, the tremor plot shows that tremor levels do not correlate with the overall magma flow rate but are higher during the flow of lava, which occurred partly under the ice. This is in agreement with observations during the Fimmvörðuháls phase, where the strongest tremor levels were observed where the lava front was interacting with snow and ice.
Figure 4.23. Seismic tremor at 1–2 Hz on stations god, esk and mid. In order to remove individual earthquakes only median values for 15 minute intervals are plotted. Above: Tremor plot for both eruptions. Note variation in amplitude (energy) between the two eruptions. Below: Tremor plot 12 April to 23 May. The three stations are at a similar distance from the summit and the tremor amplitude is similar.
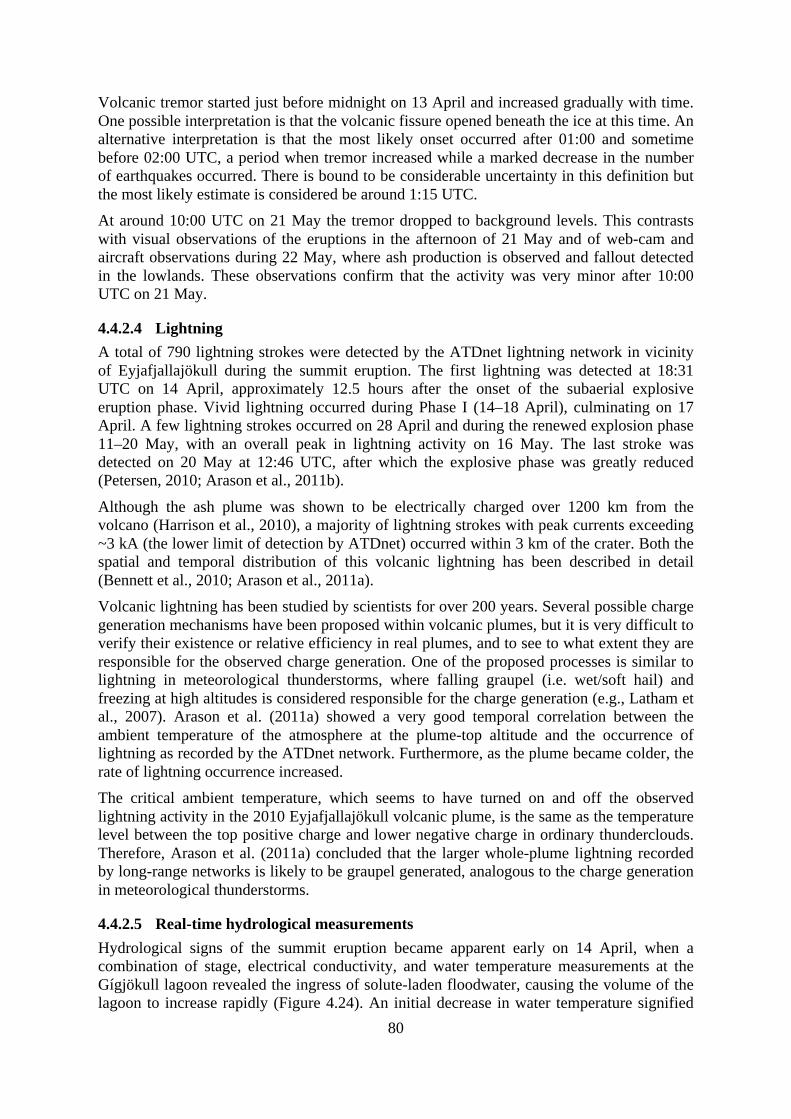
80
Volcanic tremor started just before midnight on 13 April and increased gradually with time. One possible interpretation is that the volcanic fissure opened beneath the ice at this time. An alternative interpretation is that the most likely onset occurred after 01:00 and sometime before 02:00 UTC, a period when tremor increased while a marked decrease in the number of earthquakes occurred. There is bound to be considerable uncertainty in this definition but the most likely estimate is considered be around 1:15 UTC. At around 10:00 UTC on 21 May the tremor dropped to background levels. This contrasts with visual observations of the eruptions in the afternoon of 21 May and of web-cam and aircraft observations during 22 May, where ash production is observed and fallout detected in the lowlands. These observations confirm that the activity was very minor after 10:00 UTC on 21 May.
4.4.2.4 Lightning A total of 790 lightning strokes were detected by the ATDnet lightning network in vicinity of Eyjafjallajökull during the summit eruption. The first lightning was detected at 18:31 UTC on 14 April, approximately 12.5 hours after the onset of the subaerial explosive eruption phase. Vivid lightning occurred during Phase I (14–18 April), culminating on 17 April. A few lightning strokes occurred on 28 April and during the renewed explosion phase 11–20 May, with an overall peak in lightning activity on 16 May. The last stroke was detected on 20 May at 12:46 UTC, after which the explosive phase was greatly reduced (Petersen, 2010; Arason et al., 2011b).
Although the ash plume was shown to be electrically charged over 1200 km from the volcano (Harrison et al., 2010), a majority of lightning strokes with peak currents exceeding ~3 kA (the lower limit of detection by ATDnet) occurred within 3 km of the crater. Both the spatial and temporal distribution of this volcanic lightning has been described in detail (Bennett et al., 2010; Arason et al., 2011a). Volcanic lightning has been studied by scientists for over 200 years. Several possible charge generation mechanisms have been proposed within volcanic plumes, but it is very difficult to verify their existence or relative efficiency in real plumes, and to see to what extent they are responsible for the observed charge generation. One of the proposed processes is similar to lightning in meteorological thunderstorms, where falling graupel (i.e. wet/soft hail) and freezing at high altitudes is considered responsible for the charge generation (e.g., Latham et al., 2007). Arason et al. (2011a) showed a very good temporal correlation between the ambient temperature of the atmosphere at the plume-top altitude and the occurrence of lightning as recorded by the ATDnet network. Furthermore, as the plume became colder, the rate of lightning occurrence increased. The critical ambient temperature, which seems to have turned on and off the observed lightning activity in the 2010 Eyjafjallajökull volcanic plume, is the same as the temperature level between the top positive charge and lower negative charge in ordinary thunderclouds. Therefore, Arason et al. (2011a) concluded that the larger whole-plume lightning recorded by long-range networks is likely to be graupel generated, analogous to the charge generation in meteorological thunderstorms.
4.4.2.5 Real-time hydrological measurements Hydrological signs of the summit eruption became apparent early on 14 April, when a combination of stage, electrical conductivity, and water temperature measurements at the Gígjökull lagoon revealed the ingress of solute-laden floodwater, causing the volume of the lagoon to increase rapidly (Figure 4.24). An initial decrease in water temperature signified
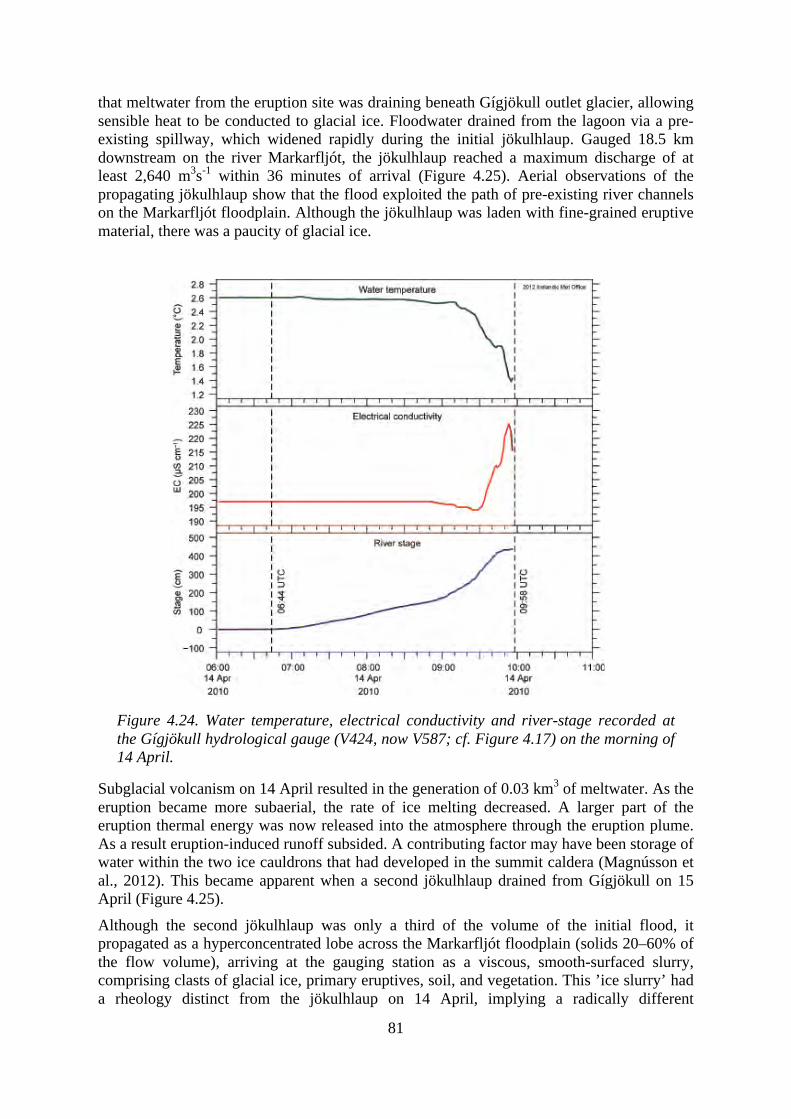
81
that meltwater from the eruption site was draining beneath Gígjökull outlet glacier, allowing sensible heat to be conducted to glacial ice. Floodwater drained from the lagoon via a pre-existing spillway, which widened rapidly during the initial jökulhlaup. Gauged 18.5 km downstream on the river Markarfljót, the jökulhlaup reached a maximum discharge of at least 2,640 m3s-1 within 36 minutes of arrival (Figure 4.25). Aerial observations of the propagating jökulhlaup show that the flood exploited the path of pre-existing river channels on the Markarfljót floodplain. Although the jökulhlaup was laden with fine-grained eruptive material, there was a paucity of glacial ice.
Figure 4.24. Water temperature, electrical conductivity and river-stage recorded at the Gígjökull hydrological gauge (V424, now V587; cf. Figure 4.17) on the morning of 14 April.
Subglacial volcanism on 14 April resulted in the generation of 0.03 km3 of meltwater. As the eruption became more subaerial, the rate of ice melting decreased. A larger part of the eruption thermal energy was now released into the atmosphere through the eruption plume. As a result eruption-induced runoff subsided. A contributing factor may have been storage of water within the two ice cauldrons that had developed in the summit caldera (Magnússon et al., 2012). This became apparent when a second jökulhlaup drained from Gígjökull on 15 April (Figure 4.25).
Although the second jökulhlaup was only a third of the volume of the initial flood, it propagated as a hyperconcentrated lobe across the Markarfljót floodplain (solids 20–60% of the flow volume), arriving at the gauging station as a viscous, smooth-surfaced slurry, comprising clasts of glacial ice, primary eruptives, soil, and vegetation. This ’ice slurry’ had a rheology distinct from the jökulhlaup on 14 April, implying a radically different
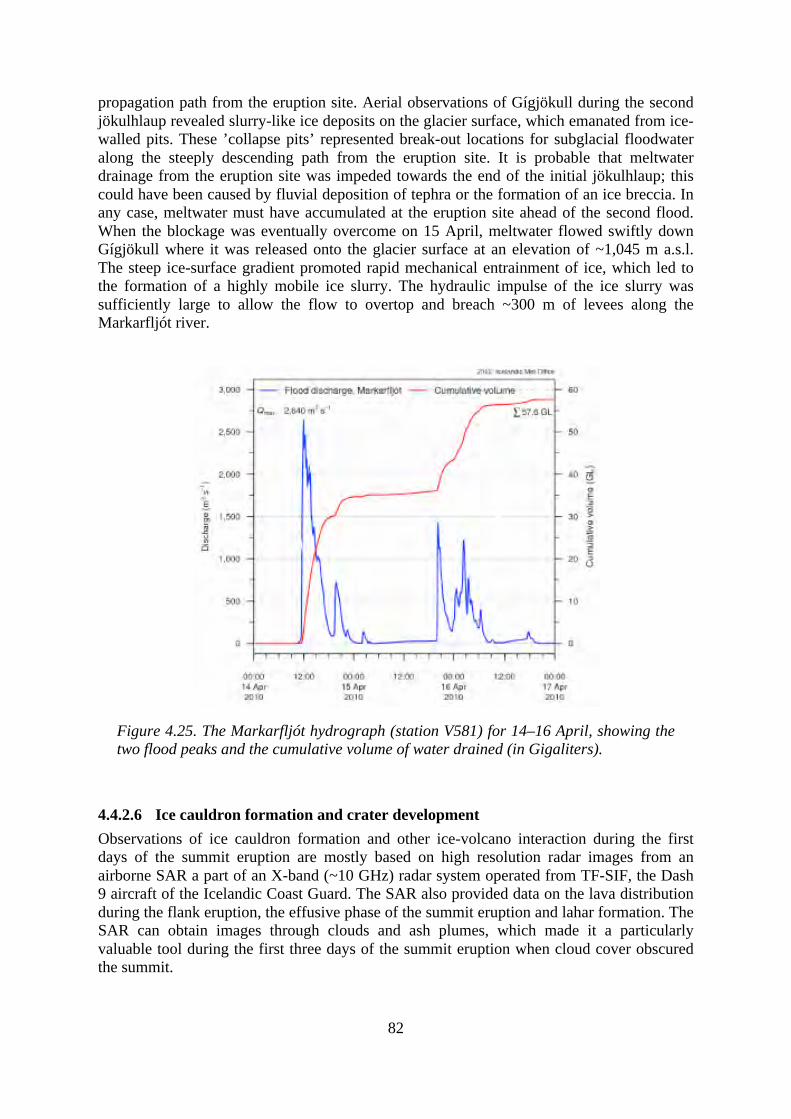
82
propagation path from the eruption site. Aerial observations of Gígjökull during the second jökulhlaup revealed slurry-like ice deposits on the glacier surface, which emanated from ice-walled pits. These ’collapse pits’ represented break-out locations for subglacial floodwater along the steeply descending path from the eruption site. It is probable that meltwater drainage from the eruption site was impeded towards the end of the initial jökulhlaup; this could have been caused by fluvial deposition of tephra or the formation of an ice breccia. In any case, meltwater must have accumulated at the eruption site ahead of the second flood. When the blockage was eventually overcome on 15 April, meltwater flowed swiftly down Gígjökull where it was released onto the glacier surface at an elevation of ~1,045 m a.s.l. The steep ice-surface gradient promoted rapid mechanical entrainment of ice, which led to the formation of a highly mobile ice slurry. The hydraulic impulse of the ice slurry was sufficiently large to allow the flow to overtop and breach ~300 m of levees along the Markarfljót river.
Figure 4.25. The Markarfljót hydrograph (station V581) for 14–16 April, showing the two flood peaks and the cumulative volume of water drained (in Gigaliters).
4.4.2.6 Ice cauldron formation and crater development Observations of ice cauldron formation and other ice-volcano interaction during the first days of the summit eruption are mostly based on high resolution radar images from an airborne SAR a part of an X-band (~10 GHz) radar system operated from TF-SIF, the Dash 9 aircraft of the Icelandic Coast Guard. The SAR also provided data on the lava distribution during the flank eruption, the effusive phase of the summit eruption and lahar formation. The SAR can obtain images through clouds and ash plumes, which made it a particularly valuable tool during the first three days of the summit eruption when cloud cover obscured the summit.
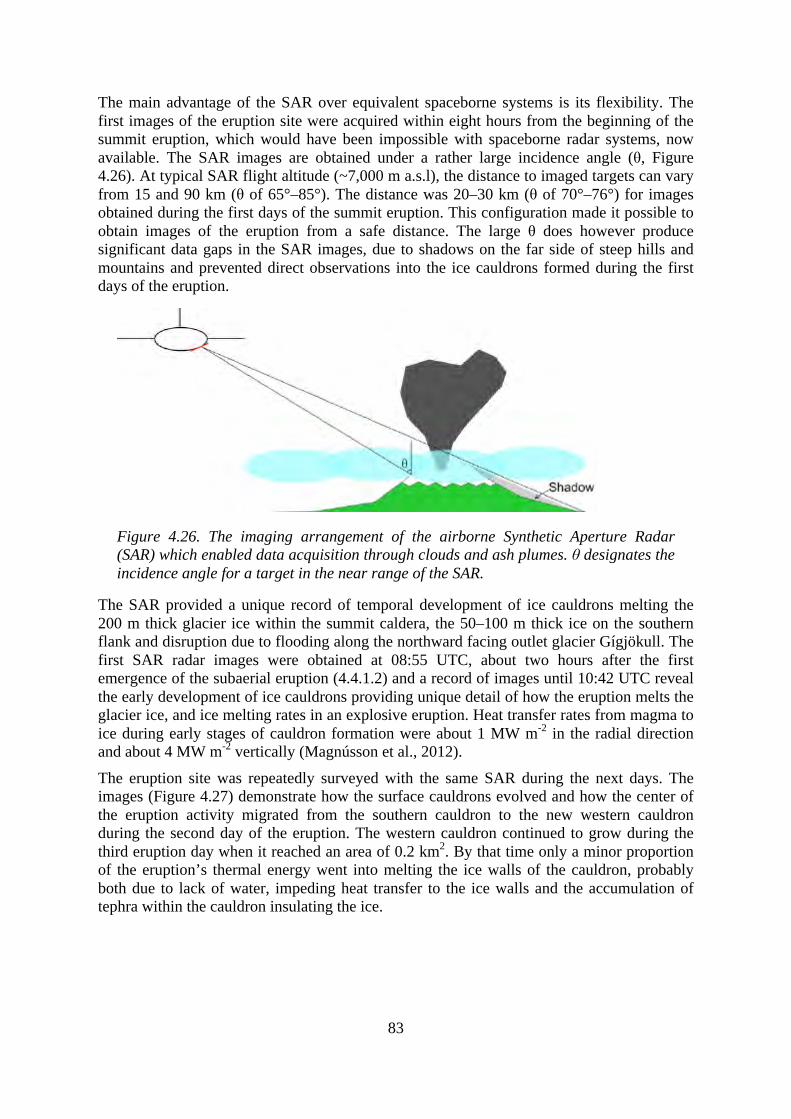
83
The main advantage of the SAR over equivalent spaceborne systems is its flexibility. The first images of the eruption site were acquired within eight hours from the beginning of the summit eruption, which would have been impossible with spaceborne radar systems, now available. The SAR images are obtained under a rather large incidence angle (θ, Figure 4.26). At typical SAR flight altitude (~7,000 m a.s.l), the distance to imaged targets can vary from 15 and 90 km (θ of 65°–85°). The distance was 20–30 km (θ of 70°–76°) for images obtained during the first days of the summit eruption. This configuration made it possible to obtain images of the eruption from a safe distance. The large θ does however produce significant data gaps in the SAR images, due to shadows on the far side of steep hills and mountains and prevented direct observations into the ice cauldrons formed during the first days of the eruption.
Figure 4.26. The imaging arrangement of the airborne Synthetic Aperture Radar (SAR) which enabled data acquisition through clouds and ash plumes. θ designates the incidence angle for a target in the near range of the SAR.
The SAR provided a unique record of temporal development of ice cauldrons melting the 200 m thick glacier ice within the summit caldera, the 50–100 m thick ice on the southern flank and disruption due to flooding along the northward facing outlet glacier Gígjökull. The first SAR radar images were obtained at 08:55 UTC, about two hours after the first emergence of the subaerial eruption (4.4.1.2) and a record of images until 10:42 UTC reveal the early development of ice cauldrons providing unique detail of how the eruption melts the glacier ice, and ice melting rates in an explosive eruption. Heat transfer rates from magma to ice during early stages of cauldron formation were about 1 MW m-2 in the radial direction and about 4 MW m-2 vertically (Magnússon et al., 2012).
The eruption site was repeatedly surveyed with the same SAR during the next days. The images (Figure 4.27) demonstrate how the surface cauldrons evolved and how the center of the eruption activity migrated from the southern cauldron to the new western cauldron during the second day of the eruption. The western cauldron continued to grow during the third eruption day when it reached an area of 0.2 km2. By that time only a minor proportion of the eruption’s thermal energy went into melting the ice walls of the cauldron, probably both due to lack of water, impeding heat transfer to the ice walls and the accumulation of tephra within the cauldron insulating the ice.
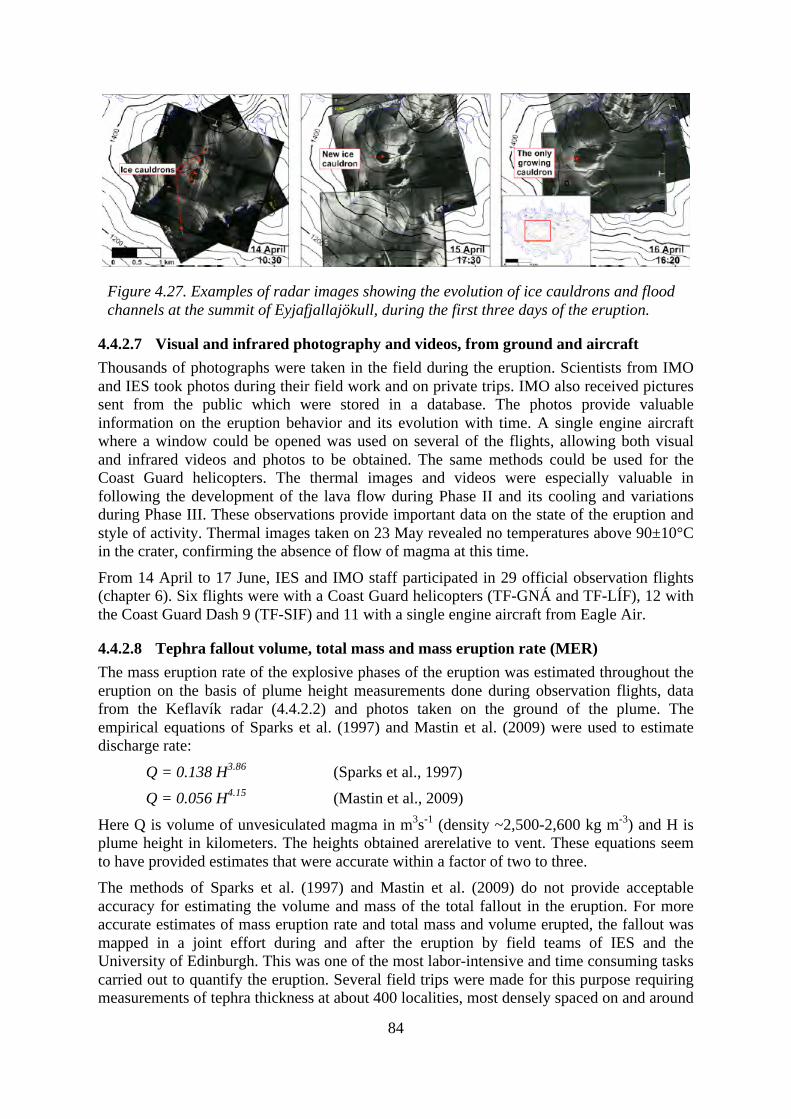
84
Figure 4.27. Examples of radar images showing the evolution of ice cauldrons and flood channels at the summit of Eyjafjallajökull, during the first three days of the eruption.
4.4.2.7 Visual and infrared photography and videos, from ground and aircraft Thousands of photographs were taken in the field during the eruption. Scientists from IMO and IES took photos during their field work and on private trips. IMO also received pictures sent from the public which were stored in a database. The photos provide valuable information on the eruption behavior and its evolution with time. A single engine aircraft where a window could be opened was used on several of the flights, allowing both visual and infrared videos and photos to be obtained. The same methods could be used for the Coast Guard helicopters. The thermal images and videos were especially valuable in following the development of the lava flow during Phase II and its cooling and variations during Phase III. These observations provide important data on the state of the eruption and style of activity. Thermal images taken on 23 May revealed no temperatures above 90±10°C in the crater, confirming the absence of flow of magma at this time.
From 14 April to 17 June, IES and IMO staff participated in 29 official observation flights (chapter 6). Six flights were with a Coast Guard helicopters (TF-GNÁ and TF-LÍF), 12 with the Coast Guard Dash 9 (TF-SIF) and 11 with a single engine aircraft from Eagle Air.
4.4.2.8 Tephra fallout volume, total mass and mass eruption rate (MER) The mass eruption rate of the explosive phases of the eruption was estimated throughout the eruption on the basis of plume height measurements done during observation flights, data from the Keflavík radar (4.4.2.2) and photos taken on the ground of the plume. The empirical equations of Sparks et al. (1997) and Mastin et al. (2009) were used to estimate discharge rate:
Q = 0.138 H3.86 (Sparks et al., 1997) Q = 0.056 H4.15 (Mastin et al., 2009)
Here Q is volume of unvesiculated magma in m3s-1 (density ~2,500-2,600 kg m-3) and H is plume height in kilometers. The heights obtained arerelative to vent. These equations seem to have provided estimates that were accurate within a factor of two to three. The methods of Sparks et al. (1997) and Mastin et al. (2009) do not provide acceptable accuracy for estimating the volume and mass of the total fallout in the eruption. For more accurate estimates of mass eruption rate and total mass and volume erupted, the fallout was mapped in a joint effort during and after the eruption by field teams of IES and the University of Edinburgh. This was one of the most labor-intensive and time consuming tasks carried out to quantify the eruption. Several field trips were made for this purpose requiring measurements of tephra thickness at about 400 localities, most densely spaced on and around
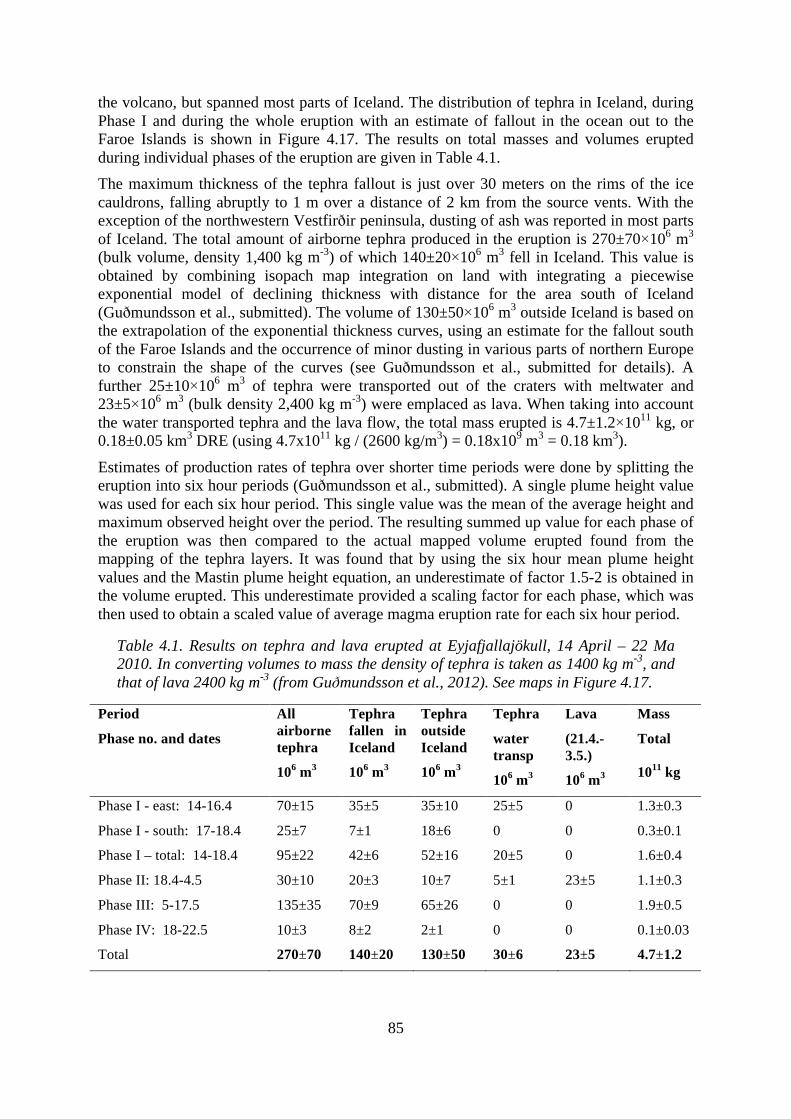
85
the volcano, but spanned most parts of Iceland. The distribution of tephra in Iceland, during Phase I and during the whole eruption with an estimate of fallout in the ocean out to the Faroe Islands is shown in Figure 4.17. The results on total masses and volumes erupted during individual phases of the eruption are given in Table 4.1. The maximum thickness of the tephra fallout is just over 30 meters on the rims of the ice cauldrons, falling abruptly to 1 m over a distance of 2 km from the source vents. With the exception of the northwestern Vestfirðir peninsula, dusting of ash was reported in most parts of Iceland. The total amount of airborne tephra produced in the eruption is 270±70×106 m3 (bulk volume, density 1,400 kg m-3) of which 140±20×106 m3 fell in Iceland. This value is obtained by combining isopach map integration on land with integrating a piecewise exponential model of declining thickness with distance for the area south of Iceland (Guðmundsson et al., submitted). The volume of 130±50×106 m3 outside Iceland is based on the extrapolation of the exponential thickness curves, using an estimate for the fallout south of the Faroe Islands and the occurrence of minor dusting in various parts of northern Europe to constrain the shape of the curves (see Guðmundsson et al., submitted for details). A further 25±10×106 m3 of tephra were transported out of the craters with meltwater and 23±5×10⁶ m3 (bulk density 2,400 kg m-3) were emplaced as lava. When taking into account the water transported tephra and the lava flow, the total mass erupted is 4.7±1.2×10¹¹ kg, or 0.18±0.05 km3 DRE (using 4.7x10¹¹ kg / (2600 kg/m3) = 0.18x10⁹ m3 = 0.18 km3).
Estimates of production rates of tephra over shorter time periods were done by splitting the eruption into six hour periods (Guðmundsson et al., submitted). A single plume height value was used for each six hour period. This single value was the mean of the average height and maximum observed height over the period. The resulting summed up value for each phase of the eruption was then compared to the actual mapped volume erupted found from the mapping of the tephra layers. It was found that by using the six hour mean plume height values and the Mastin plume height equation, an underestimate of factor 1.5-2 is obtained in the volume erupted. This underestimate provided a scaling factor for each phase, which was then used to obtain a scaled value of average magma eruption rate for each six hour period.
Table 4.1. Results on tephra and lava erupted at Eyjafjallajökull, 14 April – 22 Ma 2010. In converting volumes to mass the density of tephra is taken as 1400 kg m-3, and that of lava 2400 kg m-3 (from Guðmundsson et al., 2012). See maps in Figure 4.17.
Period Phase no. and dates
All airborne tephra 106 m3
Tephra fallen in Iceland 106 m3
Tephra outside Iceland 106 m3
Tephra water transp 106 m3
Lava (21.4.-3.5.) 106 m3
Mass Total 1011 kg
Phase I - east: 14-16.4 70±15 35±5 35±10 25±5 0 1.3±0.3 Phase I - south: 17-18.4 Phase I – total: 14-18.4 Phase II: 18.4-4.5
25±7 95±22 30±10
7±1 42±6 20±3
18±6 52±16 10±7
0 20±5 5±1
0 0 23±5
0.3±0.1 1.6±0.4 1.1±0.3
Phase III: 5-17.5 135±35 70±9 65±26 0 0 1.9±0.5 Phase IV: 18-22.5 10±3 8±2 2±1 0 0 0.1±0.03 Total 270±70 140±20 130±50 30±6 23±5 4.7±1.2
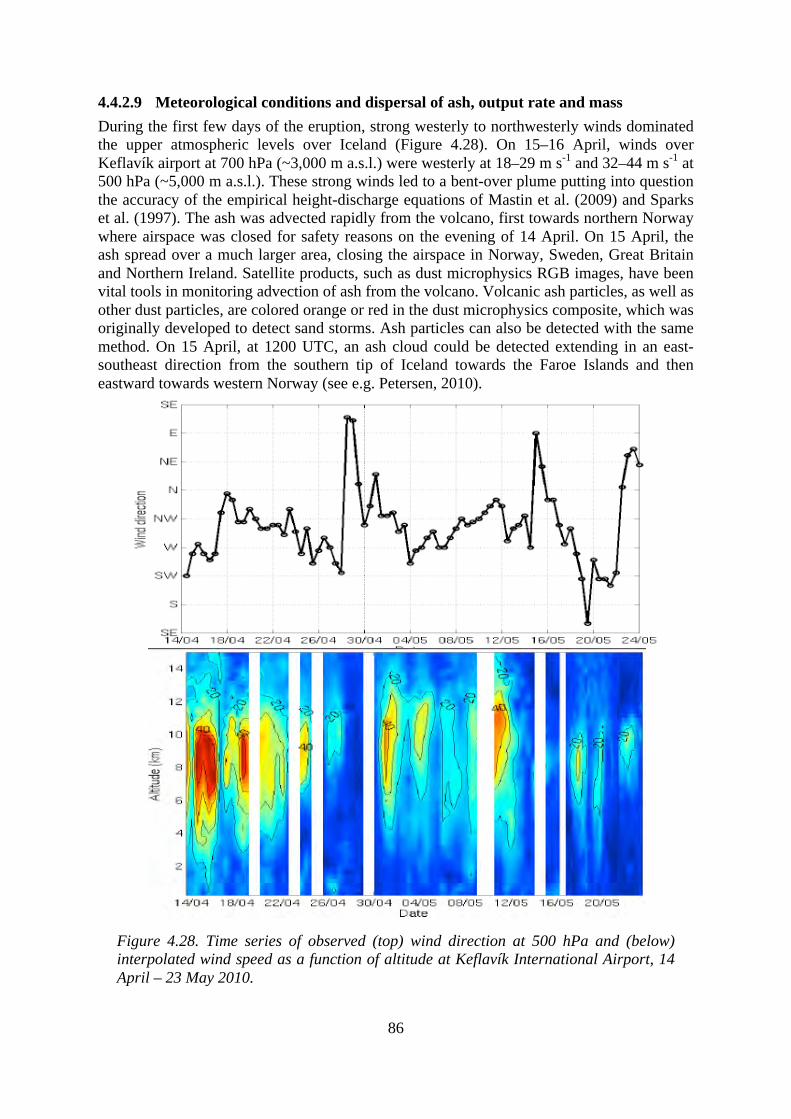
86
4.4.2.9 Meteorological conditions and dispersal of ash, output rate and mass During the first few days of the eruption, strong westerly to northwesterly winds dominated the upper atmospheric levels over Iceland (Figure 4.28). On 15–16 April, winds over Keflavík airport at 700 hPa (~3,000 m a.s.l.) were westerly at 18–29 m s-1 and 32–44 m s-1 at 500 hPa (~5,000 m a.s.l.). These strong winds led to a bent-over plume putting into question the accuracy of the empirical height-discharge equations of Mastin et al. (2009) and Sparks et al. (1997). The ash was advected rapidly from the volcano, first towards northern Norway where airspace was closed for safety reasons on the evening of 14 April. On 15 April, the ash spread over a much larger area, closing the airspace in Norway, Sweden, Great Britain and Northern Ireland. Satellite products, such as dust microphysics RGB images, have been vital tools in monitoring advection of ash from the volcano. Volcanic ash particles, as well as other dust particles, are colored orange or red in the dust microphysics composite, which was originally developed to detect sand storms. Ash particles can also be detected with the same method. On 15 April, at 1200 UTC, an ash cloud could be detected extending in an east-southeast direction from the southern tip of Iceland towards the Faroe Islands and then eastward towards western Norway (see e.g. Petersen, 2010).
Figure 4.28. Time series of observed (top) wind direction at 500 hPa and (below) interpolated wind speed as a function of altitude at Keflavík International Airport, 14 April – 23 May 2010.
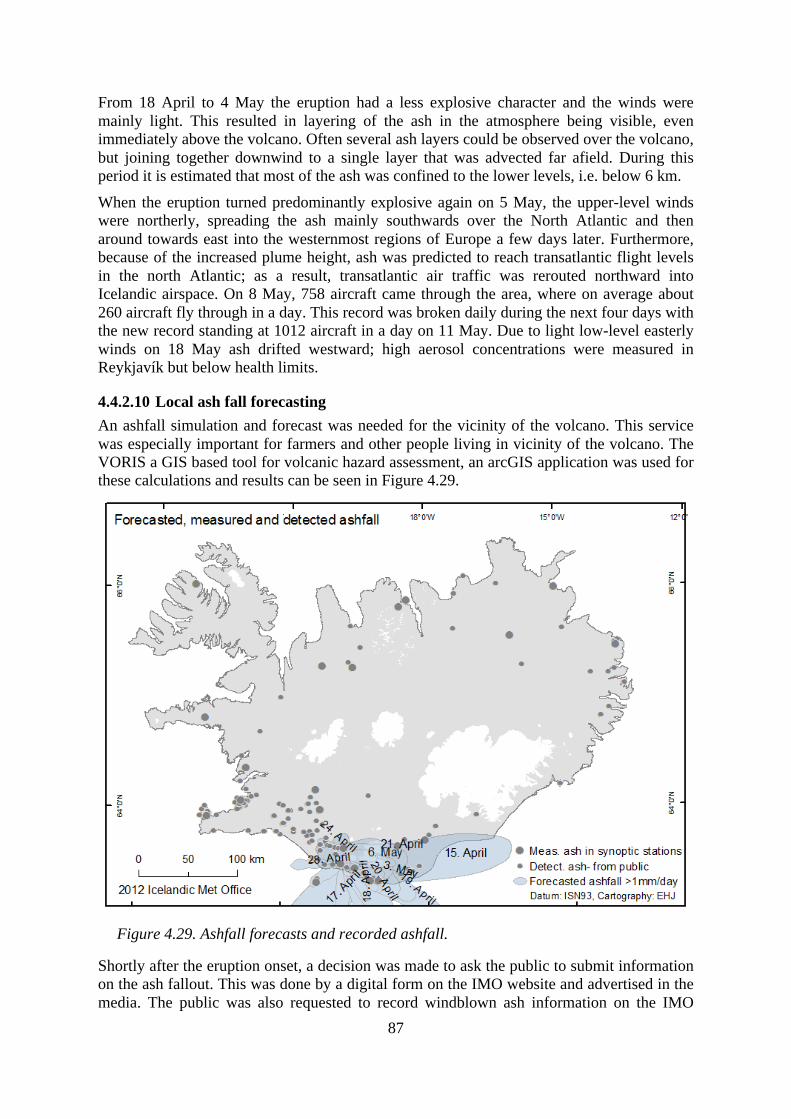
87
From 18 April to 4 May the eruption had a less explosive character and the winds were mainly light. This resulted in layering of the ash in the atmosphere being visible, even immediately above the volcano. Often several ash layers could be observed over the volcano, but joining together downwind to a single layer that was advected far afield. During this period it is estimated that most of the ash was confined to the lower levels, i.e. below 6 km.
When the eruption turned predominantly explosive again on 5 May, the upper-level winds were northerly, spreading the ash mainly southwards over the North Atlantic and then around towards east into the westernmost regions of Europe a few days later. Furthermore, because of the increased plume height, ash was predicted to reach transatlantic flight levels in the north Atlantic; as a result, transatlantic air traffic was rerouted northward into Icelandic airspace. On 8 May, 758 aircraft came through the area, where on average about 260 aircraft fly through in a day. This record was broken daily during the next four days with the new record standing at 1012 aircraft in a day on 11 May. Due to light low-level easterly winds on 18 May ash drifted westward; high aerosol concentrations were measured in Reykjavík but below health limits.
4.4.2.10 Local ash fall forecasting An ashfall simulation and forecast was needed for the vicinity of the volcano. This service was especially important for farmers and other people living in vicinity of the volcano. The VORIS a GIS based tool for volcanic hazard assessment, an arcGIS application was used for these calculations and results can be seen in Figure 4.29.
Figure 4.29. Ashfall forecasts and recorded ashfall.
Shortly after the eruption onset, a decision was made to ask the public to submit information on the ash fallout. This was done by a digital form on the IMO website and advertised in the media. The public was also requested to record windblown ash information on the IMO

88
website. People reacted very well and many records came in the first week when the ashfall was still intense. The ashfall reports could be used to verify the accuracy of ashfall forecasts (Figures 4.28 and 4.29). Information on ashfall was also collected from SYNOP stations.
4.4.2.11 Chemical pollution The relative concentration of surface salts on ash particles, particularly Cl and F, on the Phase I ash was lower than on the Phase III ash because the volume of volatiles available for condensation was lower during Phase I. Instead of being ejected into the plume, the volatiles were dissolved in the glacial meltwater and transported away as solutes. Total dissolved concentrations for F, Al, Fe, Mn and Br in the floodwaters on 14 April were high, well above EU drinking water standards. The surface composition of both the Phase I ash and the Phase II ash had hazardous F concentrations for humans and livestock (Gíslason et al., 2011).
4.4.2.12 Web cameras The most useful camera for monitoring the eruption plume was the Mila camera, located on a mast in the town of Hvolsvöllur, 34 km from the volcano. This camera had a clear view of the volcano and the sky above. The web camera images were saved every five seconds, with vertical resolution at the volcano of about 15 pixels per 100 m. The vertical extent of the camera frame was limited to about 5,200 m a.s.l. or roughly 3,500 m above the summit of the volcano (Figure 4.30). During the summit eruption the camera afforded a clear view of the plume-top 17% of the time, and additional 5% of the images show the plume penetrating above the frame of the images. The view was obscured 74% of the time, and 4% of the images are missing. The camera site at Þórólfsfell hill was well placed to monitor events at the vent of the volcano, as well as the Gígjökull outlet glacier, the site of flash flooding during the eruption. During the effusive phase of the eruption, lava flowed under the outlet glacier down from the volcanic vent, causing steam to rise through holes in the ice cover. A vigorous eruptive plume following the re-intensification of the explosive summit eruption could be seen on 4 May as well as steam rising from the Gígjökull outlet glacier. An infrared (IR) web camera was installed alongside the Þórólfsfell camera on 17 April. This camera was useful during night or when visibility was reduced due to weather-related factors (Figure 4.30).
4.4.2.13 Satellite observations MODIS images (primarily visible and thermal channels) and NOAA AVHRR images (all channels) from NASA (via the Dundee Satellite Receiving Station), were used in real time to monitor and map the extent of the eruption plume from Eyjafjallajökull, day and night throughout the eruption (Figure 4.31).
The images were merged with cartographic data (roads, towns, farms) from the National Land Survey of Iceland in a Geographic Information System (ArcGIS from ESRI) in order to get an instant overview over affected regions. The images were also used to estimate the extent of tephra on the ground to support data collection.
Maps based on this work, were sent to scientists and the response coordination center as soon as possible after each satellite overpass. A number of images and maps were published on this web page: http://notendur.hi.is/ij/aska/eyja.htm in near real time. A number of maps showing temporal changes and comparison of conditions were published on the web page. A GIS database of eruption plume extent was created.
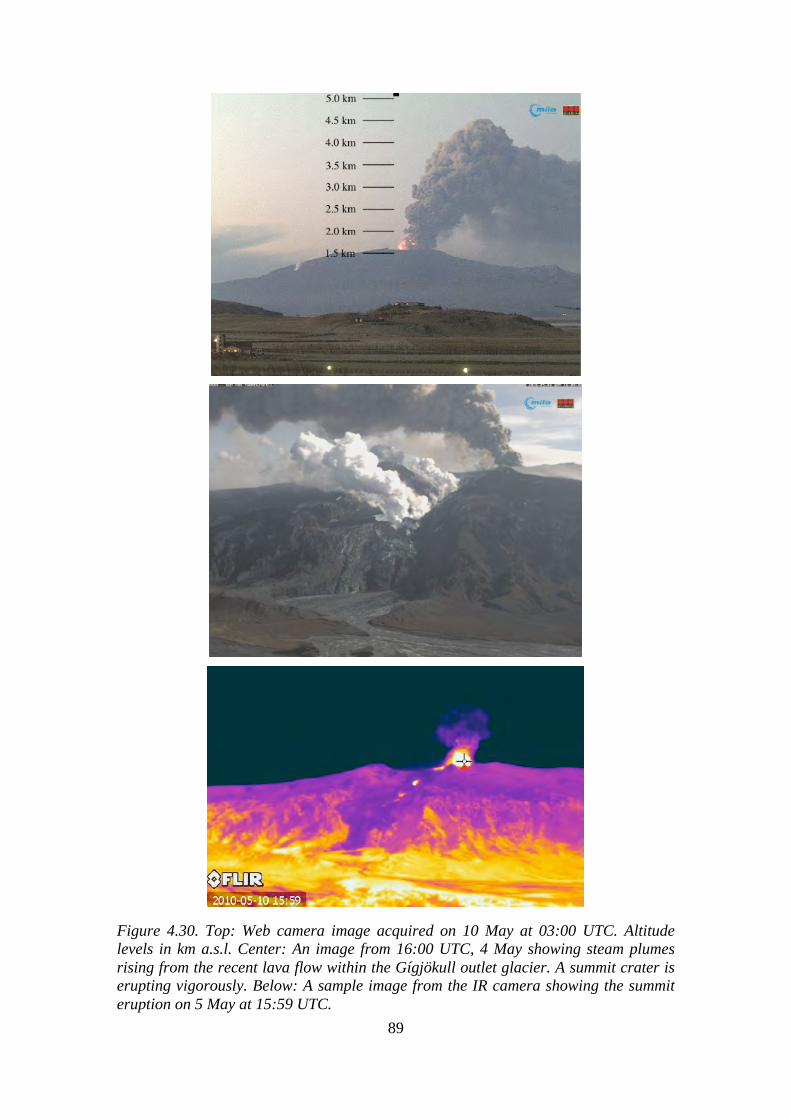
89
Figure 4.30. Top: Web camera image acquired on 10 May at 03:00 UTC. Altitude levels in km a.s.l. Center: An image from 16:00 UTC, 4 May showing steam plumes rising from the recent lava flow within the Gígjökull outlet glacier. A summit crater is erupting vigorously. Below: A sample image from the IR camera showing the summit eruption on 5 May at 15:59 UTC.
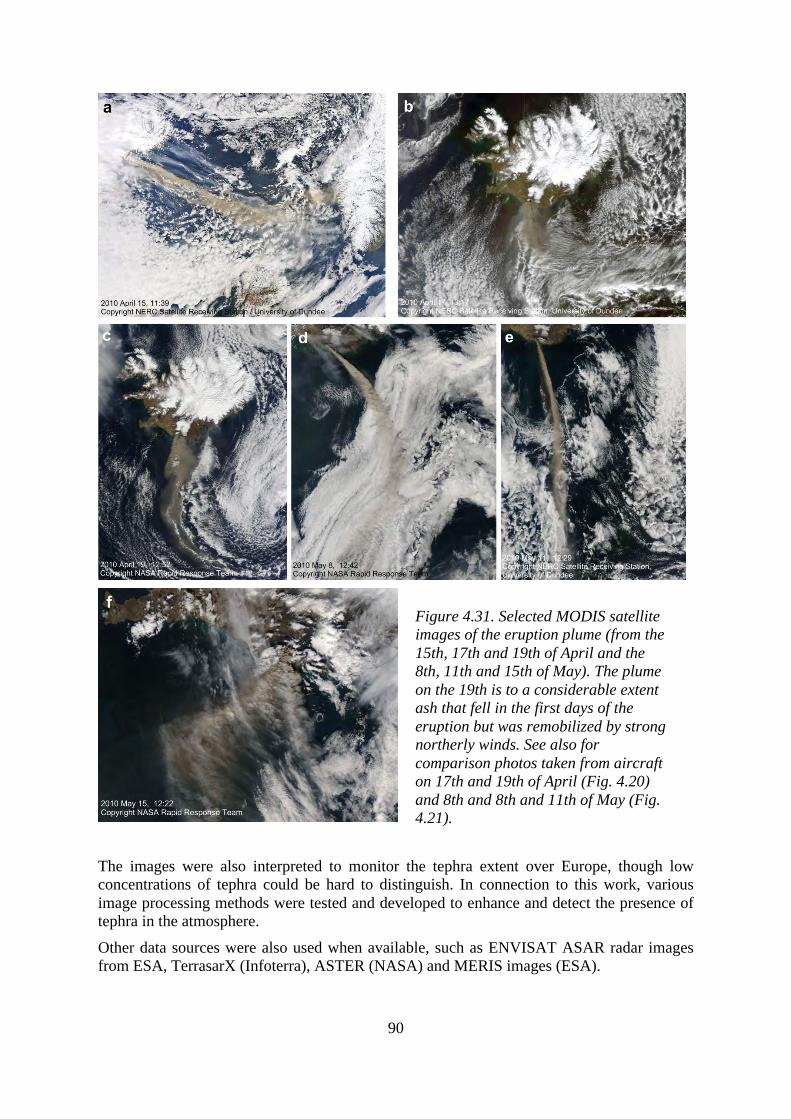
90
The images were also interpreted to monitor the tephra extent over Europe, though low concentrations of tephra could be hard to distinguish. In connection to this work, various image processing methods were tested and developed to enhance and detect the presence of tephra in the atmosphere.
Other data sources were also used when available, such as ENVISAT ASAR radar images from ESA, TerrasarX (Infoterra), ASTER (NASA) and MERIS images (ESA).
Figure 4.31. Selected MODIS satellite images of the eruption plume (from the 15th, 17th and 19th of April and the 8th, 11th and 15th of May). The plume on the 19th is to a considerable extent ash that fell in the first days of the eruption but was remobilized by strong northerly winds. See also for comparison photos taken from aircraft on 17th and 19th of April (Fig. 4.20) and 8th and 8th and 11th of May (Fig. 4.21).
91
4.4.2.14 Geochemistry, including petrology Rapid heating and magma mixing by an injection of fresh basaltic magmas into older silicic crustal chambers has been recognized as a primary source of explosive eruptions, since the late seventies. The exceptional time-sequences obtained from a suite of samples from the tephra fallout of the summit eruption has facilitated detailed reconstruction and assessment of the mixing process (Sigmarsson et al., 2011). The tephra from 14 to 19 April contains three types of magma with basaltic, intermediate, and silicic compositions indicating rapid magma mingling of evolved FeTi-basalt with silicic melt, identical in composition to the 1821–1823 AD summit eruption. A new magma injection of primitive basalt at the beginning of May, was detected by deep seismicity, appearance of Mg-rich olivine phenocrysts together with high sulphur dioxide gas output and the presence of sulphide crystals. The fresh magnesium-rich basaltic injection fueled the explosive phase by mobilizing the stagnant silicic magma. The rapid compositional changes in the eruptive products suggest that magma mingling occurs on a timescale of few hours to days whereas the interval between the first detected magma injection and eruption was several months. Apparently, significant quantities of silicic magma still present in the interior of the volcano (Keiding & Sigmarsson, 2012; Sigmarsson et al., 2011).
4.4.3 Weather conditions Interactions between weather conditions and the volcanic plume were documented throughout the eruption. There were strong southerly and southwesterly winds over Iceland during the first days of the eruption with wind speed exceeding 50 m s-1 at 7,000–10,000 m a.s.l. (Figure 4.28). However, from 17 April northerly winds were prevailing. In fact, during most of the first explosive phase (Phase I) strong upper level winds advected volcanic ash to the southeast (towards Europe) while during the second explosive phase (Phase III) the volcanic ash was transported in a more southerly direction from Iceland (over the N-Atlantic). There were two periods with transport towards the north: during the effusive phase (Phase II) and then again during the final phase of the eruption (Phase IV). In both cases ash production was much less than during the two explosive phases.
The prevailing wind direction during the eruption can be put into a climatic context by comparing the frequency of wind directions with a longer term frequency, e.g. at 500 hPa level. The time period is the duration of the eruption, 14–23 May, for simplicity hereafter termed ’spring’, in 2010 compared to the mean frequency for the 18 year period 1993–2010, see figure 4.32. In addition, the annual frequency is also shown. The figure shows that on an annual basis, southwesterly to westerly winds are the most common (40% of the time). However, there is a greater spread in wind directions in the spring, with winds from southeasterly to northwesterly direction. Furthermore, the frequency of winds with a northerly component is 39%. In contrast, during the spring of 2010 westerly and northwesterly winds dominated. Winds with a northerly component occurred much more frequently, or 60% of the time, and the by far most common wind direction was west-northwesterly, occurring 31% of the time. It should be noted that there is a large annual variability in the wind direction at 500 hPa level in spring. The frequency of a northerly wind component varies from 21% to 66% for the years 1993–2010 (Figure 4.32). However, during 12 out of the 18 springs of the period the frequency of a northerly wind component is within one standard deviation from the average frequency (26–52%), emphasizing the anomalously high frequency of northerly winds during the spring of 2010.
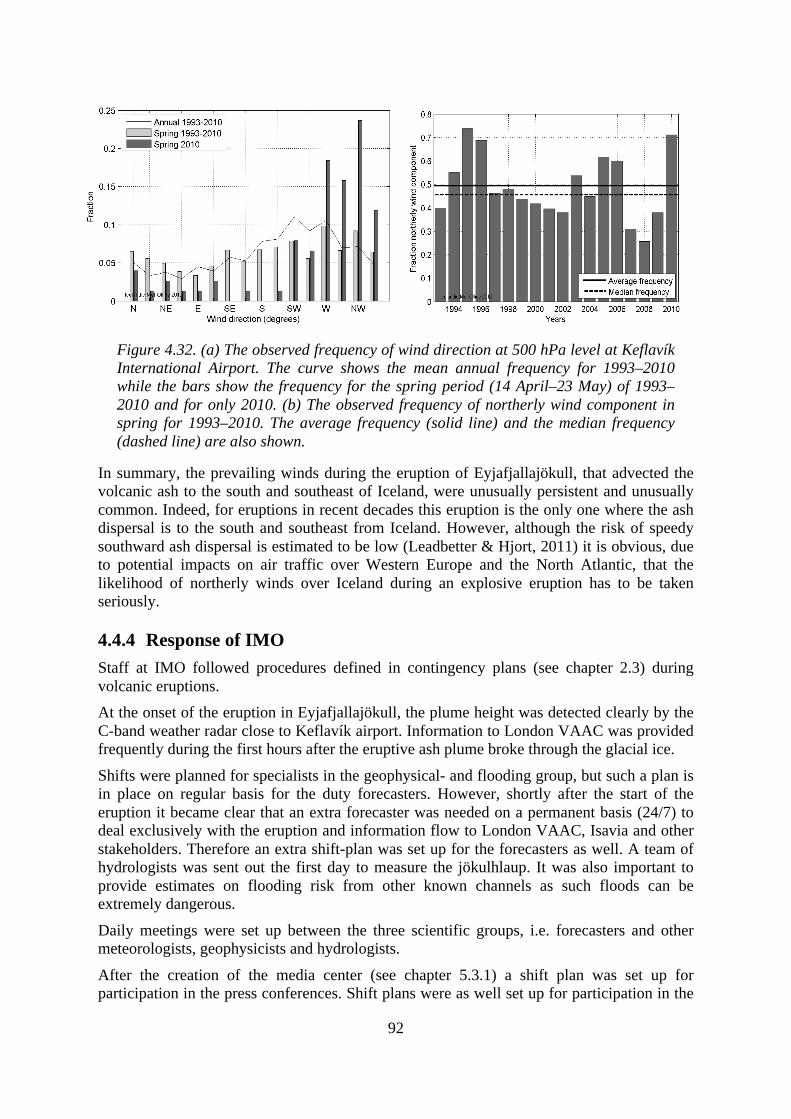
92
Figure 4.32. (a) The observed frequency of wind direction at 500 hPa level at Keflavík International Airport. The curve shows the mean annual frequency for 1993–2010 while the bars show the frequency for the spring period (14 April–23 May) of 1993–2010 and for only 2010. (b) The observed frequency of northerly wind component in spring for 1993–2010. The average frequency (solid line) and the median frequency (dashed line) are also shown.
In summary, the prevailing winds during the eruption of Eyjafjallajökull, that advected the volcanic ash to the south and southeast of Iceland, were unusually persistent and unusually common. Indeed, for eruptions in recent decades this eruption is the only one where the ash dispersal is to the south and southeast from Iceland. However, although the risk of speedy southward ash dispersal is estimated to be low (Leadbetter & Hjort, 2011) it is obvious, due to potential impacts on air traffic over Western Europe and the North Atlantic, that the likelihood of northerly winds over Iceland during an explosive eruption has to be taken seriously.
4.4.4 Response of IMO Staff at IMO followed procedures defined in contingency plans (see chapter 2.3) during volcanic eruptions. At the onset of the eruption in Eyjafjallajökull, the plume height was detected clearly by the C-band weather radar close to Keflavík airport. Information to London VAAC was provided frequently during the first hours after the eruptive ash plume broke through the glacial ice.
Shifts were planned for specialists in the geophysical- and flooding group, but such a plan is in place on regular basis for the duty forecasters. However, shortly after the start of the eruption it became clear that an extra forecaster was needed on a permanent basis (24/7) to deal exclusively with the eruption and information flow to London VAAC, Isavia and other stakeholders. Therefore an extra shift-plan was set up for the forecasters as well. A team of hydrologists was sent out the first day to measure the jökulhlaup. It was also important to provide estimates on flooding risk from other known channels as such floods can be extremely dangerous.
Daily meetings were set up between the three scientific groups, i.e. forecasters and other meteorologists, geophysicists and hydrologists.
After the creation of the media center (see chapter 5.3.1) a shift plan was set up for participation in the press conferences. Shift plans were as well set up for participation in the
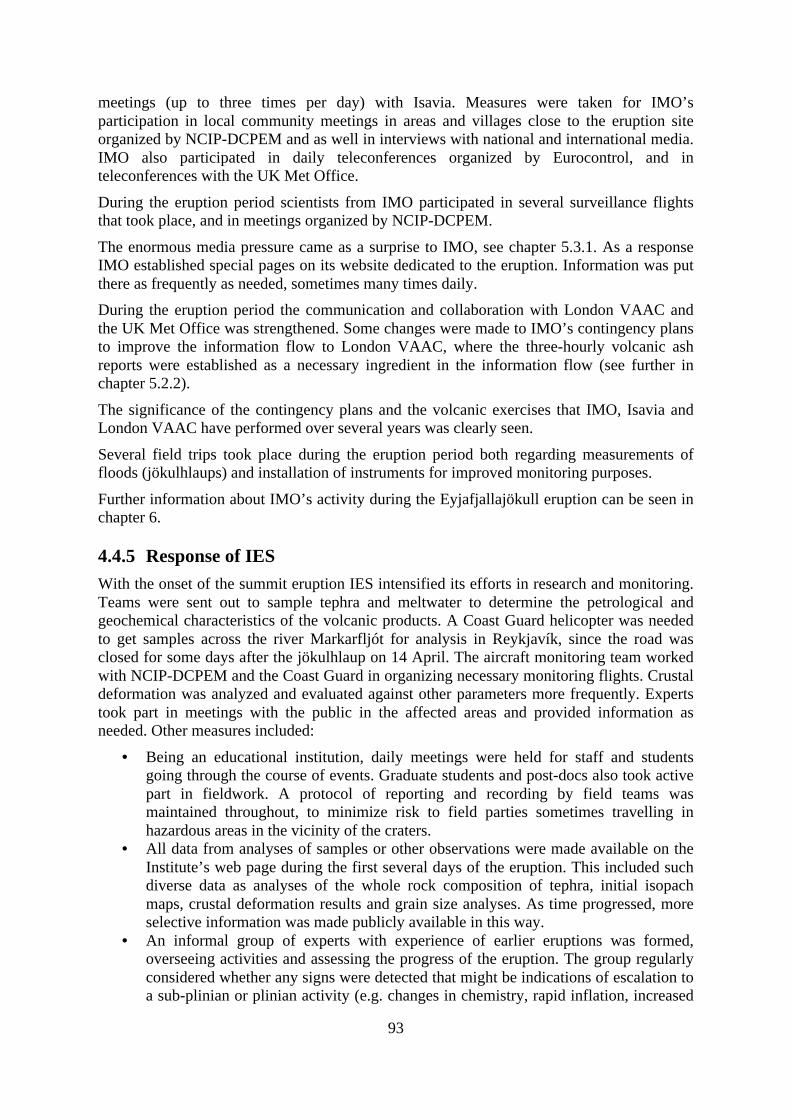
93
meetings (up to three times per day) with Isavia. Measures were taken for IMO’s participation in local community meetings in areas and villages close to the eruption site organized by NCIP-DCPEM and as well in interviews with national and international media. IMO also participated in daily teleconferences organized by Eurocontrol, and in teleconferences with the UK Met Office.
During the eruption period scientists from IMO participated in several surveillance flights that took place, and in meetings organized by NCIP-DCPEM.
The enormous media pressure came as a surprise to IMO, see chapter 5.3.1. As a response IMO established special pages on its website dedicated to the eruption. Information was put there as frequently as needed, sometimes many times daily. During the eruption period the communication and collaboration with London VAAC and the UK Met Office was strengthened. Some changes were made to IMO’s contingency plans to improve the information flow to London VAAC, where the three-hourly volcanic ash reports were established as a necessary ingredient in the information flow (see further in chapter 5.2.2).
The significance of the contingency plans and the volcanic exercises that IMO, Isavia and London VAAC have performed over several years was clearly seen.
Several field trips took place during the eruption period both regarding measurements of floods (jökulhlaups) and installation of instruments for improved monitoring purposes.
Further information about IMO’s activity during the Eyjafjallajökull eruption can be seen in chapter 6.
4.4.5 Response of IES With the onset of the summit eruption IES intensified its efforts in research and monitoring. Teams were sent out to sample tephra and meltwater to determine the petrological and geochemical characteristics of the volcanic products. A Coast Guard helicopter was needed to get samples across the river Markarfljót for analysis in Reykjavík, since the road was closed for some days after the jökulhlaup on 14 April. The aircraft monitoring team worked with NCIP-DCPEM and the Coast Guard in organizing necessary monitoring flights. Crustal deformation was analyzed and evaluated against other parameters more frequently. Experts took part in meetings with the public in the affected areas and provided information as needed. Other measures included:
• Being an educational institution, daily meetings were held for staff and students going through the course of events. Graduate students and post-docs also took active part in fieldwork. A protocol of reporting and recording by field teams was maintained throughout, to minimize risk to field parties sometimes travelling in hazardous areas in the vicinity of the craters.
• All data from analyses of samples or other observations were made available on the Institute’s web page during the first several days of the eruption. This included such diverse data as analyses of the whole rock composition of tephra, initial isopach maps, crustal deformation results and grain size analyses. As time progressed, more selective information was made publicly available in this way.
• An informal group of experts with experience of earlier eruptions was formed, overseeing activities and assessing the progress of the eruption. The group regularly considered whether any signs were detected that might be indications of escalation to a sub-plinian or plinian activity (e.g. changes in chemistry, rapid inflation, increased
94
seismicity), signs that might have called for larger scale evacuations than were in place after the first two days. None of the signals considered in this way were considered to indicate such escalation. The most critical situation was when the explosive phase of the eruption revived in early May. This evaluation process did in some cases involve informal discussions with colleagues, including foreign colleagues and seismologists at IMO.
4.4.6 Response of the NCIP-DCPEM In the late evening of 13 April seismic activity under Eyjafjallajökull led the IMO to issue a warning to NCIP-DCPEM. The Civil Protection system was activated while the situation was being evaluated. At 01:02 UTC on April 14 a decision was made to evacuate farms and other dwellings at the foot of Eyjafjallajökull as well as the immediate surroundings of the volcano. At 01:44 UTC it was decided to activate the Civil Protection system fully. At 03:50 UTC the IMO had detected changes in seismic activity beneath Eyjafjallajökull and this was interpreted as the start of a volcanic eruption, this information was conveyed to NCIP-DCPEM. Around 04:00 UTC a full evacuation according to the response plan for eruptions at Eyjafjallajökull was ordered and the Civil Protection system started working according to emergency phase procedures. The volcano was covered by clouds so there was no visibility to the higher reaches of the mountain. Visual confirmation of an eruption was not possible from the ground but around six o´clock in the morning confirmed reports were received from aircraft of an eruption plume rising above Eyjafjallajökull. In the morning of 15 April farmers were allowed to enter the evacuation to tend to animals, other traffic in the area was prohibited. During the morning melt water from the eruption started to flow down a channel on the northern flank of the volcano. In order to protect the bridge on road no. 1 at Markarfljót river the road was breached in two places. This allowed excess water to flow past the bridge.
During the first days of the eruption further short term evacuations took place in limited areas. After the initial phase of the eruption was over, the focus of civil protection turned from lifesaving evacuation to relief and reconstruction efforts. Some restrictions were imposed on travelling in the area throughout the eruption (Figure 4.33). A service center was opened in the community center Heimaland in the lowland farming area at the south-western corner of Eyjafjallajökull. The service center was run in cooperation with the local municipality. The service center at Heimaland was open from mid-April until early fall. During the first two months the service center was open daily but after that it was open twice a week. At the service center the local population could meet with representatives of local government, civil protection, insurance companies, building authorities, farmers’ extension services, health care professionals and psychologists. Relief work in the local community was directed and coordinated from the center at Heimaland. The service center also offered frequent lectures on the eruption itself and on matters related to coping with the effects of the eruption. A second service center offering similar services was operated for a few weeks during April and May in the village of Vík. Once the eruption ended in late May the focus of the work at the service center and at the NCIP-DCPEM turned from relief work to rebuilding. The brunt of that work was during the latter half of 2010 but some rebuilding is still going on in 2012. It will take a few years for the local community to recover fully from the effects of the 2010 eruption of Eyjafjallajökull.
95
Figure 4.33. Map showing areas on and around Eyjafjallajökull where travel was restricted. This map was issued on 27 April 2010 by the National Commissioner of the Icelandic Police and the Police Commissioner at Hvolsvöllur and published on the website www.almannavarnir.is.
4.5 Post-eruption phase and follow-up
Authors: GSv, SvL, GL, JKH
4.5.1 Ash fallout distribution Mapping of the 2010 Eyjafjallajökull tephra began on day two of the eruption but was mostly carried out in the summer of 2010. Field measurements in the crater area were completed in the summer of 2011. During the 39-day-long eruption tephra dispersal was mainly towards east, southeast and south. Isopach maps were constructed for airborne tephra deposited on land down to 0.01 cm thickness, the area covered is 12,000 km2 and calculated bulk volume of tephra is 140±20 million m3. The area over which tephra outside Iceland was dispersed was obtained from satellite images. The total area is about 7 million km2 and estimated bulk volume of tephra deposited outside Iceland is 130±50 million m3 (Guðmundsson et al., 2012).
4.5.2 Lahar distribution It became evident after the intensely ash-rich eruption on 17 April that ash on the southern slopes of Eyjafjallajökull was thick enough to cause lahars during rainfall. With prolonged eruption, the need for information on possible lahar hazard increased. Thickness maps made by the IES during the first days of the eruption provided information for the first hazard assessment. On-site ash thickness measurements were planned and carried out, first in the southern slopes and then around the whole volcano.
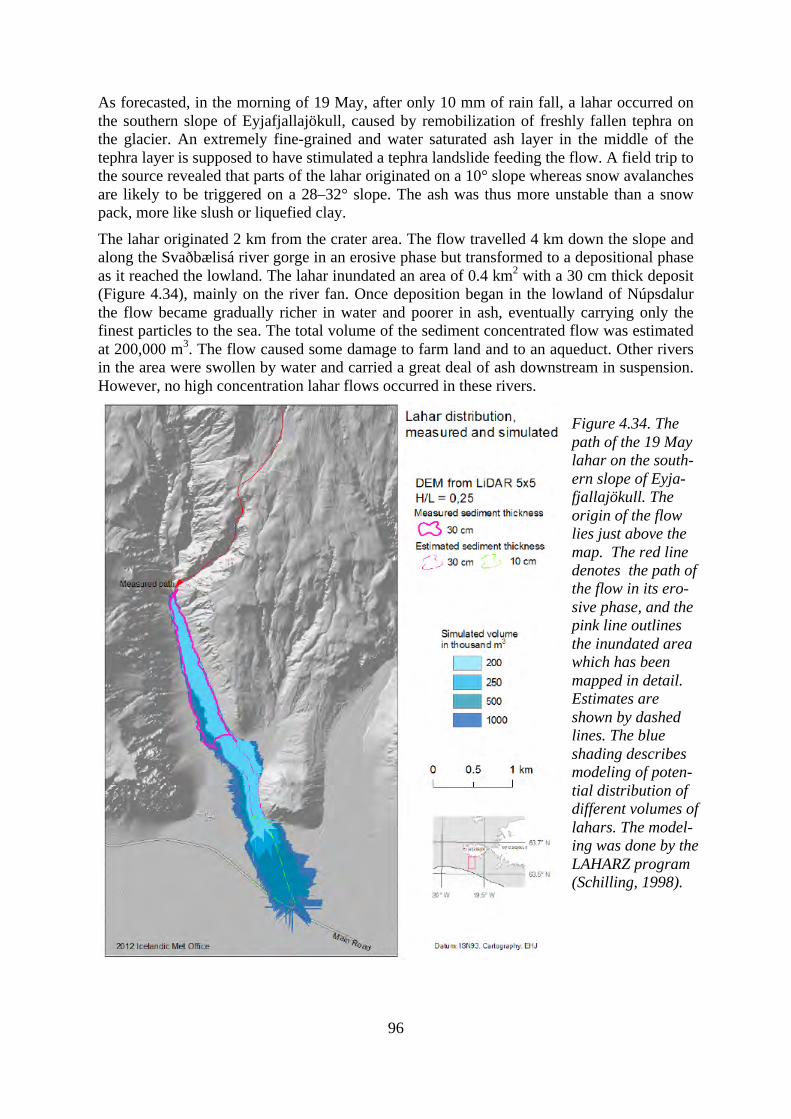
96
Figure 4.34. The path of the 19 May lahar on the south-ern slope of Eyja-fjallajökull. The origin of the flow lies just above the map. The red line denotes the path of the flow in its ero-sive phase, and the pink line outlines the inundated area which has been mapped in detail. Estimates are shown by dashed lines. The blue shading describes modeling of poten-tial distribution of different volumes of lahars. The model-ing was done by the LAHARZ program (Schilling, 1998).
As forecasted, in the morning of 19 May, after only 10 mm of rain fall, a lahar occurred on the southern slope of Eyjafjallajökull, caused by remobilization of freshly fallen tephra on the glacier. An extremely fine-grained and water saturated ash layer in the middle of the tephra layer is supposed to have stimulated a tephra landslide feeding the flow. A field trip to the source revealed that parts of the lahar originated on a 10° slope whereas snow avalanches are likely to be triggered on a 28–32° slope. The ash was thus more unstable than a snow pack, more like slush or liquefied clay.
The lahar originated 2 km from the crater area. The flow travelled 4 km down the slope and along the Svaðbælisá river gorge in an erosive phase but transformed to a depositional phase as it reached the lowland. The lahar inundated an area of 0.4 km2 with a 30 cm thick deposit (Figure 4.34), mainly on the river fan. Once deposition began in the lowland of Núpsdalur the flow became gradually richer in water and poorer in ash, eventually carrying only the finest particles to the sea. The total volume of the sediment concentrated flow was estimated at 200,000 m3. The flow caused some damage to farm land and to an aqueduct. Other rivers in the area were swollen by water and carried a great deal of ash downstream in suspension. However, no high concentration lahar flows occurred in these rivers.
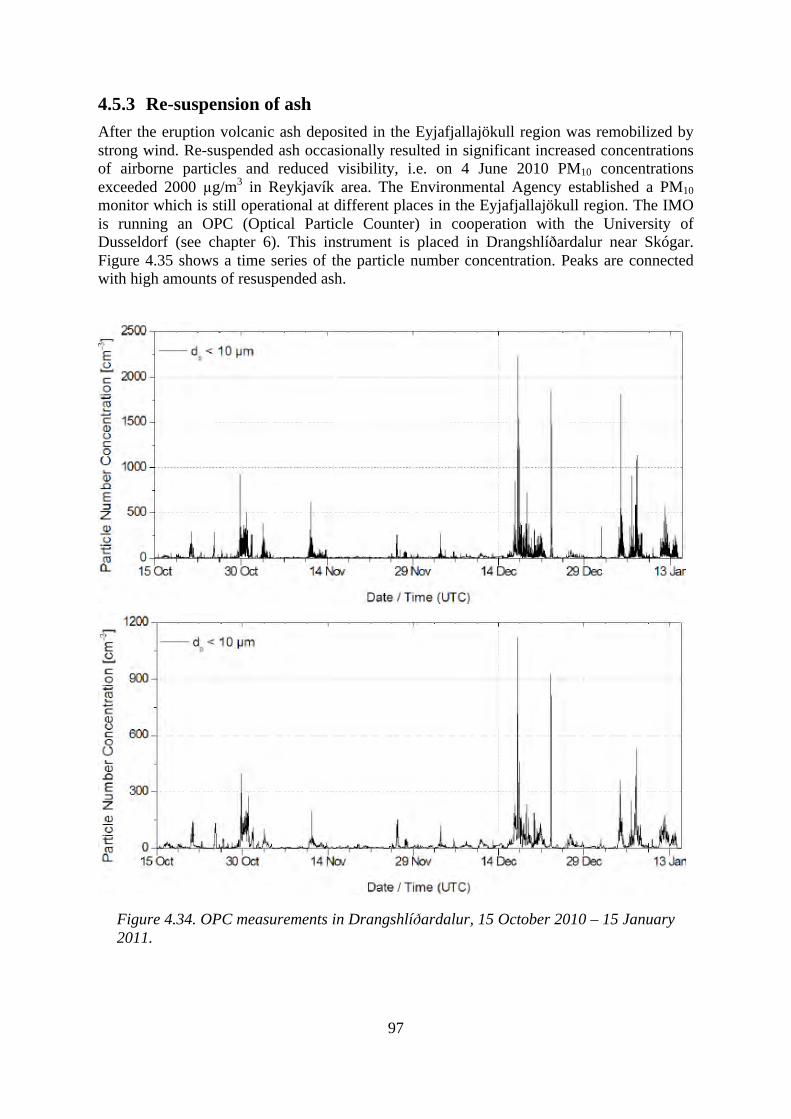
97
4.5.3 Re-suspension of ash After the eruption volcanic ash deposited in the Eyjafjallajökull region was remobilized by strong wind. Re-suspended ash occasionally resulted in significant increased concentrations of airborne particles and reduced visibility, i.e. on 4 June 2010 PM10 concentrations exceeded 2000 µg/m3 in Reykjavík area. The Environmental Agency established a PM10 monitor which is still operational at different places in the Eyjafjallajökull region. The IMO is running an OPC (Optical Particle Counter) in cooperation with the University of Dusseldorf (see chapter 6). This instrument is placed in Drangshlíðardalur near Skógar. Figure 4.35 shows a time series of the particle number concentration. Peaks are connected with high amounts of resuspended ash.
Figure 4.34. OPC measurements in Drangshlíðardalur, 15 October 2010 – 15 January 2011.
98
REFERENCES Annales Islandici 1400–1800, I,3. Reykjavík: Hið íslenzka Bókmenntafélag, 1924. Ansmann A., Tesche M., Gross S. et al. (2010). The 16 April 2010 major volcanic ash plume
over central Europe: EARLINET lidar and AERONET photometer observations at Leipzig and Munich, Germany, Geophysical Research Letters, (37), Article Number: L13810.
Arason, P. &. Bennett A. J. (2010). Charge mechanism of volcanic lightning revealed during the Eyjafjallajökull 2010 eruption. [AE33B-0278]. AGU 91 Fall Meeting, San Francisco, California, 13–17 Dec.
Arason, P., Bennett, A. J. & Burgin, L. E. (2011a). Charge mechanism of volcanic lightning revealed during the 2010 eruption of Eyjafjallajökull, J. Geophys. Res., 116, B00C03, 15 pp., doi:10.1029/2011JB008651.
Arason, P., Petersen, G. N. & Björnsson, H. (2011b). Observations of the altitude of the volcanic plume during the eruption of Eyjafjallajökull, April–May 2010, Earth Syst. Sci. Data, 3, 9-17, doi:10.5194/essd-3-9-2011.
Bennett, A., Odams, J. P., Edwards, D. & Arason, P. (2010). Monitoring of lightning from the April-May 2010 Eyjafjallajökull volcanic eruption using a very low frequency lightning location network, Environ. Res. Lett., 5, 044013, 8 pp., doi:10.1088/1748-9326/5/4/044013.
Edwards, B., Magnússon, E., Thordarson, T., Guðmundsson, M. T., Höskuldsson, A., Oddsson, B. & Haklar, J. (2012). Interactions between snow/firn/ice and lava/tephra during the 2010 Fimmvörðuháls eruption, south-central Iceland. J.Geophys. Res., 117, B04302.
Einarsson, P. & Brandsdóttir, B. (2000). Earthquakes in the Mýrdalsjökull area, Iceland, 1978–1985: Seasonal correlation and connection with volcanoes. Jökull 49, 59–73.
Einarsson, P. (1991). Earthquakes and present-day tectonism in Iceland. Tectonophysics, 189, 261-279.
Einarsson, P., Brandsdóttir, B., Guðmundsson, M. T., Björnsson, H., Grönvold, K. & Sigmundsson, F. (1997). Center of the Iceland Hotspot experiences volcanic unrest. Eos Transactions 78, 369–375.
Gröndal, G. O. & Elefsen, S. (2005). Farvegir Markarfljóts í Landeyjum og rennsli jökulhlaupsins 1822. In: Guðmundsson, M. T. & Gylfason Á. G. (eds.): Hættumat vegna eldgosa og hlaupa frá vestanverdum Mýrdalsjökli og Eyjafjallajökli. Ríkislögreglustjórinn og Háskólaútgáfan, Reykjavík. 99–104.
Gudmundsson, M. T., Thordarson, T., Höskuldsson, Á, Larsen, G., Björnsson, H., Prata, F., Oddsson, B., Magnússon, E., Högnadóttir, Þ., Petersen, G. N., Hayworth, C., Stevenson, J. & Jónsdóttir, I. (sumbitted). Ash generation and distribution from the April-May 2010 eruption of Eyjafjallajökull, Iceland. Submitted to Scientifc ReportsEPSL.
Harrison, R. G., Nicoll, K. A., Ulanowski, Z. & Mather, T. A. (2010). Self-charging of the Eyjafjallajökull volcanic ash plume, Environ. Res. Lett., 5, 024004, 4 pp., doi:10.1088/1748-9326/5/2/024004.
Höskuldsson, Á., Óskarsson, N., Pedersen, R., Grönvold, K., Vogfjörð, K. S. & Ólafsdóttir, R. (2007). The millennium eruption of Hekla in February 2000. Bull. Volcanol. 70, 169–182, doi:10.1007/s00445-007-0128-3.
Jakobsdóttir, S. (2008). Seismicity in Iceland: 1994-2007. Jökull, 58, 75-100.
99
Jakobsson, S. P. (1979). Petrology of recent basalts of the Eastern Volcanic Zone, Iceland. Acta Naturalia Islandica 26, 1–103.
Jakobsson, S. P., Jónasson, K. & Sigurðsson, I. A. (2008). The three igneous rock series of Iceland. Jökull 58, 117–138.
Jóhannesson, H. & Sæmundsson, K. (1998). Geological map of Iceland, 1: 500.000. Bedrock geology. Icelandic Institute of Natural History and Iceland Geodetic Survey, Reykjavík.
Jóhannesson, H. (1985). Um endasleppu hraunin undir Eyjafjöllum og jökla síðasta jökulskeiðs. Jökull 35, 83–95.
Jónsson, J. (1998). Eyjafjöll. Drög að jarðfræði. Rannsóknastofnunin Neðri Ás, Hveragerdi, Skýrsla 53, 111 pp. and map.
Keiding, J. K. & Sigmarsson, O. (2012). Geothermobarometry of the 2010 Eyjafjallajökull eruption: New constraints on Icelandic magma plumbing systems. J. Geophys. Res. 117, B00C09, doi:10.1029/2011JB008829.
Kjartansson, G. (1958). Endaslepp hraun undir Eyjafjöllum. Náttúrufræðingurinn 28, 127–140.
Klausturpósturinn, vol. 5. Magnús Stephensen. Viðeyjarklaustur, 1822. Klausturpósturinn, vol. 6. Magnús Stephensen. Viðeyjarklaustur, 1823. Larsen, G. (1999). Gosið í Eyjafjallajökli 1821–1823. Rannsóknaskýrsla RH-28-99.
Reykjavík: Raunvísindastofnun háskólans, 13 pp. Larsen G., Dugmore, A. J. & Newton, A. J. (1999). Geochemistry of historical-age silicic
tephras in Iceland. The Holocene 9, 463–471. Latham, J., Petersen, W. A., Deierling, W. & Christian, H. J. (2007). Field identification of a
unique globally dominant mechanism of thunderstorm electrification, Quart. J. R. Meteorol. Soc., 133, 1453-1457, doi:10.1002/qj.133.
Leadbetter, S., & Hjort, M. C. (2011). Volcanic ash hazard climatology for an eruption of Hekla volcano, Iceland, J. Volcanol. Geotherm. Res. 199, 320–241.
Loughlin, S.C. (2002). Facies analysis of proximal subglacial and proglacial volcaniclastic successions at the Eyjafjallajökull central volcano, southern Iceland. In: Smellie, J.L., Chapman, M.G. (eds.). Volcano Ice Interactions on Earth and Mars. Geol. Soc. Spec. Publ., 202, 149-178.
Óskarsson, B. V. (2009). The Skerin ridge on Eyjafjallajökull, south Iceland: Morphology and magma-ice interaction in an ice-confined silicic fissure eruption. MS Thesis, Faculty of Earth Sciences, University of Iceland, 111 pp.
Patané, D., Di Grazia, G., Cannata, A., Montalto, P. & Boschi, E. (2008). Shallow magma pathway geometry at Mt. Etna volcano, Geochem. Geophys. Geosyst., 9, Q12021, doi:10.1029/2008GC002131.
Pedersen, R. & Sigmundsson, F. (2004). InSAR based sill model links spatially offset areas of deformation and seismicity for the 1994 unrest episode at Eyjafjallajökull volcano, Iceland. Geophys. Res. Lett. 31, L14610, doi:10.1029/2004GL020368.
Pedersen, R. & Sigmundsson, F. (2006). Temporal development of the 1999 intrusive episode in the Eyjafjallajökull volcano, Iceland, derived from InSAR images. Bull. Volcanol. 68, 377–393.
Petersen, G. N. (2010). A short meteorological overview of the Eyjafjallajökull eruption 14 April – 23 May 2010, Weather 65(8), 203-207, doi:10.1002/wea.634.
Schilling, S.P. (1998). LAHARZ: GIS Programs for Automated Mapping of Lahar- inundation Hazard Zones: U.S. Geological Survey Open-File Report 98-638.
Schumann, U. et al., (2011). Airborne observations of the Eyjafjalla volcano ash cloud over Europe during air space closure in April and May 2010. Atmos. Chem. Phys., 11, 2245–2279, doi:10.5194/acp-11-2245-2011.
100
Sigmarsson, O., Vlastelic, I., Andreasen, R., Bindeman, I., Devidal, J.-L., Moune, S. et al. (2011). Remobilization of silicic intrusion by mafic magmas during the 2010 Eyjafjallajökull eruption. Solid Earth, 2, 271-281.
Sigmundsson, F., Hreinsdóttir, S., Hooper, A., Árnadóttir, Th., Pedersen, R., Roberts, M. J., et al. (2010). Intrusion triggering of the 2010 Eyjafjallajökull explosive eruption. Nature 468, 426–430.
Smith, K. T. & Haraldsson, H. (2005). A late Holocene jökulhlaup, Markarfljót Iceland: nature and impacts. Jökull 55, 75–86.
Strachan, S. (2001). A Geophysical Investigation of the Eyjafjallajökull Glaciovolcanic System, South Iceland, using radio echo sounding. University of Edinburgh, PhD thesis, 200 pp.
Sturkell, E., Einarsson, P., Sigmundsson, F., Geirsson, H., Ólasson, H., Pedersen, R. (2006) Volcano geodesy and magma dynamics in Iceland. J. Volcanol. Geoth. Res., 150, 14-34.
Torfason, H. & Jónsson, H. B. (2005). Jarðfræði við norðvestanverðan Mýrdalsjökul. In: Guðmundsson, M. T. & Á. G. Gylfason (eds.): Hættumat vegna eldgosa og hlaupa frá vestanverðum Mýrdalsjökli og Eyjafjallajökli. Reykjavík: Ríkislögreglustjóri og Háskólaútgáfan, 45–74.
Vetter, D. (1983). Ísland – ferðasaga frá 17. öld. (Iceland, a travel story from the 17th century. In Icelandic). Þorláksson H. (ed.) Safn Sögufélags 1, 150 pp.
Vogfjörð, K. S., Jakobsdóttir, S. S., Guðmundsson. G. B., Roberts, M. J., Agustsson, K., Arason, P. et al. (2005). Forecasting and monitoring a subglacial eruption in Iceland. Eos Transactions 78, 245, 248.
101
5 Analysis, discussion and main findings In this chapter the overall scientific findings are presented (chapter 5.1), operational issues and communication between institutes discussed (chapter 5.2) as well as dissemination of information and its presentation to the media (chapter 5.3), lessons learned on monitoring and operational issues analyzed (chapter 5.4), and issues related to response to future eruptions presented (chapter 5.5).
5.1 Scientific aspects: Discussion and analysis
Authors: MTG, SHj, GNP, HB, MJR, ÞA, ÁH, EK, BGÓ, EI, BB The amount of information gathered about various aspects of this eruption is greater than for any previous eruption in Iceland. In May 2012, over 120 scientific papers on the eruption are listed in Thomson Reuters ISI, published in 2010-2012. This includes almost 50 articles that have to date appeared in special issues that primarily deal with scientific aspects of this eruption (Atmospheric Chemistry and Physics, 2010, 2011, 2012; Journal of Geophysical Research, 2011, 2012 and Atmospheric Environment, 2012). It is beyond the scope of the present report to review all this material. The emphasis here is on the aspects of the eruption dealing with subsurface magma movements, magma chemistry, vent activity, distribution and quantity of tephra on land in Iceland and outside its boundaries, and local hazards. These were the scientific aspects principally dealt with by IES and IMO scientists in collaboration with various foreign institutes and colleagues. First, a general overview of the eruption and its setting is presented, followed by more detailed issues.
5.1.1 Overview The eruption of Eyjafjallajökull was unusual among Icelandic eruptions (Table 5.1). Firstly, it produced ash almost continuously for 39 days (14 April – 22 May). This is longer than seen in most eruptions in Iceland. Typically, the eruptions are relatively brief but intense comprising a main sustained subplinian – plinian explosion lasting hours to days (e.g. Sparks et al., 1997) and followed by a rapid decline in activity (e.g. Grímsvötn 2011). Such eruptions have a relatively high mass eruption rate. Eyjafjallajökull was a long-lived eruption characterized by repetitive transient explosions at relatively low mass eruption rates. The explosions were initially caused by magma –water interaction, but later also comprised strombolian and vulcanian style explosions repeated on a time-scale of seconds to tens of seconds.
The favored explanation for the prolonged and varying activity is the sustained inflow of hot basaltic magma into a body of silicic magma, residing at 3–5.5 km depth below the summit (Sigmundsson et al., 2010, Keiding & Sigmarsson, 2012, chapter 5.1.2). Chemical and petrographic analyses show that the erupted magma was a mix between primitive basaltic melt and a more evolved one. During the first three weeks (Phases I and II) the whole rock composition of the erupted magma was trachyandesitic (benmoreitic) with a SiO2 content of about 60%. During the second explosive phase (Phase III) in May the erupted magma changed composition to slightly more evolved trachyte (SiO2 content 63-65%) indicating more mixing of the two magma components under the volcano (Sigmarsson et al., 2012, Guðmundsson et al., 2012).
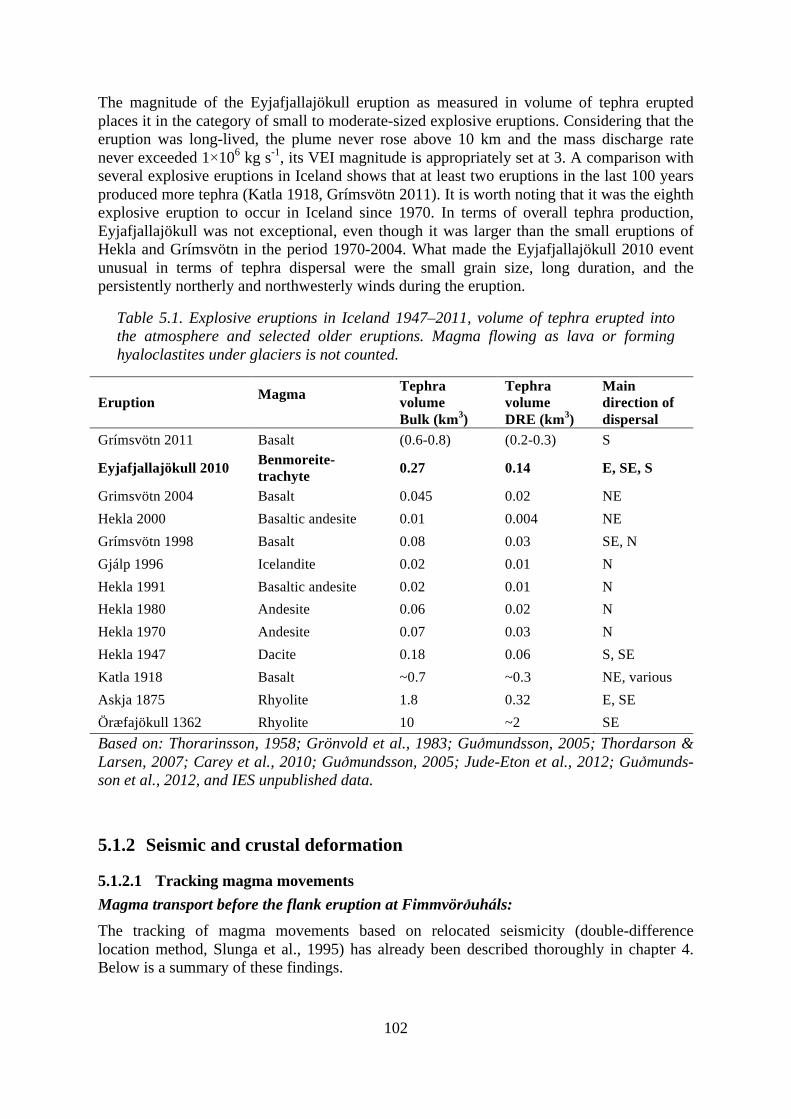
102
The magnitude of the Eyjafjallajökull eruption as measured in volume of tephra erupted places it in the category of small to moderate-sized explosive eruptions. Considering that the eruption was long-lived, the plume never rose above 10 km and the mass discharge rate never exceeded 1×10⁶ kg s-1, its VEI magnitude is appropriately set at 3. A comparison with several explosive eruptions in Iceland shows that at least two eruptions in the last 100 years produced more tephra (Katla 1918, Grímsvötn 2011). It is worth noting that it was the eighth explosive eruption to occur in Iceland since 1970. In terms of overall tephra production, Eyjafjallajökull was not exceptional, even though it was larger than the small eruptions of Hekla and Grímsvötn in the period 1970-2004. What made the Eyjafjallajökull 2010 event unusual in terms of tephra dispersal were the small grain size, long duration, and the persistently northerly and northwesterly winds during the eruption.
Table 5.1. Explosive eruptions in Iceland 1947–2011, volume of tephra erupted into the atmosphere and selected older eruptions. Magma flowing as lava or forming hyaloclastites under glaciers is not counted.
Eruption Magma
Tephra volume Bulk (km3)
Tephra volume DRE (km3)
Main direction of dispersal
Grímsvötn 2011 Basalt (0.6-0.8) (0.2-0.3) S
Eyjafjallajökull 2010 Benmoreite-trachyte 0.27 0.14 E, SE, S
Grimsvötn 2004 Basalt 0.045 0.02 NE Hekla 2000 Basaltic andesite 0.01 0.004 NE Grímsvötn 1998 Basalt 0.08 0.03 SE, N Gjálp 1996 Icelandite 0.02 0.01 N Hekla 1991 Basaltic andesite 0.02 0.01 N Hekla 1980 Andesite 0.06 0.02 N Hekla 1970 Andesite 0.07 0.03 N Hekla 1947 Dacite 0.18 0.06 S, SE Katla 1918 Basalt ~0.7 ~0.3 NE, various Askja 1875 Rhyolite 1.8 0.32 E, SE Öræfajökull 1362 Rhyolite 10 ~2 SE Based on: Thorarinsson, 1958; Grönvold et al., 1983; Guðmundsson, 2005; Thordarson & Larsen, 2007; Carey et al., 2010; Guðmundsson, 2005; Jude-Eton et al., 2012; Guðmunds-son et al., 2012, and IES unpublished data.
5.1.2 Seismic and crustal deformation
5.1.2.1 Tracking magma movements Magma transport before the flank eruption at Fimmvörðuháls: The tracking of magma movements based on relocated seismicity (double-difference location method, Slunga et al., 1995) has already been described thoroughly in chapter 4. Below is a summary of these findings.
103
The several deep earthquakes detected near the crust mantle-boundary (17–29 km depth) in late March and April 2009 suggest that magmatic transport from the mantle into the crust had started a year before the eruption. The seismic swarm (~200 events) that occurred in the summer of 2009 and the concurrent ~15 mm southward movement of the GPS-station THEY (located about 15 km south of the volcano's summit) further suggest that a small intrusion formed in the mid to upper crust southeast of the summit between May/June and August 2009. This intrusion was not captured by InSAR images.
Seismic activity and crustal deformation increased again in late December 2009, and until 20 February 2010 most of the seismicity was concentrated between 9 and 12 km depth. This cluster probably shows a part of the magma upflow channel that became active again late in December. The westward movement of the GPS-station HAMR (located on the western flank of Eyjafjallajökull volcano, 15 km from the summit) and southward movement of THEY, also indicated inflation between December 2009 and 20 February 2010. We therefore suggest that magma was being transported from a deep source into the mid-crust below the volcano during this period.
Beginning on 20 February 2010, HAMR and other more distant GPS-stations moved towards the volcano. Furthermore, the seismic activity partly migrated southeastward from the suggested main upflow channel, following an additional westward movement of THEY, which indicated a series of intrusions beneath the southeastern flank between 4 and 8 km depth. The outline of the sill modeled by Sigmundsson et al. (2010) at 4–5.9 km depth partly overlaps the outline of the intrusion area indicated by the earthquake locations.
The abrupt change in seismic activity detected 3–4 March 2010 suggests that magma flow towards the south-eastern intrusions stopped and instead concentrated eastwards, towards Fimmvörðuháls. This change in behavior was also observed in GPS movements most prominently at the GPS site STEI/STE2, located a few km north of the summit, which rapidly started moving westward and northward. The northward movement was irregular and showed rapid, irregular oscillations. Other GPS stations started moving in different directions at increased velocity, indicating migration of the intrusive activity. The seismicity migrated further eastwards until mid-March.
The relocated earthquakes outline an approximately 7 km long, NW-dipping dyke, extending from 10.5 km depth at the western end to 7.5 km depth at its eastern end (Figure 5.1). Seismic clusters located just south and north of the dyke's eastern end on 15 March suggest that magma forced its way horizontally from the dyke before it started to break its way towards the surface. The partly upward migration of the seismicity on 17 March shows where the magma started to ascend from the dyke towards the surface. The earthquake locations 17–25 March outline a rather narrow, vertical magma pipe, located beneath the eastern part of the ice cap (Figure 5.1). Average ascent rate is 1.6 km per day between 17 and 20 March. The pipe bends eastwards at shallow depth (~2.5 km depth) and thus the magma probably travelled a horizontal distance of approximately 4.5 km in the uppermost 2–3 km towards the eruption site, outside the ice cap. The few earthquakes located near the eruption site early on 20 March suggest that magma had already reached the surface several hours before the eruption broke out. After the flank eruption broke out, insignificant movements were observed at GPS sites indicating equilibrium between the magma erupting at the surface and inflow from depth. The origin of the melt at the crust-mantle boundary and the progressive transport through the 7.5-10.5 km deep dipping dyke in March is in agreement with the findings of Sigmundsson et al. (2010), which show that the flank eruption produced olivine-basalt magma of deep origin, with petrology indicating a short residence in the crust above 13 km depth.
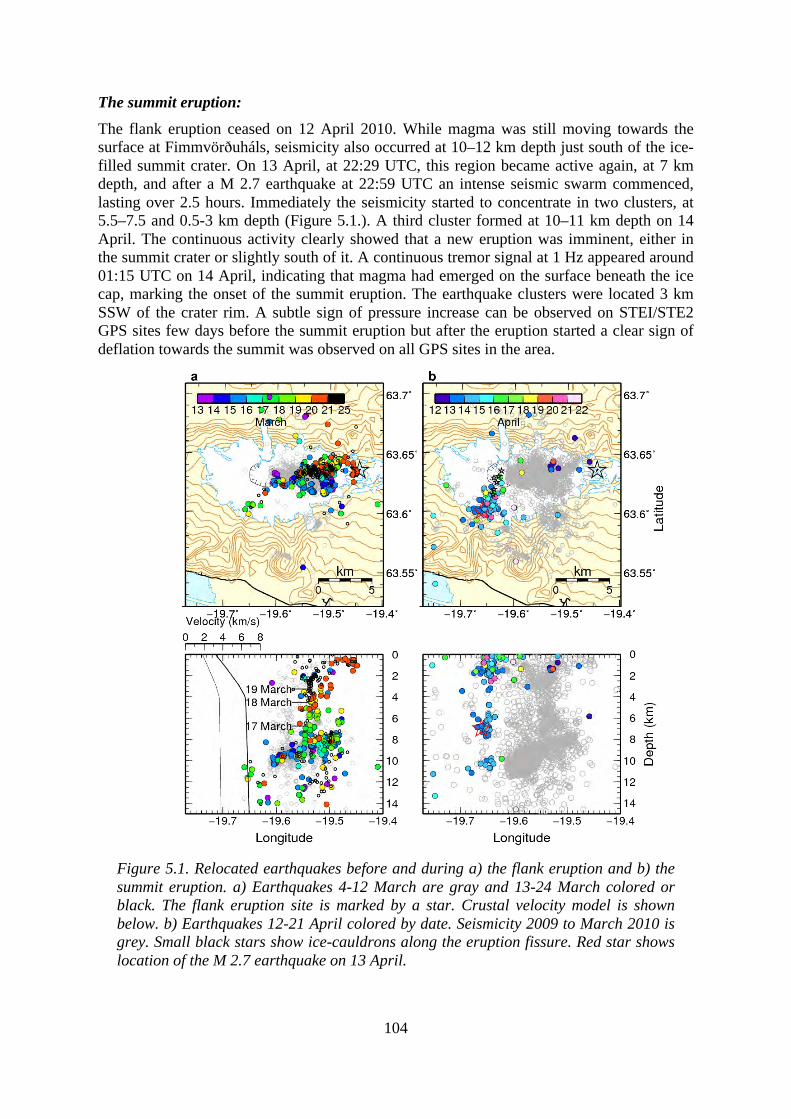
104
The summit eruption: The flank eruption ceased on 12 April 2010. While magma was still moving towards the surface at Fimmvörðuháls, seismicity also occurred at 10–12 km depth just south of the ice-filled summit crater. On 13 April, at 22:29 UTC, this region became active again, at 7 km depth, and after a M 2.7 earthquake at 22:59 UTC an intense seismic swarm commenced, lasting over 2.5 hours. Immediately the seismicity started to concentrate in two clusters, at 5.5–7.5 and 0.5-3 km depth (Figure 5.1.). A third cluster formed at 10–11 km depth on 14 April. The continuous activity clearly showed that a new eruption was imminent, either in the summit crater or slightly south of it. A continuous tremor signal at 1 Hz appeared around 01:15 UTC on 14 April, indicating that magma had emerged on the surface beneath the ice cap, marking the onset of the summit eruption. The earthquake clusters were located 3 km SSW of the crater rim. A subtle sign of pressure increase can be observed on STEI/STE2 GPS sites few days before the summit eruption but after the eruption started a clear sign of deflation towards the summit was observed on all GPS sites in the area.
Figure 5.1. Relocated earthquakes before and during a) the flank eruption and b) the summit eruption. a) Earthquakes 4-12 March are gray and 13-24 March colored or black. The flank eruption site is marked by a star. Crustal velocity model is shown below. b) Earthquakes 12-21 April colored by date. Seismicity 2009 to March 2010 is grey. Small black stars show ice-cauldrons along the eruption fissure. Red star shows location of the M 2.7 earthquake on 13 April.
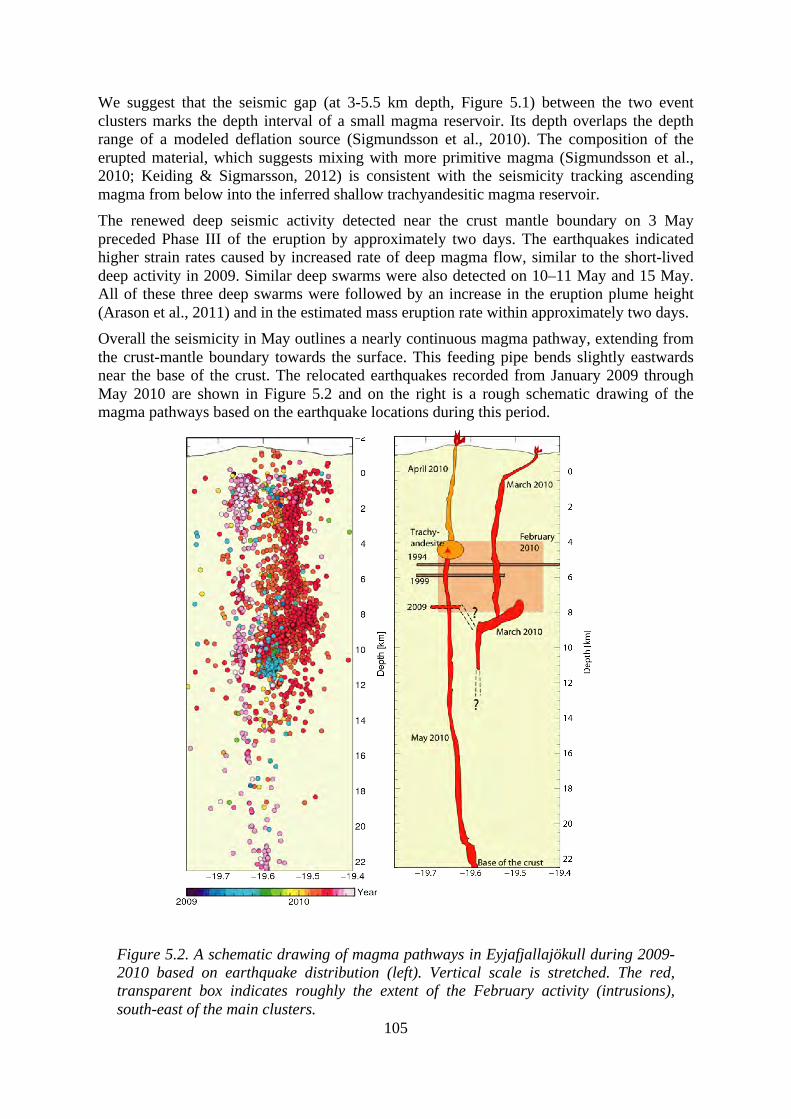
105
We suggest that the seismic gap (at 3-5.5 km depth, Figure 5.1) between the two event clusters marks the depth interval of a small magma reservoir. Its depth overlaps the depth range of a modeled deflation source (Sigmundsson et al., 2010). The composition of the erupted material, which suggests mixing with more primitive magma (Sigmundsson et al., 2010; Keiding & Sigmarsson, 2012) is consistent with the seismicity tracking ascending magma from below into the inferred shallow trachyandesitic magma reservoir. The renewed deep seismic activity detected near the crust mantle boundary on 3 May preceded Phase III of the eruption by approximately two days. The earthquakes indicated higher strain rates caused by increased rate of deep magma flow, similar to the short-lived deep activity in 2009. Similar deep swarms were also detected on 10–11 May and 15 May. All of these three deep swarms were followed by an increase in the eruption plume height (Arason et al., 2011) and in the estimated mass eruption rate within approximately two days. Overall the seismicity in May outlines a nearly continuous magma pathway, extending from the crust-mantle boundary towards the surface. This feeding pipe bends slightly eastwards near the base of the crust. The relocated earthquakes recorded from January 2009 through May 2010 are shown in Figure 5.2 and on the right is a rough schematic drawing of the magma pathways based on the earthquake locations during this period.
Figure 5.2. A schematic drawing of magma pathways in Eyjafjallajökull during 2009-2010 based on earthquake distribution (left). Vertical scale is stretched. The red, transparent box indicates roughly the extent of the February activity (intrusions), south-east of the main clusters.
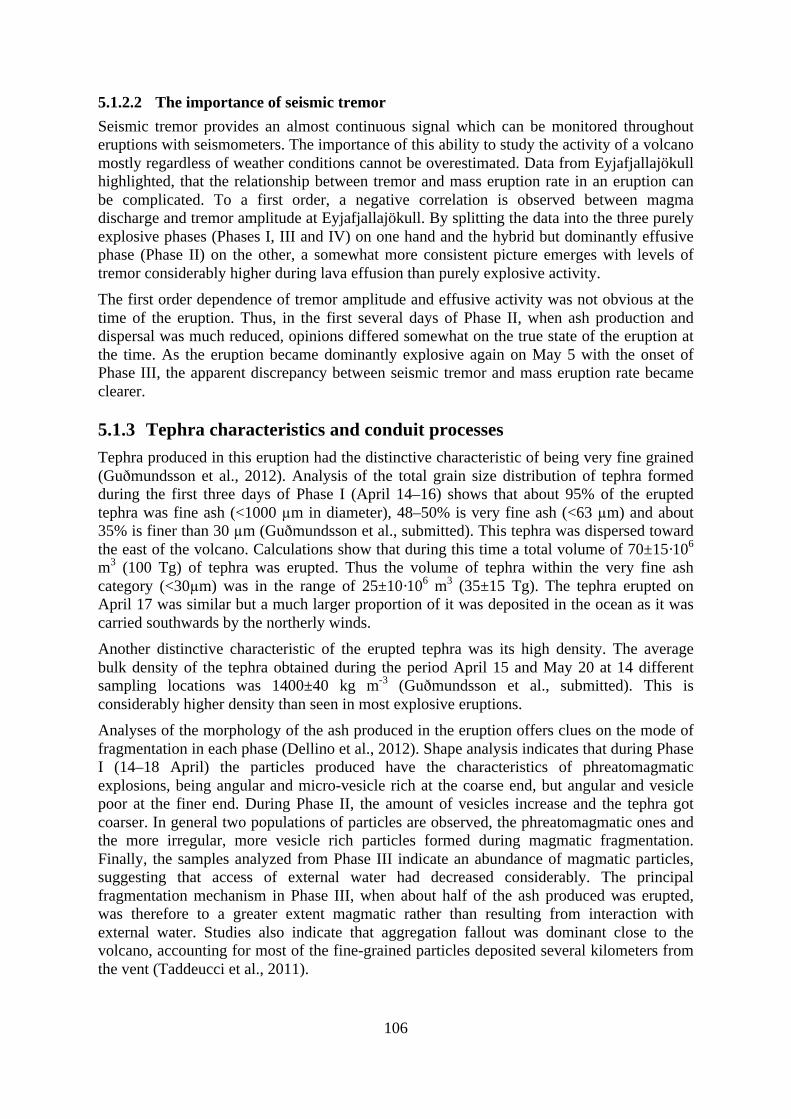
106
5.1.2.2 The importance of seismic tremor Seismic tremor provides an almost continuous signal which can be monitored throughout eruptions with seismometers. The importance of this ability to study the activity of a volcano mostly regardless of weather conditions cannot be overestimated. Data from Eyjafjallajökull highlighted, that the relationship between tremor and mass eruption rate in an eruption can be complicated. To a first order, a negative correlation is observed between magma discharge and tremor amplitude at Eyjafjallajökull. By splitting the data into the three purely explosive phases (Phases I, III and IV) on one hand and the hybrid but dominantly effusive phase (Phase II) on the other, a somewhat more consistent picture emerges with levels of tremor considerably higher during lava effusion than purely explosive activity. The first order dependence of tremor amplitude and effusive activity was not obvious at the time of the eruption. Thus, in the first several days of Phase II, when ash production and dispersal was much reduced, opinions differed somewhat on the true state of the eruption at the time. As the eruption became dominantly explosive again on May 5 with the onset of Phase III, the apparent discrepancy between seismic tremor and mass eruption rate became clearer.
5.1.3 Tephra characteristics and conduit processes Tephra produced in this eruption had the distinctive characteristic of being very fine grained (Guðmundsson et al., 2012). Analysis of the total grain size distribution of tephra formed during the first three days of Phase I (April 14–16) shows that about 95% of the erupted tephra was fine ash (<1000 µm in diameter), 48–50% is very fine ash (<63 µm) and about 35% is finer than 30 µm (Guðmundsson et al., submitted). This tephra was dispersed toward the east of the volcano. Calculations show that during this time a total volume of 70±15·106 m3 (100 Tg) of tephra was erupted. Thus the volume of tephra within the very fine ash category (<30µm) was in the range of 25±10·106 m3 (35±15 Tg). The tephra erupted on April 17 was similar but a much larger proportion of it was deposited in the ocean as it was carried southwards by the northerly winds. Another distinctive characteristic of the erupted tephra was its high density. The average bulk density of the tephra obtained during the period April 15 and May 20 at 14 different sampling locations was 1400±40 kg m-3 (Guðmundsson et al., submitted). This is considerably higher density than seen in most explosive eruptions. Analyses of the morphology of the ash produced in the eruption offers clues on the mode of fragmentation in each phase (Dellino et al., 2012). Shape analysis indicates that during Phase I (14–18 April) the particles produced have the characteristics of phreatomagmatic explosions, being angular and micro-vesicle rich at the coarse end, but angular and vesicle poor at the finer end. During Phase II, the amount of vesicles increase and the tephra got coarser. In general two populations of particles are observed, the phreatomagmatic ones and the more irregular, more vesicle rich particles formed during magmatic fragmentation. Finally, the samples analyzed from Phase III indicate an abundance of magmatic particles, suggesting that access of external water had decreased considerably. The principal fragmentation mechanism in Phase III, when about half of the ash produced was erupted, was therefore to a greater extent magmatic rather than resulting from interaction with external water. Studies also indicate that aggregation fallout was dominant close to the volcano, accounting for most of the fine-grained particles deposited several kilometers from the vent (Taddeucci et al., 2011).
107
On 4-8 May, tests with a Pludix radar were conducted (Bonadonna et al., 2012). The Pludix can estimate the grain size distribution of the coarse part of the falling tephra (>300 µm). The experiments showed that Pludix radar is a powerful tool for analyzing grain size composition of the plume in the near vent area. However the it failed to detect the smallest particles.
5.1.4 Plume observations
5.1.4.1 Radar at Keflavík International Airport Characteristics, accuracy, limitations, use of data The weather radar at Keflavík International Airport in southwest Iceland was the only operational weather radar in Iceland during the eruption. The radar images were obtained as the radar beam circles from an initial angle of 0.5°, increasing the elevation angle at the end of each circle to a maximum angle of 40° for reflectivity scans. However, due to orographic blocking the lowest part of the lowest beam did not reach Eyjafjallajökull. For a list of elevation angles applied see Table 3.3. The echo top, or maximum altitude of reflectivity, shows the highest vertical level from which detectable radar echoes are measured. The echo top altitude not only depends on the elevation angle and the range but also on the observed reflectivity values. Furthermore, the greater the range, the larger the interval between the elevation angle levels, resulting in larger uncertainties in the echo top height estimates. Figure 5.3 shows the seven lowest elevation angles of the current scanning strategy and their height above sea level for a distance of up to 200 km. The half-power beam width of 0.9° results in an overlapping of the beams for the three lowest elevation angles, 0.5°–1.3°.
Figure 5.3. Left: A range-height diagram of altitude (km a.s.l.) as a function of distance from the Keflavík radar (km) for the lowest elevation angles (0.5–6.0°) of the scanning strategy during the eruption. The distance to Eyjafjallajökull is marked with a triangle and the lowest detectable elevation angle due to the orographic blocking of Brennisteinsfjöll mountain range (smaller triangle) with a dashed line. Right: A histogram of plume-top altitudes estimated by the radar (from Arason et al., 2011).
The echo top heights were available 45% of the time of the eruption. There were four reasons for non-availability: (i) The altitude of the volcanic plume was too low to be
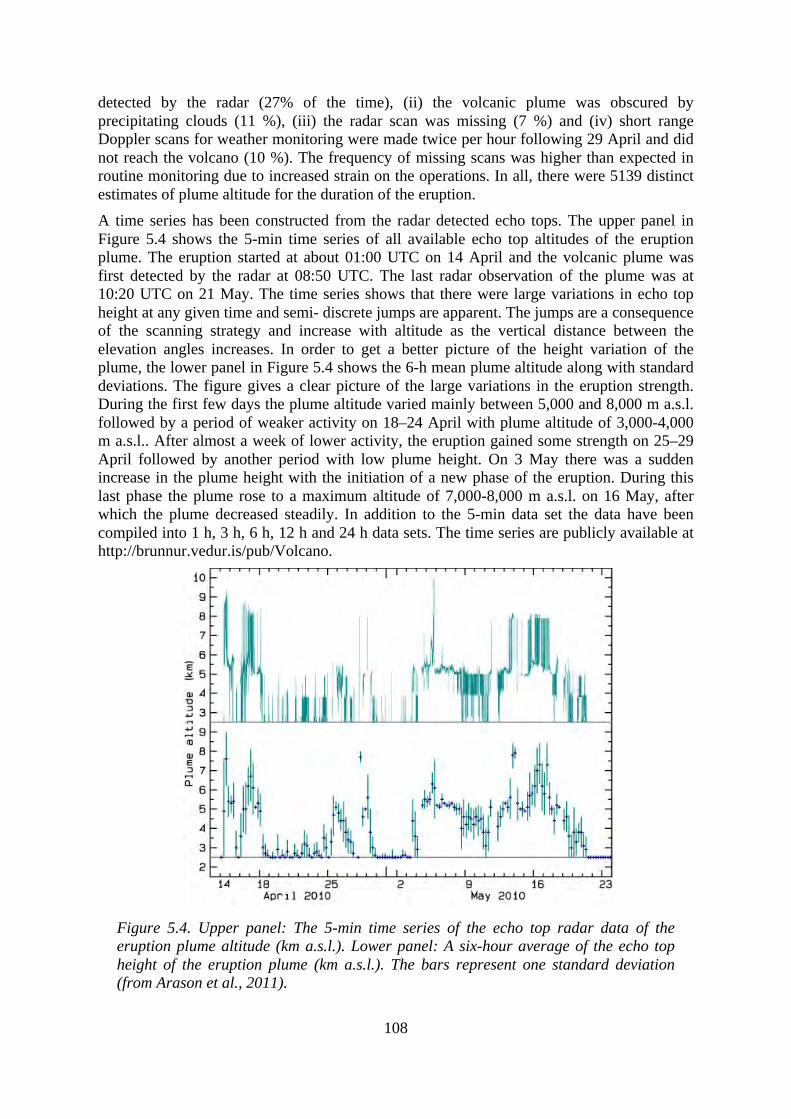
108
detected by the radar (27% of the time), (ii) the volcanic plume was obscured by precipitating clouds (11 %), (iii) the radar scan was missing (7 %) and (iv) short range Doppler scans for weather monitoring were made twice per hour following 29 April and did not reach the volcano (10 %). The frequency of missing scans was higher than expected in routine monitoring due to increased strain on the operations. In all, there were 5139 distinct estimates of plume altitude for the duration of the eruption. A time series has been constructed from the radar detected echo tops. The upper panel in Figure 5.4 shows the 5-min time series of all available echo top altitudes of the eruption plume. The eruption started at about 01:00 UTC on 14 April and the volcanic plume was first detected by the radar at 08:50 UTC. The last radar observation of the plume was at 10:20 UTC on 21 May. The time series shows that there were large variations in echo top height at any given time and semi- discrete jumps are apparent. The jumps are a consequence of the scanning strategy and increase with altitude as the vertical distance between the elevation angles increases. In order to get a better picture of the height variation of the plume, the lower panel in Figure 5.4 shows the 6-h mean plume altitude along with standard deviations. The figure gives a clear picture of the large variations in the eruption strength. During the first few days the plume altitude varied mainly between 5,000 and 8,000 m a.s.l. followed by a period of weaker activity on 18–24 April with plume altitude of 3,000-4,000 m a.s.l.. After almost a week of lower activity, the eruption gained some strength on 25–29 April followed by another period with low plume height. On 3 May there was a sudden increase in the plume height with the initiation of a new phase of the eruption. During this last phase the plume rose to a maximum altitude of 7,000-8,000 m a.s.l. on 16 May, after which the plume decreased steadily. In addition to the 5-min data set the data have been compiled into 1 h, 3 h, 6 h, 12 h and 24 h data sets. The time series are publicly available at http://brunnur.vedur.is/pub/Volcano.
Figure 5.4. Upper panel: The 5-min time series of the echo top radar data of the eruption plume altitude (km a.s.l.). Lower panel: A six-hour average of the echo top height of the eruption plume (km a.s.l.). The bars represent one standard deviation (from Arason et al., 2011).
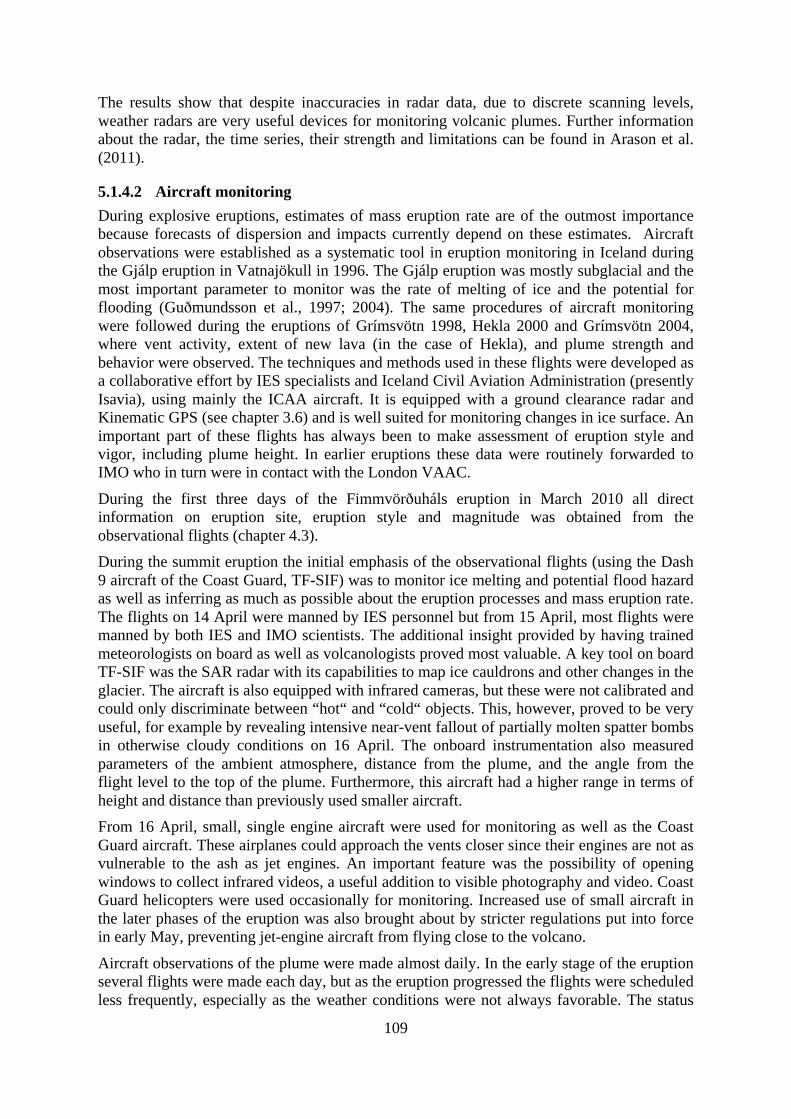
109
The results show that despite inaccuracies in radar data, due to discrete scanning levels, weather radars are very useful devices for monitoring volcanic plumes. Further information about the radar, the time series, their strength and limitations can be found in Arason et al. (2011).
5.1.4.2 Aircraft monitoring During explosive eruptions, estimates of mass eruption rate are of the outmost importance because forecasts of dispersion and impacts currently depend on these estimates. Aircraft observations were established as a systematic tool in eruption monitoring in Iceland during the Gjálp eruption in Vatnajökull in 1996. The Gjálp eruption was mostly subglacial and the most important parameter to monitor was the rate of melting of ice and the potential for flooding (Guðmundsson et al., 1997; 2004). The same procedures of aircraft monitoring were followed during the eruptions of Grímsvötn 1998, Hekla 2000 and Grímsvötn 2004, where vent activity, extent of new lava (in the case of Hekla), and plume strength and behavior were observed. The techniques and methods used in these flights were developed as a collaborative effort by IES specialists and Iceland Civil Aviation Administration (presently Isavia), using mainly the ICAA aircraft. It is equipped with a ground clearance radar and Kinematic GPS (see chapter 3.6) and is well suited for monitoring changes in ice surface. An important part of these flights has always been to make assessment of eruption style and vigor, including plume height. In earlier eruptions these data were routinely forwarded to IMO who in turn were in contact with the London VAAC.
During the first three days of the Fimmvörðuháls eruption in March 2010 all direct information on eruption site, eruption style and magnitude was obtained from the observational flights (chapter 4.3). During the summit eruption the initial emphasis of the observational flights (using the Dash 9 aircraft of the Coast Guard, TF-SIF) was to monitor ice melting and potential flood hazard as well as inferring as much as possible about the eruption processes and mass eruption rate. The flights on 14 April were manned by IES personnel but from 15 April, most flights were manned by both IES and IMO scientists. The additional insight provided by having trained meteorologists on board as well as volcanologists proved most valuable. A key tool on board TF-SIF was the SAR radar with its capabilities to map ice cauldrons and other changes in the glacier. The aircraft is also equipped with infrared cameras, but these were not calibrated and could only discriminate between “hot“ and “cold“ objects. This, however, proved to be very useful, for example by revealing intensive near-vent fallout of partially molten spatter bombs in otherwise cloudy conditions on 16 April. The onboard instrumentation also measured parameters of the ambient atmosphere, distance from the plume, and the angle from the flight level to the top of the plume. Furthermore, this aircraft had a higher range in terms of height and distance than previously used smaller aircraft. From 16 April, small, single engine aircraft were used for monitoring as well as the Coast Guard aircraft. These airplanes could approach the vents closer since their engines are not as vulnerable to the ash as jet engines. An important feature was the possibility of opening windows to collect infrared videos, a useful addition to visible photography and video. Coast Guard helicopters were used occasionally for monitoring. Increased use of small aircraft in the later phases of the eruption was also brought about by stricter regulations put into force in early May, preventing jet-engine aircraft from flying close to the volcano.
Aircraft observations of the plume were made almost daily. In the early stage of the eruption several flights were made each day, but as the eruption progressed the flights were scheduled less frequently, especially as the weather conditions were not always favorable. The status
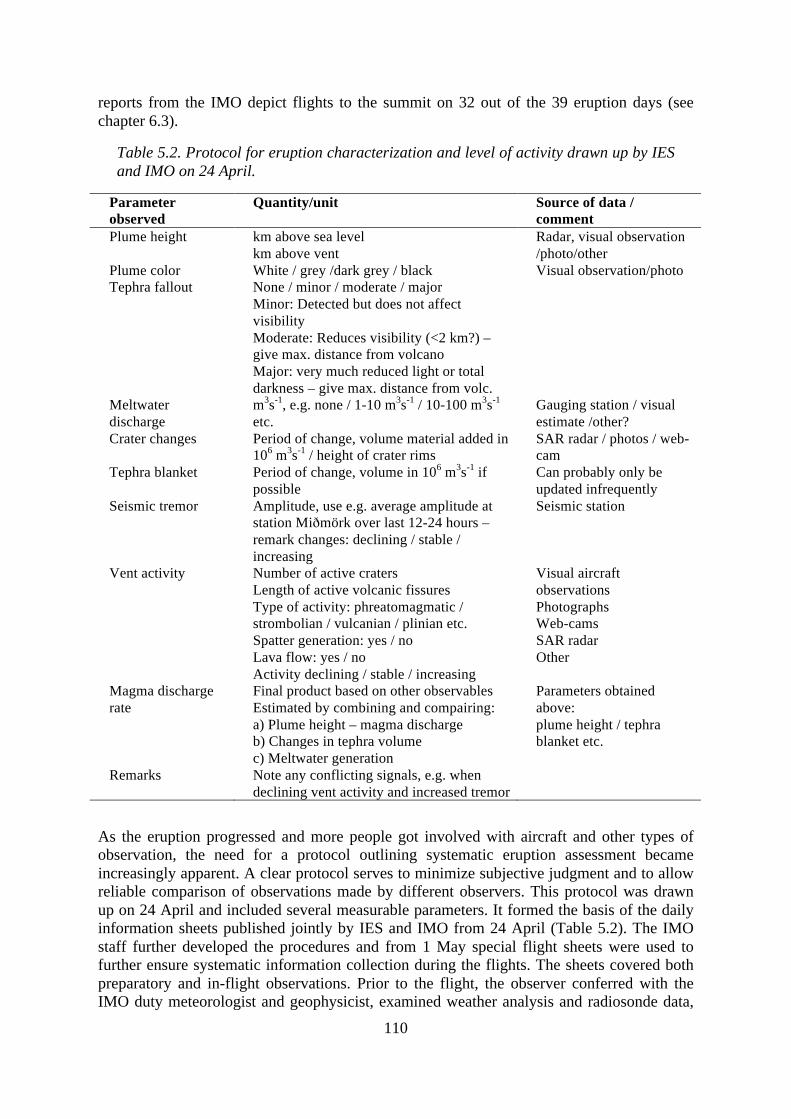
110
reports from the IMO depict flights to the summit on 32 out of the 39 eruption days (see chapter 6.3).
Table 5.2. Protocol for eruption characterization and level of activity drawn up by IES and IMO on 24 April.
Parameter observed
Quantity/unit Source of data / comment
Plume height km above sea level km above vent
Radar, visual observation /photo/other
Plume color White / grey /dark grey / black Visual observation/photo Tephra fallout None / minor / moderate / major
Minor: Detected but does not affect visibility Moderate: Reduces visibility (<2 km?) – give max. distance from volcano Major: very much reduced light or total darkness – give max. distance from volc.
Meltwater discharge
m3s-1, e.g. none / 1-10 m3s-1 / 10-100 m3s-1 etc.
Gauging station / visual estimate /other?
Crater changes Period of change, volume material added in 106 m3s-1 / height of crater rims
SAR radar / photos / web-cam
Tephra blanket Period of change, volume in 106 m3s-1 if possible
Can probably only be updated infrequently
Seismic tremor Amplitude, use e.g. average amplitude at station Miðmörk over last 12-24 hours – remark changes: declining / stable / increasing
Seismic station
Vent activity Number of active craters Length of active volcanic fissures Type of activity: phreatomagmatic / strombolian / vulcanian / plinian etc. Spatter generation: yes / no Lava flow: yes / no Activity declining / stable / increasing
Visual aircraft observations Photographs Web-cams SAR radar Other
Magma discharge rate
Final product based on other observables Estimated by combining and compairing: a) Plume height – magma discharge b) Changes in tephra volume c) Meltwater generation
Parameters obtained above: plume height / tephra blanket etc.
Remarks Note any conflicting signals, e.g. when declining vent activity and increased tremor
As the eruption progressed and more people got involved with aircraft and other types of observation, the need for a protocol outlining systematic eruption assessment became increasingly apparent. A clear protocol serves to minimize subjective judgment and to allow reliable comparison of observations made by different observers. This protocol was drawn up on 24 April and included several measurable parameters. It formed the basis of the daily information sheets published jointly by IES and IMO from 24 April (Table 5.2). The IMO staff further developed the procedures and from 1 May special flight sheets were used to further ensure systematic information collection during the flights. The sheets covered both preparatory and in-flight observations. Prior to the flight, the observer conferred with the IMO duty meteorologist and geophysicist, examined weather analysis and radiosonde data,
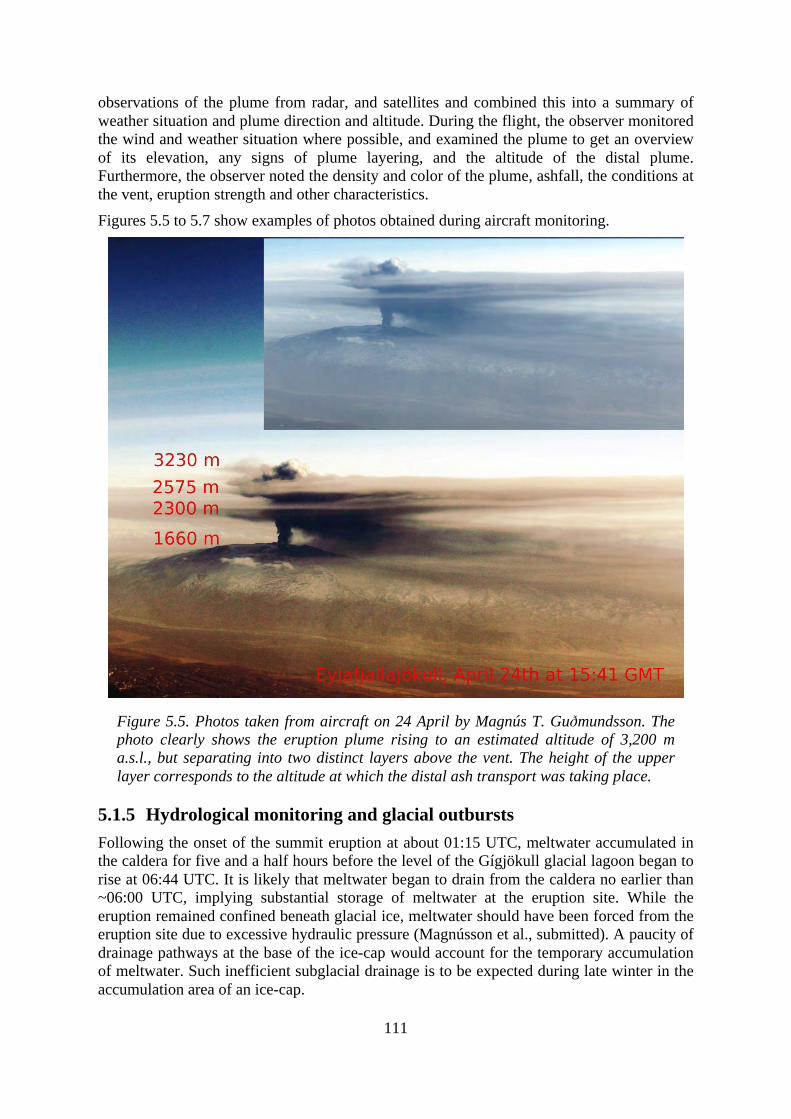
111
observations of the plume from radar, and satellites and combined this into a summary of weather situation and plume direction and altitude. During the flight, the observer monitored the wind and weather situation where possible, and examined the plume to get an overview of its elevation, any signs of plume layering, and the altitude of the distal plume. Furthermore, the observer noted the density and color of the plume, ashfall, the conditions at the vent, eruption strength and other characteristics. Figures 5.5 to 5.7 show examples of photos obtained during aircraft monitoring.
Figure 5.5. Photos taken from aircraft on 24 April by Magnús T. Guðmundsson. The photo clearly shows the eruption plume rising to an estimated altitude of 3,200 m a.s.l., but separating into two distinct layers above the vent. The height of the upper layer corresponds to the altitude at which the distal ash transport was taking place.
5.1.5 Hydrological monitoring and glacial outbursts Following the onset of the summit eruption at about 01:15 UTC, meltwater accumulated in the caldera for five and a half hours before the level of the Gígjökull glacial lagoon began to rise at 06:44 UTC. It is likely that meltwater began to drain from the caldera no earlier than ~06:00 UTC, implying substantial storage of meltwater at the eruption site. While the eruption remained confined beneath glacial ice, meltwater should have been forced from the eruption site due to excessive hydraulic pressure (Magnússon et al., submitted). A paucity of drainage pathways at the base of the ice-cap would account for the temporary accumulation of meltwater. Such inefficient subglacial drainage is to be expected during late winter in the accumulation area of an ice-cap.
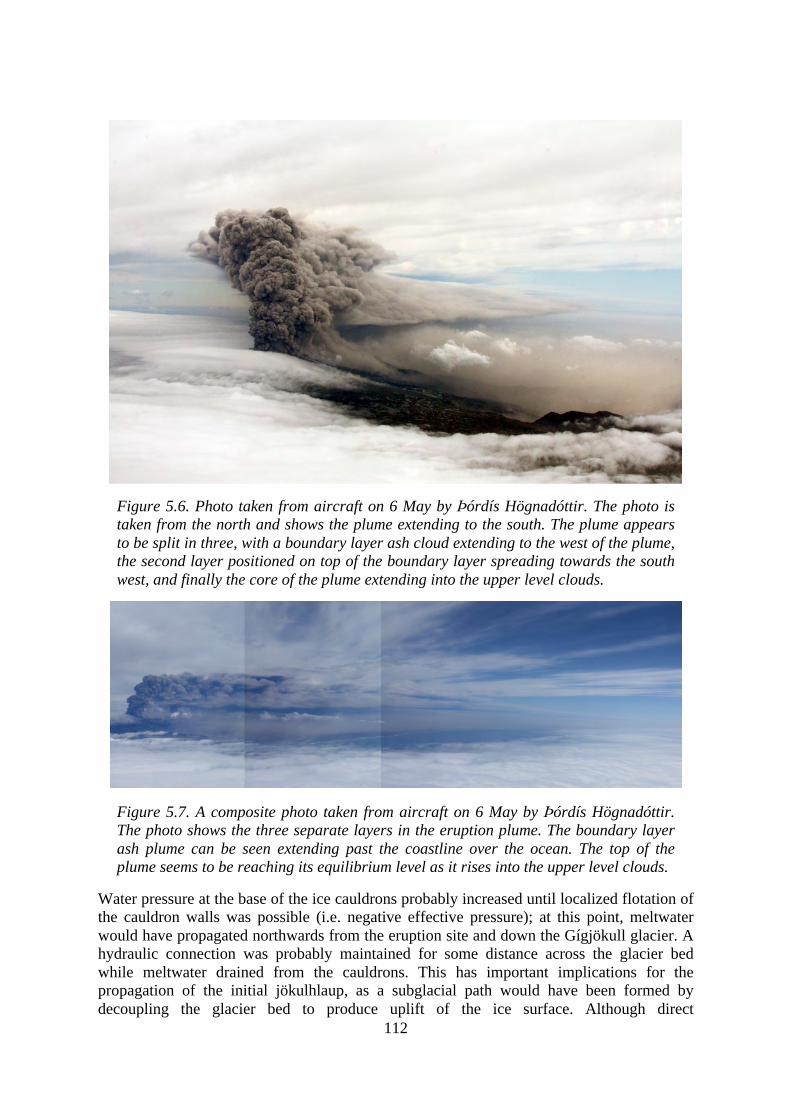
112
Figure 5.6. Photo taken from aircraft on 6 May by Þórdís Högnadóttir. The photo is taken from the north and shows the plume extending to the south. The plume appears to be split in three, with a boundary layer ash cloud extending to the west of the plume, the second layer positioned on top of the boundary layer spreading towards the south west, and finally the core of the plume extending into the upper level clouds.
Figure 5.7. A composite photo taken from aircraft on 6 May by Þórdís Högnadóttir. The photo shows the three separate layers in the eruption plume. The boundary layer ash plume can be seen extending past the coastline over the ocean. The top of the plume seems to be reaching its equilibrium level as it rises into the upper level clouds.
Water pressure at the base of the ice cauldrons probably increased until localized flotation of the cauldron walls was possible (i.e. negative effective pressure); at this point, meltwater would have propagated northwards from the eruption site and down the Gígjökull glacier. A hydraulic connection was probably maintained for some distance across the glacier bed while meltwater drained from the cauldrons. This has important implications for the propagation of the initial jökulhlaup, as a subglacial path would have been formed by decoupling the glacier bed to produce uplift of the ice surface. Although direct
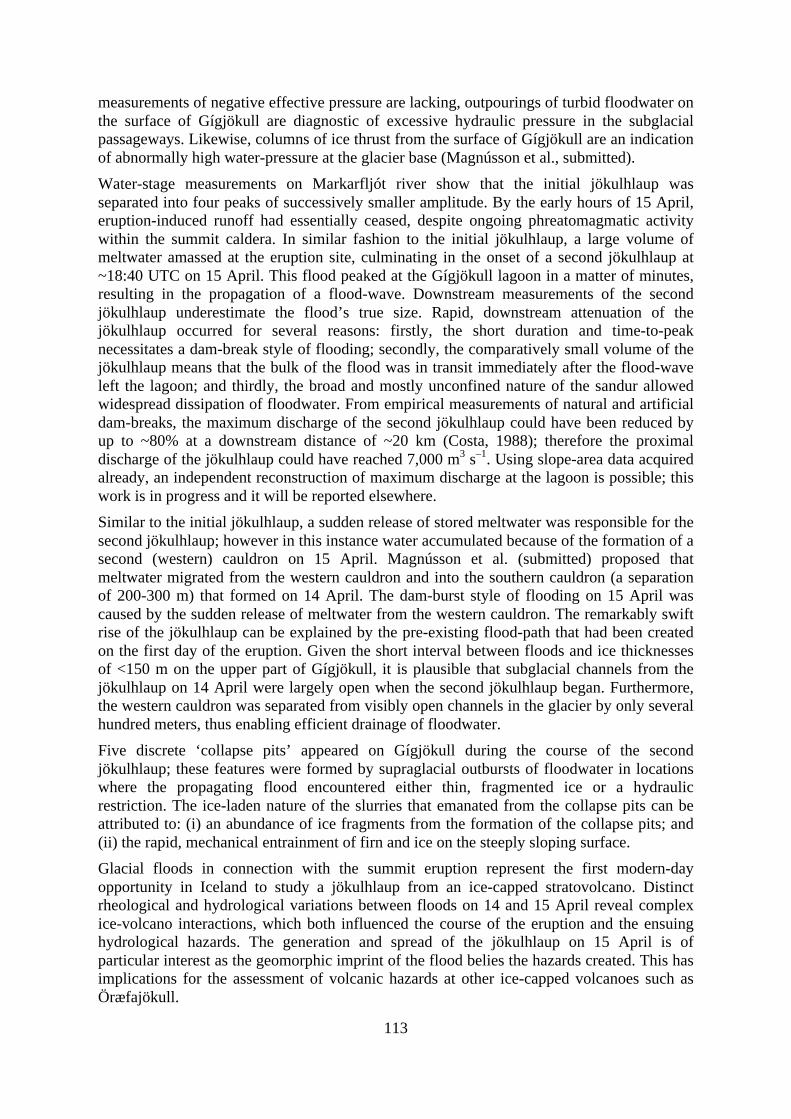
113
measurements of negative effective pressure are lacking, outpourings of turbid floodwater on the surface of Gígjökull are diagnostic of excessive hydraulic pressure in the subglacial passageways. Likewise, columns of ice thrust from the surface of Gígjökull are an indication of abnormally high water-pressure at the glacier base (Magnússon et al., submitted). Water-stage measurements on Markarfljót river show that the initial jökulhlaup was separated into four peaks of successively smaller amplitude. By the early hours of 15 April, eruption-induced runoff had essentially ceased, despite ongoing phreatomagmatic activity within the summit caldera. In similar fashion to the initial jökulhlaup, a large volume of meltwater amassed at the eruption site, culminating in the onset of a second jökulhlaup at ~18:40 UTC on 15 April. This flood peaked at the Gígjökull lagoon in a matter of minutes, resulting in the propagation of a flood-wave. Downstream measurements of the second jökulhlaup underestimate the flood’s true size. Rapid, downstream attenuation of the jökulhlaup occurred for several reasons: firstly, the short duration and time-to-peak necessitates a dam-break style of flooding; secondly, the comparatively small volume of the jökulhlaup means that the bulk of the flood was in transit immediately after the flood-wave left the lagoon; and thirdly, the broad and mostly unconfined nature of the sandur allowed widespread dissipation of floodwater. From empirical measurements of natural and artificial dam-breaks, the maximum discharge of the second jökulhlaup could have been reduced by up to ~80% at a downstream distance of ~20 km (Costa, 1988); therefore the proximal discharge of the jökulhlaup could have reached 7,000 m3 s–1. Using slope-area data acquired already, an independent reconstruction of maximum discharge at the lagoon is possible; this work is in progress and it will be reported elsewhere. Similar to the initial jökulhlaup, a sudden release of stored meltwater was responsible for the second jökulhlaup; however in this instance water accumulated because of the formation of a second (western) cauldron on 15 April. Magnússon et al. (submitted) proposed that meltwater migrated from the western cauldron and into the southern cauldron (a separation of 200-300 m) that formed on 14 April. The dam-burst style of flooding on 15 April was caused by the sudden release of meltwater from the western cauldron. The remarkably swift rise of the jökulhlaup can be explained by the pre-existing flood-path that had been created on the first day of the eruption. Given the short interval between floods and ice thicknesses of <150 m on the upper part of Gígjökull, it is plausible that subglacial channels from the jökulhlaup on 14 April were largely open when the second jökulhlaup began. Furthermore, the western cauldron was separated from visibly open channels in the glacier by only several hundred meters, thus enabling efficient drainage of floodwater. Five discrete ‘collapse pits’ appeared on Gígjökull during the course of the second jökulhlaup; these features were formed by supraglacial outbursts of floodwater in locations where the propagating flood encountered either thin, fragmented ice or a hydraulic restriction. The ice-laden nature of the slurries that emanated from the collapse pits can be attributed to: (i) an abundance of ice fragments from the formation of the collapse pits; and (ii) the rapid, mechanical entrainment of firn and ice on the steeply sloping surface. Glacial floods in connection with the summit eruption represent the first modern-day opportunity in Iceland to study a jökulhlaup from an ice-capped stratovolcano. Distinct rheological and hydrological variations between floods on 14 and 15 April reveal complex ice-volcano interactions, which both influenced the course of the eruption and the ensuing hydrological hazards. The generation and spread of the jökulhlaup on 15 April is of particular interest as the geomorphic imprint of the flood belies the hazards created. This has implications for the assessment of volcanic hazards at other ice-capped volcanoes such as Öræfajökull.
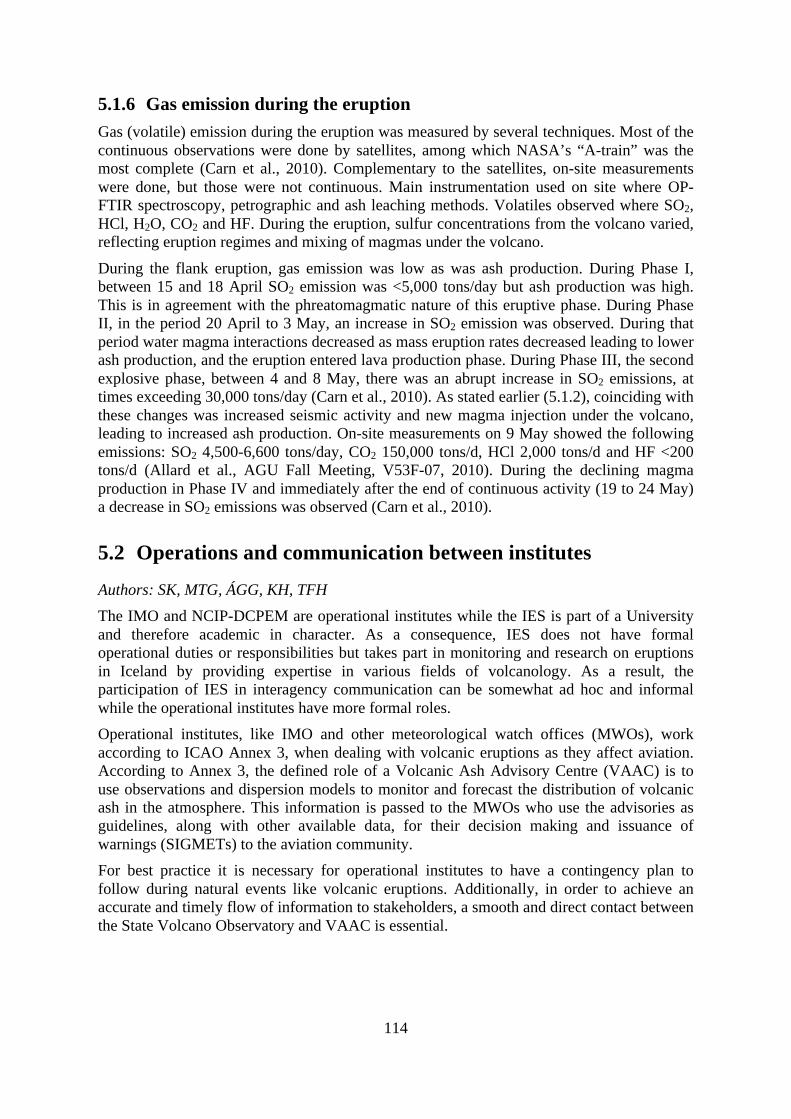
114
5.1.6 Gas emission during the eruption Gas (volatile) emission during the eruption was measured by several techniques. Most of the continuous observations were done by satellites, among which NASA’s “A-train” was the most complete (Carn et al., 2010). Complementary to the satellites, on-site measurements were done, but those were not continuous. Main instrumentation used on site where OP-FTIR spectroscopy, petrographic and ash leaching methods. Volatiles observed where SO2, HCl, H2O, CO2 and HF. During the eruption, sulfur concentrations from the volcano varied, reflecting eruption regimes and mixing of magmas under the volcano.
During the flank eruption, gas emission was low as was ash production. During Phase I, between 15 and 18 April SO2 emission was <5,000 tons/day but ash production was high. This is in agreement with the phreatomagmatic nature of this eruptive phase. During Phase II, in the period 20 April to 3 May, an increase in SO2 emission was observed. During that period water magma interactions decreased as mass eruption rates decreased leading to lower ash production, and the eruption entered lava production phase. During Phase III, the second explosive phase, between 4 and 8 May, there was an abrupt increase in SO2 emissions, at times exceeding 30,000 tons/day (Carn et al., 2010). As stated earlier (5.1.2), coinciding with these changes was increased seismic activity and new magma injection under the volcano, leading to increased ash production. On-site measurements on 9 May showed the following emissions: SO2 4,500-6,600 tons/day, CO2 150,000 tons/d, HCl 2,000 tons/d and HF <200 tons/d (Allard et al., AGU Fall Meeting, V53F-07, 2010). During the declining magma production in Phase IV and immediately after the end of continuous activity (19 to 24 May) a decrease in SO2 emissions was observed (Carn et al., 2010).
5.2 Operations and communication between institutes
Authors: SK, MTG, ÁGG, KH, TFH The IMO and NCIP-DCPEM are operational institutes while the IES is part of a University and therefore academic in character. As a consequence, IES does not have formal operational duties or responsibilities but takes part in monitoring and research on eruptions in Iceland by providing expertise in various fields of volcanology. As a result, the participation of IES in interagency communication can be somewhat ad hoc and informal while the operational institutes have more formal roles. Operational institutes, like IMO and other meteorological watch offices (MWOs), work according to ICAO Annex 3, when dealing with volcanic eruptions as they affect aviation. According to Annex 3, the defined role of a Volcanic Ash Advisory Centre (VAAC) is to use observations and dispersion models to monitor and forecast the distribution of volcanic ash in the atmosphere. This information is passed to the MWOs who use the advisories as guidelines, along with other available data, for their decision making and issuance of warnings (SIGMETs) to the aviation community. For best practice it is necessary for operational institutes to have a contingency plan to follow during natural events like volcanic eruptions. Additionally, in order to achieve an accurate and timely flow of information to stakeholders, a smooth and direct contact between the State Volcano Observatory and VAAC is essential.
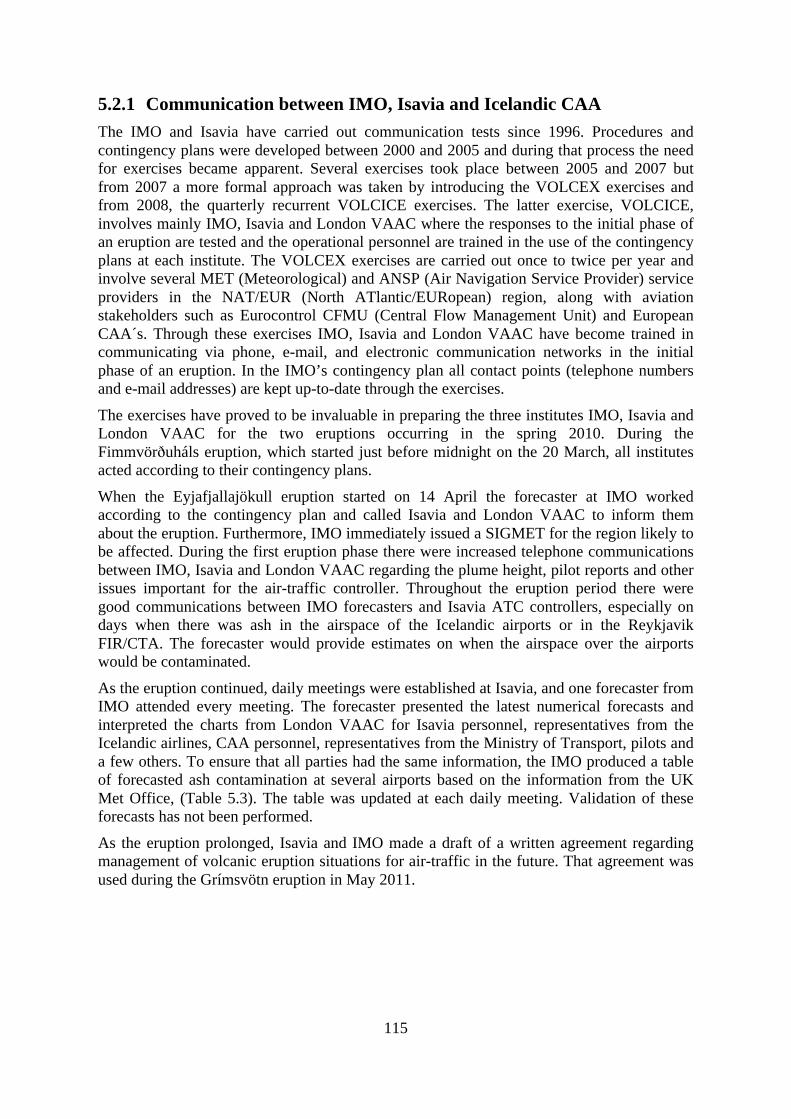
115
5.2.1 Communication between IMO, Isavia and Icelandic CAA The IMO and Isavia have carried out communication tests since 1996. Procedures and contingency plans were developed between 2000 and 2005 and during that process the need for exercises became apparent. Several exercises took place between 2005 and 2007 but from 2007 a more formal approach was taken by introducing the VOLCEX exercises and from 2008, the quarterly recurrent VOLCICE exercises. The latter exercise, VOLCICE, involves mainly IMO, Isavia and London VAAC where the responses to the initial phase of an eruption are tested and the operational personnel are trained in the use of the contingency plans at each institute. The VOLCEX exercises are carried out once to twice per year and involve several MET (Meteorological) and ANSP (Air Navigation Service Provider) service providers in the NAT/EUR (North ATlantic/EURopean) region, along with aviation stakeholders such as Eurocontrol CFMU (Central Flow Management Unit) and European CAA´s. Through these exercises IMO, Isavia and London VAAC have become trained in communicating via phone, e-mail, and electronic communication networks in the initial phase of an eruption. In the IMO’s contingency plan all contact points (telephone numbers and e-mail addresses) are kept up-to-date through the exercises.
The exercises have proved to be invaluable in preparing the three institutes IMO, Isavia and London VAAC for the two eruptions occurring in the spring 2010. During the Fimmvörðuháls eruption, which started just before midnight on the 20 March, all institutes acted according to their contingency plans.
When the Eyjafjallajökull eruption started on 14 April the forecaster at IMO worked according to the contingency plan and called Isavia and London VAAC to inform them about the eruption. Furthermore, IMO immediately issued a SIGMET for the region likely to be affected. During the first eruption phase there were increased telephone communications between IMO, Isavia and London VAAC regarding the plume height, pilot reports and other issues important for the air-traffic controller. Throughout the eruption period there were good communications between IMO forecasters and Isavia ATC controllers, especially on days when there was ash in the airspace of the Icelandic airports or in the Reykjavik FIR/CTA. The forecaster would provide estimates on when the airspace over the airports would be contaminated.
As the eruption continued, daily meetings were established at Isavia, and one forecaster from IMO attended every meeting. The forecaster presented the latest numerical forecasts and interpreted the charts from London VAAC for Isavia personnel, representatives from the Icelandic airlines, CAA personnel, representatives from the Ministry of Transport, pilots and a few others. To ensure that all parties had the same information, the IMO produced a table of forecasted ash contamination at several airports based on the information from the UK Met Office, (Table 5.3). The table was updated at each daily meeting. Validation of these forecasts has not been performed.
As the eruption prolonged, Isavia and IMO made a draft of a written agreement regarding management of volcanic eruption situations for air-traffic in the future. That agreement was used during the Grímsvötn eruption in May 2011.
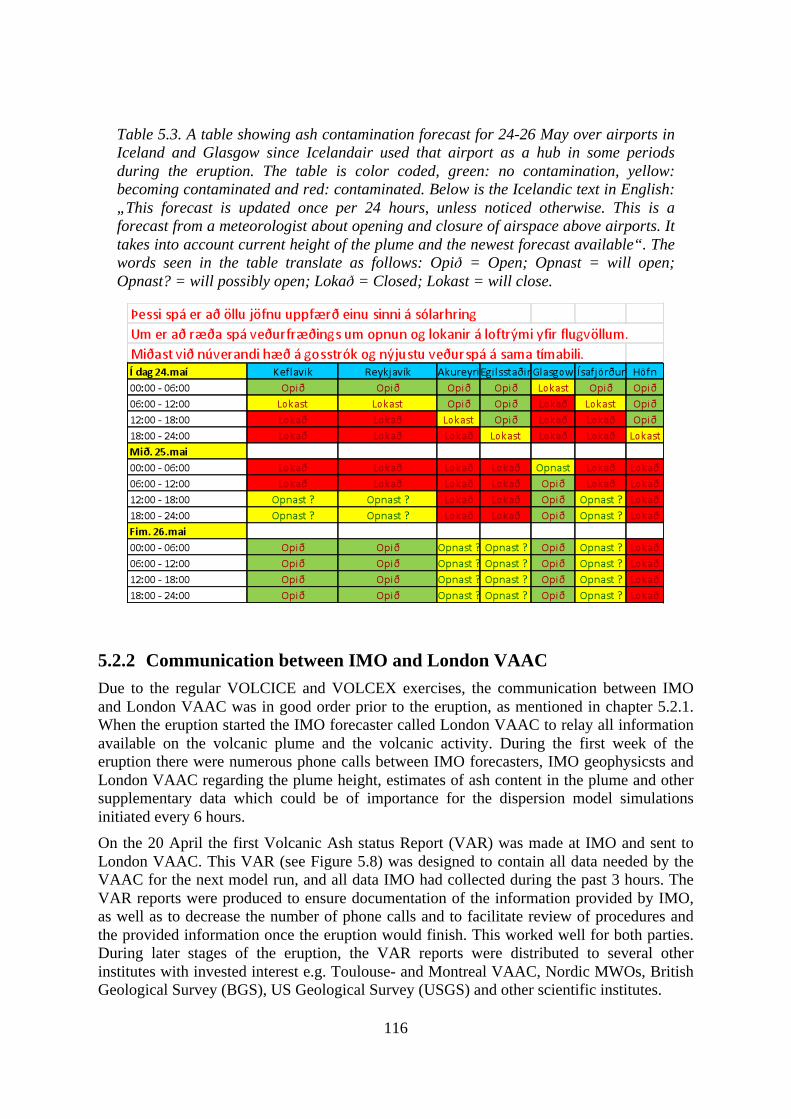
116
Table 5.3. A table showing ash contamination forecast for 24-26 May over airports in Iceland and Glasgow since Icelandair used that airport as a hub in some periods during the eruption. The table is color coded, green: no contamination, yellow: becoming contaminated and red: contaminated. Below is the Icelandic text in English: „This forecast is updated once per 24 hours, unless noticed otherwise. This is a forecast from a meteorologist about opening and closure of airspace above airports. It takes into account current height of the plume and the newest forecast available“. The words seen in the table translate as follows: Opið = Open; Opnast = will open; Opnast? = will possibly open; Lokað = Closed; Lokast = will close.
5.2.2 Communication between IMO and London VAAC Due to the regular VOLCICE and VOLCEX exercises, the communication between IMO and London VAAC was in good order prior to the eruption, as mentioned in chapter 5.2.1. When the eruption started the IMO forecaster called London VAAC to relay all information available on the volcanic plume and the volcanic activity. During the first week of the eruption there were numerous phone calls between IMO forecasters, IMO geophysicsts and London VAAC regarding the plume height, estimates of ash content in the plume and other supplementary data which could be of importance for the dispersion model simulations initiated every 6 hours. On the 20 April the first Volcanic Ash status Report (VAR) was made at IMO and sent to London VAAC. This VAR (see Figure 5.8) was designed to contain all data needed by the VAAC for the next model run, and all data IMO had collected during the past 3 hours. The VAR reports were produced to ensure documentation of the information provided by IMO, as well as to decrease the number of phone calls and to facilitate review of procedures and the provided information once the eruption would finish. This worked well for both parties. During later stages of the eruption, the VAR reports were distributed to several other institutes with invested interest e.g. Toulouse- and Montreal VAAC, Nordic MWOs, British Geological Survey (BGS), US Geological Survey (USGS) and other scientific institutes.
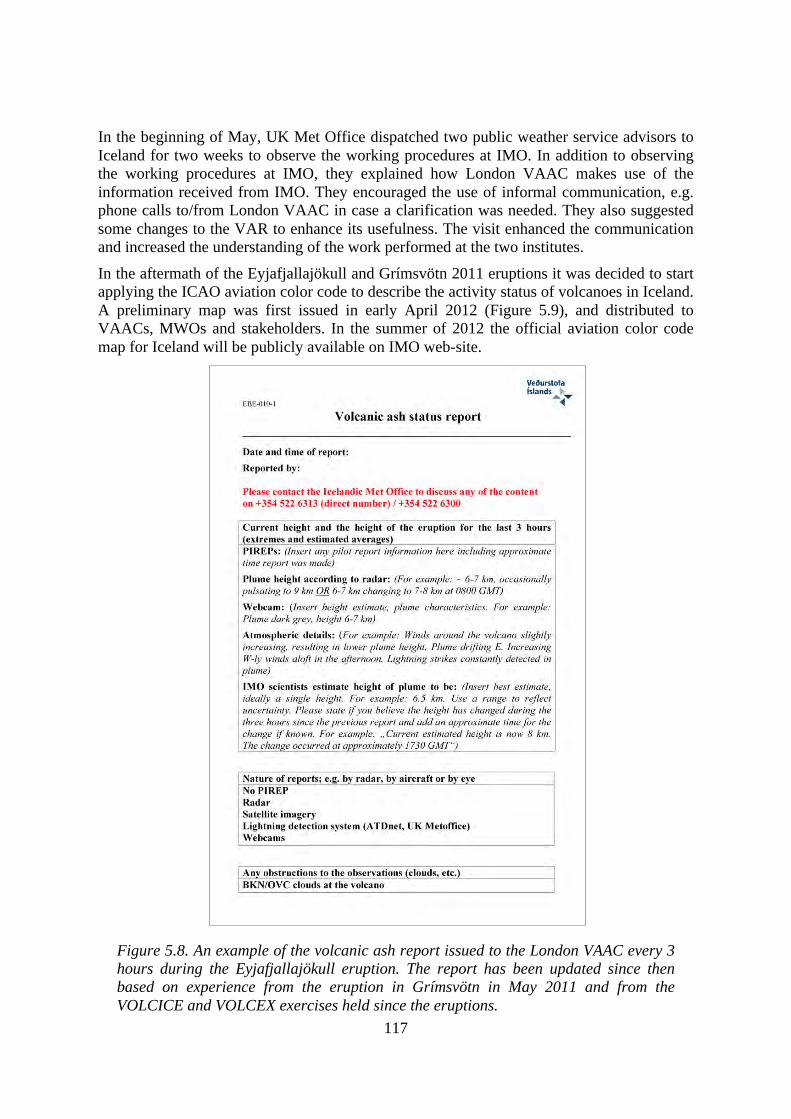
117
In the beginning of May, UK Met Office dispatched two public weather service advisors to Iceland for two weeks to observe the working procedures at IMO. In addition to observing the working procedures at IMO, they explained how London VAAC makes use of the information received from IMO. They encouraged the use of informal communication, e.g. phone calls to/from London VAAC in case a clarification was needed. They also suggested some changes to the VAR to enhance its usefulness. The visit enhanced the communication and increased the understanding of the work performed at the two institutes.
In the aftermath of the Eyjafjallajökull and Grímsvötn 2011 eruptions it was decided to start applying the ICAO aviation color code to describe the activity status of volcanoes in Iceland. A preliminary map was first issued in early April 2012 (Figure 5.9), and distributed to VAACs, MWOs and stakeholders. In the summer of 2012 the official aviation color code map for Iceland will be publicly available on IMO web-site.
Figure 5.8. An example of the volcanic ash report issued to the London VAAC every 3 hours during the Eyjafjallajökull eruption. The report has been updated since then based on experience from the eruption in Grímsvötn in May 2011 and from the VOLCICE and VOLCEX exercises held since the eruptions.
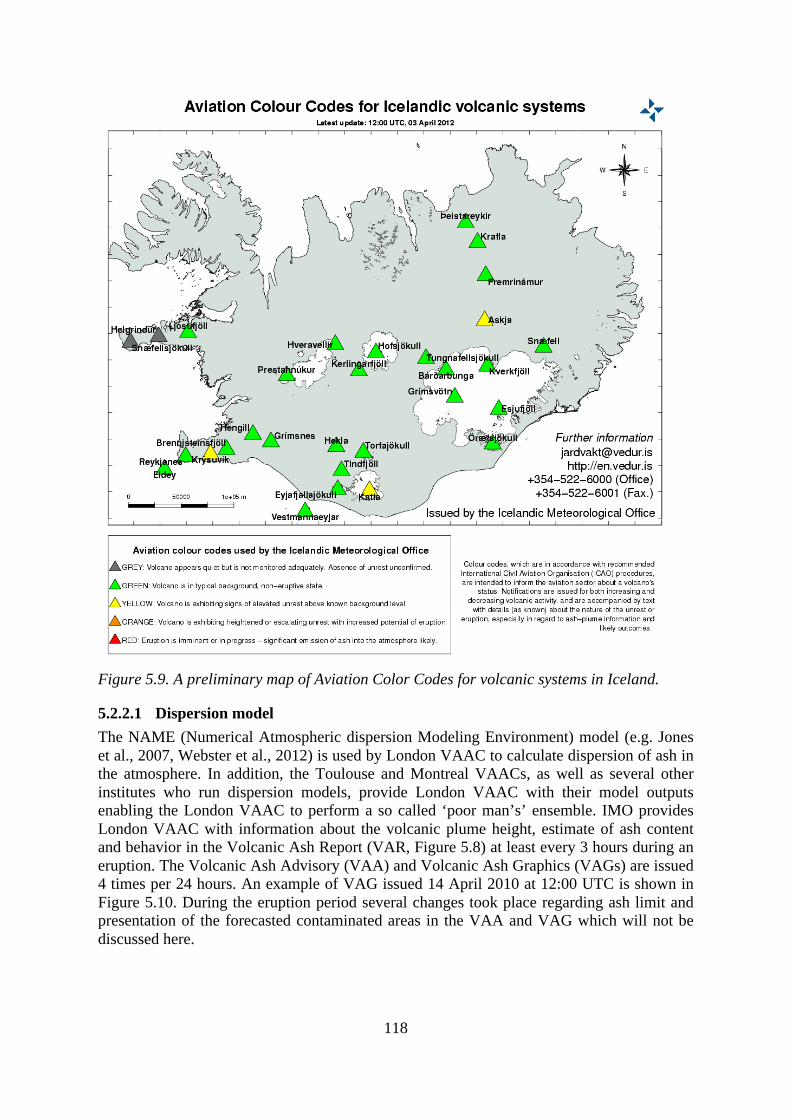
118
Figure 5.9. A preliminary map of Aviation Color Codes for volcanic systems in Iceland.
5.2.2.1 Dispersion model The NAME (Numerical Atmospheric dispersion Modeling Environment) model (e.g. Jones et al., 2007, Webster et al., 2012) is used by London VAAC to calculate dispersion of ash in the atmosphere. In addition, the Toulouse and Montreal VAACs, as well as several other institutes who run dispersion models, provide London VAAC with their model outputs enabling the London VAAC to perform a so called ‘poor man’s’ ensemble. IMO provides London VAAC with information about the volcanic plume height, estimate of ash content and behavior in the Volcanic Ash Report (VAR, Figure 5.8) at least every 3 hours during an eruption. The Volcanic Ash Advisory (VAA) and Volcanic Ash Graphics (VAGs) are issued 4 times per 24 hours. An example of VAG issued 14 April 2010 at 12:00 UTC is shown in Figure 5.10. During the eruption period several changes took place regarding ash limit and presentation of the forecasted contaminated areas in the VAA and VAG which will not be discussed here.
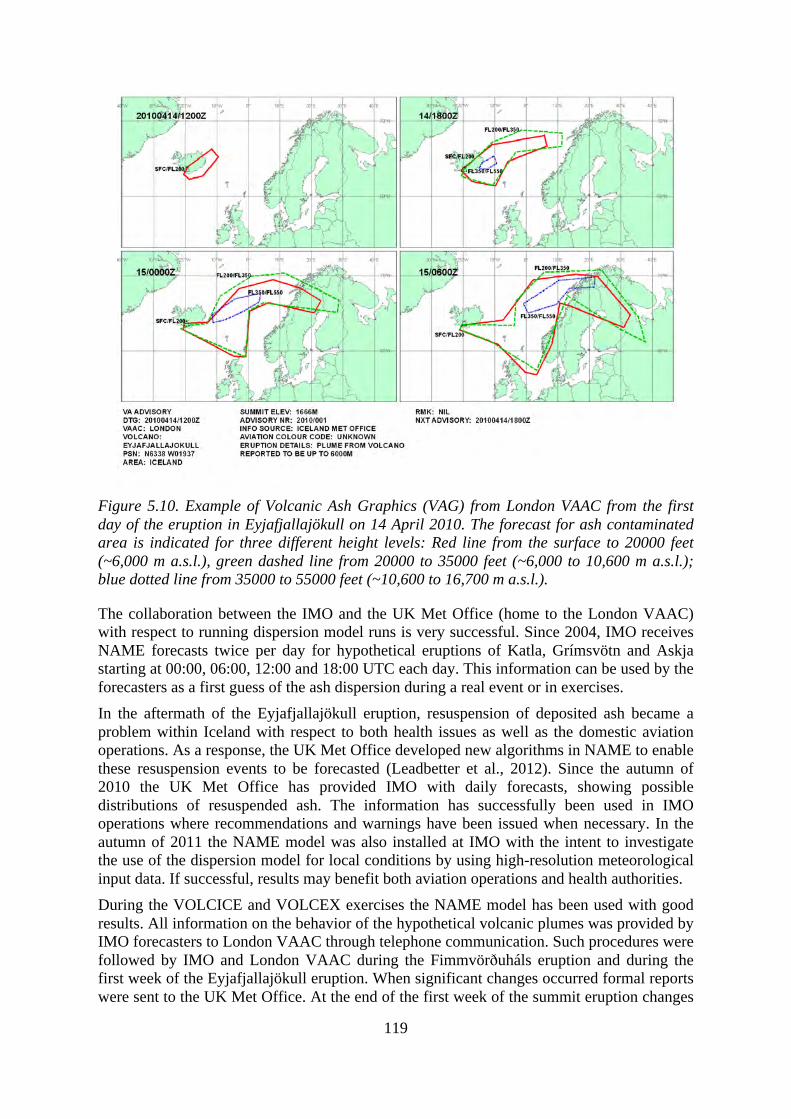
119
Figure 5.10. Example of Volcanic Ash Graphics (VAG) from London VAAC from the first day of the eruption in Eyjafjallajökull on 14 April 2010. The forecast for ash contaminated area is indicated for three different height levels: Red line from the surface to 20000 feet (~6,000 m a.s.l.), green dashed line from 20000 to 35000 feet (~6,000 to 10,600 m a.s.l.); blue dotted line from 35000 to 55000 feet (~10,600 to 16,700 m a.s.l.).
The collaboration between the IMO and the UK Met Office (home to the London VAAC) with respect to running dispersion model runs is very successful. Since 2004, IMO receives NAME forecasts twice per day for hypothetical eruptions of Katla, Grímsvötn and Askja starting at 00:00, 06:00, 12:00 and 18:00 UTC each day. This information can be used by the forecasters as a first guess of the ash dispersion during a real event or in exercises. In the aftermath of the Eyjafjallajökull eruption, resuspension of deposited ash became a problem within Iceland with respect to both health issues as well as the domestic aviation operations. As a response, the UK Met Office developed new algorithms in NAME to enable these resuspension events to be forecasted (Leadbetter et al., 2012). Since the autumn of 2010 the UK Met Office has provided IMO with daily forecasts, showing possible distributions of resuspended ash. The information has successfully been used in IMO operations where recommendations and warnings have been issued when necessary. In the autumn of 2011 the NAME model was also installed at IMO with the intent to investigate the use of the dispersion model for local conditions by using high-resolution meteorological input data. If successful, results may benefit both aviation operations and health authorities. During the VOLCICE and VOLCEX exercises the NAME model has been used with good results. All information on the behavior of the hypothetical volcanic plumes was provided by IMO forecasters to London VAAC through telephone communication. Such procedures were followed by IMO and London VAAC during the Fimmvörðuháls eruption and during the first week of the Eyjafjallajökull eruption. When significant changes occurred formal reports were sent to the UK Met Office. At the end of the first week of the summit eruption changes
120
were made to the collaborative working procedures between the IMO and London VAAC in order to improve the information flow. The creation of the VAR was an important step forward, in addition to a direct link which was established between the scientists at IMO and the Atmospheric Dispersion Group (ADG) at the UK Met Office.
5.2.3 Communication between IMO, IES and NCIP-DCPEM Regular meetings between IMO, IES and NCIP-DCPEM are held twice per year, with the aim of discussing the volcanic activity in Iceland and the probabilities of eruptions. The institutes meet more frequently if necessary, and as soon as possible if precursors of a possible volcanic eruption are detected. This procedure is necessary for preparedness for natural hazards. At the beginning of March 2010 a meeting was held due to a large increase in the earthquake activity below Eyjafjallajökull. When the eruption started, NCIP-DCPEM activated their contingency plan, which includes information flow from scientists at IMO and IES as well as organization of meetings and surveillance flights with participation from IMO and IES. Scientists at IMO and IES conferred continuously with the National Crisis Coordination Centre (NCCC) by telephone during the onset of the summit eruption of on 13 and 14 April 2010. A liaison from the NCCC was also present at the IMO monitoring center during the hours leading up to the start of the summit eruption. Throughout the eruption selected members of the scientific community met at least daily with the NCIP-DCPEM.
A few days into the summit eruption the IMO and IES started issuing joint daily reports to NCIP-DCPEM/NCCC based on the protocol in Table 5.2. These status reports conveyed predefined information on a regular basis in addition to frequent verbal communications and information delivered at meetings between the NCIP, other civil protection authorities and the scientific community. In addition, the daily reports were distributed to London VAAC and other operational institutes, and made available on the institutes´ websites. During the 2011 Grímsvötn eruption the daily status reports were issued from day one of the eruption.
5.2.4 Communication between IES and other institutes The Institute of Earth Sciences, as a part of the University of Iceland´s Science Institute, has principally academic obligations, with the principal duty to carry out fundamental research. Within the Institute a major emphasis, however, is placed on volcanology in a broad sense, through the running of the Nordic Volcanological Center. The academic status implies that the IES does not have statutory responsibilities towards monitoring or other non-academic issues. As a consequence, the IES does not play a formal role in communication between the institutes in Iceland and with operational institutes in other countries. However, on the basis of its expertise and the number of scientists it has in the various fields of volcanology, IES is called upon to advice NCIP-DCPEM, the Government and local authorities on matters relating to volcanic hazard, especially during eruptions.
IES personnel took part in frequent briefings including NCIP, the local police and civil protection committee. Most communication, however, was informal, involving e.g. frequent phone conversations with a representative of BGS providing assessment of the activity and the prospects. A phone meeting between the IES head and the UK Government Chief Scientific Adviser took place on in early May. He also sat with the Icelandic Minister of Transport at the emergency teleconference of the EU and EEA Transport Ministers that approved changes in flight regulations on 19 April 2010, defining the increased permissible level of ash in the atmosphere.
121
A great deal of informal communication took place between IES staff and colleagues in Europe and other parts of the world, mainly through e-mail and phone conversations.No communication took place between London VAAC personnel and IES staff during the eruption.
5.2.5 Other communication and discussion On 14 May 2010 a delegation from UK, BGS and the NCAS came to Iceland on behalf of the UK Chief Scientific Advisor. An outcome of that visit was a signed Memorandum of Understanding (MoU) between IMO, UK Met Office, BGS and NCAS. This MoU is assigned to promote collaboration between these institutes in the field of volcanic eruptions and related topics e.g. improvements of geophysical monitoring, volcanic ash monitoring in the atmosphere, resuspension of ash, and ash dispersion modeling. Several scientific projects and collaboration have started based on the MoU and others are under development. The benefit of this collaboration was clearly demonstrated during the week-long Grímsvötn eruption in May 2011. As stated in chapter 5.2.1 the common exercises conducted between IMO, Isavia and London VAAC proved to be invaluable during the Eyjafjallajökull eruption in 2010 and the Grímsvötn eruption in 2011. However, real events provide the opportunities for major steps forward and this was especially true during the Eyjafjallajökull eruption. Major improvements were seen in
• the creation of the VAR (Volcanic Ash Reports) issued every 3 hours • the daily reports with a focus on seismic activity • the lowering of barriers with regards to phone communications between IMO and
London VAAC. The importance of good monitoring systems, both geological and atmospheric was underlined during the Eyjafjallajökull eruption. As a result of that ICAO has financed two mobile X-band radars for utilization in Iceland. IMO had pointed out the need to improve the radar network in the country for better detection of volcanic ash plumes already in 2005, see further discussion in chapter 5.4.4.
The Eyjafjallajökull eruption gave rise to several national and international projects which aim to increase our knowledge and understanding of volcanic eruptions. This is expected to result in improved forecasts of future eruptions and ash dispersion.
5.3 Communication with media and the general public
Authors: SK, MTG, ÁGG, TFH, GP, HB, EI The enormous media attention caused by the Eyjafjallajökull eruption was unprecedented, and the involved institutes (IMO, IES and NCIP-DCPEM) were unprepared to deal with this demand at first. It was very important to respond to this pressure so it would not hamper the work needed to be performed during the eruption. The approach mostly used by the institutes to meet the demand to rapidly disseminate relevant information was the internet.
5.3.1 Communication with media The enormous demand of the media nearly hampered the necessary work at the institutes during the critical first days of the Eyjafjallajökull eruption. On the second day of the eruption the IMO alone spoke to around 100 reporters from across the world. It should be
122
emphasized that the institute does not have a press office. At IES 5–7 staff members worked full time at communicating with the international media. The pressure on NCIP-DCPEM was similar. An example of the problems that the media attention was causing was phone calls that key personnel were receiving from the foreign media at night. In one case a scientist had to leave his mobile phone with a colleague overnight for some nights; if important calls had to be answered the colleague made contact using the land line phone. In order to address the media issue, the IMO asked for assistance from the Ministry of Environment. The Ministry decided to open two media centers under the supervision of the NCIP, one at the rescue center in Reykjavík and the second one in Hvolsvöllur town close to the eruption site. Both media centers were open during working hours seven days a week, and were staffed by press officers from various government agencies as well as press officers from various NGO’s such as the Icelandic Red Cross and ICE-SAR. In the media center at Hvolsvöllur, scientists from IMO were available for interviews in the period between 16 and 21 April. In Reykjavík press conferences were held every morning at 08:00 UTC, and during the first few days after the opening they were held twice a day. Representatives from the scientific community, mainly from IMO and IES, took part in briefings alongside representatives from the NCIP and other government agencies and NGO’s. These press conferences were attended mostly by the international media and representatives from foreign embassies in Iceland.
Good communication with the media during hazardous events is very important. However, it is essential that the operational institutes and/or the scientific community handle the media demands in such a way that it does not hamper necessary work. The establishment of the media centers relieved a lot of pressure. When the eruption in Grímsvötn started in May 2011 the media center was established right away. Lessons learned from the Eyjafjallajökull eruption were adapted and taken into account.
5.3.2 Communication with the national administration, NGO‘s and the general public
The National Crisis Command Centre (NCCC) issued status reports in Icelandic and English every day during the eruption of Eyjafjallajökull. These status reports contained information on the eruption received from IMO and IES daily reports (see chapter 5.2.3) as well as reporting on the effects of the eruption on local communities and transportation and on response measures. The daily reports were issued to the cabinet and ministries as well as to the foreign service, other relevant government organizations and the media. English versions of these reports were also sent to the above as well as to foreign embassies and the foreign media. These reports were also sent to relevant NGO’s such as the travel industry and the Icelandic Red Cross.
Throughout the course of the eruption of Eyjafjallajökull in 2010 NCIP-DCPEM, in cooperation with local civil protection authorities, organized a number of information meetings with the local population in the areas affected by the eruption, ten in total in the period 19 to 21 April. Scientists from IES and IMO and other government agencies gave talks on the eruption and possible developments. These information meetings were also used to disseminate information on health care matters, matters regarding property insurance and relief efforts. National and local media were used to convey information to the local population and in selected instances flyers or direct mailings were used to address specific matters.
123
IMO issued daily reports to the Ministry of Environment on the institute’s activity during the eruption period.
5.3.3 International response organizations Information on the ongoing eruption was disseminated to international response organizations. The NCIP-DCPEM is the national contact point for the European Union´s Humanitarian Aid and Civil Protection Monitoring and Information Centre (EU-MIC). The EU-MIC gathers information on on-going emergencies and distributes it further to member states of the European Union. Throughout the summit eruption of Eyjafjallajökull regular reports were sent to the EU-MIC through the Common Emergency Communication and Information System (CECIS). Representatives of the NCIP-DCPEM also took part in telephone conferences regarding the eruption. The NCIP-DCPEM also disseminated information on the eruption to sister organizations in other Nordic countries as well as to NATO´s Euro-Atlantic Disaster Response Coordination Centre (EADRCC).
IMO participated in telephone conferences with the international aviation community, organized by UK Met Office and Eurocontrol CMFU and informed participants about the development of the eruption.
5.3.4 Dissemination through the internet The internet is a powerful tool to disseminate information. A significant part of the data acquired by the monitoring networks are publicly available on the IMO website (www.vedur.is), which is one of the most frequently visited websites in Iceland.
The seismic, GPS, meteorological and hydrological data are available in real time. This direct information flow to the public is therefore an integral part of IMO operation which has a considerable educational value and helps ensuring the public trust in the IMO services. Shortly after the onset of the eruption it was recognized that a special site within the IMO site was needed in addition to the regular streaming of monitoring data. This site would provide the media, general public and stakeholders with relevant background and overview information. On the second day of the eruption the updated website had been launched. In the future, these new updates and applications can be activated as soon as a volcanic eruption is imminent. A special contingency plan for the communication structure at IMO during a natural hazard will be set up in 2012.
IES does not generally gather real-time geophysical data streams in the same way as IMO. However, a designated site was opened on the IES web-page (www.jardvis.hi.is / www.earthice.hi.is) during the Fimmvörðuháls eruption displaying early results of analyses, eruption photos and a wealth of background information. Data on ground deformation, magma chemistry, petrology, tephra fallout, grain sizes and other characteristics of the eruption were published on the web page as soon as they were available. Furthermore, pdf-versions of publications of IES staff on Eyjafjallajökull and its surroundings (volcanology, deformation, glaciology, general geology, volcanic history etc.) were placed on the page for reference.
124
A large part of the information published on the IES web page constituted unpublished primary scientific data. This open dissemination of preliminary results was deemed necessary considering the wide-ranging impact of the eruption. An unexpected consequence of this open policy was use of the data in early publication of results by foreign research groups. For best practice and for the aviation community and public interest, it is essential that data are available for operational use and that these data are not misused. The volcanological science community needs to clarify the boundary between operational use of local primary data, and their use for scientific purposes and publication.
5.4 Monitoring and analysis – shortcomings and lessons learned
Authors: SK, MTG, ÁH, EI Many lessons were learned from the Eyjafjallajökull eruption, and the various improvements were tested during the week-long eruption of Grímsvötn in May 2011. These were, for instance, improved methodology in dissemination of updates on the eruption evolution through the VAR and the joint daily reports of IMO and IES in addition to the daily report of the NCIP-DCPEM. The creation of a media center was essential as well as the enhanced co-operation between domestic and international institutes as mentioned in chapters 5.2 and 5.3.
One of the main outcomes of the Eyjafjallajökull eruption was that improvements have to be made in monitoring of volcanic ash plumes, so that the input data into dispersion models will be as accurate as possible. Issues where improvements are needed and are at various stages of consideration are listed here:
• Aircraft availability for surveillance flights over the eruption area • Facilities and instruments for geophysical and geochemical monitoring • Operational plan for ash sampling and eruption products characterization • Radar coverage • Use of Lidar and ceilometers for volcanic ash detection • Enhanced use of satellite information • Increase in human resources at IMO regarding volcanic science
5.4.1 Aircraft availability for surveillance flights over the eruption area The systematic use of aircraft for surveillance flights in Iceland obtaining quantitative information began in the Gjálp eruption in 1996. This work has mainly occurred through collaboration between IES, Icelandic Civil Aviation Authority (now Isavia), NCIP-DCPEM and the Icelandic Coast Guard. During the Eyjafjallajökull eruption IMO began taking an active part in these operations.
During volcanic eruptions, it is important that the vent location and environmental conditions can be determined as quickly as possible and updated when needed. The location of vents determines the environmental setting (subaerial, subglacial, submarine) and thus influences various hazards (flow direction of pyroclastic density currents, lava flows and jökulhlaups). Inspection of the vents and plume is also very important for interpreting vent and conduit processes (e.g. explosivity, magma fragmentation, magma-water interaction). Visual and remote sensing observations from aircraft are crucial in this aspect of monitoring. During the Eyjafjallajökull eruption the Dash 9 aircraft of the Icelandic Coast Guard was the most important platform. This was because of the onboard SAR instrument which can be
125
applied at a safe distance from the volcano. It is particularly useful for eruptions where direct visual inspection is impossible due to cloud or dense plume cover. This aircraft was, however, not always available in the Eyjafjallajökull eruption due to pilot shortages and other engagements. Smaller aircraft were also very useful but were more susceptible to adverse weather conditions.
Due to budget constraints, the Dash 9 Coast Guard aircraft has since 2010 been leased for extended periods to do surveillance in various parts of the world, often remote from Iceland. Its availability for eruption monitoring can therefore be compromised and if it is outside the country at the onset of eruption, it is unlikely that it can take part in monitoring in the crucial first 24 hours. Consultation on this issue is taking place between IES, IMO and NCIP-DCPEM.
5.4.2 Improvements of facilities and instruments for geophysical and geochemical monitoring
This can be divided into two parts: (a) real-time or near real-time monitoring (includes seismic stations, GPS stations, a system for detecting and quantifying volcanic gases and glacial river chemistry), and (b) fast sampling and analysis of data (includes analysis of magma chemistry and petrology and analysis of satellite data for ground deformation and volcanic plume behavior).
The most volcanically and seismically active zone in Iceland is well monitored, see chapter 3. However, as frequently is the case with critical events, some areas for improvements were discovered during the Eyjafjallajökull eruption. Many improvements have taken place since the eruption and they are listed in the section below.
5.4.2.1 Seismic stations Several new seismic stations have been included in the SIL-system since 2010 to improve the monitoring of some of Iceland’s most active volcanoes. Six stations have been installed close to, and on, Mýrdalsjökull glacier (which covers Katla volcano). One station, Mjóaskarð, has been installed close to Hekla volcano. Two stations, Jökulheimar and Dyngjufjöll, have been installed west of Vatnajökull ice cap which improves monitoring of a number of subglacial volcanoes, including Grímsvötn and Bárðabunga. These stations are operated as various collaboration projects between the IMO, Uppsala University (Sweden) and the British Geological Survey.
5.4.2.2 GPS stations Several new GPS stations have been included in the monitoring network of the IMO since the Eyjafjallajökull eruption. They are operated mostly by the IMO, and as collaboration between IMO and IES. Four new stations are situated around Katla volcano, and two stations are west of Vatnajökull glacier (which covers several volcanoes, including Grímsvötn and Bárðarbunga). A new station was also set up at Askja volcano in March 2012.
5.4.2.3 Measurements of volcanic gases Both field and satellite measurements of eruptive gas emissions at Eyjafjallajökull were led by international research groups (see chapter 6.10). At the time, the Icelandic research institutes did not possess the necessary equipment, or expertise, to conduct similar measurements. Steps have been taken by the IMO and IES to expand their field of expertise
126
and availability of equipment, to carry out such measurements during future eruptions. There is also ongoing work on including gas measurements in the continuous monitoring network. IMO, in collaboration with Chalmers University (Sweden) runs two ground-based ultraviolet gas spectrometers (sensitive to sulfur dioxide) directed at Hekla volcano. In summer 2012, another sensor system will be installed at the summit of Hekla volcano (a collaboration between IMO and University of Palermo) to measure a variety of gas species. Data will be transmitted to IMO in real-time. Campaign measurements are now also regularly carried out at Grímsvötn volcano which last erupted in May 2011. Two portable gas spectrometers (one ultraviolet and one infrared, sensitive to a large range of gas species) have been acquired by the IMO to be used during future eruptions. Gases emitted from subglacial volcanoes tend to become dissolved in melt water from the glacier. Steps have been taken to increase chemical monitoring of rivers sourced from subglacial volcanoes. Continuous, real-time measurements of pH values are now made in Múlakvísl river, sourced from Mýrdalsjökull glacier which covers Katla volcano. This is in addition to the preexisting measurements of water level, temperature and electrical conductivity. There are plans to add a system of chemical sensors (for sulfur and halogen detection), funding dependent.
5.4.2.4 Borehole strain measurements Volumetric measurements of borehole strain have proved useful for monitoring eruptions of Hekla. To further improve geophysical monitoring of Hekla eruptions a borehole strain-meter was installed in September 2010 at a distance of five kilometres from the volcano's summit. The project was a joint venture between IMO and the Carnegie Institution of Washington (CIW). Operating at a depth of 178.5 m, the Hekla strain-meter (HEK) is highly sensitive to stress variations in the surrounding rock. Between 2010 and 2011 all four active stations in the strain-meter network, including HEK, were upgraded to Internet-based communication, allowing data to be streamed to IMO in near-real-time. Funding has been secured by CIW, IMO, and the British Geological Survey for a strain-meter installation to the south of the Katla volcano; this work will be undertaken in September 2012.
5.4.2.5 Visualization of real-time monitoring data Significant progress has been made in the real-time download, processing, and visualization of geophysical monitoring data. In particular, observations from the strain-meter network are available at IMO within minutes of the measurements being made helping to enable early warnings, when necessary. Similarly, streaming data from the ISGPS network will be utilized for continuous monitoring of volcanic regions as part of the ongoing Volcano Anatomy project, funded by RANNÍS (The Icelandic Science Fund).
5.4.2.6 Petrological analysis During an ongoing eruption in Iceland a large emphasis is placed on getting a sample of the tephra to Reykjavík for rapid analysis. The first parameters measured are the chemistry of erupting magma and the composition and concentration of adsorbed gases and aerosols. In the case of the summit eruption of Eyjafjallajökull this procedure became complicated due to the breach of the main national road. However samples were delivered to Reykjavik on 15 April and analyzed at IES. The analysis revealed a change in composition from the flank eruption. Major element analysis showed that the magma erupting from the summit was of trachyandesitic (benmoreitic) type. Trachyandesite is more evolved and silica rich indicating that a more explosive eruption was to be expected than on the flank. Continuous collection of ash throughout the eruption allowed detailed and time-seriesanalysis to be done. Within
127
2–3 weeks, the IES team along with scientists in Clermont-Ferrand, France could obtain further information on the subsurface processes of Eyjafjallajökull. The analysis showed that the same deep-sourced basaltic magma as erupted on the flank in March-April had been injected into a body of dacite which was most likely leftovers from the last eruption of Eyjafjallajökull in 1821-23. The dacite was heated up and mixed with the new basalt.
Further analysis of the samples collected turned out to be most valuable, showing that the erupted magma had gone through different degrees of mixing prior to eruption. It also showed that the deep-sourced basaltic magma which mixed with the dacite body, donated of its volatiles to the trachyandesitic mixture that was eventually erupted at the surface. This explains the high level of sulfur degassing during 4-8 of May (Keiding & Sigmarsson, 2012). These analyses can potentially be obtained considerably faster, becoming a part of the monitoring effort during an explosive eruption. Semi-continuous analysis of samples collected every 12-24 hours throughout the eruption of Eyjafjallajökull would have given this valuable information and insight. This would complement the geophysical data and help in the interpretation and forecasting of evolution of an eruption. The current microprobe at IES is in need of replacement and solutions are currently being sought on how it can be replaced. This instrument would form an integral part of the rapid response and analysis of future eruptions in Iceland. In this respect it needs to be considered that flights to and from the country may be halted for several days. A fully up to date and operational geochemical laboratory in Iceland is therefore of considerable importance.
5.4.3 Operational plan for ash sampling and eruption products characterization
Physical volcanologists and petrologists at IES have participated in all eruption responses in Iceland since 1970, and as such functioned as a rapid response team to explosive eruptions. Among tasks undertaken is sampling of the tephra, for distribution and magnitude estimates, chemical and grain size analysis, sampling water from the draining area for chemical analysis and direct observations of the vent area. During the eruption of Eyjafjallajökull several teams were located for extended periods in the affected areas doing sampling and analysis to help in estimating eruption rate, impacts, and future evolution during the eruption.
During the Eyjafjallajökull eruption, the need for a pre-defined plan ensuring fast and effective analysis and eruption product characterization became more apparent than ever before. Due to remoteness of most Icelandic volcanoes, teams of experts are required to go out into the field to assess the first impact of the eruption. For this the IES teams are trained to safely ensure scientific sampling during the eruption. The observers at manned weather stations are also responsible for sampling ash during eruptions. The samples are sent via IMO to IES for analysis. IMO is re-evaluating the working procedure in collaboration with IES. However, the 2010 Eyjafjallajökull eruption showed that more sophisticated portable equipment is needed so that analytical results can be provided more rapidly to modelers, forecasters and impact specialists (e.g. health and agriculture).
At present, the IES in collaboration with IMO is planning a major advance in rapid field sampling and tephra characterization through the development of a mobile laboratory, which can be employed with less than one hour’s notice. This mobile lab is expected to consist of the following components: (1) a petrographic optical microscope, (2) a small desktop Scanning Electron Microscope (SEM) for fast analysis of tephra grain morphology which throws light on fragmentation processes, (3) hand-held energy dispersive X-ray fluorescence spectrometers for real time major element analysis, (4) sieves for grain size analysis, (5)
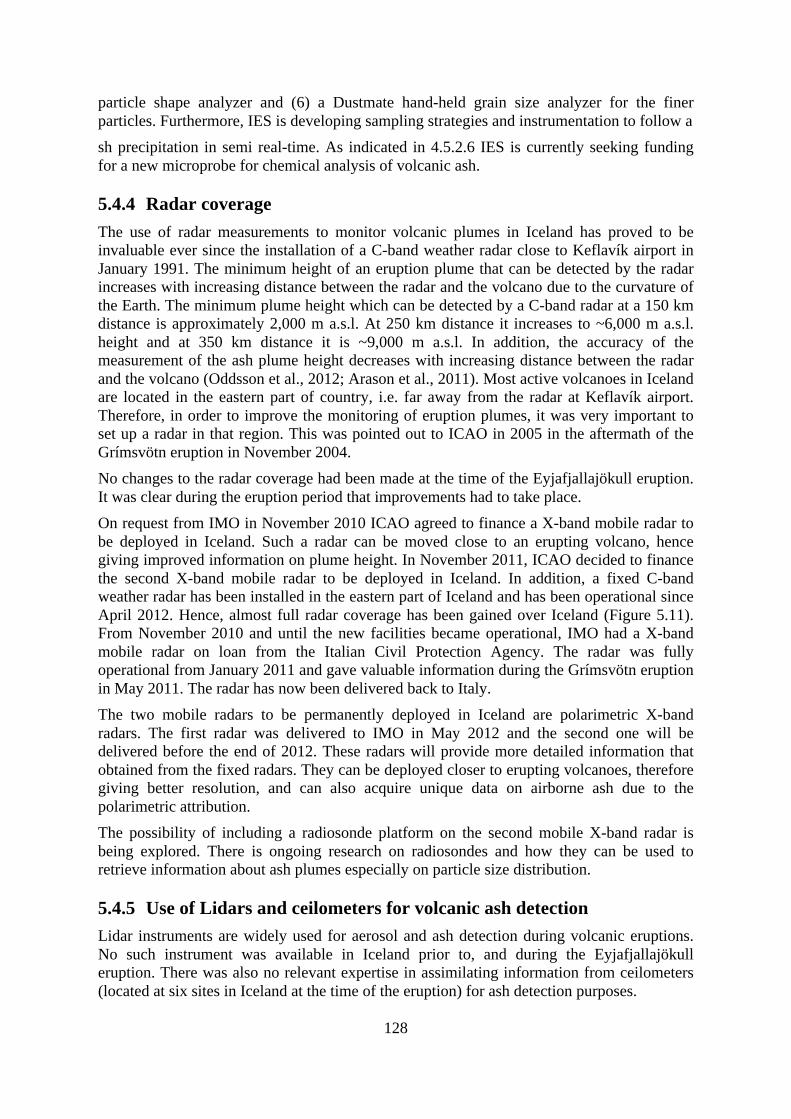
128
particle shape analyzer and (6) a Dustmate hand-held grain size analyzer for the finer particles. Furthermore, IES is developing sampling strategies and instrumentation to follow a sh precipitation in semi real-time. As indicated in 4.5.2.6 IES is currently seeking funding for a new microprobe for chemical analysis of volcanic ash.
5.4.4 Radar coverage The use of radar measurements to monitor volcanic plumes in Iceland has proved to be invaluable ever since the installation of a C-band weather radar close to Keflavík airport in January 1991. The minimum height of an eruption plume that can be detected by the radar increases with increasing distance between the radar and the volcano due to the curvature of the Earth. The minimum plume height which can be detected by a C-band radar at a 150 km distance is approximately 2,000 m a.s.l. At 250 km distance it increases to ~6,000 m a.s.l. height and at 350 km distance it is ~9,000 m a.s.l. In addition, the accuracy of the measurement of the ash plume height decreases with increasing distance between the radar and the volcano (Oddsson et al., 2012; Arason et al., 2011). Most active volcanoes in Iceland are located in the eastern part of country, i.e. far away from the radar at Keflavík airport. Therefore, in order to improve the monitoring of eruption plumes, it was very important to set up a radar in that region. This was pointed out to ICAO in 2005 in the aftermath of the Grímsvötn eruption in November 2004. No changes to the radar coverage had been made at the time of the Eyjafjallajökull eruption. It was clear during the eruption period that improvements had to take place. On request from IMO in November 2010 ICAO agreed to finance a X-band mobile radar to be deployed in Iceland. Such a radar can be moved close to an erupting volcano, hence giving improved information on plume height. In November 2011, ICAO decided to finance the second X-band mobile radar to be deployed in Iceland. In addition, a fixed C-band weather radar has been installed in the eastern part of Iceland and has been operational since April 2012. Hence, almost full radar coverage has been gained over Iceland (Figure 5.11). From November 2010 and until the new facilities became operational, IMO had a X-band mobile radar on loan from the Italian Civil Protection Agency. The radar was fully operational from January 2011 and gave valuable information during the Grímsvötn eruption in May 2011. The radar has now been delivered back to Italy. The two mobile radars to be permanently deployed in Iceland are polarimetric X-band radars. The first radar was delivered to IMO in May 2012 and the second one will be delivered before the end of 2012. These radars will provide more detailed information that obtained from the fixed radars. They can be deployed closer to erupting volcanoes, therefore giving better resolution, and can also acquire unique data on airborne ash due to the polarimetric attribution. The possibility of including a radiosonde platform on the second mobile X-band radar is being explored. There is ongoing research on radiosondes and how they can be used to retrieve information about ash plumes especially on particle size distribution.
5.4.5 Use of Lidars and ceilometers for volcanic ash detection Lidar instruments are widely used for aerosol and ash detection during volcanic eruptions. No such instrument was available in Iceland prior to, and during the Eyjafjallajökull eruption. There was also no relevant expertise in assimilating information from ceilometers (located at six sites in Iceland at the time of the eruption) for ash detection purposes.
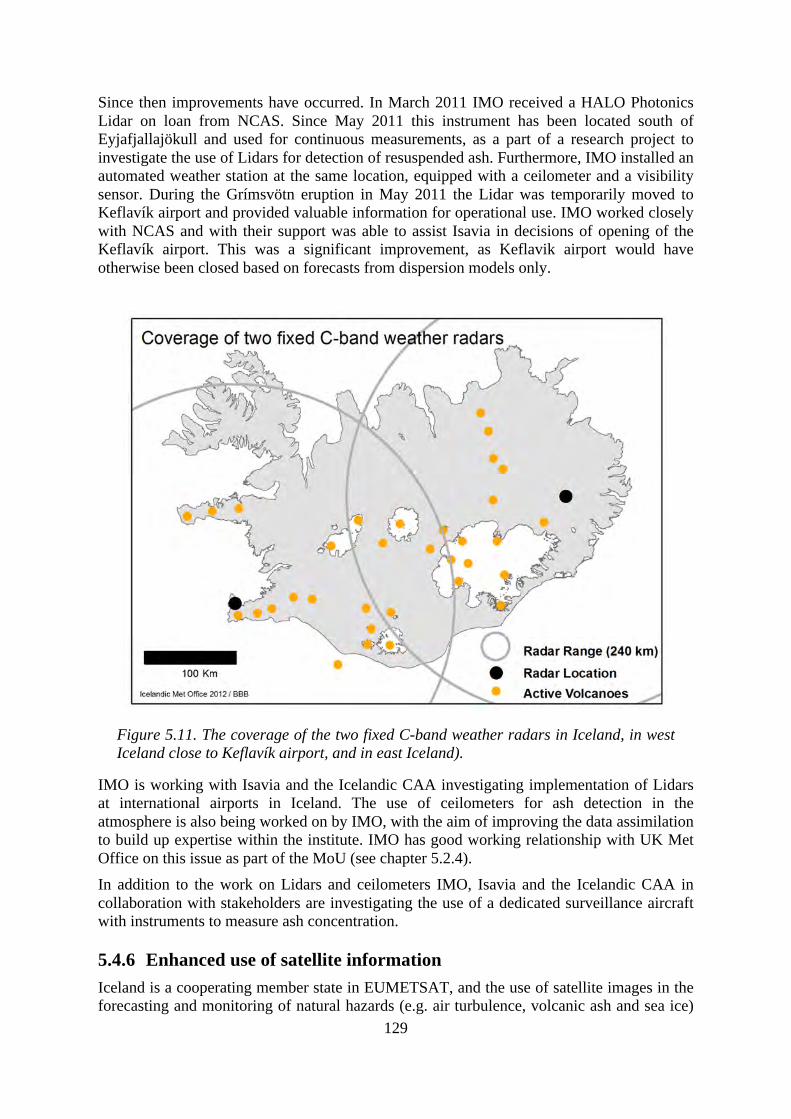
129
Since then improvements have occurred. In March 2011 IMO received a HALO Photonics Lidar on loan from NCAS. Since May 2011 this instrument has been located south of Eyjafjallajökull and used for continuous measurements, as a part of a research project to investigate the use of Lidars for detection of resuspended ash. Furthermore, IMO installed an automated weather station at the same location, equipped with a ceilometer and a visibility sensor. During the Grímsvötn eruption in May 2011 the Lidar was temporarily moved to Keflavík airport and provided valuable information for operational use. IMO worked closely with NCAS and with their support was able to assist Isavia in decisions of opening of the Keflavík airport. This was a significant improvement, as Keflavik airport would have otherwise been closed based on forecasts from dispersion models only.
Figure 5.11. The coverage of the two fixed C-band weather radars in Iceland, in west Iceland close to Keflavík airport, and in east Iceland).
IMO is working with Isavia and the Icelandic CAA investigating implementation of Lidars at international airports in Iceland. The use of ceilometers for ash detection in the atmosphere is also being worked on by IMO, with the aim of improving the data assimilation to build up expertise within the institute. IMO has good working relationship with UK Met Office on this issue as part of the MoU (see chapter 5.2.4). In addition to the work on Lidars and ceilometers IMO, Isavia and the Icelandic CAA in collaboration with stakeholders are investigating the use of a dedicated surveillance aircraft with instruments to measure ash concentration.
5.4.6 Enhanced use of satellite information Iceland is a cooperating member state in EUMETSAT, and the use of satellite images in the forecasting and monitoring of natural hazards (e.g. air turbulence, volcanic ash and sea ice)
130
is a part of the daily working procedures at the IMO. During the eruption of Eyjafjallajökul the use of weather satellite images proved indispensable in monitoring volcanic ash dispersion and in verifying ash dispersion predictions. Valuable experience was gained from the eruption and this has led to improvements in monitoring methods and technology. The IMO has already implemented numerous changes and a few more are still in process.
Since 2010 the IMO has implemented routines for the detection of anomalies in satellite thermal images. Real-time thermal anomaly detection is useful during the initial hours of an eruption as a confirmation and as an evaluation on the evolution and scope of an eruption. Thermal anomaly detection will become more advantageous as more advanced thermal imaging instruments will become available to the IMO in real time. IMO has worked on improving the sensitivity of the basic satellite Brightness Temperature Difference (BTD) detection of ash aerosol by taking account of the thermal gradient characteristics of the BTD at high and low optical thickness. The EUMETSAT Satellite Application Facilities (SAF) are now working on incorporating thermal IR ash aerosol loading products for both polar and geostationary weather satellites. The IMO plans to make full use of these products and algorithms as they become available. An ongoing development at the IMO is to combine satellite ash detection and backwards runs of an ash dispersion model in order to give constraint on the ash cloud height – in essence using weather information to exclude impossible or improbable ash cloud-heights. Initial experiments suggest there is great synergy between the dispersion modeling and satellite observations which should lead to useful new analysis tools for the forecaster.
IMO is exploring avenues for acquiring a polar satellite earth observation reception for Iceland. Such a station would greatly increase the frequency and timeliness of access to remote sensing observations of Iceland, improving all aspects of satellite monitoring at the IMO and the VAAC, but would also greatly benefit the greater community taking part in hazard monitoring and prediction.
5.4.7 Increase in human resources at IMO in volcano science and monitoring
IMO is mandated by Icelandic legislation to monitor and issue forecast and warnings in the field of meteorology, hydrology, glaciology, seismology and volcanology. Additionally IMO is a selected State Volcano Observatory by CAA-Iceland nomination. In that context and as a follow up of the Eyjafjallajökull eruption, ICAO financed three permanent positions at IMO i.e. radar specialist, volcanologist, and meteorologist, with special emphasis on dispersion of volcanic ash in the atmosphere. These specialists will enhance the capability of the institute to deal with issues and tasks related to volcanic eruptions, prior-, during- and post eruptions. One of the main tasks is to mitigate the effect of volcanic eruptions in Iceland and for the aviation community.
5.5 Further plans
Author: SK As discussed in chapter 5.4 several improvements have taken place regarding the geophysical measurements and observations of a volcanic plume height. Several other actions have taken place that improve the response to future eruptions in Iceland.
131
5.5.1 Risk assessment of volcanic eruptions in Iceland The Icelandic government approved on 26 August 2011 a proposal by the Minister for the Environment to initiate a general risk assessment of volcanic eruptions in Iceland. The proposal was based on an appraisal made by jointly by IMO, NCIP-DCPEM, IES, the Soil Conservation Service of Iceland and the Icelandic Road Administration. The general risk assessment will be organized in accordance with the risk assessment framework of the United Nations and the World Meteorological Organization (www.unisdr.org). It is estimated to be completed in 15–20 years and will require a joint effort of various institutions. The initial three years have been financed and will focus on the following tasks:
• An appraisal of the current knowledge • Initial assessment of floods related to eruptions • Initial assessment of explosive eruptions in Iceland • Initial assessment of volcanic eruptions in high-risk areas, i.e. in the vicinity of urban
areas and international airports in Iceland
The first task is largely financed by ICAO and will focus on reviewing the information catalogue on Icelandic volcanoes with the aim to improve the knowledge about source parameters and behavior of the volcanoes. In addition to gather information in a catalogue, information about ash particle grain-size distribution will be gathered and scenarios set up for each volcano if possible. This information will not only improve the input data into dispersion models followed by improved output but as well be beneficial to operational use.
In addition to the government funding and the funding by ICAO, Isavia, the Icelandic Road Administration, and Landsvirkjun, the national power company, supply funding.
5.5.2 Research projects Several research projects focusing on advancing the understanding of volcanic eruptions, and on improving best practices in volcano monitoring have been funded since the Eyjafjallajökull eruption, or are currently under consideration by funding bodies. One of the overarching aims is to improve preparedness and reactions during volcanic eruptions. Two large projects are discussed here in some detail. Chapter 6 contains a list of many more projects which started after the eruption.
5.5.2.1 WEZARD (WEather HaZARD for aeronautics) WEZARD (WEather HaZARD for aeronautics) is an EU FP7 Coordinated Support Action, which was initiated in July 2011 for a 2-year period. The objective is to support and contribute to the preparation of future community research in the field of robustness of the air transport system when faced with weather hazards which can be spread over very large areas. The main hazards under review are volcanic ash and icing (Supercooled Large Droplet (SLD), mixed phase or ice crystals). Strategic supervision of WEZARD is being led by Airbus Operations SAS, and partners include stakeholders from the aviation industry, meteorological agencies, regulatory authorities and research communities. EUMETNET, a grouping of 29 European National Meteorological Services, is leading work package 3 (WP3), which deals with the meteorological aspects. This aims at improving: data usage, observation capabilities, atmospheric model initialization, assimilation and outputs, and coordination and user focus.
132
In-depth reviews will document the ‘state of the art’, needs and requirements, and perform a gap analysis for volcanic ash and icing topics. One part of WP3 encompasses geophysical monitoring capabilities and systems, as these identify precursors of volcanic eruptions and changes occurring during the eruption period. The key deliverable for WEZARD is a comprehensive R&D roadmap that will identify the gaps between the needs and the ongoing research activities and define recommendations to establish future research priorities for the EU. This study should also identify and improve synergies that may emerge from existing R&D projects or programs.
5.5.2.2 FUTUREVOLC FUTUREVOLC (A European volcanological supersite in Iceland: a monitoring system and network for the future) is a cross-disciplinary European consortium of volcanological researchers and hazard managers collaborating to mitigate the effects of major volcanic eruptions that pose cross-border hazards. The aim of this consortium is to establish best practices framework for multi-parameter monitoring of volcanic hazards, and to develop a prototype for the next generation of long-term volcano monitoring, through the merging of various, presently disconnected monitoring efforts into one integrated national and regional effort.
The project, lead jointly by IES and IMO, combines a team of experts in seismology, volcano deformation, volcanic gas and geochemistry, infrasound, eruption monitoring, physical volcanology, satellite studies of volcanic plumes, meteorology, ash dispersal forecasting, and civil defense. Through the development of advanced monitoring and analytical techniques, this team will collaborate to improve our understanding of magma movements, storage and evolution, of eruption triggers, and the dynamics of volcanic processes during eruptions. The new developments in observational technology and near real-time processing will enable seamless and fully integrated tracking of magma from the initial onset of movement at depth in the crust, to modeling, forecasting and monitoring gas and ash fall on local, regional and global scale. The project application got the highest possible score during the evaluation stage and is now under negotiation with EU FP7 which is expected to be finalized in July 2012.
REFERENCES Allard, P., Burton, M., Oskarsson, N., Michel, A. & Polacci, M. (2010). Chemistry and
fluxes of magmatic gases powering the explosive trachyandesitic phase of Eyjafjallajokull 2010 eruption: constraints on degassing magma volumes and processes, AGU Fall Meeting, V53F-07, 2010
Arason, Th., Björnsson, H. & Petersen, G. N. (2011). Plume-top altitudes during the Eyjafjallajökull 2010 eruption, presented at European Geosciences Union, General Assembly 2011, abstract EGU2011-7978.
Atmospheric Chemistry and Physics (2010, 2011, 2012). Atmospheric implications of the volcanic eruptions of Eyjafjallajökull, Iceland 2010. Edited by C. Bay Hasager, W. Birmili, G. Pappalardo, and F. Prata. Volumes 10, 11, and 12. http://www.atmos-chem-phys.net/special_issue212.html.
Atmospheric Environment (2012). Volcanic ash over Europe during the eruption of Eyjafjallajöekull on Iceland, April-May 2010. Vol. 48, p.1-240. Edited by B. Langmann,
133
L. Alados Arboledas, A. Folch and V. Matthias http://www.sciencedirect.com/science/journal/13522310/
Bonadonna, C. & Costa, A. (accepted for publication). Estimating the volume of tephra deposits: A new simple strategy. Geology. doi: 10.1130/G32769.1.
Carn, S. A., Wang, J., Yang, K. & Krotkov, N. A. (2010). Sulfur Budget of the 2010 Eyjafjallajökull Eruption Derived From Satellite Observations. American Geophysical Union, Fall Meeting 2010, abstract #V53F-08.
Carey, R.J., Houghton, B., Thordarson, T. (2010). Tephra dispersal and eruption dynamics of wet and dry phases of the 1875 eruption of Askja volcano, Iceland. Bull. Volcanol., 72, 259-278.
Costa, J.E. (1988). Floods from dam failures, in: Flood Geomorphology, edited by Baker, V.R., Kochel, R.C., and Patton, P.C., pp. 439–463, John Wiley, New York.
Dellino, P., Guðmundsson, M. T., Larsen, G., Mele, D., Stevenson, J. A., Thordarson, T. & Zimanowski, B. (2012). Ash from the Eyjafjallajökull eruption (Iceland): Fragmentation processes and aerodynamic behavior. Journal of Geophysical Research, vol. 117, 10 pp.
Grönvold, K., Larsen, G., Einarsson, P., Thorarinsson, S. & Saemundsson, K. (1983). The Hekla eruption 1980-1981. Bull. Volcanol., 46, 349-363.
Guðmundsson, M.T. (2005). Subglacial volcanic activity in Iceland. In: Caseldine, C.J., Russell, A., Hardardóttir, J., and Knudsen, Ó. (ed.): Iceland: Modern Processes, Past Environments, Elsevier, 127-151.
Guðmundsson, M.T., Thordarson, T., Höskuldsson, Á., Larsen, G., Björnsson, H., Prata, A.J. et al. (2012). Ash generation and distribution from the April-May 2010 eruption of Eyjafjallajökull, Iceland. Scientific Reports, in review.
Jones, A. R., Thomson, D. J., Hort, M. & Devenish, B. (2007). 'The U.K. Met Office's next-generation atmospheric dispersion model, NAME III', in Borrego, C. and Norman, A.-L. (Eds) Air Pollution Modeling and its Application XVII (Proceedings of the 27th NATO/CCMS International Technical Meeting on Air Pollution Modeling and its Application), Springer, pp. 580-589.
Journal of Geophysical Research (2011, 2012). The Eyjafjallajökull Volcanic Eruption in 2010. Volumes 116 and 117. http://www.agu.org/contents/sc/ViewCollection. do?collectionCode=ICEVOLCAN1.
Jude-Eton, T., Thordarson, T., Guðmundsson, M.T. & Oddsson, B., (2012). Dynamics, Stratigraphy, and Proximal Dispersal of Supraglacial Tephra during the Ice-confined 2004 Eruption at Grímsvötn Volcano, Iceland based on field, observational, and tremor data. Bull. Volcanol. DOI: 10.1007/s00445-012-0583-3.
Keiding, J. K., & Sigmarsson, O. (2012). Geothermobarometry of the 2010 Eyjafjallajökull eruption – New constraints on Icelandic magma plumbing systems. J. Geophys. Res., doi: 10.10.29/2011JB008829, in press.
Leadbetter, S. J., Hort, M.C., von Löwis, S., Weber, K. & Witham, C. S. (2012). Modeling the resuspension of ash deposited during the eruption of Eyjafjallajökull in spring 2010, J.Geophys. Res. Vol. 117, D00U10, 13 pp, 2012 doi:10.1029/2011JD016802.
Magnússon, E., Guðmundsson, M. T., Roberts, M. J., Sigurðsson, G., Höskuldsson, F. & Oddsson, B. (submitted) Ice-volcano interactions during the 2010 Eyjafjallajökull eruption, as revealed by airborne radar. Journal of Geophysical Research (Solid Earth).
Oddsson, B., Guðmundsson, M.T., Larsen, G. & Karlsdóttir, S. (2012). Monitoring the plume from the basaltic phreatomagmatic 2004 Grímsvötn eruption – application of weather radar and comparison with plume models. Bull. Volc. DOI:10.1007/s00445-012-0598-9.
134
Sigmarsson, O., Vlastelic, I., Andreasen, R., Bindeman, I., Devidal, J-L., Moune, S. et (2011). Remobilization of silicic intrusion by mafic magmas during the 2010 Eyjafjallajökull eruption. Solid Earth 2, 271-281.
Sigmundsson, F., Hreinsdóttir, S., Hooper, A., Árnadóttir, Th., Pedersen, R., Roberts, M. J., Óskarsson, N., Auriac, A., Decriem, J., Einarsson, P., Geirsson, H., Hensch, M,, Ófeigsson, B. G., Sturkell, E., Sveinbjörnsson, H. & Feigl, K. (2010). Intrusion triggering of the 2010 Eyjafjallajökull explosive eruption, Nature, 468, pp. 426-430, doi: 10.1038/nature09558.
Slunga, R., Rögnvaldsson, S. Th. & Bödvarsson, R. (1995). Absolute and relative locations of similar events with application to microearthquakes in southern Iceland, Geophys. J. Int. 123, 409-419.
Taddeucci, J, Scarlato, P., Montanaro, C., Cimarelli, C., Del Bello, E., Freda, C., Andronico, D., Guðmundsson, M. T., & Dingwell, D.B. (2011). Aggregation-dominated ash settling from the Eyjafjallajökull volcanic cloud illuminated by field and laboratory high-speed imaging. Geology, 39, 891-894.
Thorarinsson, S. (1958). The Öræfajökull eruption of 1362. Acta Nat. Islandica, 2, 1-100. Thordarson, T. & Larsen, G. (2007). Volcanism in Iceland in historical time: Volcano types,
eruption styles and eruptive history. J. Geodyn., 43, 118-152. Webster, H. N., Thomson, D., Johnson, B. T., Heard, I. P. C., Turnbull, K. F., Marenco, F. et
al. (2012). Operational prediction of ash concentrations in the distal volcanic cloud from the 2010 Eyjafjallajokull eruption, Journal of Geophysical Research, doi:10.1029/2011JD016790, 117, D00U08.
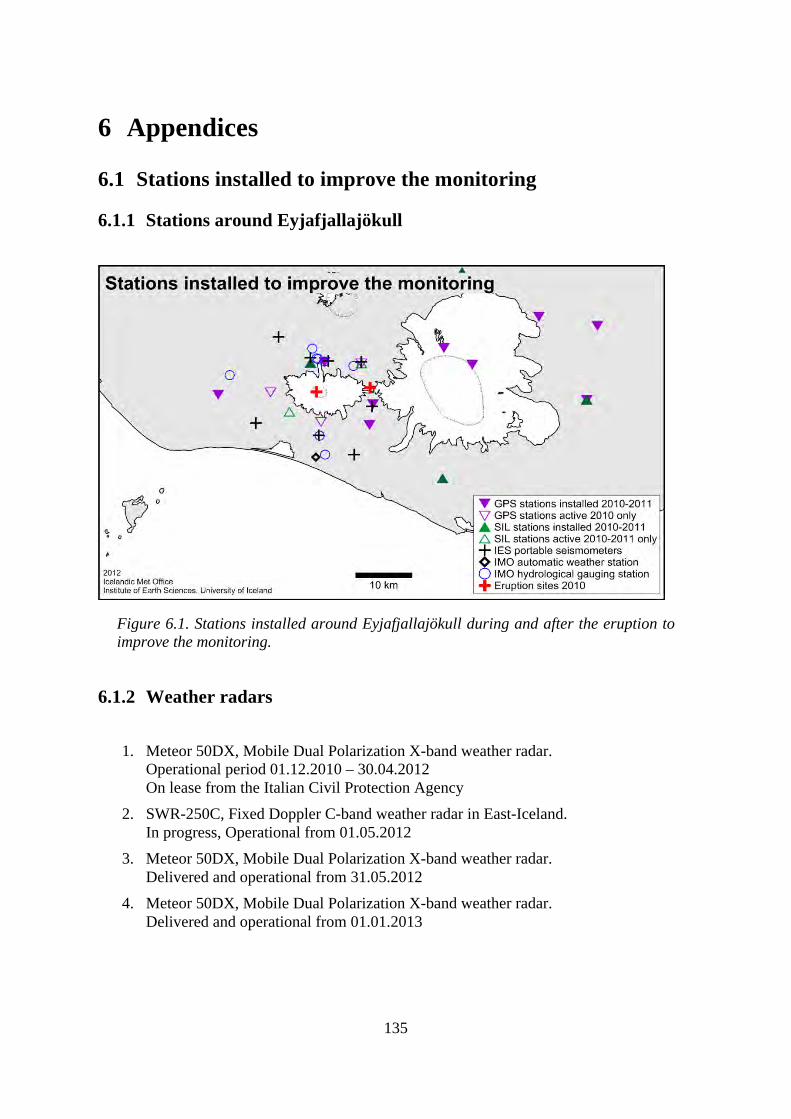
135
6 Appendices
6.1 Stations installed to improve the monitoring
6.1.1 Stations around Eyjafjallajökull
Figure 6.1. Stations installed around Eyjafjallajökull during and after the eruption to improve the monitoring.
6.1.2 Weather radars
1. Meteor 50DX, Mobile Dual Polarization X-band weather radar. Operational period 01.12.2010 – 30.04.2012 On lease from the Italian Civil Protection Agency
2. SWR-250C, Fixed Doppler C-band weather radar in East-Iceland. In progress, Operational from 01.05.2012
3. Meteor 50DX, Mobile Dual Polarization X-band weather radar. Delivered and operational from 31.05.2012
4. Meteor 50DX, Mobile Dual Polarization X-band weather radar. Delivered and operational from 01.01.2013
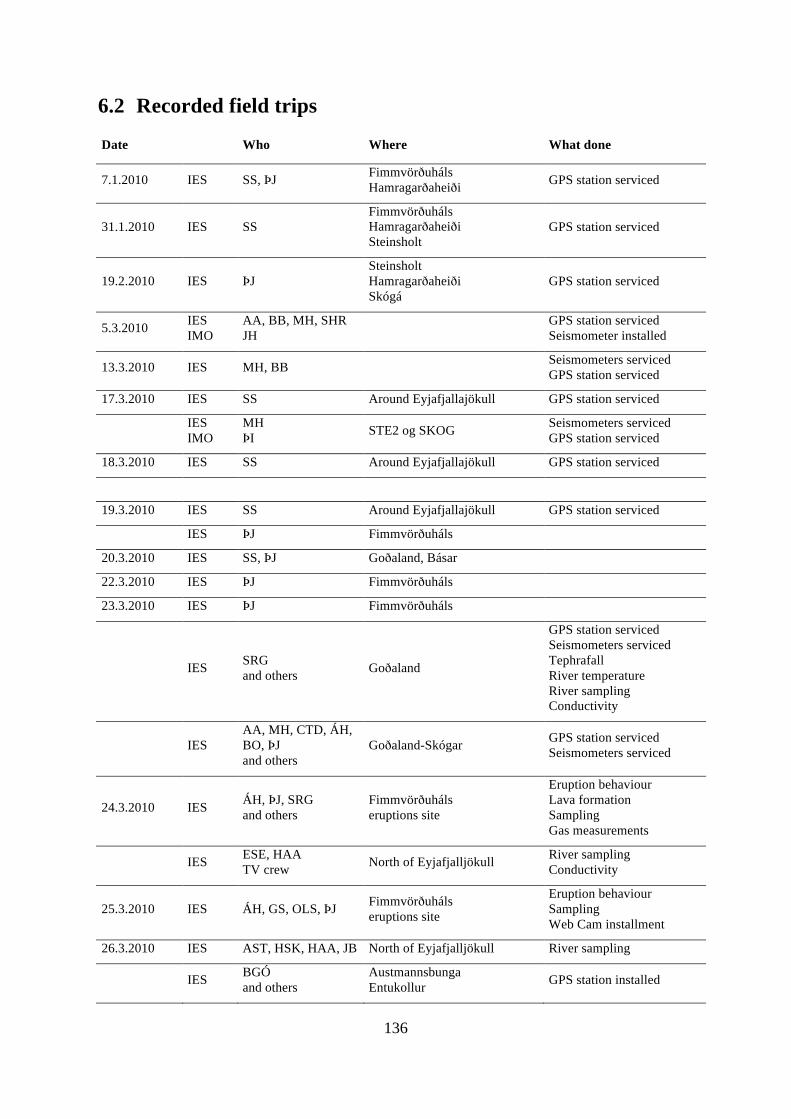
136
6.2 Recorded field trips
Date Who Where What done
7.1.2010 IES SS, ÞJ Fimmvörðuháls Hamragarðaheiði GPS station serviced
31.1.2010 IES SS Fimmvörðuháls Hamragarðaheiði Steinsholt
GPS station serviced
19.2.2010 IES ÞJ Steinsholt Hamragarðaheiði Skógá
GPS station serviced
5.3.2010 IES IMO
AA, BB, MH, SHR JH GPS station serviced
Seismometer installed
13.3.2010 IES MH, BB Seismometers serviced GPS station serviced
17.3.2010 IES SS Around Eyjafjallajökull GPS station serviced
IES IMO
MH ÞI STE2 og SKOG Seismometers serviced
GPS station serviced
18.3.2010 IES SS Around Eyjafjallajökull GPS station serviced
19.3.2010 IES SS Around Eyjafjallajökull GPS station serviced
IES ÞJ Fimmvörðuháls
20.3.2010 IES SS, ÞJ Goðaland, Básar
22.3.2010 IES ÞJ Fimmvörðuháls
23.3.2010 IES ÞJ Fimmvörðuháls
IES SRG and others Goðaland
GPS station serviced Seismometers serviced Tephrafall River temperature River sampling Conductivity
IES AA, MH, CTD, ÁH, BO, ÞJ and others
Goðaland-Skógar GPS station serviced Seismometers serviced
24.3.2010 IES ÁH, ÞJ, SRG and others
Fimmvörðuháls eruptions site
Eruption behaviour Lava formation Sampling Gas measurements
IES ESE, HAA TV crew North of Eyjafjalljökull River sampling
Conductivity
25.3.2010 IES ÁH, GS, OLS, ÞJ Fimmvörðuháls eruptions site
Eruption behaviour Sampling Web Cam installment
26.3.2010 IES AST, HSK, HAA, JB North of Eyjafjalljökull River sampling
IES BGÓ and others
Austmannsbunga Entukollur GPS station installed
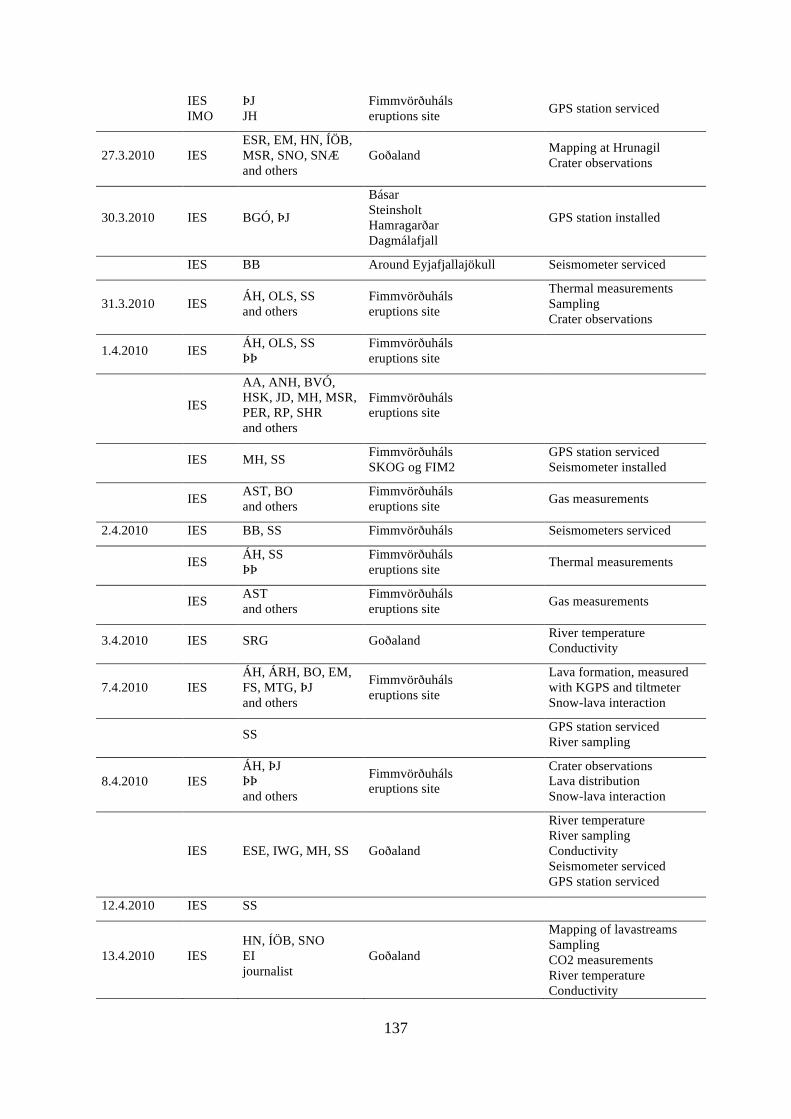
137
IES IMO
ÞJ JH
Fimmvörðuháls eruptions site GPS station serviced
27.3.2010 IES ESR, EM, HN, ÍÖB, MSR, SNO, SNÆ and others
Goðaland Mapping at Hrunagil Crater observations
30.3.2010 IES BGÓ, ÞJ
Básar Steinsholt Hamragarðar Dagmálafjall
GPS station installed
IES BB Around Eyjafjallajökull Seismometer serviced
31.3.2010 IES ÁH, OLS, SS and others
Fimmvörðuháls eruptions site
Thermal measurements Sampling Crater observations
1.4.2010 IES ÁH, OLS, SS ÞÞ
Fimmvörðuháls eruptions site
IES
AA, ANH, BVÓ, HSK, JD, MH, MSR, PER, RP, SHR and others
Fimmvörðuháls eruptions site
IES MH, SS Fimmvörðuháls SKOG og FIM2
GPS station serviced Seismometer installed
IES AST, BO and others
Fimmvörðuháls eruptions site Gas measurements
2.4.2010 IES BB, SS Fimmvörðuháls Seismometers serviced
IES ÁH, SS ÞÞ
Fimmvörðuháls eruptions site Thermal measurements
IES AST and others
Fimmvörðuháls eruptions site Gas measurements
3.4.2010 IES SRG Goðaland River temperature Conductivity
7.4.2010 IES ÁH, ÁRH, BO, EM, FS, MTG, ÞJ and others
Fimmvörðuháls eruptions site
Lava formation, measured with KGPS and tiltmeter Snow-lava interaction
SS GPS station serviced River sampling
8.4.2010 IES ÁH, ÞJ ÞÞ and others
Fimmvörðuháls eruptions site
Crater observations Lava distribution Snow-lava interaction
IES ESE, IWG, MH, SS Goðaland
River temperature River sampling Conductivity Seismometer serviced GPS station serviced
12.4.2010 IES SS
13.4.2010 IES HN, ÍÖB, SNO EI journalist
Goðaland
Mapping of lavastreams Sampling CO2 measurements River temperature Conductivity
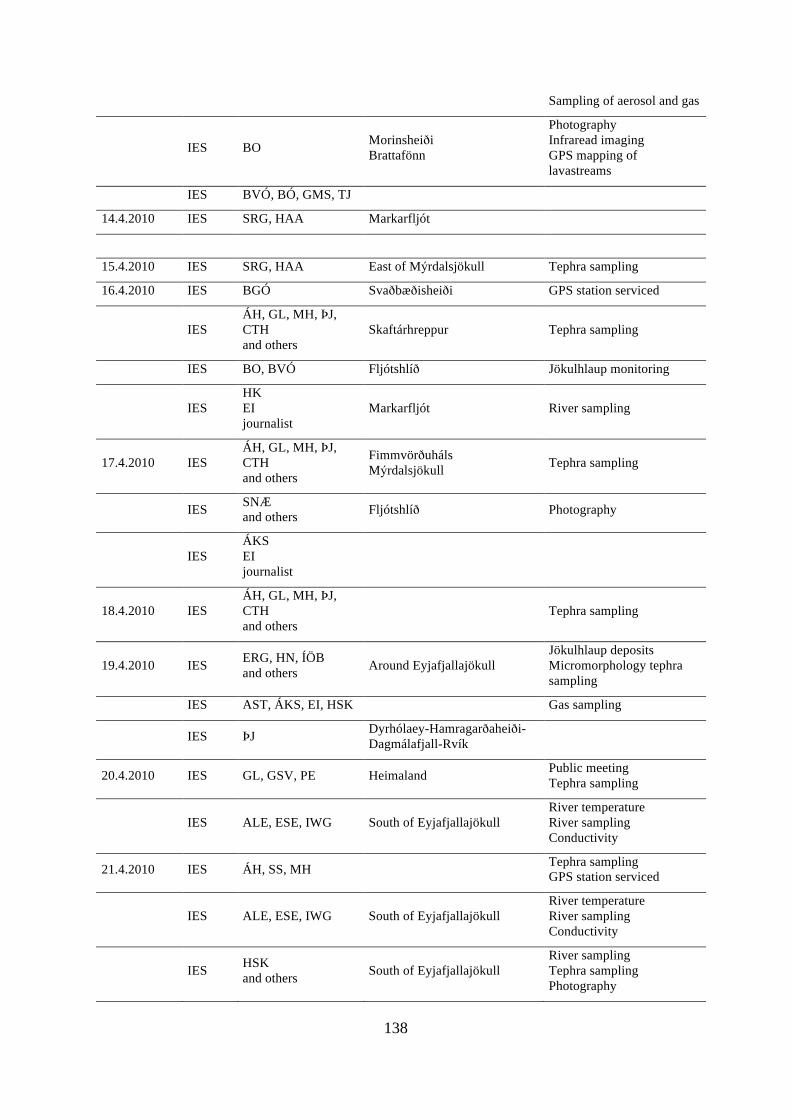
138
Sampling of aerosol and gas
IES BO Morinsheiði Brattafönn
Photography Infraread imaging GPS mapping of lavastreams
IES BVÓ, BÓ, GMS, TJ
14.4.2010 IES SRG, HAA Markarfljót
15.4.2010 IES SRG, HAA East of Mýrdalsjökull Tephra sampling
16.4.2010 IES BGÓ Svaðbæðisheiði GPS station serviced
IES ÁH, GL, MH, ÞJ, CTH and others
Skaftárhreppur Tephra sampling
IES BO, BVÓ Fljótshlíð Jökulhlaup monitoring
IES HK EI journalist
Markarfljót River sampling
17.4.2010 IES ÁH, GL, MH, ÞJ, CTH and others
Fimmvörðuháls Mýrdalsjökull Tephra sampling
IES SNÆ and others Fljótshlíð Photography
IES ÁKS EI journalist
18.4.2010 IES ÁH, GL, MH, ÞJ, CTH and others
Tephra sampling
19.4.2010 IES ERG, HN, ÍÖB and others Around Eyjafjallajökull
Jökulhlaup deposits Micromorphology tephra sampling
IES AST, ÁKS, EI, HSK Gas sampling
IES ÞJ Dyrhólaey-Hamragarðaheiði- Dagmálafjall-Rvík
20.4.2010 IES GL, GSV, PE Heimaland Public meeting Tephra sampling
IES ALE, ESE, IWG South of Eyjafjallajökull River temperature River sampling Conductivity
21.4.2010 IES ÁH, SS, MH Tephra sampling GPS station serviced
IES ALE, ESE, IWG South of Eyjafjallajökull River temperature River sampling Conductivity
IES HSK and others South of Eyjafjallajökull
River sampling Tephra sampling Photography
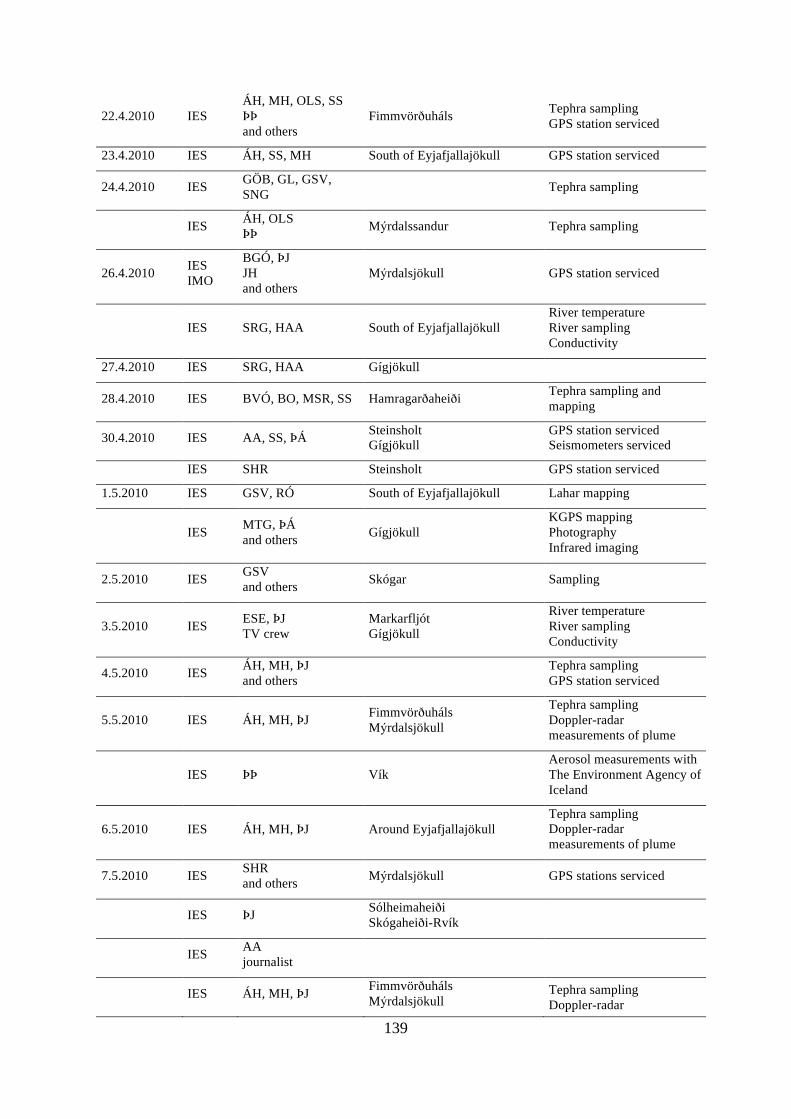
139
22.4.2010 IES ÁH, MH, OLS, SS ÞÞ and others
Fimmvörðuháls Tephra sampling GPS station serviced
23.4.2010 IES ÁH, SS, MH South of Eyjafjallajökull GPS station serviced
24.4.2010 IES GÖB, GL, GSV, SNG Tephra sampling
IES ÁH, OLS ÞÞ Mýrdalssandur Tephra sampling
26.4.2010 IES IMO
BGÓ, ÞJ JH and others
Mýrdalsjökull GPS station serviced
IES SRG, HAA South of Eyjafjallajökull River temperature River sampling Conductivity
27.4.2010 IES SRG, HAA Gígjökull
28.4.2010 IES BVÓ, BO, MSR, SS Hamragarðaheiði Tephra sampling and mapping
30.4.2010 IES AA, SS, ÞÁ Steinsholt Gígjökull
GPS station serviced Seismometers serviced
IES SHR Steinsholt GPS station serviced
1.5.2010 IES GSV, RÓ South of Eyjafjallajökull Lahar mapping
IES MTG, ÞÁ and others Gígjökull
KGPS mapping Photography Infrared imaging
2.5.2010 IES GSV and others Skógar Sampling
3.5.2010 IES ESE, ÞJ TV crew
Markarfljót Gígjökull
River temperature River sampling Conductivity
4.5.2010 IES ÁH, MH, ÞJ and others Tephra sampling
GPS station serviced
5.5.2010 IES ÁH, MH, ÞJ Fimmvörðuháls Mýrdalsjökull
Tephra sampling Doppler-radar measurements of plume
IES ÞÞ Vík Aerosol measurements with The Environment Agency of Iceland
6.5.2010 IES ÁH, MH, ÞJ Around Eyjafjallajökull Tephra sampling Doppler-radar measurements of plume
7.5.2010 IES SHR and others Mýrdalsjökull GPS stations serviced
IES ÞJ Sólheimaheiði Skógaheiði-Rvík
IES AA journalist
IES ÁH, MH, ÞJ Fimmvörðuháls Mýrdalsjökull
Tephra sampling Doppler-radar
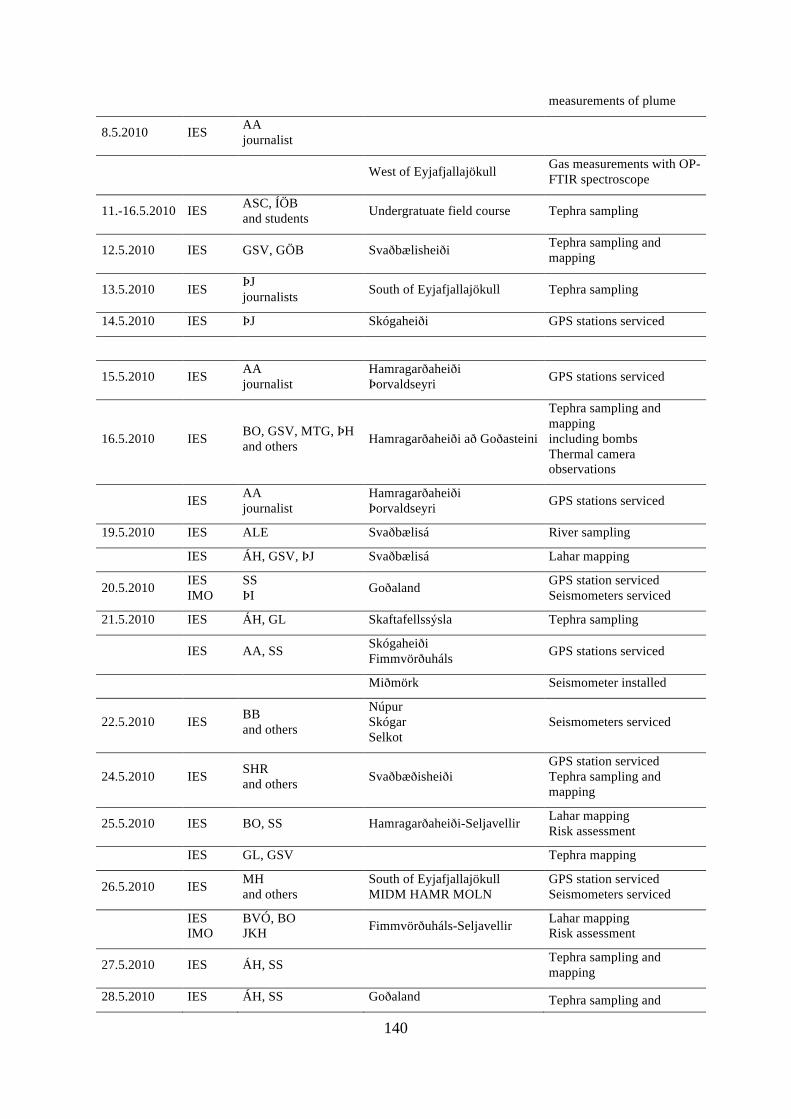
140
measurements of plume
8.5.2010 IES AA journalist
West of Eyjafjallajökull Gas measurements with OP-FTIR spectroscope
11.-16.5.2010 IES ASC, ÍÖB and students Undergratuate field course Tephra sampling
12.5.2010 IES GSV, GÖB Svaðbælisheiði Tephra sampling and mapping
13.5.2010 IES ÞJ journalists South of Eyjafjallajökull Tephra sampling
14.5.2010 IES ÞJ Skógaheiði GPS stations serviced
15.5.2010 IES AA journalist
Hamragarðaheiði Þorvaldseyri GPS stations serviced
16.5.2010 IES BO, GSV, MTG, ÞH and others Hamragarðaheiði að Goðasteini
Tephra sampling and mapping including bombs Thermal camera observations
IES AA journalist
Hamragarðaheiði Þorvaldseyri GPS stations serviced
19.5.2010 IES ALE Svaðbælisá River sampling
IES ÁH, GSV, ÞJ Svaðbælisá Lahar mapping
20.5.2010 IES IMO
SS ÞI Goðaland GPS station serviced
Seismometers serviced
21.5.2010 IES ÁH, GL Skaftafellssýsla Tephra sampling
IES AA, SS Skógaheiði Fimmvörðuháls GPS stations serviced
Miðmörk Seismometer installed
22.5.2010 IES BB and others
Núpur Skógar Selkot
Seismometers serviced
24.5.2010 IES SHR and others Svaðbæðisheiði
GPS station serviced Tephra sampling and mapping
25.5.2010 IES BO, SS Hamragarðaheiði-Seljavellir Lahar mapping Risk assessment
IES GL, GSV Tephra mapping
26.5.2010 IES MH and others
South of Eyjafjallajökull MIDM HAMR MOLN
GPS station serviced Seismometers serviced
IES IMO
BVÓ, BO JKH Fimmvörðuháls-Seljavellir Lahar mapping
Risk assessment
27.5.2010 IES ÁH, SS Tephra sampling and mapping
28.5.2010 IES ÁH, SS Goðaland Tephra sampling and
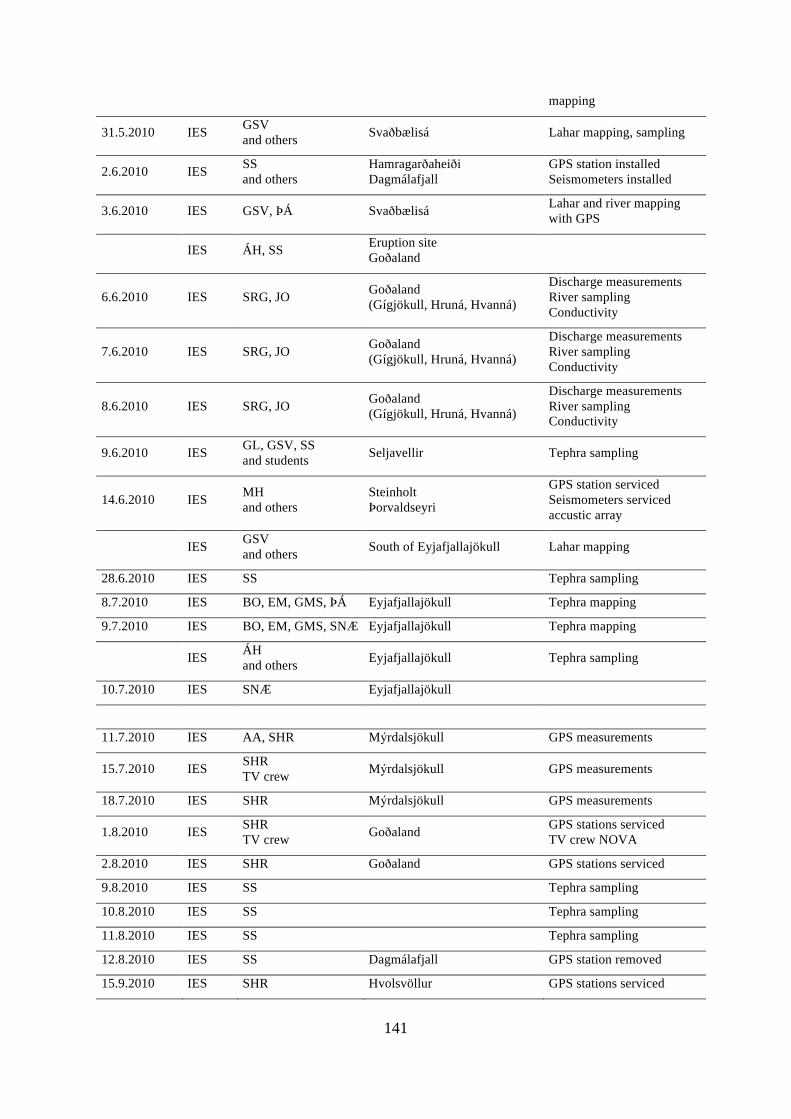
141
mapping
31.5.2010 IES GSV and others Svaðbælisá Lahar mapping, sampling
2.6.2010 IES SS and others
Hamragarðaheiði Dagmálafjall
GPS station installed Seismometers installed
3.6.2010 IES GSV, ÞÁ Svaðbælisá Lahar and river mapping with GPS
IES ÁH, SS Eruption site Goðaland
6.6.2010 IES SRG, JO Goðaland (Gígjökull, Hruná, Hvanná)
Discharge measurements River sampling Conductivity
7.6.2010 IES SRG, JO Goðaland (Gígjökull, Hruná, Hvanná)
Discharge measurements River sampling Conductivity
8.6.2010 IES SRG, JO Goðaland (Gígjökull, Hruná, Hvanná)
Discharge measurements River sampling Conductivity
9.6.2010 IES GL, GSV, SS and students Seljavellir Tephra sampling
14.6.2010 IES MH and others
Steinholt Þorvaldseyri
GPS station serviced Seismometers serviced accustic array
IES GSV and others South of Eyjafjallajökull Lahar mapping
28.6.2010 IES SS Tephra sampling
8.7.2010 IES BO, EM, GMS, ÞÁ Eyjafjallajökull Tephra mapping
9.7.2010 IES BO, EM, GMS, SNÆ Eyjafjallajökull Tephra mapping
IES ÁH and others Eyjafjallajökull Tephra sampling
10.7.2010 IES SNÆ Eyjafjallajökull
11.7.2010 IES AA, SHR Mýrdalsjökull GPS measurements
15.7.2010 IES SHR TV crew Mýrdalsjökull GPS measurements
18.7.2010 IES SHR Mýrdalsjökull GPS measurements
1.8.2010 IES SHR TV crew Goðaland GPS stations serviced
TV crew NOVA
2.8.2010 IES SHR Goðaland GPS stations serviced
9.8.2010 IES SS Tephra sampling
10.8.2010 IES SS Tephra sampling
11.8.2010 IES SS Tephra sampling
12.8.2010 IES SS Dagmálafjall GPS station removed
15.9.2010 IES SHR Hvolsvöllur GPS stations serviced

142
21.9.2010 IES AA, OLS TV crew South of Eyjafjallajökull GPS stations serviced
15.10.2010 IES MH, AA, BGÓ, RÓ HÓ
Fimmvörðuháls SKOG FIMM FIM2 GPS stations serviced
20.10.2010 IES SS Goðaland River sampling
IMO does not register field trips in the same way as IES and is therefore not able to provide a detailed list on the trips of its personnel. IMO´s personnel went on several field trips to the Eyjafjallajökull area before and during the eruption; installed new stations and serviced others, i.e. SIL-stations, GPS-stations, hydrological gauges, automatic weather stations and other.
6.3 Surveillance flights
Date Who Flight What done
19.3.2010 IES BVÓ, EM, FS, MTG, ÞH
Observation flight with the Icelandic Coast Guard (ICG), aeroplane TF-SIF
Test-flight High res. radar images Photography
21.3.2010 IES MTG Observation flight with ICG, helicopter TF-LIF
Eruption behaviour, site conformation, photography
IES BVÓ, EM, FS, SHR Observation flight with ICG, TF-SIF
Eruption behaviour Site conformation Photography High res. radar images
IES IMO
BO, HAS, MTG, ÞH SSJ, SHJ HAS
Observation flight with ICG, TF-SIF
Eruption behaviour Site conformation Photography High res. radar images
22.3.2010 IES IMO
EM, MTG, RP, ÞH KV Observation flight with ICG, TF-SIF
Eruption behaviour Photography High res. radar images
IES AA, CTH, MH, MSR, PER
Observation flight with Eagle Air Iceland Observation flight
IMO GNP, KHE Observation flight with ICG, TF-SIF Observation flight
24.3.2010 IES IMO
EM, MTG, ÞH GBG Observation flight with ICG, TF-SIF
Eruption behaviour Photography High res. radar images
26.3.2010 IES KVR, MTG, MSR, ÞÁ, KHR
Observation flight with Eagle Air Iceland
Eruption behaviour Photography
31.3.2010 IES IMO
ÁRH, EM, KBÓ, ÞH EHJ, HÍ, MJR, ÞS Observation flight with ICG, TF-SIF
Eruption behaviour Photography High res. radar images
7.4.2010 IES FP, HEB, HH, ÍÖB, SVG
Observation flight with Eagle Air Iceland
Eruption behaviour Photography
14.4.2010 IES EM, MTG, ÞH Observation flight with ICG, TF-SIF
Eruption behaviour Site conformation Photography High res. radar images
IES ÁH, EM, MTG, ÞH Observation flight with ICG, TF-SIF Eruption behaviour Photography High res. radar images
IMO ÓÞ Observation flight with ICG Photography
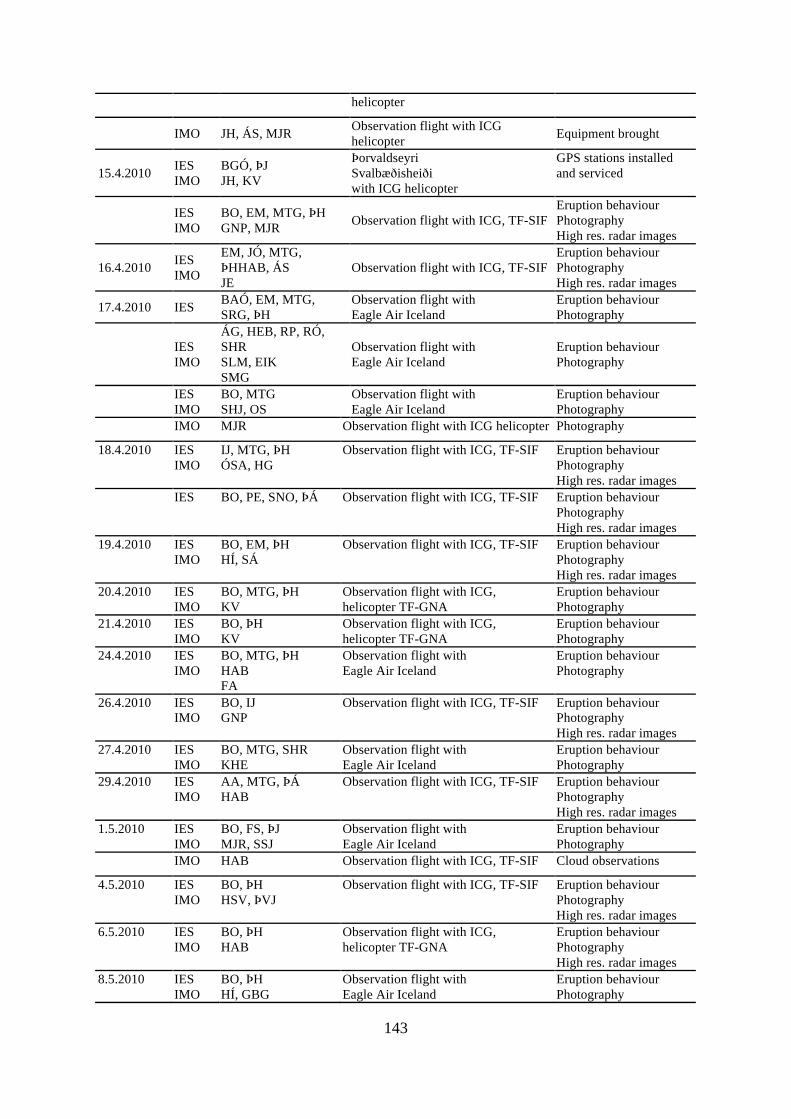
143
helicopter
IMO JH, ÁS, MJR Observation flight with ICG helicopter Equipment brought
15.4.2010 IES IMO
BGÓ, ÞJ JH, KV
Þorvaldseyri Svalbæðisheiði with ICG helicopter
GPS stations installed and serviced
IES IMO
BO, EM, MTG, ÞH GNP, MJR Observation flight with ICG, TF-SIF
Eruption behaviour Photography High res. radar images
16.4.2010 IES IMO
EM, JÓ, MTG, ÞHHAB, ÁS JE
Observation flight with ICG, TF-SIF Eruption behaviour Photography High res. radar images
17.4.2010 IES BAÓ, EM, MTG, SRG, ÞH
Observation flight with Eagle Air Iceland
Eruption behaviour Photography
IES IMO
ÁG, HEB, RP, RÓ, SHR SLM, EIK SMG
Observation flight with Eagle Air Iceland
Eruption behaviour Photography
IES IMO
BO, MTG SHJ, OS
Observation flight with Eagle Air Iceland
Eruption behaviour Photography
IMO MJR Observation flight with ICG helicopter Photography
18.4.2010 IES IMO
IJ, MTG, ÞH ÓSA, HG
Observation flight with ICG, TF-SIF Eruption behaviour Photography High res. radar images
IES BO, PE, SNO, ÞÁ Observation flight with ICG, TF-SIF Eruption behaviour Photography High res. radar images
19.4.2010 IES IMO
BO, EM, ÞH HÍ, SÁ
Observation flight with ICG, TF-SIF Eruption behaviour Photography High res. radar images
20.4.2010 IES IMO
BO, MTG, ÞH KV
Observation flight with ICG, helicopter TF-GNA
Eruption behaviour Photography
21.4.2010 IES IMO
BO, ÞH KV
Observation flight with ICG, helicopter TF-GNA
Eruption behaviour Photography
24.4.2010 IES IMO
BO, MTG, ÞH HAB FA
Observation flight with Eagle Air Iceland
Eruption behaviour Photography
26.4.2010 IES IMO
BO, IJ GNP
Observation flight with ICG, TF-SIF Eruption behaviour Photography High res. radar images
27.4.2010 IES IMO
BO, MTG, SHR KHE
Observation flight with Eagle Air Iceland
Eruption behaviour Photography
29.4.2010 IES IMO
AA, MTG, ÞÁ HAB
Observation flight with ICG, TF-SIF Eruption behaviour Photography High res. radar images
1.5.2010 IES IMO
BO, FS, ÞJ MJR, SSJ
Observation flight with Eagle Air Iceland
Eruption behaviour Photography
IMO HAB Observation flight with ICG, TF-SIF Cloud observations
4.5.2010 IES IMO
BO, ÞH HSV, ÞVJ
Observation flight with ICG, TF-SIF Eruption behaviour Photography High res. radar images
6.5.2010 IES IMO
BO, ÞH HAB
Observation flight with ICG, helicopter TF-GNA
Eruption behaviour Photography High res. radar images
8.5.2010 IES IMO
BO, ÞH HÍ, GBG
Observation flight with Eagle Air Iceland
Eruption behaviour Photography
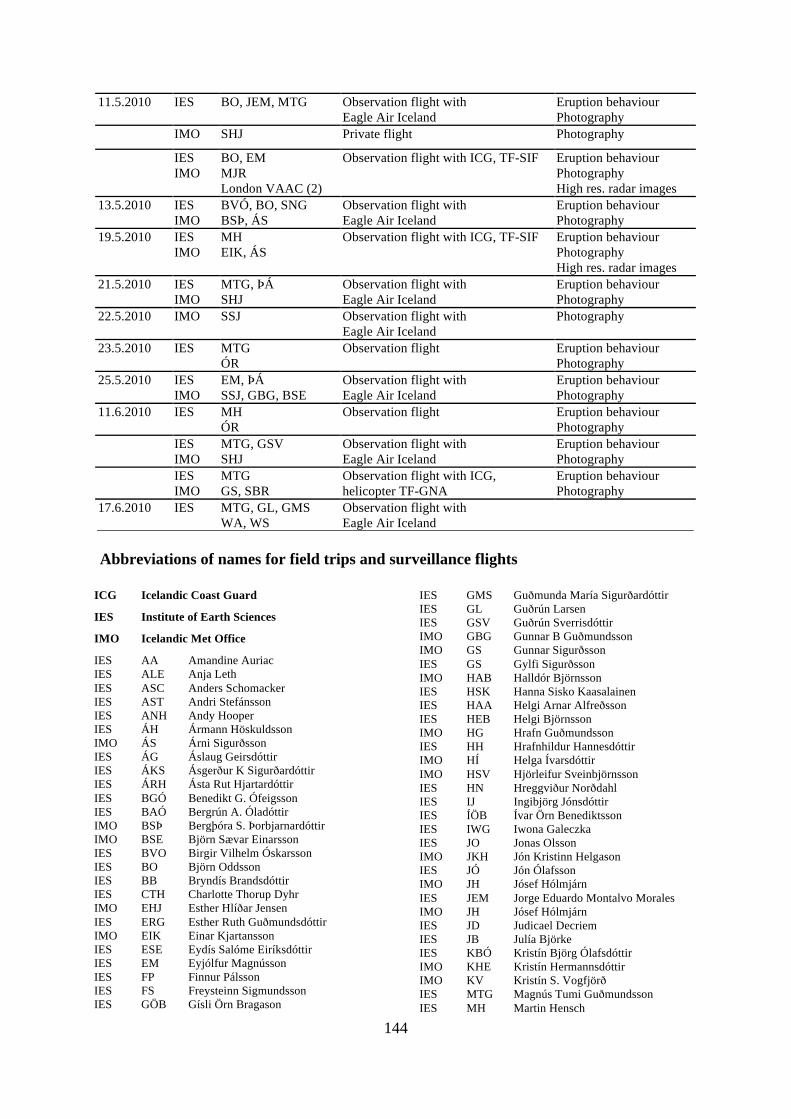
144
11.5.2010 IES BO, JEM, MTG Observation flight with Eagle Air Iceland
Eruption behaviour Photography
IMO SHJ Private flight Photography
IES IMO
BO, EM MJR London VAAC (2)
Observation flight with ICG, TF-SIF Eruption behaviour Photography High res. radar images
13.5.2010 IES IMO
BVÓ, BO, SNG BSÞ, ÁS
Observation flight with Eagle Air Iceland
Eruption behaviour Photography
19.5.2010 IES IMO
MH EIK, ÁS
Observation flight with ICG, TF-SIF Eruption behaviour Photography High res. radar images
21.5.2010 IES IMO
MTG, ÞÁ SHJ
Observation flight with Eagle Air Iceland
Eruption behaviour Photography
22.5.2010 IMO SSJ Observation flight with Eagle Air Iceland
Photography
23.5.2010 IES MTG ÓR
Observation flight Eruption behaviour Photography
25.5.2010 IES IMO
EM, ÞÁ SSJ, GBG, BSE
Observation flight with Eagle Air Iceland
Eruption behaviour Photography
11.6.2010 IES MH ÓR
Observation flight Eruption behaviour Photography
IES IMO
MTG, GSV SHJ
Observation flight with Eagle Air Iceland
Eruption behaviour Photography
IES IMO
MTG GS, SBR
Observation flight with ICG, helicopter TF-GNA
Eruption behaviour Photography
17.6.2010 IES MTG, GL, GMS WA, WS
Observation flight with Eagle Air Iceland
Abbreviations of names for field trips and surveillance flights
ICG Icelandic Coast Guard
IES Institute of Earth Sciences
IMO Icelandic Met Office
IES AA Amandine Auriac IES ALE Anja Leth IES ASC Anders Schomacker IES AST Andri Stefánsson IES ANH Andy Hooper IES ÁH Ármann Höskuldsson IMO ÁS Árni Sigurðsson IES ÁG Áslaug Geirsdóttir IES ÁKS Ásgerður K Sigurðardóttir IES ÁRH Ásta Rut Hjartardóttir IES BGÓ Benedikt G. Ófeigsson IES BAÓ Bergrún A. Óladóttir IMO BSÞ Bergþóra S. Þorbjarnardóttir IMO BSE Björn Sævar Einarsson IES BVO Birgir Vilhelm Óskarsson IES BO Björn Oddsson IES BB Bryndís Brandsdóttir IES CTH Charlotte Thorup Dyhr IMO EHJ Esther Hlíðar Jensen IES ERG Esther Ruth Guðmundsdóttir IMO EIK Einar Kjartansson IES ESE Eydís Salóme Eiríksdóttir IES EM Eyjólfur Magnússon IES FP Finnur Pálsson IES FS Freysteinn Sigmundsson IES GÖB Gísli Örn Bragason
IES GMS Guðmunda María Sigurðardóttir IES GL Guðrún Larsen IES GSV Guðrún Sverrisdóttir IMO GBG Gunnar B Guðmundsson IMO GS Gunnar Sigurðsson IES GS Gylfi Sigurðsson IMO HAB Halldór Björnsson IES HSK Hanna Sisko Kaasalainen IES HAA Helgi Arnar Alfreðsson IES HEB Helgi Björnsson IMO HG Hrafn Guðmundsson IES HH Hrafnhildur Hannesdóttir IMO HÍ Helga Ívarsdóttir IMO HSV Hjörleifur Sveinbjörnsson IES HN Hreggviður Norðdahl IES IJ Ingibjörg Jónsdóttir IES ÍÖB Ívar Örn Benediktsson IES IWG Iwona Galeczka IES JO Jonas Olsson IMO JKH Jón Kristinn Helgason IES JÓ Jón Ólafsson IMO JH Jósef Hólmjárn IES JEM Jorge Eduardo Montalvo Morales IMO JH Jósef Hólmjárn IES JD Judicael Decriem IES JB Julía Björke IES KBÓ Kristín Björg Ólafsdóttir IMO KHE Kristín Hermannsdóttir IMO KV Kristín S. Vogfjörð IES MTG Magnús Tumi Guðmundsson IES MH Martin Hensch
145
IMO MJR Matthew James Roberts IES MSR Morten S Riishuus IMO OS Oddur Sigurðsson IMO ÓÞ Óðinn Þórarinsson IMO ÓSA Ólafur St Arnarsson IES OLS Olgeir Sigmarsson IES PE Páll Einarsson IES PER Per Eriksson IES RP Rikke Pedersen IES RÓ Rósa Ólafsdóttir IMO SLM Sibylle von Löwis of Menar IES SHR Sigrún Hreinsdóttir IES SRG Sigurður Reynir Gíslason IMO SHJ Sigurlaug Hjaltadóttir IMO SÁ Sigþrúður Ármannsdóttir
IES SNO Snorri Guðbrandsson IES SNG Snæbjörn Guðmundsson IES SNÆ Snævarr Guðmundsson IMO SSJ Steinunn S Jakobsdóttir IES SS Sveinbjörn Steinþórsson IMO SBR Sveinn Brynjólfsson IES SVG Sverrir Guðmundsson IES TJ Tinna Jónsdóttir IES ÞÁ Þorbjörg Ágústsdóttir IES ÞH Þórdís Högnadóttir IMO ÞI Þorgils Ingvarsson IES ÞJ Þorsteinn Jónsson IMO ÞVJ Þorsteinn V Jónsson IMO ÞS Þórunn Skaftadóttir IES ÞÞ Þröstur Þorsteinsson
Others:
RÚV Freyr Arnarson Haraldur Sigurðsson Jónas Elíasson Kári Hreinsson Kristín Vala Ragnarsdóttir Ómar Ragnarsson Sigurður Magnús Garðarssson William Austin Stefan Wastegad Evgenia Ilyinskaya (Uni Cambridge) Halldór Ólafsson Þorvaldur Þórðarson
6.4 List of information/analyses presented on IES web page during the eruption
Date 21.3.2010 MODIS thermal image taken on March 21st at 04:00 GMT (IJ). 22.3.2010 SPOT image with the eruption site plotted on top (IJ). 25.3.2010 GPS time series for three continuous/semi-continuous GPS – sites around Eyjafjallajökull (SH).
‐ Report on the eruption ‐ GPS measurements at THEY - Plot showing the displacement - pdf file (SH) ‐ Map of the lava flow from 21 - 24 March 2010 - pdf file (EM) ‐ Results from observations flights over the eruption site 21 and 22 March 2010 - pdf
file (EM).
‐ Results from observations flights over the eruption site 21 and 22 March 2010 - pdf file (EM).
26.3.2010. A view from space on the crustal deformation associated with magma intrusion - preceding the March 20th eruption. Map of GPS and earthquake stations around Eyjafjallajökull and Mýrdalsjökull (ÞH). Chemical compostition of the Fimmvörðuháls 2010 lava (GL et.al).
146
.
30.3.2010. Map of the lava flow on Fimmvörðuháls from 21 - 28 March 2010 - pdf file (EM).
31.3.2010. Map of the lava flow on Fimmvörðuháls from 21 -31 March 2010 - pdf file (EM). 6.4.2010. Gas composition and flux report - pdf file.
8.4.2010. Map of the lava flow on Fimmvörðuháls from 21 March - 7 April 2010 - pdf file (EM).
12.4.2010. Eyjafjallajökull eruption: 20 March to present. Compiled by Freysteinn Sigmundsson.
14.4.2010. A new phase of the Eyjafjallajökull eruption started around midnight on the 14th of April – Announcement. MODIS image and thermo image from 14 April at 12:34 GMT (IJ). 15.4.2010. MODIS satellite photos showing the eruption plume taken on April 15th at 11:39 GMT (IJ). Radar observations at the Eyjafjallajökull eruption site 14 April 2010 - pdf file (EM).
16.4.2010. Radar image of the Eyjafjallajökull eruption site 15 April 2010. Radar observations at the Eyjafjallajökull eruption site 15-16 April 2010 - pdf file (EM). MODIS satellite photos showing the eruption plume taken on April 16th (IJ). 17.4.2010. MODIS satellite image showing the eruption plume taken on April 17th at 13:17 GMT (IJ). Changes in the ash plume. MODIS thermo image from 17. April at 03:41 GMT and NOAA infrared image from 17. April at 07:01 GMT(IJ).
18.4.2010. Preliminary estimates on tephra volume, grain size and magma effusion rates - A short note - pdf file (TT, GL and ÁH). Volume of erupted material and magma discharge for the first 72 hours - pdf file (JH staff). Particle size in the ash from Eyjafjallajökull eruption, sample from 15 April 2010 - Þröstur Þorsteinsson. Insight into the eruption of Eyjafjalla-jökull from GPS data - Sigrún Hreinsdóttir and Þóra Árnadóttir.
19.4.2010. Radar observations at the Eyjafjallajökull eruption site 15-19 April 2010 - pdf file (EM). Preliminary interpretations of chemical analysis of tephra from Eyjafjallajökull volcano - pdf file (OS et.al). MODIS satellite image showing the eruption plume taken on April 19th at 12:52 GMT (IJ).
20.4.2010. Latest results from GPS stations around Eyjafjallajökull. 21.4.2010. Eruption update 21 April. Particle size of the ash from Eyjafjallajökull eruption – Þröstur Þorsteinsson. 22.4.2010. Eruption update 22 April.
23.4.2010. Map of the eruption site 20 April 2010 (PE and ÁRH). Eruption update 23 April. 28.4.2010. Chemical composition of floodwater in river Markarfljót and river Svadbaelisá due to volcanic eruption in Eyjafjallajökull, 14. April 2010 pdf file (HAA et.al). 29.4.2010. Chemical analysis of rocks from the Eyjafjöll-2010 eruptions (NÓ).
4.5.2010. MODIS satellite images showing the eruption plume taken on May 5th at 14:00 GMT (IJ).
147
5.5.2010. Grain size of the ash from Eyjafjallajökull eruption - samples from April 28 – Björn Oddsson. 15.5.2010. Eruption in Eyjafjallajökull - Status Report: 17:00 GMT, 15 June 2010 and link to Previous Status Reports. 23.6.2010. Eruption in Eyjafjallajökull - Status Report (Steinunn S. Jakobsdóttir and Magnús Tumi Guðmundsson).
6.5 List of information/analyses presented on IMO web page during the eruption
Date 21.03.2010 Announcing the onset of an eruption on Fimmvörðuháls, timing and placement of fissure. Map with locations and depth, describing tremors and earthquakes for the past three weeks. 22.03.2010 A series of images from IMO‘s radar show the plume being carried westward. Graphs from river Krossá: Waterlevel, temperature and conductivity. Tremor graphs from five stations, renewed every ten minutes. Aerial photo with place names inserted. 23.03.2010 Photo of the lava flowing down a gully and for comparison a photo of the same gully in 2007. An automatic map on the web shows the location and size of earthquakes last 24 hours. Automatic tremor graphs from various stations. 24.03.2010 Water level, conductivity and water temperature of river Krossá is shown on a graph which indicates the influence of the lava. A warning is issued to farmers and travellers based on fluorine measurements from the Institute of the Earth Sciences, IES. Graphs of GPS measurements presented with explanations and discussion. 25.03.2010 Reporting observations on the interaction of lava and ice in the gully. Aerial photographs show lava, steam and fire as well as blueish fumes which are also reported in historic eruptions. 26.03.2010 A warning issued with regard to flying lava bombs and water fissures in the snow which can form quite suddenly. Warning issued with regard to popular walking paths which the lava has now blocked. Warning also of increased water flow in river Hvanná. A model predicting lava flow (VORIS) presented with a discussion on two likely paths.
28.03.2010 Specific weather forecast for 800-1000 m a.s.l. presented with an article on wind chill and a link to an article on poisonous gases (ICE-SAR).
29.03.2010 Link to web-cameras (Míla). Technical advances introduced, new seismometer and two new water gauges. Three dimensional map relocating earthquakes beneath Eyjafjallajökull in March 2010 with more precision than daily processing allows. Colour coded time scale shows the magma migrating upwards. 30.03.2010 A graph of water level, conductivity and water temperature in river Krossá, showing distinct effects 18 hrs after the volcanic the eruption began. 31.03.2010 Three dimensional map with relocated earthquakes, colour coded according to origin time. The importance of specific weather forecasts for the area is stressed and warning made against wind chill and poisonous fumes.
148
04.04.2010 River Hvanná: Graph shows the water level and the timing of an increased flux.
05.04.2010 Graph shows another increase in the waterflow of river Hvanná. Tremor plots only show the effects of intermittent steam explosions. Weather forecast warns against temperatures below zero and decreased visibility. 07.04.2010 - 12.04.2010 Shallow earthquake size 3.7 Ml last night, located in the vent of the magma. Observations reported. Water level increased temporarily in river Hvanná, see graph. Specific weather forecast for the area. Link to satellite image (IKONOS) showing the volcanic site in 1 m resolution. An earthquake reported but tremor levels have decreased and GPS measurement show deflation, indicating that this eruption is now possibly over.
14.04.2010 Reporting new earthquake activity, location and depth. Announcing an eruption in Eyjafjallajökull, south rim of top crater. IMO‘s radar records 8 km hight of the plume. Comparison of aerial photos since 1992 and the present show the retreat of Gígjökull glacier. Automatic maps of earthquakes in the area continuously available as well as tremor plots. IMO‘s hydrological network of gauging stations is also available on the web with specific graphs presented for certain events. Water level graphs trace the timing of a single flood event from Gígjökull lagoon early this morning, to the new bridge across Markarfljót river at noon, and to the old bridge in the late afternoon.
15.04.2010 Sampling of ash is encouraged, instructions provided (pdf), both for the public and weather observers around the country. IMO‘s web-site now provides a fill-in-form for observations of ashfall and other related phenomena. Lightning in the plume is recorded and presented in a specific map on the web (via ATDnet UK Met Office). Ashfall forecast for Iceland made by IMO‘s meteorologists is presented on the web. An account given of a historic flooding from Gígjökull in 1822. Graph shows changes in water level of Markarfljót river. Graph from seismometer in Goðaland shows periodic tremor, suggesting interaction of magma and water.
16.04.2010 Ashfall reported in Europe. Link to VAAC in London for flight safety. For Iceland IMO provides daily ashfall forecasts. Satellite images (EUMETSAT SEVIRI) show the ash plume carried eastwards across the ocean. GPS measurements suggest deflation of volcano due to emissions. IMO‘s radar records the plume hight (5-8 km). Scientists do reconaissance flights with the Icelandic Coast Guard almost daily with photos and comments presented on the web.
17.04.2010 Links to web-cameras (Míla) showing the eruption. Tremor and lightning recorded and described on the web. Plume hight recorded by the radar. QA on the eruption provided on the web (frequently asked questions).
19.04.2010 – 24.04.2010 Changes in tremor indicate that lava has started to flow from the crater, supported by lower plume (2-4 km) according to radar. A MODIS satellite image shows both ash from the volcanic site and loose ash blown from the surface of Mýrdalsjökull ice cap. Comments on sound blasts, viscosity, deflation and tremors. Link to satellite image RADARSAT-2 (from the Canadian Space Agency), link to a briefing issued by WMO of frequently asked questions. 25.04.2010 – 28.05.2010 Presenting joint status reports of IMO and IES daily. Through this, up to date information on the eruption is always available to other scientists and to the public. IMO issues forecasts of ash dispersion every six hours, predicting ashfall for the next four or five days. The written forecasts are supported by maps which are renewed on the web daily. IMO‘s network of hydrological gauging stations mediates information continually on the web. Recent observations of ashfall are available, both from weather stations and the
149
public, as well as precipitation at selected weather stations for precaution against fluorine contamination. 05.05.2010 Three dimensional map showing earthquake activity beneath Eyjafjallajökull in April and May 2010, migrating upwards, and earthquake locations from 2009 to March 2010 for comparison. Precise locations reveal that the earthquakes‘ original source is at about 23 km depth but the location of the magma chamber is considered to be at 3-5 km depth. 07.05.2010 An animation of satellite images shows the development of the volcanic ash cloud detectable by brightness temperature difference (SEVIRI BTD) between two thermal channels, generated chiefly from EUMETSAT‘s geostationary satellite but segments from NOAA‘s polar orbiting satellites were superimposed where available. 26.05.2010 Observations in a reconnaissance flight reveal that the northside of the crater is stained yellow with sulfurides. Bluish fumes, sulfuric gases, run downwind to the south and southwest. Only steam comes from the crater (aerial photo).
11.06.2010 Another flight reveals that a lake has formed in the crater. Brownish veils indicate degassing of magma, steam rises from the surface and the water is stirred either from water intake or heat convection (aerial photos). Surveillance on ground shows an ice tunnel in Gígjökull; the main canyon has deepened and another canyon has formed to the west (photo). 23.06.2010 – 09.07.2010 Little or no activity at Eyjafjallajökull volcano. Single observation of a 3 km white steam plume. A cone of volcanic debris in the crater. 10.08.2010 – 09.10.2010 Aerial photographs show first the green colour of vegetation in spite of ashfall in spring and then the first winter snow, which proves that the new lava at the top crater has cooled somewhat.
6.6 Sessions and special meetings
The Atlantic Conference on Eyjafjallajökull and Aviation was held at Keflavik International Airport in September 2010 followed by the Eyjafjallajökull Eruption Workshop held in South Iceland.
Special sessions have been held on the eruption at various conferences and meetings. Here are a few examples:
American Geophysical Union (AGU) Fall Meeting 2010. American Meteorological Society (AMS) Annual Meeting 2011.
American Meteorological Society (AMS) Annual Meeting 2012. European Geosciences Union (EGU) General Assembly 2010.
European Geosciences Union (EGU) General Assembly 2011. European Geosciences Union (EGU) General Assembly 2012.
6.7 Information on MoU between IMO, UK Met Office, BGS and NCAS (next page)

155
6.8 Daily reports from IMO during the eruption (examples)
Day 1: 14 April 2010 Twelve hours after the unrest began in the Eyjafjallajökull volcano, a report was compiled on initial actions taken by IMO staff in response to the unrest.
Information and communication
Increased earthquake activity was observed at seismic stations a few minutes before 23:00 on 13 April 2010. The Civil Protection Agency (CPA) was notified and IMO employees were called out in the following order:
‐ earth scientist ‐ hydrologist ‐ meteorologist ‐ lightning specialist ‐ information technologist
The following were notified: Icelandic aviation authorities, London VAAC (Volcanic Ash Advisory Centres) and the air traffic control center in Trömsö.
• IMO's scientists, following a contingency plan, monitored the volcano during the night along with representatives from the CPA.
• Shortly before 9 a.m., an eruption plume reaching an altitude of 8 km was observed on the weather radar. The contingency plan regarding aviation was set at the highest level. Information was posted on IMO's website at 9:15.
• The weather was monitored closely. Prevailing westerly winds advected the ash plume to the east. As a result, the international airport in Keflavík remained open.
• At around 10 a.m., a jökulhlaup burst from the lagoon at the base of the outlet glacier Gígjökull, sweeping away a gauging station. The water level of the lagoon had by then risen ~4.35 m. An effort will be made to install another gauging station in the area as soon as possible.
• In the morning, the connection to the GPS station at Thorvaldseyri was lost. • The Icelandic Defense Agency contacted the IMO at 14:30, offering to send composite
images every two hours from the agency's radar systems, i.e. a video and registered ash plume heights. This information was used to verify the weather radar recordings.
• Shortly before 17:00, the Defense Agency contacted the IMO to point out that 3000 ft should to be added to register the correct height of the ash plume.
• TFH flew to Copenhagen in the morning and arrived back in Iceland at 16:30. • EHJ had trouble obtaining radar images of the jökulhlaup taken on board the Icelandic
Coast Guard (ICG) aircraft. She contacted SK at 17:15, who requested and then obtained the data from the ICG.
• The flow of information between IMO, the CPA and the ICG is good. • A duty plan for the next 24 hours was compiled. • The eruption status will be assessed twice a day. • An increase in earthquake activity beneath the Vatnajökull ice cap is being monitored
closely. • Flight: ÓTh went on a surveillance flight on board the ICG helicopter around noon. JH, ÁS
and MJR went on a surveillance flight in the afternoon, with equipment to repair the station at Thorvaldseyri.
The onset and progress of the eruption
Right before 23:00 in the evening of 13 April, an earthquake of magnitude 2.5 was located at a depth of 6–7 km in the Eyjafjallajökull volcano. Several earthquakes followed, occurring every minute till 1 a.m., migrating upwards to within two km of the surface.
156
Tremor recorded at seismic stations in the vicinity of the volcano indicated that an eruption had begun at around midnight. Signs of an eruption were observed at hydraulic stations at around 7 a.m., when the water level in the lagoon at the base of the outlet glacier Gígjökull started rising. Water temperature in the reflux from the lagoon does not appear to have dropped with air temperature in the evening of 13 April, but remained constant – and higher than it had been in preceding days.
Shortly before 7 a.m. on 14 April, there was a rapid increase of water at the base of the Gígjökull outlet glacier, which then flooded into the Markarfljót River. This was an indication that the eruption was in the summit of the volcano. At that time, no floodwater ran down the south flank of the volcano. At 9:30 a.m., four hydrologists in two vehicles went to the Markarfljót River and Seljalandsheiði to collect samples and record the water discharge.
The gauging station by the lagoon reflux at the base of the outlet glacier Gígjökull recorded a rise in water level of 4.35 m from before 7 to 10:05 a.m. At 11:25 a.m., the gauging station at the old bridge over the Markarfljót River recorded a rise of 2 m. The water reached the floor of the bridge and flowed over the road. The water level at the new bridge over the Markarfljót River on the main highway also rose considerably. However, levees and excavated breaches in the road lessened the load on the bridge. The swelling in Markarfljót River reached a peak at about 13:00 after which the flood abated. The gauging station at the reflux was damaged by the flood and stopped sending data after 10:05 a.m., having been swept away into the Markarfljót River. At about 10:00, floodwater ran into the Svadbæli River (south of the glacier). The flood monitoring system website was closed to the public early in the morning, to ensure that the CPA had access to the data.
The eruptive site is in southwest Eyjafjallajökull, by Fellshaus. The eruptive conduit appears to be at the south end of the crater. The eruptive plume reached an altitude of about 8 km and headed east. A lightning strike was detected in the plume at 18:30 and additional strikes in the evening.
Day 2: 15 April 2010 Information and communication
• Westerly winds advected the ash to the east, disrupting flights in northern Europe, but Keflavík Airport remained open. The air traffic advisory was based on information from IMO's radar at Keflavík Airport, which London VAAC uses to model ash dispersal. The closing of airports was considered too extensive, but the radar cannot supply accurate enough information on ash dispersal to allow necessary mapping precision.
• SK attended a meeting at CPA headquarters from 10-11 a.m. • Teleconferences were held at 12:30, 17:30 and 18:30 with EUROCONTROL and about
200 aviation authorities throughout Euope and Russia. • Many international and domestic news agencies phoned the IMO. The following are
some interviews that were given: ‐ Einar Kjartansson: Associated Press and an Irish radio station ‐ Matthew: Radio Five Live – BBC ‐ Sigurlaug Hjaltadóttir: Danmarks Radio ‐ Teitur: Danmarks Radio
• Kristín S. Vogfjörð attended a meeting at the CPA center in Hella at noon. • Sigrún Karlsdóttir attended an ISAVIA meeting at 14–15. • Sigrún Karlsdóttir attended a meeting held by the Icelandic Travel Industry Association
at 17:30 • IMO received a report of damage, caused by ashfall, to navy jet motors in Finland. • At 16:35, the IMO posted the first ashfall forecast. Information on the IMO website is
updated regularly.
157
• The Department of the Environment offered to send a public spokesman to assist the IMO staff in relating information to the press, in particular the world press. A meeting was held with the spokesman in the evening.
• Flight: Kristín S. Vogfjörð went on an ICG flight and MJR and Guðrún Nína Pedersen NP on a flight later in the day. During the latter flight, a jökulhlaup in the Markarfljót River was witnessed. Unique photos were taken and recordings of surface velocity facilitated the evaluation of maximum water discharge in the river.
Eruption progress
Two minor floods occurred during the night. Tremor levels were fairly constant until 7 a.m. The ash plume then disappeared off the radar, indicating a height of below 3 km. The plume appeared again on the radar about 25 minutes later, at 07:25, reaching an altitude of 4 km. The plume seemed to subside in the next hours, but clouds obscured the site.
Volcanic tremor increased after 7:20 a.m., when an earthquake occurred. Earthquake activity increased from noon and reached a maximum at around 18:30. IMO staff contacted the CPA a few times during the day with updates of this activity. The predominant frequency content of the tremor was the same as yesterday. At around 19:00, a flood peak ruptured the levee at Thórólfsfell in Fljótshlíd. The floodwater plunged down from the glacier at an estimated velocity of about 1500 m3/sek. At 19:56, the floodwater reached the old Markarfljót bridge, but did not reach the same level as yesterday (preliminary assessment: 2700 m3/sek).
Tremor levels decreased significantly right before 19:00. However, the intensity of the eruption was then similar to yesterday's maximum intensity. These changes in tremor are rather unusual but were also observed before the onset of the eruption in the Grímsvötn volcano 2004. They are likely caused by the interaction between magma and water.
The connection to the GPS station at Thorvaldseyri was repaired. The data was intact. The station, which has shown displacements towards the south since 2009, has now moved ~2 cm northwards. This suggests a deflation of the magma chamber.
Day 7: 20 April 2010 Information and communication
Website: An eruption update was posted at about 8:15 a.m. Because of a BBC interview with the president of Iceland yesterday evening, a comment was posted on the Icelandic webpage and on the English “Q&A” and “Update on activity” webpages, stating that there are no signs of an imminent eruption in the Katla volcano. A link on the eruption webpages to the Department of the Environment was activated. Ashfall forecasts are updated when necessary and the ash distribution map is updated every day.
Every three hours, London VAAC receives updates on the nature of the ash plume.
• SK and TFH held a teleconference with London VAAC. • KSV and GNP were at the CPA information center from 8:00 to 10:00 a.m. • SK and TFH attended a meeting at CPA headquarters. • From 14:00 to 15:15, the natural hazards director, SK, held a status meeting with
employees on duty. Those who attended were: SK, ÓTh, SH, KH, EBJ, ThS, MJR, TFH, EA, GBG, BSTh, ÓSA, HS, HTh and GP.
• EK was at the information center in Hvolsvöllur for the second day in a row and HB in the morning. They spoke to BBC, Bloomberg, the Wall Street Journal, Reuters, AP, TV2, Norwegian newspapers, NBC and others.
• Halldór Björnsson visited ashladen areas and attended the following community meetings:
‐ 14:00 Laugaland – Laugalandsskóli ‐ 18:00 Vestmannaeyjar – Akoges-salurinn
• Sigurlaug Hjaltadóttir acquired information from IES on the chemical composition and particle size of the ash.
158
• Flight: Kristín S. Vogfjörð went on a helicopter flight in the afternoon. Eruption progress
The ash plume was below an altitude of 3 km and therefore not detectable on the radar. However, it was clearly visible on web cameras. Almost no lightning strikes were detected. The ashfall has decreased significantly. The volcanic tremor was similar to yesterday. The plume altitude will continue to be recorded in feet and then diverted to km.
The danger of flooding is considered small. The 24-hour watch was discontinued. However, from 20 April, scientists will be on call at night.
Shockwaves were heard and felt in a wide area south of the Eyjafjöll mountains and to the east; especially after the wind abated. Gas explosions appear to be more powerful in viscous magma than in more fluid magma, as was produced in the flank eruption at Fimmvörðuháls. The explosions generate shockwaves that can be heard and felt at a distance of several kilometers. Reports of booms were received from Vík and Landbrot, which are 80 km east of the eruption site. Cirrus clouds, undulated as a result of the explosions, were photographed. People on board helicopters flying nearest to the eruption site felt the shockwaves.
The volcanic tremor intensified in the middle of the day but decreased again at about 22:00. GPS stations south and north of the Eyjafjallajökull glacier show displacements towards the volcano. A miniscule displacement to the east was observed at the GPS station on Goðabunga (western Mýrdalsjökull). MJR suggests that the magma is coming from a great depth. He believes that there is stil excess magma in the volcano. Magma intrusions can be mapped with earthquake locations. Microearthquakes may be lost in the volcanic tremor. When eruptive activity in the main crater decreases, there is danger of an eruption at another site.
GPS measurements at stations in the vicinity of Eyjafjallajökull show that deformation during the eruption was towards the volcano. No earthquakes have been recorded in the Katla volcano and GPS measurements show no indication of an imminent eruption.
Day 24: 7 May 2010 Information and communication
Website: An ash forecast – more accurate than before - with names of areas where ash fall is expected, ash distribution map and most recent information, based on the joint status report (IMO and IES), were posted on the Icelandic and English webpages. Ashfall information from weather stations was posted on the Icelandic webpage. Information and an animated satellite image trailing the ash was posted (processed by Hrobjartur Thorsteinsson).
• The status report was compiled by Sigurlaug Hjaltadóttir with input from Matthew J. Roberts and others
• London VAAC receives regular updates. • Árni Snorrason and Sigrún Karlsdóttir attended a NAT meeting at Isavia. • KH and SvL attended an Isavia operations group meeting to discuss the possibility of
Keflavík and Reykjavík airports being closed down. • Sigrún and the forecast room staff met with a Frenchman from Saint Thomas Product,
who is making a documentary about Eyjafjallajökull. • Preparations were made for the collaboration between IMO and two meteorologists from
the UK Met Office, who arrive in Iceland 8 or 9 May. They will be here for 1 to 2 weeks. Eruption progress
Considerable ashfall began in Vík at 21:00 yesterday. The ashfall extends out to the middle of Mýrdalssandur (55-60 km from the eruption site). The eruptive plume does not rise as high as yesterday, is lighter in color, is sooner advected by the wind and there is less ashfall. The cinder cone build-up continues around the eruption conduit in the ice cauldron. The lava flow to the north has not propagated further in the past two days.
159
The explosive activity appears to have decreased since yesterday. Steam rises from the lava tongue beneath the Gígjökull outlet glacier suggesting ice melt in the channel, but to a much lesser degree than when the lava flow was at its peak. Tremor levels are low, comparable to yesterday and during 14-17 April. Earthquakes still occur south of and beneath the top summit, but fewer than yesterday. GPS measurements from around Eyjafjallajökull indicate no major displacements, suggesting a stabilization of the surface deformation since yesterday. There are no indications that the eruption is at an end.
No flash floods from Gígjökull have been recorded at the Markarfljót bridge in the last 24 hours. Electrical conductivity decreased and diurnal fluctuations in discharge and water temperature were observed.
Day 67-72: Week 19-24 June (last days) Collaboration between the IMO and the British Geological Survey is being defined. The IMO, among others, is applying to NERC for funds to research the dispersal of volcanic ash. IMO is applying for a grant from the Scandinavian ministry committee for SO2 research in collaboration with Norwegians and Swedes.
Additional strainmeters are being installed in the Hekla area. On 24 June, SSJ along with five colleagues from the Czech Republic went to Gígjökull and Eyjafjallajökull.
From now on, joint status reports from IMO and IES will only be compiled if there are significant changes, and hence no IMO summaries will be posted.
6.9 Daily joint status reports from IMO and IES
Eruption in Eyjafjallajökull - status report 24 April 2010 at 1700 from Icelandic Meteorological Office and Institute of Earth Sciences, UoI Compiled by: MTG / HB
Based on: IES/IMO Inspection flight with aircraft from Ernir at 1600-1700 IMO seismic monitoring IES/IMO GPS monitoring IMO river gauges Eruption plume: Height( a.s.l): 13000 feet (4 km) Heading: SW Colour: Grey Tephra fallout: Minor (plume dark but no reports of fallout in districts around volcano) Meltwater: 100-120 m3/s, based on gauge at old Markarfljót bridge and a rough estimate of base flow.
Conditions at eruption site: North crater still active. Mild explosive activity with spatter thrown to 100 m height above crater. Shockwaves occur every few seconds. North of crater a roughly 300 m long and wide depression has been melted out in the last three days. Steam plumes rise from the depression, especially at the margins. This is explained by lava flowing northwards from the crater with the steam rising where lava meets ice. Seismic tremor: Magnitude similar to what it has been over the last few days.
160
GPS deformation: Indicates slow subsidence towards the center of the volcano. Magma flow: Eruption plume: less or equal to 10 tonnes/s. Lava flow: 10-30 tonnes/s Total magma flow: 20-40 tonnes/s Overall assessment: Magma flow rate has remained at similar level over the last few days. Plume activity is gradually declining. Flow of lava is considered to have began around noon on Wednesday 21 April. Timing is based on: a) onset of semi-continuous discharge of meltwater from Gígjökull, b) Observations of steam rising at northern margin of ice cauldon at 1300 on 21 April, and c) a change occurs in fluctuations in tremor amplitude at this time. No signs of melting or meltwater discharge towards south. No signs of termination of eruption.
Eruption in Eyjafjallajökull - Status report 25 April 2010 at 1800 from Icelandic Meteorological Office and Institute of Earth Sciences, UoI Compiled by: MTG / SSJ
Based on: IMO seismic monitoring, IES/IMO GPS monitoring, IMO river gauges, information from local police and IES geologists inspection of tephra
Eruption plume: Height( a.s.l): Unknown, not seen above cloud cover at 5.3 km. Heading: NW Colour: No information Tephra fallout: Minor (light fallout detected at two farms 10 km NW of vents)
Meltwater: 100-120 m3/s, based on gauge at old Markarfljót bridge and a rough estimate of base flow.
Conditions at eruption site: Overall activity similar as yesterday. Eruption seen from west in the morning - north crater still active. External water has not affected vent activity much since 18 April. Geologists field observations (2-10 km from vents) show that explosivity is magmatic and that the tephra produced since 18 April is much coarser than during first four days. Explosions heard at Fljótshlíð, 10-15 km NW of vents. Meltwater discharge suggest similar lava activity. Processing of data obtained yesterday shows that lava had advanced 400-500 m northwards from crater, forming an ice depression extending some 700 m from vents.
Seismic tremor: Magnitude similar to what it has been over the last few days.
Earthquakes: An earthquake of magnitude 1.4 occurred under NE-part of Eyjafjallajökull this morning.
GPS deformation: Indicates very minor subsidence towards the center of the volcano.
Magma flow: No observations today but total magma flow considered similar as yesterday (20-40 tonnes/s).
Overall assessment: Magma flow rate has remained at similar level over the last few days. Plume activity is gradually declining. Flow continues flowing towards north. No signs of melting or meltwater discharge towards south. No signs of termination of eruption.
161
Eruption in Eyjafjallajökull - Status Report 26 April 2010 at 18:00 GMT Icelandic Meteorological Office and Institute of Earth Sciences, University of Iceland Compiled by: MJR / GNP / BO / FS
Based on: IMO seismic monitoring; IES-IMO GPS monitoring; IMO river gauges; information from local police and IES geologists inspection of tephra.
Eruption plume: Height (a.s.l.): Mean elevation of 4.8 km (~16,000 ft) between 12:00 and 14:00 GMT; elevation of 3.9 km recorded at 17:40 GMT [From aerial observations and radar measurements] Heading: Eastwards at elevations above ~4 km (~13–14,000 ft) Colour: Mostly white (steam) to the east of the crater, but grey tephra pulses above the crater Tephra fallout: No ash-fall reported, although light ash-fall possible over Mýrdalsjökull Lightening: No detections over the eruption site since 19 April 2010 Noises: Report from ~20 km SE of the volcano of booming sounds (02:30 GMT)
Meltwater: Continuing discharge of water from Gígjökull due to ice-melt at the eruption site. Discharge at the old Markarfljót bridge, 18 km from Gígjökull, is estimated at 110–130 m3/ s, of which 30–40 m3/s is baseflow.
Conditions at eruption site: No visual observations. Radar images show continuous build-up of a tephra crater/cone in the northern ice cauldron. The diameter of the crater is 200 m and the height of the crater cone is 150 +- 20 m.
Seismic tremor: Intensity comparable to the last three days of eruptive activity.
Earthquakes: Ml 1.7 earthquake detected ~8 km east of the eruption at 16:18 GMT
GPS deformation: Horizontal displacement towards the centre of the volcano, in addition to vertical subsidence. These observations are consistent with deflation of a magma reservoir beneath Eyjafjallajökull.
Magma flow: Not visible but total magma flow considered similar as last two days (20–40 tonnes/ s).
Other remarks: No measurable geophysical changes within the Katla volcano. Earthquake activity on the north-western edge of Vatnajökull is unconnected with the ongoing eruption.
Overall assessment: Magma flow-rate and plume height has remained at similar levels during the last few days. Lava continues to flow northward. No signs of melting or meltwater discharge towards the south. There is no indication that the eruption is about to end; however, it is an order of magnitude smaller than in the first explosive phase.
Eruption in Eyjafjallajökull - Status Report: 19:00 GMT, 27 April 2010 Icelandic Meteorological Office and Institute of Earth Sciences, University of Iceland Compiled by: MJR / SSJ / MTG / BO Based on: IMO seismic monitoring; IES-IMO GPS monitoring; IMO river gauges; information from local police; and aerial observations over the eruption site Eruption plume: Height (a.s.l.): Observed from the air at 12:00 GMT at an elev. of 3–3.6 km (10–12,000 ft). Heading: West–northwest from the eruption site. Colour: Light, low-lying clouds of steam observed over the eruption site, together with
162
occasional bursts of grey to black-coloured cloud, which rose to up to half of the total height of the eruption plume. Above this level, the plume was lighter in colour with a capping of white cloud. Localised clouds of steam were also visible at the top of the Gígjökull glacier. Tephra fallout: Light dusting of ash seen on cars in the towns of Hvolsvöllur and Hella, located 32 and 45 km, respectively, west of the eruption site. Lightning: No detections over the eruption site since 19 April 2010. Noises: Booming sounds reported from Hvolsvöllur, 32 km west of eruption site. Meltwater: Continuing discharge of water from Gígjökull due to ice-melt at the eruption site. Discharge at the old Markarfljót bridge, 18 km from Gígjökull, is estimated at ~100 m3 s–1, of which ~30 m3 s–1 is baseflow. Between ~13:00 and 15:45 GMT, a 30-cm rise in stage was recorded at the bridge; this increase was accompanied by a decease in electrical conductivity, which is a measure of dissolved solutes in the river. Conditions at eruption site: The eruption site was seen clearly during today's overflight. Eruptive activity in the northern ice cauldron remains similar to conditions during the preceding four days. A volcanic crater has formed in the south-western corner of the cauldron. Erupted material from the vent continues to accumulate on the flanks of the crater. The rim of the volcanic crater is ~50 m lower than the surrounding ice cauldron. Volcanic spatter was observed from the vent, with ejected lava reaching heights of 100–200 m. Unstable plumes of ash rise regularly from the vent. Lava continues to flow to the north, advancing ~1 km from the crater. Depressions in the ice-surface have formed due to lava being in contact with ice; these features have enlarged considerably since 24 April. The surface of Gígjökull is grey in colour due to ash deposition; likewise, the north-western flank of Eyjafjallajökull is black in appearance. Seismic tremor: Intensity comparable to the preceding four days of eruptive activity. Earthquakes: No locatable seismicity has been recorded today beneath Eyjafjallajökull. GPS deformation: Horizontal displacement towards the centre of the volcano, in addition to vertical subsidence. These observations are consistent with deflation of a magma reservoir beneath Eyjafjallajökull. Magma flow: No measurements possible today; however, the intensity of the eruption suggests that the discharge level is similar to the preceding four days (i.e. 20–40 tonnes s–1). Other remarks: No measurable geophysical changes within the Katla volcano. Overall assessment: Plume elevations and magma discharge levels remain similar to the preceding four days of activity. Lava continues to flow north from the eruption site toward the head of the Gígjökull glacier. Despite light ash-fall occurring up to 45 km west of the eruption site, today's explosive activity and ash production represents a fraction of conditions during the height of the eruption (14–17 April). There are no measurable indications that the eruption is about to end.
Eruption in Eyjafjallajökull - Status Report: 19:00 GMT, 28 April 2010 Icelandic Meteorological Office and Institute of Earth Sciences, University of Iceland Compiled by: MJR / SSJ / MTG / FS / SRG / GS / KH Based on: IMO seismic monitoring; IES-IMO GPS monitoring; IMO river gauges; web cameras of the eruption site from Vodafone, Mila, and Múlakot; IMO weather radar measurements; information from the local police; and geologist’s observations of Eyjafjallajokull, west of the eruption site (no overflight today)
163
Eruption plume: Height (a.s.l.): Plume not detected above a cloud level of 4 km (~13,000 ft). Heading: West-northwest from the eruption site. Colour: White (steam) clouds were visible over the advancing lava front. Grey-colored (ash) clouds were seen occassionally over the eruptive crater. Tephra fallout: Light ash-fall noted at Hvolsvöllur, located ~32 km west of the eruption site; some additional ash-fall observed on Eyjafjallajökull, west of the eruption site. Lightning: No detections over the eruption site since 19 April 2010. Noises: Booming noises often heard from the eruption. Meltwater: Discharge of meltwater from Gígjökull increased signifcantly today, reaching levels not exceeded since 16 April 2010. Meltwater draining beneath the old Markarfljót bridge, ~18 km downstream from Gígjökull, had a temperature of over 11°C. However, the electrical conductivity of Markarfljót is lower than in previous days. IMO hydrologists gauged meltwater discharge and the bridge, and water samples were taken for analysis. The conductivity of Krossá is unusually high, with a value of 300 µS cm−1 recorded yesterday. Additionally, the conductivity of Steinholtsá was over 170 µS cm−1 today, which is an abnormally high level, unless geothermal water is entering the catchment. Ash fall or ashpolluted snow are possible reasons for the high conductivity of Steinsholtsá. Likewise, lava from the former Fimmvörðuháls eruption could also be causing contamination of Krossá. Conditions at eruption site: Conditions at the eruption site are thought to be similar to the preceding five days. Lava continues to flow northward, where it now descends partway down the Gígjökull glacier. Seismic tremor: Intensity comparable to the preceding five days of eruptive activity. Earthquakes: At 03:36 GMT, an Ml 1.5 earthquake was registered at shallow depth beneath the summit caldera. Additionally, within the caldera of the Katla volcano, an Ml 1.7 earthquake occurred at 15:28 GMT at ~6 km depth. GPS deformation: Gradual horizontal displacement toward the centre of Eyjafjallajökull, together with vertical subsidence. Magma flow: No measurements today; however, the intensity of the eruption suggests that the discharge level is similar to the five preceding days. Other remarks: Gas emissions from meltwater leaving Gígjökull represents a localised hazard, especially within the moraines of the glacier. The main gasses are CO2 and probably SO2. These gases are heavier than air, and could linger in front of Gígjökull if light winds prevail. Despite a single earthquake occurring, there are no signs of untoward changes within the Katla volcano. Overall assessment: Plume elevations and magma discharge levels remain similar to the preceding days of activity. Lava continues to flow north from the eruption site toward the head of the Gígjökull glacier. From steam emisions over Gígjökull, it is likely that lava is exploiting the drainage pathway created in the glacier by earlier floods. There are no measurable indications that the summit eruption of Eyjafjallajökull is about to end.
Eruption in Eyjafjallajökull - Status Report: 18:00 GMT, 29 April 2010 Icelandic Meteorological Office and Institute of Earth Sciences, University of Iceland Compiled by: MJR / HB / MTG / SSJ / GS / BO
164
Based on: IMO seismic monitoring; IES-IMO GPS monitoring; IMO river gauges; web cameras of the eruption site from Vodafone, Mila, and Múlakot; IMO weather radar measurements; information from the local police; and aerial observations from a scientific flight with the Icelandic Coastguard (observation plane TF-SIF).
Eruption plume: Height (a.s.l.): Not visible above clouds at 3.6–5.1 km (12–17,000 ft), but most likely below 3.6 km (12,000 ft). Before the overflight this morning, the eruption plume was not seen on radar images from Keflavík, nor on satellite images. Heading: West and possibly southwest from the eruption site, but probably remaining close to Eyjafjallajökull due to light winds. Colour: Cloud-cover obscured direct observations. Tephra fallout: Light, fine-grained ash-fall reported in the morning during rain at Ásólfsskáli, located 10.5 km south-west of the eruption site. Similar conditions also reported from a farm 12 km south-southwest of the eruption site at 15:00 GMT. Lightning: Four lightning strikes detected over the summit of Eyjafjallajökull between 19:47 and 20:03 GMT on 28 April. Noises: Booming sounds were reported yesterday evening, and again this morning, from Selsund, located ~40 km north-northwest of the eruption site. Additional note: 16:13 GMT:A sulphur smell was detected at 3 km a.s.l. (10,000 ft) by pilots on a passenger flight 50–60 nautical miles east of Keflavík Airport.
Meltwater: Web-camera views show continued discharge of water from Gígjökull due to lava-ice interactions. On 28 April, the discharge of Markarfljót was measured twice at the old bridge, ~18 km downstream from Gígjökull. The flood that began at Gígjökull at ~11:30 GMT yesterday reached a peak discharge of 250 m3 s–1 two hours later at the bridge. Both yesterday and today, mean discharge from Gígjökull was 130–150 m3 s–1, which is higher than in previous days. The electrical conductivity of Krossá and Steinholtsá remains high (see report from 28 April for details).
Conditions at eruption site: Airborne radar surveys from TF-SIF show a well-formed crater. Lava is spreading northward from the crater toward the head of Gígjökull. Ice continues to be melted by the propagating lava front.
Seismic tremor: Intensity comparable to the preceding six days of eruptive activity.
Earthquakes: At 13:10 GMT, an Ml 1.5 earthquake was detected at shallow depth beneath the summit caldera; it is possible that this earthquake was a seismic explosion from the erupting crater.
GPS deformation: Horizontal displacement towards the centre of the volcano, in addition to vertical subsidence. These observations are consistent with deflation of a magma reservoir beneath Eyjafjallajökull.
Magma flow: No measurements possible today.
Other remarks: No measurable geophysical changes within the Katla volcano.
Overall assessment: Plume elevations and magma discharge levels remain similar to the preceding six days of activity. Lava continues to flow north from the eruption site toward the head of the Gígjökull glacier. Today's explosive activity and ash production represents a fraction of conditions during the height of the eruption (14–17 April). Presently, there are no measurable indications that the eruption is about to end.
165
Eruption in Eyjafjallajökull - Status Report: 17:00 GMT, 30 April 2010 Icelandic Meteorological Office and Institute of Earth Sciences, University of Iceland Compiled by: MJR / MTG / FS / GS / SSJ
Based on: IMO seismic monitoring; IES-IMO GPS monitoring; IMO hydrological data; web cameras of the eruption site from Vodafone, Mila, and Múlakot; IMO weather radar measurements; information from scientists at Gígjökull; and aerial observations from the Icelandic Coastguard (observation plane TF-SIF).
Eruption plume: Height (a.s.l.): Detected by weather radar at 15:20 GMT at an elevation of 2.8 km over the eruption site. TF-SIF observations at 15:40 GMT confirmed a steam plume rising to 4.5–5.1 km (15–17,000 ft). Clouds of ash at lower elevations observed drifting south of the eruption site. Heading: South and south-west from the eruption site, but probably remaining close to Eyjafjallajökull due to light winds. Colour: White (steam) clouds at higher elevation; dark grey (ash) clouds seen intermittently at lower elevation (see above). Tephra fallout: Dark, fine-grained ash-fall reported over a 10 km region south of Eyjafjallajökull between Núpur and Skógar. Lightning: No detections today over the eruption site (17:00 GMT). Noises: Booming sounds reported in the vicinity of Eyjafjallajökull.
Additional note: Plumes of white plume were noticed over Gígjökull (15:40 GMT); this steam probably represents the position of the northward-flowing lava flow.
Meltwater: Web-camera views show continued discharge of water from Gígjökull due to lava-ice interactions. At 05:00 GMT a flood was detected leaving the Gígjökull lake basin. The flood reached a maximum discharge about two hours later at the old bridge over Markarfljót, ~18 km downstream. The flood was comparable in size to yesterday's gauged flows. At 14:00 GMT, meltwater flow beneath the bridge was ~200 m3 s–1. Discharge from Gígjökull decreased during the afternoon. Steaming blocks of rock are being deposited in the Gígjökull basin; these blocks are probably solidified lava from eruption. The electrical conductivity of Krossá and Steinholtsá remains high (see reports from 28 and 29 April for details).
Conditions at eruption site: Airborne radar surveys from TF-SIF show a well-formed crater. Lava is spreading northward from the crater toward the head of Gígjökull. Ice continues to be melted by the propagating lava front.
Seismic tremor: Intensity comparable to the preceding six days of eruptive activity.
Earthquakes: No locatable seismicity detected beneath Eyjafjallajökull.
GPS deformation: Horizontal displacement towards the centre of the volcano, in addition to vertical subsidence. These observations are consistent with deflation of a magma reservoir beneath Eyjafjallajökull.
Magma flow: No measurements possible today.
Other remarks: No measurable geophysical changes within the Katla volcano.
Overall assessment: Plume elevations and magma discharge levels remain similar to the preceding seven days of activity. Lava continues to flow north from the eruption site and down the Gígjökull glacier. Today's explosive activity and ash production represents a
166
fraction of conditions during the height of the eruption (14–17 April). Presently, there are no measurable indications that the eruption is about to end.
Eruption in Eyjafjallajökull - Status Report: 18:00 GMT, 1 May 2010 Icelandic Meteorological Office and Institute of Earth Sciences, University of Iceland Compiled by: MJR / HB / FS / SSJ / BO
Based on: IMO seismic monitoring; IES-IMO GPS monitoring; IMO hydrological data; web cameras of the eruption site from Vodafone, Mila, and Múlakot; IMO weather radar measurements; information from scientists at Gígjökull; aerial observations from two scientific overflights: TF-SIF (10:30–11:00 GMT) and Eagle Air (16:40–17:15 GMT).
Eruption plume: Height (a.s.l.): TF-SIF observations at 10:30 GMT confirmed an ash plume rising to 4–5.4 km (13–18,000 ft) near to Eyjafjallajökull. Clouds of ash at lower elevations observed drifting south-east of the eruption site. No verifiable detections from the weather radar at Keflavík Airport. Heading: South-east from the eruption site. Plume track detected up to 400 km from the eruption site on AHRR and MODIS satellite imagery (12:11 GMT and 13:30 GMT). Colour: Dark grey (ash) clouds observed up to 4 km a.s.l. (~13,000 ft). White (steam) plumes rising from Gígjökull, north of the eruption site. Tephra fallout: Dark, coarser-grained ash-fall reported at Ytri Sólheimar (11:00 GMT), located 22 km south-east of Eyjafjallajökull. Lightning: No detections today over the eruption site (18:00 GMT). Noises: Booming sounds reported in the vicinity of Eyjafjallajökull. Additional note: Plumes of white steam extend partway down Gígjökull. The uppermost plume represents the position of the northward-flowing lava flow, whereas the lower plumes are from hot meltwater.
Meltwater: Discharge remains high from Gígjökull due to lava-ice interactions. Aerial observations of Gígjökull show that warm meltwater has carved a trench partway down the glacier. The electrical conductivity of Krossá and Steinholtsá remains high (see reports from 28–30 April for details).
Conditions at eruption site: A 200-m-wide eruptive crater is visible within the ice cauldron. The rim of the crater appears to be ~30 m lower than the adjacent ice surface. Lava has propagated ~1 km north from the crater toward Gígjökull. Although steam is forming over the lava front, no large emissions of steam originate from the eruptive crater.
Seismic tremor: Intensity comparable to the preceding eight days of eruptive activity.
Earthquakes: No locatable seismicity detected beneath Eyjafjallajökull.
GPS deformation: Horizontal displacement towards the centre of the volcano, in addition to vertical subsidence. These observations are consistent with deflation of a magma reservoir beneath Eyjafjallajökull.
Magma flow: No measurements possible today.
Other remarks: No measurable geophysical changes within the Katla volcano.
Overall assessment: Plume elevations and magma discharge levels remain similar to the preceding eight days of activity. Lava continues to flow north from the eruption site and down the Gígjökull glacier. Today's explosive activity and ash production represents a fraction of conditions during the height of the eruption (14–17 April). Presently, there are no measurable indications that the eruption is about to end.
167
Eruption in Eyjafjallajökull - Status Report: 21:00 GMT, 02 May 2010 Icelandic Meteorological Office and Institute of Earth Sciences, University of Iceland Compiled by: MJR / MTG / FS / BO / SSJ / SH
Based on: IMO seismic monitoring; IES-IMO GPS monitoring; IMO hydrological data; web cameras of the eruption site from Vodafone, Mila, and Múlakot; IMO weather radar measurements; information from scientists at Gígjökull. [No scientific overflight today.]
Eruption plume: Height (a.s.l.): Estimated from web-camera views and observers on the ground at an elevation of 4–5.4 km (13–18,000 ft). Clouds of ash at lower elevations observed drifting south-east of the eruption site. No verifiable detections from the weather radar at Keflavík Airport. Heading: South-east from the eruption site. Plume track visible at least 200 km from the eruption site on MODIS (12:35 GMT) and EUMETSAT (17:15 GMT) satellite imagery. Colour: Dark grey (ash) clouds observed over the eruptive site. White (steam) plumes rising from Gígjökull, north of the eruption site. Tephra fallout: Moderate ash-fall reported in the village of Vík (12:00 GMT), located 40 km south-east of Eyjafjallajökull. Lightning: No detections today over the eruption site (18:00 GMT). Noises: Booming sounds heard during the night and throughout the day up to 40 km south-east of the eruption site. Additional note: Plumes of white steam extend partway down Gígjökull. Lava appears to have advanced further down Gígjökull overnight. Aerial observations at 18:25 GMT confirmed a dense cloud of ash between 3–3.3 km a.s.l. (10,000–11,000 ft) at 60° N, 16° W (~470 km south-east of Iceland). London VAAC have been informed about this siting.
Meltwater: Before 16:00 GMT, discharge levels at the old Markarfljót bridge, ~18 km downstream from Gígjökull, were noticeably lower than yesterday's levels. Between 16:00–17:00 GMT, a meltwater pulse was detected at the bridge; the flood was comparable in size to earlier floods on 30 April. At 19:40 GMT, web-camera images of Gígjökull showed plumes of steam rising from the glacier edge. Additionally, steam is rising from the delta that occupies the lake basin, suggesting the discharge of near-boiling meltwater.
Conditions at eruption site: Explosive activity has increased somewhat over the last 2–3 days; mass flux in the plume is estimated at 10–20 tonnes/s. A scoria cone continues to form at the eruption site. Lava is propagating down Gígjökull and most of its energy is being used to melt ice. As lava advances down-glacier, the size of the ice canyon increases. Large plumes of steam are produced where lava is in contact with ice and meltwater.
Seismic tremor: During the last 30 hours, tremor levels have intensified. This intensification could be due to lava-ice interactions within Gígjökull, or conditions at the eruption site.
Earthquakes: No locatable seismicity detected beneath Eyjafjallajökull.
GPS deformation: Horizontal displacement towards the centre of the volcano, in addition to vertical subsidence. In the last couple of days increased subsidence has been observed at stations closest to the eruptive crater. These observations are consistent with deflation of a magma reservoir beneath Eyjafjallajökull, although the deformation pattern has changed somewhat.
Magma flow: See overall assessment.
Other remarks: No measurable geophysical changes within the Katla volcano.
168
Overall assessment: The eruption is mixed, with the lava-producing phase being larger than the explosive phase. During the last 2–3 days, the plume has been darker and wider than in the preceding week. Tephra fall-out in the vicinity of Eyjafjallajökull has increased. From the location of the steam plume over Gígjökull, lava has advanced over 3 km north of the eruption. Steam plumes over the glacier edge from 19:40 GMT suggest that lava may have advanced even further. A rough order-of-magnitude estimate of lava volume can be obtained from the dimensions of the ice canyon. This estimate gives a lava production rate of-the-order 20 m3 /s (i.e. 50 tonnes/s). The explosive phase may be 10–20 tonnes/s. The explosive phase has increased somewhat in intensity during the last few days. Presently, there are no measurable indications that the eruption is about to end.
Eruption in Eyjafjallajökull - Status Report: 16:00 GMT, 03 May 2010 Icelandic Meteorological Office and Institute of Earth Sciences, University of Iceland.
Compiled by: Sigurlaug Hjaltadóttir, Freysteinn Sigmundsson, Björn Oddsson, Sigrún Hreinsdóttir, Þórdís Högnadóttir.
Based on: IMO seismic monitoring; IES-IMO GPS monitoring; IMO hydrological data; web cameras of the eruption site from Vodafone; IMO weather radar measurements, MODIS satellit image; information from scientists at Gígjökull, information from the Icelandic Coast Guard flight.
Eruption plume: Height (a.s.l.): Largest plumes observed at 5-5,5 km height (17-18,000 ft) estimated from the Icelandic Coast Guard (ICG) flight at 14:30. The plume has also been observed on IMO's weather radar at 4.0-5.2 km height between 13:00 and 15:00 GMT. The plume rises higher after large explosions. Heading: East-south-east to south-east from the eruption site. Plume track clearly visible at least 200 km from the eruption site and probably another 200 further to the SE on MODIS (11:20 GMT) satellite imagery. Colour: Observation from ICG-flight: Dark grey (ash) clouds observed over the eruptive site. White (steam) plumes rising from Gígjökull outlet glacier, north of the eruption site (similar as yesterday). Tephra fallout: Moderate ash-fall reported in Álftaver, 65-70 km east-south-east of Eyjafjallajökull (07:00-10:00 GMT. An ash cloud also observed over village of Vík (10:00 GMT), 40 km south-east of Eyjafjallajökull. Lightning: No detections today over the eruption site (16:00 GMT). Noises: Scientists working at Gígjökull regularly hear explosions and booming sounds and feel the ground vibrate. The vibrations are not felt in 3-4 km distance.
Additional note: The scientists at Gígjökull experienced discomfort due to gas.
Meltwater: Today water temperature at the Markarfljot bridge was measured 11°C but about 3°C in a 2 km distance from Gígjökull. Water is flowing on both sides of the glacier and pulses of meltwater flow down the channels every 10 minutes or so (according to scientists at Gígjökull). Water level gauge at Gígjökull also records the pulses. Temperature measurements at Markarfljot bridge show a pulse of water temperature up to 17°C at 06:00 GMT this morning and another smaller pulse reaching about 15°C between 08:00 and 09:00. Water temperature has now dropped down below 4°C.
Conditions at eruption site: The eruption site was seen on a vido camera around noon (13:00 GMT). Dark ash clouds propagating eastwards. The lava is probably still propagating down Gígjökull producing more meltwater and steam.
169
Seismic tremor: Tremor levels intensified last night (2 May) and have remained high since. This intensification is seen in the frequency range 0,5-2 Hz but not above 2Hz (2-4 Hz).
Earthquakes: A few earthquakes occurred early this morning. They seem to be located at about 18 km depth just south of the eruption site.
GPS deformation: Horizontal displacement towards the center of Eyjafjallajökull volcano. Vertical displacement at stations closest to the eruption site had indicated increased subsidence rate in the last few days but now the deformation is similar as before 29 April.
Other remarks: No measurable geophysical changes within the Katla volcano.
Overall assessment: The overall activity has not changed much since yesterday (from the last report). Presently there are no indications that the eruption is about to end.
Eruption in Eyjafjallajökull - Status Report: 15:00 GMT, 04 May 2010 Icelandic Meteorological Office and Institute of Earth Sciences, University of Iceland
Compiled by: Sigurlaug Hjaltadóttir, Freysteinn Sigmundsson, Björn Oddsson, Sigrún Hreinsdóttir, Matthew J. Roberts, Hjörleifur Sveinbjörnsson.
Based on: IMO seismic monitoring; IES-IMO GPS monitoring; IMO hydrological data; web cameras of the eruption site from Vodafone, Milan and Mulakot; IMO weather radar measurements, NOAA satellite image; information from an eye witness at Fljótshlíð (MJR), information from the Icelandic Coast Guard flight.
Eruption plume: Height (a.s.l.): Plume observed at 5.8-6 km height (19-20,000 ft) estimated from the Icelandic Coast Guard (ICG) flight at 10:40 and 15:30 GMT. The plume has also been observed on IMO's weather radar at 5.2-5.4 km height between 13:05 and 14:00 GMT. Heading: East-south-east to south-east from the eruption site. Plume track clearly visible up to 300-400 km distance from the eruption site on a NOAA satellite image at 13:13 GMT. Colour: Observation from web cameras and from pilots in ICG-flight: Dark grey ash plume observed over the eruptive site, larger than yesterday. White (steam) plumes rising from Gígjökull outlet glacier, north of the eruption site smaller than yesterday. Tephra fallout: According to the police at Hvolsvöllur there was ash-fall in Álftaver and Meðalland, 65-80 km east-south-east of Eyjafjallajökull, where people could hardly see nearest farms (in a few kilometres distance). Lightning: No detections today over the eruption site. Noises: An eye witness in Fljótshlíð (9-10 N of eruption site) heard explosions every few seconds. He also hears separate noises from Gígjökull outlet glacier.
Meltwater: Water levels have been rather constant. Water temperature at Markarfljot bridge was low this morning (below 2°C) but seems to be rising (about 5°C at noon). Water level seems to be slightly decreasing.
Conditions at eruption site: Explosive activity and ash production is strong and has increased since yesterday. Dark ash plume rises above the crater. Lava is still flowing northwards, forming a lava fall down the steep hill under Gígjökull, about 4 km north of the crater. Blue gas is seen rising from the lava and white steam plumes are seen somewhat lower and mark the front of the lava stream. Radar images from ICG-flight today show tunnels in Gígjökull increasing in size and continuing the build up of the cone at the crater. The size of the eruptive crater is 280 x 190 m. Lava splashes are thrown at least a few hundred meters into the air.
170
Seismic tremor: Tremor levels decreased last night (3 May) and have decreased even further this morning at around 11:00 GMT. They now seem to be at a similar level as on 18 April.
Earthquakes: Several earthquakes were detected beneath Eyjafjallajökull yesterday evening and early this morning. As yesterday, they seem to originate deep in the crust (14 -20 km).
GPS deformation: Irregular oscillations in vertical component of stations next to the volcano.
Other remarks: No measurable geophysical changes within the Katla volcano.
Overall assessment: More explosive activity and ash production than was observed yesterday. Progression of the lava seems to be slower than yesterday. Presently there are no indications that the eruption is about to end.
Eruption in Eyjafjallajökull - Status Report: 18:00 GMT, 05 May 2010 Icelandic Meteorological Office and Institute of Earth Sciences, University of Iceland
Compiled by: Sigurlaug Hjaltadóttir, Björn Oddsson, Matthew J. Roberts, Sigrún Hreinsdóttir, Freysteinn Sigmundsson.
Based on: IMO seismic monitoring; IES-IMO GPS monitoring; IMO hydrological data; IMO weather radar measurements, MODIS satellite image; reports from people via phone and the IMO web site, information from the Icelandic Coast Guard flight yesterday.
Eruption plume: Height (a.s.l.): Plume at 5.5-6.5 km height according to IMO's weather radar; reached up to 7.2 km 40 SA of eruption site at 17:45 and 8 km height just SE of eruption site at 16:55. Information from ISAVIA: 18-20,000 ft at 14:50 GMT. Information from a Boeing 757 plane at 17:50: black plume in 21,000 ft (6.5 km). Heading: East-south-east over land and then towards southeast according to a MODIS image at 12:45. Colour: Black (see info. above). Bluish fog seen from Álftaver (65 km distance). Tephra fallout: Sólheimaheiði, Hjörleifshöfði and Álftaver (up to 70 km distance). Lightning: No detections today over the eruption site. Noises: Loud noises at farms south of the volcano troubled people during last night. Reports from people hearing loud noises in up to 200 km distance west and northwest.
Meltwater: Due to mild weather and snowmelt, increase in discharge was noticed in Markarfljót peaking at midnight. Discharge from Gígjökull seems to be decreasing and oscillations in water temperature at the old Markarfljót bridge relate to air temperature. Pulses of meltwater from Gígjökull are unnoticeable. At midnight electrical conductivity began to rise in Jökulsá á Sólheimasandi. Since then the conductivity has raised from 170 µS/cm up to 590 µS/cm (hr:15:00). Possible reason for this is volcanic ash from the eruption getting in to the meltwater from Sólheimajökull. Samples of the water have been collected for analysis.
Conditions at eruption site: The eruption sight was not visible today. From the flight of the Icelandic Coast Guard (ICG) 04.05.2010: The crater continues build up in the northern most ice cauldron. Lava flows to the north and spreads at 500 m a.s.l. The lava tongue is about 200 m wide and lava channels that join at the tongue are about 30-60 m wide. The lava to channel gets wider every day.
Seismic tremor: Similar to yesterday.
171
Earthquakes: Continued seismicity, between 20 and 30 earthquakes have been located beneath the ice cap since 3 May, first deep (18-23 km) and then also at 2 km.
GPS deformation: Significant changes in horizontal movement at GPS stations around Eyjafjallajökull have been observed in the last 48 hours. Renewed northward displacement is seen at stations BAS2 and STE2, located just north of the ice cap. To the south, westward movement is apparent at THEY, while station FIM2 - located further east - shows eastward movement.
Other remarks: Weather conditions probably cause the loud noises to be heard over long distances.
Overall assessment: Increased seismicity suggests that new material is intruding from deep below Eyjafjallajökull and latest GPS-observations suggest inflation. So far, GPS signals are not large. There are no signs that the eruption is about to end.
Eruption in Eyjafjallajökull - Status Report: 18:00 GMT, 06 May 2010 Icelandic Meteorological Office and Institute of Earth Sciences, University of Iceland.
Compiled by: Sigurlaug Hjaltadóttir, Björn Oddsson, Egill Axelsson, Matthew J. Roberts, Sigrún Hreinsdóttir, Halldór Björnsson, Bergþóra S. Þorbjarnardóttir.
Based on: IMO seismic monitoring; IES-IMO GPS monitoring; IMO hydrological data; IMO weather radar measurements, MODIS satellite image; reports from sent through the IMO web site, information from the Icelandic Coast Guard flight yesterday.
Eruption plume: Height (a.s.l.): The ash plume observed from commercial pilots between 0530h and 0800h: 30,000 ft/9km. ICG helicopter flight between 13h and 14h: sometimes under 20,000 ft (where there is a cloud bank) and oscillates up into the cloud bank (over 9 km). The height of the plume varies from 4-6 km according to the weather radar. Icelandair Cargo flight at 18:00 climbing towards east from Keflavík estimates height at 21- 22,000ft. Heading: East-south-east over land, then to the south (assessed from AVHRR figure from NOAA at 0435h and 1154h). Colour: A police officer from Hvolsvöllur, stationed at Rauðafell, observed the ash plume to be dark-gray. Observation from ICG: dark. Tephra fallout: Considerable ashfall at Þykkvabæjarklaustur in Álftaver (at a distance of 65-70 km), (everything has turned black). It has not been established whether the ash cloud south of Eyjafjallajökull is ashfall or ash that has already fallen and is being blown from the ground. Ashfall seems to start midway through Mýrdalssandur. Lightning: No detections today over the eruption site. Noises: No noise can be heard at Hvolsvöllur. No noise was heard at Seljavellir at noon. Noise heard at Heggstaðanes (200 km to the north).
Meltwater: Discharge from Gígjökull decreases further and meltwater seems to be running from the eastern side of the glacier. This is different from tuesdays meltwater were water was running from the west side. Lava flow might be changing the direction of meltwater flow. Such changes should be taken seriously with regard to possible outbursts due to accumulation of meltwater. Discharge at the old Markarfljót bridge is decreasing. It has now been verified that increase in electrical conductivity in Jökulsá á Sólheimasandi was caused by volcanic ash penetrating the glacier and the meltwater. This rules out the possibility of sulphur rich gas from magma entering the meltwater.
172
Conditions at eruption site: The lava stream down Gígjökull has been stationary for the last two days. Explosive activity has increased and the cinder cone continues to build up in the northernmost ice cauldron.
Seismic tremor: Tremor levels continued to decrease yesterday and this morning. They are now similar to what they were in the first phase of the eruption, 14 to 17 April.
Earthquakes: Earthquake activity is still being recorded. At least 10 earthquakes have been located since midnight. Most of the earthquakes are sourced beneath or south of the top crater in the eruptive conduit that has formed since 3 May. Most of the earthquakes are less than magnitude 2, the biggest M2.2. Three events have been recorded beneath the southeastern ice cap, depth uncertain.
GPS deformation: Measurements from around Eyjafjallajökull show continued horizontal displacement. South of the eruption, stations THEY and SVBH have begun to drift southward, whereas FIM2, located east of the eruption, shows northward motion. No further northward motion has been observed at STE2, located to the north. Today's displacement pattern suggests deformation beneath the southeastern part of Eyjafjallajökull.
Other remarks: Between 14 April and 5 May no signals (exept diurnal and long-period earth tides) are seen at strain-station Stórólfshvoll, ~35 km WNW of the eruption.
Overall assessment: Explosive activity has increased and effusive part has decreased for the last two days. This results in a higher eruption column with increased tephra fallout. There are no signs that the eruption is about to end.
Eruption in Eyjafjallajökull - Status Report: 16:00 GMT, 07 May 2010 Icelandic Meteorological Office and Institute of Earth Sciences, University of Iceland.
Compiled by: Sigurlaug Hjaltadóttir, Rikke Pedersen, Björn Oddsson, Ólafur Freyr Gíslason, Guðrún Larsen, Benedikt G. Ófeigsson, Matthew J. Roberts, Bergthóra S. Thorbjarnardóttir.
Based on: IMO seismic monitoring; IES-IMO GPS monitoring; IMO hydrological data; IMO weather radar measurements, MERIS satellite image; reports from sent through the IMO web site, information from commercial flights.
Eruption plume: Height (a.s.l.): 7 km according to IMO weather radar measurements at 1155h. Commercial flight heading towards Keflavík at 15:18h: 20,000- 25,000ft (7-7.6 km). Heading: Southeast Colour: Dark at the bottom, otherwise light gray. Tephra fallout: Considerable in Vík ashfall began at 21h last night; ashfall reaches to ~55-60 km from eruption site, midway through Mýrdalssandur. Lightning: No detections today over the eruption site. Noises: No reports
Meltwater: During the last 24 hours there have been no flash floods from Gígjökull measured at Markarfljótsbrú. Electrical conductivity has been decreasing and daily fluctuations in discharge and water temperature have been observed. The electrical conductivity in Jökulsá á Sólheimasandi which has been traced to ash contamination from the glacier is still quite high. An increase in discharge has been observed in rivers in the area around Mýrdals- and Eyjafjallajökull due to higher ambient temperature.
173
Conditions at eruption site: The ash plume is lower now than yesterday. The wind affects the plume and ashfall is less. The cinder cone continues to build up around the eruption vent in the ice cauldron. The lava flow to the north has been stagnant past two days.
Seismic tremor: Tremor levels are low, comparable to yesterday and the period on 14 - 17 April.
Earthquakes: Earthquakes are still being recorded at 5-13 km depth, but fewer than yesterday.
GPS deformation: Measurements from around Eyjafjallajökull indicate no major net discplaceaments, suggesting a stabilization of the surface deformation since yesterday.
Other remarks: Grainsize analysis of samples taken of ash that fell on May 3rd at 64 km distance from the eruption site shows that about 5 % of the ash is smaller than 10 micron (aerosols). This is a considerable decrease of fine particles compared to ash from April 15th (25% aerosols) sampled at a similar distance. The grain size analysis was carried out by Nýsköpunarmiðstöð Íslands.
Overall assessment: Explosive activity seems to have decreased since yesterday. The ash plume does not rise as high into the air and is lighter in colour. Steam rises from the lava tongue under Gígjökull which is a sign that ice is melting in the tunnel, but to a much lesser degree than when the lava flow was at its peak. There are no signs that the eruption is ending.
Eruption in Eyjafjallajökull - Status Report: 14:00 GMT, 08 May 2010 Icelandic Meteorological Office and Institute of Earth Sciences, University of Iceland
Compiled by: Sigurlaug Hjaltadóttir, Björn Oddsson, Sigrún Hreinsdóttir.
Based on: IMO seismic monitoring; IES-IMO GPS monitoring; IMO hydrological data; IMO weather radar measurements, MODIS and NOAA satellite images; reports sent through the IMO web site, a flight over the eruption site today, information from commercial flights.
Eruption plume: Height (a.s.l.): 18-20,000 ft/5.5-6 km around 08:00h (commercial flight). 15-17,000 ft /4,5-5 km (according to scientists flying over the eruption site 12- 13:00h). Heading: Southeast Colour: Grey/light gray. Tephra fallout: In Vík and nearest vicinity. Very small amount of fine, dark ash detected on a white plate in Hvolsvöllur 06:00 this morning. Lightning: No detections today over the eruption site. Noises: No reports
Meltwater: Similar to yesterday, daily fluctuations in discharge and temparature.
Conditions at eruption site: The eruption is still in an explosive phase. The tephra and spatter cone continues to build up and is now reaching near the rim of the ice edge around the crater. The plume does'nt rise vertically from the crater, but bends SE-wards due to wind. Plume reaches higher after larger explosions. Thephra fallout near the crater is considerably less than was observed on May 6th. There is little lava flow down Gígjökull and the lava front has not changed for the last couple of days. Very little steam rises from the lava edge. A small lava tunnel was observed with an infrared camera near to the crater.
Seismic tremor: Low, similar to yesterday and similar amplitude on all frequency bands.
174
Earthquakes: Less earthquake activity, two events, Ml 1.2, detected at 9 and 12 km depth at around 11:00h and two of similar magnitude around 14:00.
GPS deformation: No significant changes were observed at GPS stations around Eyjafjallajökull glacier.
Overall assessment: The eruption is still in a strong explosive phase, but still less than it was late on May 5th and during May 6th. Little or no steam is observed at Gígjökull. Thephra fallout may be expected in the nearest vicinity of the volcano, but nothing in comparison to the first days of the eruption in April.
Eruption in Eyjafjallajökull - Status Report: 12:00 GMT, 09 May 2010 Icelandic Meteorological Office and Institute of Earth Sciences, University of Iceland.
Compiled by: Sigurlaug Hjaltadóttir, Björn Oddsson, Sigrún Hreinsdóttir.
Based on: IMO seismic monitoring; IES-IMO GPS monitoring; IMO hydrological data; IMO weather radar measurements, MODIS and NOAA satellite images.
Eruption plume: Height (a.s.l.): 4-5 km/14-17,000 ft but sometimes shoots up to 6 km /20.000 ft. Heading: Southeast. But low level winds are easterly. Colour: Grey/light gray. Tephra fallout: Farther west now, ashfall started at Þorvaldseyri (south of eruption) around 08:00h, has also been reported at Skógar this morning (7-8 km east of Þorvaldseyri). The ash is black. Lightning: No detections today over the eruption site. Noises: Reports from Vestmannaeyjar-islands (35-40 km southwest of erutpion), Vatnsdalur (190 -200 km to the north), and Borgarfjörður (~150 km to the northwest.)
Meltwater: Daily fluctuations in discharge and temparature. No flash floods have been detected. Conditions at eruption site: There was no flight today, but observations from web cameras show similar activity to yesterday.
Seismic tremor: Has been similar for the past 3 days, and similar amplitude on all frequency bands.
Earthquakes: Seven earthquakes of magnitude 1.5-2 have been located for the last 24hrs.
GPS deformation: Horizontal displacement towards the center of Eyjafjallajökull volcano and subsidence.
Overall assessment: Compared to last seven days, the output from the volcano has been slowly decreasing but the activity has been pulsating and further changes in overall activity can be expected. Presently there are no indications that the eruption is about to end.
Eruption in Eyjafjallajökull - Status Report: 15:00 GMT, 10 May 2010 Icelandic Meteorological Office and Institute of Earth Sciences, University of Iceland
Compiled by: Steinunn S. Jakobsdóttir, Gunnar Sigurðsson, Björn Oddsson, Sigrún Hreinsdóttir.
175
Based on: IMO seismic monitoring; IES-IMO GPS monitoring; IMO hydrological data; IMO weather radar measurements, MODIS satellite images.
Eruption plume: Height (a.s.l.): ~5 km / 17,000 ft but sometimes shoots up to 6 km / 20,000 ft. Heading: Southeast. Low level winds are variable. Colour: Grey / light gray. Tephra fallout: Ashfall reported at Drangshlíð and Skarðshlíð almost continuously for the last 24 hours. The ash is rather coarse, estimated by the farmers to be ~2-3 mm. Lightning: No lightning has been detected on instruments over the eruption site for the last week. Noises: No reports.
Meltwater: Low water discharge at Gígjökull. Daily fluctuations in discharge and temparature are dominating the water flow at Markarfljótsbrú. No flash floods have been detected.
Conditions at eruption site: There was no flight today, but observations from web cameras show similar activity to yesterday. The crater is getting higher. Lava rate flow is low and not visible on cameras. In the afternoon there was a slight increase in explosive activity, which resulted in a higher plume for a while.
Seismic tremor: Has been similar for the past 3 days, and similar amplitude on all frequency bands.
Earthquakes: A sequence of earthquakes started around 11:00h this morning. Some 40 earthquakes were located, mostly at depths of 18 – 20 km and magnitude range Ml 1 – Ml 2. As the background tremor is much lower now than last week, much smaller earthquakes are observed, partly counting for the number of earthquakes detected this morning.
GPS deformation: Horizontal displacement towards the center of Eyjafjallajökull volcano and subsidence. Some irregular movements are seen in the height of the station closest to the volcano.
Overall assessment: The earthquake sequence this morning indicates that magma is still flowing in from the mantle. Presently there are no indications that the eruption is about to end.
Eruption in Eyjafjallajökull - Status Report: 15:00 GMT, 11 May 2010 Icelandic Meteorological Office and Institute of Earth Sciences, University of Iceland
Compiled by: Steinunn S. Jakobsdóttir, Gunnar Sigurðsson, Haraldur Eiríksson, Sigurlaug Hjaltadóttir, Björn Oddsson, Sigrún Hreinsdóttir.
Based on: IMO seismic monitoring; IES-IMO GPS monitoring; IMO hydrological data; IMO weather radar measurements, ATDnet – UK Met. Offices lightning detection system, MERIS satellite images and observations from aircraft.
Eruption plume: Height (a.s.l.): 5–6 km / 17,000 ft - 20,000 ft. Heading: Southsoutheast. Colour: Grey. Tephra fallout: No reports, but clearly seen on video cameras. Lightning: Nine lightning were recorded on the ATDnet. Noises: No reports.
176
Meltwater: Low water discharge at Gígjökull.
Conditions at eruption site: Observations from air and web cameras show similar activity to yesterday. In the afternoon there was an increase in explosive activity, giving darker and slightly higher plume.
Seismic tremor: Slight increase in the lower frequency bands.
Earthquakes: Sixteen earthquakes were located since yesterday, mostly at depths of 18 – 20 km and magnitude less than Ml 2.
GPS deformation: Small displacements towards the center of Eyjafjallajökull volcano but irregular oscillations in the vertical component of a station closest to the volcano.
Overall assessment: No major changes are seen in the activity, but small variation can still be expected. The ash plume increased slightly in the afternoon. Presently there are no indications that the eruption is about to end.
Eruption in Eyjafjallajökull - Status Report: 15:00 GMT, 12 May 2010 Icelandic Meteorological Office and Institute of Earth Sciences, University of Iceland
Compiled by: Steinunn S. Jakobsdóttir, Gunnar Sigurðsson, Sigrún Hreinsdóttir. Based on: IMO seismic monitoring; IES-IMO GPS monitoring; IMO hydrological data; IMO weather radar measurements, web cameras, ATDnet – UK Met. Offices lightning detection system, NOAA satellite images and observations from aircraft and web-based ash reports from the public. Eruption plume: Height (a.s.l.): Mainly ~ 4 - 5 km / 13,000 - 17,000 ft, highest up to ~ 6 km / 20,000 ft. Heading: East-southeast. Colour: Grey. Tephra fallout: Ashfall reported in Vík í Mýrdal and Meðalland. Ash mist in Álftaver. Lightning: Several lightning were recorded on the ATDnet until noon today. Noises: No reports. Meltwater: Low water discharge at Gígjökull. Conditions at eruption site: Similar activity to yesterday according to instruments and web cameras. The plume is a little lower today than yesterday. Seismic tremor: Similar to previous days. Earthquakes: Only a few earthquakes have been located since yesterday, all of magnitude less than Ml 2. GPS deformation: Horizontal displacements towards the center of Eyjafjallajökull volcano and subsidence. Overall assessment: No major changes are seen in the activity. The ash plume has slightly decreased since yesterday. Presently there are no indications that the eruption is about to end.
177
Eruption in Eyjafjallajökull - Status Report: 16:00 GMT, 13 May 2010 Icelandic Meteorological Office and Institute of Earth Sciences, University of Iceland
Compiled by: Steinunn S. Jakobsdóttir, Elín Björk Jónasdóttir, Björn Oddsson, Sigrún Hreinsdóttir.
Based on: IMO seismic monitoring; IES-IMO GPS monitoring; IMO hydrological data; IMO weather radar measurements, web cameras, ATDnet – UK Met. Offices lightning detection system, NOAA satellite images, observations from aircraft and web-based ash reports from the public.
Eruption plume: Height (a.s.l.): Mainly 6 km / 20,000 ft, highest up to ~ 9 km / 30,000 ft. The wind is calm over the eruption site and unstable air south of it, which does affect the height of the ash cloud. Heading: Southeast. Colour: Grey. Tephra fallout: Ongoing ashfall since 0600h reported from south of Eyjafjöll, Berjanes, Drangshlíð and Skarðshlíð. Ashfall from midnight until morning at Skógar. The ash is somewhat finer today than yesterday. Lightning: Twenty lightning were recorded on the ATDnet since last night. Noises: No reports.
Meltwater: Low water discharge at Gígjökull.
Conditions at eruption site: The upper part of the ash cloud and the lower part of Eyjafjallajökull could be seen from the aircraft, the rest was in clouds. The top of the ash cloud was at ~ 5 km / 17.000 ft. No great changes seen in Gígjökull.
Seismic tremor: Similar to previous days.
Earthquakes: At around 1600h 4 earthquakes were measured beneath Eyjafjallajökull, all of them were located at shallow depth.
GPS deformation: Horizontal displacements towards the center of Eyjafjallajökull volcano and subsidence.
Overall assessment: No major changes are seen in the activity. The ash plume has increased since yesterday. Presently there are no indications that the eruption is about to end.
Eruption in Eyjafjallajökull - Status Report: 17:00 GMT, 14 May 2010 Icelandic Meteorological Office and Institute of Earth Sciences, University of Iceland
Compiled by: Steinunn S. Jakobsdóttir.
Based on: IMO seismic monitoring; IES-IMO GPS monitoring; IMO hydrological data; IMO weather radar measurements, web cameras, ATDnet – UK Met. Offices lightning detection system, NOAA satellite images and web-based ash reports from the public.
Eruption plume: Height (a.s.l.): Mainly ~7 km / 24,000 ft. Heading: West and later southwest. Colour: Grey. Tephra fallout: Ashfall reported from the Vestmanna Islands, Rangárþing east and in Reykjavík.
178
Lightning: More than 50 lightning strikes were recorded on the ATDnet during the last 24 hours. Between 4 and 5 this morning, 10 lightning were detected. Noises: No reports.
Meltwater: Low water discharge at Gígjökull.
Conditions at eruption site: No reports.
Seismic tremor: Similar to previous days.
Earthquakes: Three earthquakes were located beneath Eyjafjallajökull, at ~ 7 -8 km depth.
GPS deformation:Slight horizontal displacements towards the center of Eyjafjallajökull volcano and subsidence.
Overall assessment: No major changes are seen in the activity. Presently there are no indications that the eruption is about to end.
Eruption in Eyjafjallajökull - Status Report: 15:00 GMT, 15 May 2010 Icelandic Meteorological Office and Institute of Earth Sciences, University of Iceland
Compiled by: Steinunn S. Jakobsdóttir, Sigrún Hreinsdóttir.
Based on: IMO seismic monitoring; IES-IMO GPS monitoring; IMO hydrological data; IMO weather radar measurements, web cameras, ATDnet – UK Met. Offices lightning detection system, NOAA satellite images and web-based ash reports from the public.
Eruption plume: Height (a.s.l.): Mainly ~ 6 - 7 km / 21,000 - 24,000 ft, occationally reaching 8 km / 27,000 ft. Heading: Southwest and later south. Colour: Grey. Tephra fallout: Ashfall reported south of Eyjafjallajökull and ashdrift southeast of Eyjafjallajökull. Lightning: Some 30 lightning strikes were recorded on the ATDnet during the last 24 hours. Noises: No reports.
Meltwater: Low water discharge at Gígjökull.
Conditions at eruption site: No flight observations, but according to web cameras and instruments there are no major changes.
Seismic tremor: Similar to previous week.
Earthquakes: An earthquake swarm started beneath Eyjafjallajökull just before midnight. In the period between 23:54 and 02:45, more than thirty earthquakes were located at depth greater than 20 km and magnitude less than Ml 2. A few more earthquakes were detected until morning.
GPS deformation: Horizontal displacements towards the center of Eyjafjallajökull volcano and subsidence. Some irregular movements are seen in the height of the stations closest to the volcano.
Overall assessment: No major changes are seen in the activity, the ash cloud is slightly higher than yesterday. Presently there are no indications that the eruption is about to end.
179
Eruption in Eyjafjallajökull - Status Report: 17:00 GMT, 16 May 2010 Icelandic Meteorological Office and Institute of Earth Sciences, University of Iceland.
Compiled by: Steinunn S. Jakobsdóttir, Sigrún Hreinsdóttir.
Based on: IMO seismic monitoring; IES-IMO GPS monitoring; IMO hydrological data; IMO weather radar measurements, web cameras, ATDnet – UK Met. Offices lightning detection system, NOAA satellite images and web-based ash reports from the public.
Eruption plume: Height (a.s.l.): Mainly ~ 7 - 9 km / 24,000 - 30,000 ft. Heading: Southeast and east-southeast. There wind is calm over the volcano, with wind speed ~10 m/sec at height over 7 km / 24,000 ft. Colour: Grey. Tephra fallout: Ash fall reported southeast of Eyjafjallajökull, from Skógar to Pétursey on Mýrdalssandur. Lightning: More than 150 lightning strikes were recorded on the ATDnet during the last 24 hours. From 8 am to 11 am this morning 54 lightning were detected. Noises: No reports.
Meltwater: Low water discharge at Gígjökull.
Conditions at eruption site: No flight observations, but according to web cameras and instruments there are no major changes.
Seismic tremor: Similar to previous week. Earthquakes: Three small earthquakes were detected beneath Eyjafjallajökull during the night. They were of shallow, intermediate and deep origin. A few shallow earthquakes occurred around 3 pm. GPS deformation: Horizontal displacements towards the center of Eyjafjallajökull volcano and subsidence. Overall assessment: No major changes are seen in the activity. The ash cloud has been of variable height the last days and is higher today than yesterday, influenced by the calm weather. Unusually many lightning have been detected. Presently there are no indications that the eruption is about to end.
Eruption in Eyjafjallajökull - Status Report: 17:00 GMT, 17 May 2010 Icelandic Meteorological Office and Institute of Earth Sciences, University of Iceland
Compiled by: Sigþrúður Ármannsdóttir, Sigrún Hreinsdóttir, Elín Björk Jónasdóttir, Björn Oddsson, Magnús Tumi Guðmundsson and Bergþóra S. Þorbjarnardóttir.
Based on: IMO seismic monitoring; IES-IMO GPS monitoring; IMO hydrological data; IMO weather radar measurements, web cameras, ATDnet – UK Met. Offices lightning detection system, NOAA satellite images and web-based ash reports from the public.
Eruption plume: Height (a.s.l.): About 6 – 7 km according to radar, occasionally pulsating to 9 km/27,000 ft. Winds around the volcano are slightly increasing, resulting in lower plume height. Heading: The plum is drifting east.
180
Colour: Dark-gray at 6 km (seen on webcam).
Tephra fallout: Ash has fallen in the Gnúpverjahreppur area, on the road to Stultartangi Power Station and in the Biskupstungur area (very fineparticled and gray). Lightning: Constant lightning (up to 10 flashes per hour) has been detected. Noises: In Hafnarfjörður.
Meltwater: Low water discharge at Gígjökull.
Conditions at eruption site: The eruption site has not been visible today. The ash plume rises to 6-7 km and straight up from the site. During a survey on 16 May a considerable amount of ashfall was observed south of Goðasteinn and moved westward later in the day. Frequent lightning was observed followed by thunder.
Seismic tremor: The volcanic tremor is similar to that of the last few days.
Earthquakes: Six microearthquakes have been recorded since midnight. Most of them occurred at depths of more than 10 km.
GPS deformation: Continued horizonal displacements towards the center of Eyjafjallajökull volcano and subsidence.
Overall assessment: The volcanic activity is explosive, but there are indications that it has somewhat lessened since the maximum on 13 May. Considerable ashfall is in the nighbouring communities and is expected to continue. Fluctuations in the strength of the eruption and in ashfall can still be expected.
Eruption in Eyjafjallajökull - Status Report: 17:00 GMT, 18 May 2010 Icelandic Meteorological Office and Institute of Earth Sciences, University of Iceland.
Compiled by: Sigþrúður Ármannsdóttir, Sigrún Hreinsdóttir, Magnús Tumi Guðmundsson, Theodór Freyr Hervarsson and Matthew J. Roberts.
Based on: IMO seismic monitoring; IES-IMO GPS monitoring; IMO hydrological data; IMO weather radar measurements, web cameras, ATDnet – UK Met. Offices lightning detection system, NOAA satellite images and web-based ash reports from the public.
Eruption plume: Height (a.s.l.): According to radar observations, the plume has been mostly at 7 km/21,000 ft. South and southwesterly winds (25-35 kt) over the volcano. Near the surface, the wind was easterly, blowing ash from the ground towards west and northwest. Heading: The plume is drifting northeast. Colour: Gray (as seen on web cameras). Tephra fallout: Ash has fallen in the Gnúpverjahreppur area, Hrauneyjar and in the north-east and east part of Iceland (from Laugar in S-Thingeyjarsýsla to Seydisfjordur). Higher aerosol concentrations have been recorded in Reykjavík around midday due to ash drifting over the area. Lightning: More than 70 lightning strikes from midnight to midday (up to 10 flashes per hour until noon but has deacresed in the afternoon) have been detected. Noises: No reports.
Meltwater: Low water discharge at Gígjökull. Conditions at eruption site: No direct observations of the eruption site today. The plume has been mostly steady at 7 km height. The size, height and colour of the plume suggest that
181
conditions are similar to what they have been over the last several days. Seismic tremor: Volcanic tremor is similar to that of the last few days, although the low frequency has slightly decreased during the last days. Earthquakes: One microearthquake has been recorded since midnight at a depth of more than 16 km. GPS deformation: Continued horizonal displacements towards the center of Eyjafjallajökull volcano together with subsidence.
Overall assessment: A powerful explosive eruption is ongoing and the height of the column suggests that the eruption rate is over 200 tonnes/s. Fallout of tephra has been detected mainly to the northeast of the volcano, with recorded fallout on the northeast coast. Some tephra dispersion towards west in the afternoon.
Eruption in Eyjafjallajökull - Status Report: 17:00 GMT, 19 May 2010 Icelandic Meteorological Office and Institute of Earth Sciences, University of Iceland
Compiled by: Sigþrúður Ármannsdóttir, Sigrún Hreinsdóttir, Helga Ívarsdóttir, Matthew J. Roberts, Bergþóra S. Þorbjarnardóttir and Steinunn Jakobsdóttir. Based on: IMO seismic monitoring; IES-IMO GPS monitoring; IMO hydrological data; IMO weather radar measurements, web cameras, ATDnet – UK Met. Offices lightning detection system, NOAA satellite images and web-based ash reports from the public.
Eruption plume: Height (a.s.l.): According to radar and pilots‘ observations, the plume has been slightly lower today than yesterday, at 5-6 km/18,000-20,000ft. Southerly winds prevailed this morning over the volcano, turning to the southwest at 15-18 m/s. Heading: The plume drifted northwest early this morning, but then turned northnortheast (according to radar). Colour: Gray or light gray. Tephra fallout: Ash has fallen in the south at Flúðir, Fljótshlíð and Rangárþing ytri, and with rainfall in the north in Húsavík and Skagafjörður right before noon. Lightning: Over 20 lightning strikes have been detected from midnight to midday, considerably fewer then yesterday. Noises: No reports.
Meltwater: Heavy rainfall caused swelling of Eyjafjallajökull rivers today. The rain, together with ash from an area of a few square kilometers, resulted in a mudslide in Svaðbæli River, Hydrologists from IMO and a scientist from the Earth Science Institute, University of Iceland, gathered samples from the river and also from Skógar River. The discharge at the old bridge over Markarfljót River has not been greater since 15 April. The discharge at Gígjökull is still low. Conditions at eruption site: The plume is up to 5-6 km and drifts to the north-northeast according to reconnaissance flight from the Icelandic Coast Guard this afternoon. The number of lightning strikes has decreased. Seismic tremor: Volcanic tremor is steady and similar to that of the last few days. Earthquakes: No earthquakes have been recorded in the area since the night before last.
182
GPS deformation: Continued horizonal displacements towards the center of Eyjafjallajökull volcano together with subsidence.
Overall assessment: The ash plume has been slightly lower today than in the last days and the number of lightning strikes has decreased. Tephra fallout has been detected northwest of the eruption site and also in the north of the country at around and after 12 p.m.
Eruption in Eyjafjallajökull - Status Report: 17:00 GMT, 20 May 2010 Icelandic Meteorological Office and Institute of Earth Sciences, University of Iceland
Compiled by: Sigþrúður Ármannsdóttir, Sigrún Hreinsdóttir, Helga Ívarsdóttir, Bergþóra S. Þorbjarnardóttir, Björn Oddsson and Gunnar Sigurðsson.
Based on: IMO seismic monitoring; IES-IMO GPS monitoring; IMO hydrological data; IMO weather radar measurements, web cameras, ATDnet – UK Met. Offices lightning detection system, NOAA satellite images and web-based ash reports from the public.
Eruption plume: Height (a.s.l.): According to radar observations, the plume has been at around 5 km/18,000ft. today. Over the volcano, winds blow from the south at 10 m/s, but at the top of the plume the wind is south-southwesterly at 13 m/s. Heading: North, but turns to the northeast over the highlands (according to radar and weather satellite). Colour: Gray. Tephra fallout: Ashfall has only been reported at Fljótsdalur, the innermost farm in Fljótshlíð, beginning last night and continuing all day. Lightning: Ten lightning strikes were detected from midnight to 13h, but none since. Noises: No reports.
Meltwater: Meltwater from the eruption site is still at a low. Water discharge in rivers around the Eyjafjallajökull glacier has decreased again after the increase caused by rainfall yestarday. Tomorrow, water gauges will be installed in Bakkakot River to monitor potential mudslides like the one that occurred yesterday in Svaðbæli River.
Conditions at eruption site: The volcano has not been visible for two days due to cloudy weather. Radar images from TF-SIF show no major changes in the ice cauldrons where the cinder cone is forming. The eruption is mainly explosive and almost no lava flows down Gígjökull.
Seismic tremor: Volcanic tremor is fairly steady and similar to that of the last few days.
Earthquakes: Two microearthquakes have been recorded in the volcano since midnight, at depths of around 7 and 3 km.
GPS deformation: Irregular oscillations in the vertical component of stations closest to the volcano.
Overall assessment: The height of the ash plume has decreased in the last few days which suggests a decrease in magma flow (considerably less than 50 tonns/sec) compared to the flow over the weekend and at the end of last week. Fluctuations in eruption activity and varying ashfall can still be expected.
183
Eruption in Eyjafjallajökull - Status Report: 19:00 GMT, 21 May 2010 Icelandic Meteorological Office and Institute of Earth Sciences, University of Iceland
Compiled by: Sigþrúður Ármannsdóttir, Matthew J. Roberts, Teitur Arason, Bergþóra S. Þorbjarnardóttir, Magnús Tumi Guðmundsson and Gunnar Sigurðsson.
Based on: Observations from inspection flight at 6 PM, IMO seismic monitoring; IESIMO GPS monitoring; IMO hydrological data; IMO weather radar measurements, web cameras, ATDnet – UK Met. Offices lightning detection system, NOAA satellite images and web-based ash reports from the public.
Eruption plume: Height (a.s.l.): Observation from inspection flight and other pilot reports show that the plume is at a height of 3-3.5 km/10,000-12,000ft. Plume is blown towards northeast and later northwest by light southerly winds. Heading: Northeast at first and later northwest. Colour: Light grey, with a small amount of ash. Tephra fallout: No reports of ashfall today. Reports from Neðri-Þverá and Hlíðarendakot in Fljótshlíð of bluish gas in Fljótsdalur and along the hillsides in some sort of clouds, smelling of rot (causing people headaches when dark in colour). Lightning: No lightning strikes have been detected since 13h, yesterday. Noises: No reports.
Meltwater: Small discharge from Gígjökull. A water gauge is being installed in Kaldaklif River today.
Conditions at eruption site: The eruption rate has declined a great deal and the weak plume rises from the western part of the crater. No real explosions and no lava flowing from the crater.
Seismic tremor: Volcanic tremor levels have decreased since yesterday evening. However, they rose for two hours this morning, but have since continued to decrease.
Earthquakes: Over twenty earthquakes have been recorded since midnight, the majority at shallow depths.
GPS deformation: Continued horizontal displacements toward the centre of Eyjafjallajökull volcano. Irregular oscillations in the vertical component of stations closest to the volcano.
Overall assessment: The eruption has declined a great deal and the flow of magma into the crater can be roughly estimated as 5 tonnes/s, carried away by a plume that rises 1.5-2 km above the creater. No lava flowing.
Eruption in Eyjafjallajökull - Status Report: 14:00 GMT, 22 May 2010 Icelandic Meteorological Office and Institute of Earth Sciences, University of Iceland
Compiled by: Sigþrúður Ármannsdóttir, Sigrún Hreinsdóttir, Teitur Arason, Steinunn S. Jakobsdóttir and Hrafn Guðmundsson.
Based on: IMO seismic monitoring; IES-IMO GPS monitoring; IMO hydrological data; web cameras, ATDnet – UK Met. Offices lightning detection system, Satellite images and web-based ash reports from the public.
Eruption plume: Height (a.s.l.): According to a reconnaissance flight, the plume is estimated at 4 km/14,000ft.
184
A light easterly wind blows the plume to the west Heading: West. Colour: Light grey and grey, with a small amount of ash to the west, according to the reconnaissance flight. Tephra fallout: No reports of ashfall today. Lightning: No lightning strikes have been detected since 13:00, two days ago. Noises: No reports.
Meltwater: Small discharge from Gígjökull.
Conditions at eruption site: The eruption rate is similar as yesterday. Still some explosive activity seen from the reconnaissance flight. Crater or lava flow not visible due to overcast cloud layer over the volcano.
Seismic tremor: Volcanic tremor levels similar to yesterday.
Earthquakes: About twenty earthquakes have been recorded since midnight, the majority at shallow depths.
GPS deformation: Horizontal displacements toward the centre of Eyjafjallajökull volcano and subsidence.
Overall assessment: The eruption is ongoing similar as yesterday. There are occasional explosions in the crater.
Eruption in Eyjafjallajökull - Status Report: 17:00 GMT, 23 May 2010 Icelandic Meteorological Office and Institute of Earth Sciences, University of Iceland
Compiled by: Sigþrúður Ármannsdóttir, Sigrún Hreinsdóttir, Teitur Arason, Magnús Tumi Guðmundsson, Matthew J. Roberts, Hrafn Guðmundsson and Steinunn S. Jakobsdóttir.
Based on: IMO seismic monitoring; IES-IMO GPS monitoring; IMO hydrological data; web cameras, ATDnet – UK Met. Offices lightning detection system, Satellite images, web-based ash reports from the public and observations from aircraft.
Eruption plume: Height (a.s.l.): According to a pilot, the plume is estimated at 3 km/10,000ft. A light northerly wind. Heading: South. Colour: White, steam. Tephra fallout: No reports of ashfall. Lightning: No lightning strikes have been detected. Noises: No reports.
Meltwater: Low discharge from Gígjökull.
Conditions at eruption site: Measurements with heat camera made from an aircraft gave almost 100°C as the highest temperatures at the crater. The crater could not be observed due to steam rising from it. No signs of extrusion of magma could be seen.
Seismic tremor: Volcanic tremor is still decreasing and is approaching the level it had before the eruption.
Earthquakes: About twenty earthquakes have been recorded since midnight, mainly at shallow depths.
185
GPS deformation: Horizontal displacements toward the centre of Eyjafjallajökull volcano and subsidence.
Overall assessment: The eruption seems to be dormant today. There is still a considerable amount of steam coming from the crater, but no ash can be seen in it. The tremor is still higher than before the onset of the eruption, especially in the frequency band 1 – 2 Hz, but that might be due to the rising steam.
Eruption in Eyjafjallajökull - Status Report: 14:00 GMT, 24 May 2010 Icelandic Meteorological Office and Institute of Earth Sciences, University of Iceland
Compiled by: Sigþrúður Ármannsdóttir, Þorsteinn V. Jónsson and Björn Sævar Einarsson.
Based on: IMO seismic monitoring; IES-IMO GPS monitoring; IMO hydrological data; web cameras, ATDnet – UK Met. Offices lightning detection system, Satellite images and web-based ash reports from the public.
Eruption plume: Height (a.s.l.): According to a webcamera, the plume is estimated at 2 km/6600ft. A light northerly wind. Heading: South. Colour: White, steam. Tephra fallout: No reports of ashfall. Lightning: No lightning strikes have been detected. Noises: No reports.
Meltwater: Low discharge from Gígjökull.
Conditions at eruption site: Similar as yesterday, estimated through a webcamera.
Seismic tremor: Volcanic tremor is still decreasing and is approaching the level it had before the eruption.
Earthquakes: Earthquake activity has decreased since yesterday. One earthquake has been recorded since midnight.
GPS deformation: Horizontal displacements toward the centre of Eyjafjallajökull volcano and subsidence.
Overall assessment: The eruption seems to be dormant. There is still a considerable amount of steam coming from the crater, but no ash can be seen in it. The tremor is still higher than before the onset of the eruption, especially in the frequency band 1-2 Hz.
Eruption in Eyjafjallajökull - Status Report: 17:00 GMT, 25 May 2010 Icelandic Meteorological Office and Institute of Earth Sciences, University of Iceland
Compiled by: Hjörleifur Sveinbjörnsson, Þorsteinn V. Jónsson, Björn Sævar Einarsson and Sigrún Hreinsdóttir
Based on: IMO seismic monitoring; IES-IMO GPS monitoring; IMO hydrological data; web cameras, ATDnet – UK Met. Offices lightning detection system, Satellite images and web-based ash reports from the public, and scientist on the volcano.
Eruption plume: Height (a.s.l.): According to a webcamera, the plume is estimated at 2 km/6600 ft. A light northerly wind.
186
Heading: South. Colour: White, steam. Tephra fallout: No reports of ashfall. Lightning: No lightning strikes have been detected. Noises: No reports.
Meltwater: Low discharge from Gígjökull.
Conditions at eruption site: Similar as yesterday, estimated through a webcamera and a flight over the volcano. Blue smog (sulfuric gases) could be seen and a strong smell was felt inside the airplane when flying south of the volcano. A group of scientists went to the crater today and they could see a small blast of ash, but mostly it is steam that is formed above the crater that can be seen from distance.
Seismic tremor: Volcanic tremor is still greater than before the eruption and has been rather steady the last couple of days, but small pulses, mostly on the lowest frequency (0.5-1.0 Hz), are being detected on the earthquake stations around the volcano.
Earthquakes: Eleven earthquakes have been detected under the volcano today, but 8 earthquakes were detected there yesterday.
GPS deformation: No significant deformation at sites around Eyjafjallajökull in the last couple of days.
Overall assessment: There is still a considerable amount of steam coming from the crater, and a small blast of ash was seen by scientist standing by the crater, but no ash was seen in the flight nor from the web cameras. The tremor is still higher than before the onset of the eruption, and small tremor pulses have been detected on the lowest frequency.
Eruption in Eyjafjallajökull - Status Report: 17:00 GMT, 26 May 2010 Icelandic Meteorological Office and Institute of Earth Sciences, University of Iceland
Compiled by: Hjörleifur Sveinbjörnsson, Teitur Arason and Sigrún Hreinsdóttir.
Based on: IMO seismic monitoring; IES-IMO GPS monitoring; IMO hydrological data; web cameras, ATDnet – UK Met. Offices lightning detection system, Satellite images and web-based ash reports from the public.
Eruption plume: Height (a.s.l.): According to a webcamera in the morning, the plume was estimated at 2 km/6600ft. Northerly wind. Heading: South. Colour: White, steam. Tephra fallout: No reports of ashfall. Lightning: No lightning strikes have been detected. Noises: No reports.
Meltwater: Low discharge from Gígjökull.
Conditions at eruption site: Similar as yesterday, estimated through a webcamera. But in the afternoon the visibility has been very poor caused by ash that has been blown up around the volcano. Because of this, the visibility in Vestmannaeyjar was 1 km and 2 km in Vatnsskarðshólar and the volcano could not be seen on the webcameras in the afternoon.
187
Seismic tremor: Volcanic tremor is still more than before the eruption and has been rather steady the last couple of days, but small pulses, mostly on the lowest frequency (0.5-1.0 Hz), are being detected on the earthquake stations around the volcano.
Earthquakes: Four earthquakes have been detected under the volcano today, but 16 earthquakes were detected there yesterday.
GPS deformation: No significant deformation at sites around Eyjafjallajökull in the last couple of days.
Overall assessment: There is still a considerable amount of steam coming from the crater. The tremor is still higher than before the onset of the eruption, and small tremor pulses have been detected on the lowest frequency. Very fine ash has been blown up, but it does not go very high up in the air, but covers the volcano so it can not be seen on webcameras.
Eruption in Eyjafjallajökull - Status Report: 12:00 GMT, 28 May 2010 Icelandic Meteorological Office and Institute of Earth Sciences, University of Iceland.
Compiled by: Ármann Höskuldsson, Hjörleifur Sveinbjörnsson, Haraldur Eiríksson, Björn Sævar Einarsson.
Based on: IMO seismic monitoring; IES-IMO GPS monitoring; IMO hydrological data; web cameras, ATDnet – UK Met. Offices lightning detection system, Satellite images, web-based ash reports from the public and scientists that went to the volcano. Eruption plume: Height (a.s.l.): Clouds have covered the top of the mountain this morning and therefore the plume has not been seen on web-cameras. Light wind from ENE. Tephra fallout: No reports of ashfall. Lightning: No lightning strikes have been detected. Noises: No reports. Meltwater: Low discharge from Gígjökull. Conditions at eruption site: IES expedition to the summit of Eyjafjallajökull yesterday. Tephra thickness in and around the eastern half of the crates was measured. Tephra up to 40 m thick closes to the craters. Intense steam rises up from the craters, with occasional small ashy explosions. Noise of intense boiling and or degassing from the craters. Visibility to the bottom limited due to steam. The crater rim is coated with fine ash that extends me 20 m from the edge. Strong smell of sulfur around the craters. At 20:45 the steam plume was measured to be at the altitude of 2.8 km.
Seismic tremor: Volcanic tremor is still more than before the eruption and has been rather steady since 22nd May, but small pulses, mostly on the lowest frequency (0.5-1.0 Hz), are being detected on the earthquake stations around the volcano. Earthquakes: Six earthquakes have been detected under the volcano today, but seven earthquakes were detected there yesterday. GPS deformation: No significant deformation at sites around Eyjafjallajökull. Overall assessment: There is still a considerable amount of steam coming from the crater. The tremor is still higher than before the onset of the eruption, and small tremor pulses have been detected on the lowest frequency. Rain has prevented the ash to be blown up from the ground around the volcano. The volcano will continue to be monitored closely as before.
188
Eruption in Eyjafjallajökull - Status Report: 15:00 GMT, 1 June 2010 Icelandic Meteorological Office and Institute of Earth Sciences, University of Iceland Compiled by: Gunnar B. Guðmundsson, Helga Ívarsdóttir, Sibylle von Löwis and Sigrún Hreinsdóttir Based on: IMO seismic monitoring; IES-IMO GPS monitoring; IMO hydrological data; web cameras, ATDnet – UK Met. Offices lightning detection system, webbased ash reports from the public and scientists that went to the volcano. Eruption plume: Height (a.s.l.): Clouds and mist have covered the summit of the volcano both yesterday and today. At 08:00 GMT today a white cloud was seen at 2 km a.s.l. on web-cameras. Winds of up to 10 m/s are blowing from the east. Tephra fallout: Widespread drifting of existing ash in southwest Iceland, both yesterday and today. High concentration of airborne dust in Reykjavík yesterday at noon and again at midnight. Lightning: No lightning strikes have been detected. Noises: No reports. Meltwater: Low discharge from Gígjökull. Seismic tremor: Volcanic tremor is still more than before the eruption and has been rather steady since 22nd May, but small pulses, mostly on the lowest frequency are being detected on the seismic stations around the volcano. Earthquakes: Daily, there are several small and shallow earthquakes under the volcano. GPS deformation: No significant deformation at sites around Eyjafjallajökull. Overall assessment: There is still a considerable amount of steam coming from the crater. The tremor is still higher than before the onset of the eruption, and small tremor pulses have been detected on the lowest frequency. We continue to monitor the volcano closely.
Eruption in Eyjafjallajökull - Status Report: 12:00 GMT, 4 June 2010 Icelandic Meteorological Office and Institute of Earth Sciences, University of Iceland
Compiled by: Gunnar B. Guðmundsson, Teitur Arason, Hrafn Guðmundsson, Ármann Höskuldsson and Sigrún Hreinsdóttir
Based on: IMO seismic monitoring; IES-IMO GPS monitoring; IMO hydrological data; web cameras, ATDnet – UK Met. Offices lightning detection system, webbased ash reports from the public and research expedition of the IES to the summit on 3/6-2010.
Eruption plume: Height (a.s.l.): Clouds and mist have covered the summit of the volcano both yesterday and today. On Wednesday 2nd June a white steam cloud was seen up to 2.5 km a.s.l. On Thursday 3rd of June scientists from IES came to the crater area. In the main crater steaming is still active. However, intensity of the steam is considerable smaller than it was last week. Steam rises some 200 to 400 m above crater rim. South of the volcano winds 8-13 m/s are blowing from the east today. Heading: N/A Colour: N/A
189
Tephra fallout: Widespread drifting of existing ash in south- and southwest Iceland, both yesterday and today. Lightning: No lightning strikes have been detected. Noises: In the crater area solfatara is steaming out with a noise like that from a high temperature geothermal drill hole.
Meltwater: Low discharge from Gígjökull.
Conditions at eruption site:
Seismic tremor: Volcanic tremor is still more than before the eruption and has been rather steady since 22nd May, but small pulses, mostly on the lowest frequency are being detected on the seismic stations around the volcano.
Earthquakes: Daily, there are several small and shallow earthquakes under the volcano.
GPS deformation: No significant deformation at sites around Eyjafjallajökull.
Overall assessment: Steaming activity in the main crater has diminished since last week. Though there is still a considerable amount of steam coming from the crater. Widespread drifting of existing ash in south- and southwest Iceland. The tremor is still higher than before the onset of the eruption, and small tremor pulses have been detected on the lowest frequency. We continue to monitor the volcano closely.
Eruption in Eyjafjallajökull - Status Report: 11:00 GMT, 7 June 2010 Icelandic Meteorological Office and Institute of Earth Sciences, University of Iceland.
Compiled by: Gunnar B. Guðmundsson, Sigurlaug Hjaltadóttir, Ármann Höskuldsson, Björn Sævar Einarsson, Haraldur Eiríksson, Þorvaldur Þórðarson, Guðrún Larsen, Sigrún Hreinsdóttir and Bergthóra S. Thorbjarnardóttir.
Based on: IMO seismic monitoring; IES-IMO GPS monitoring; IMO hydrological data; web cameras, lightning detection system, web-based ash reports from the public and research expedition of the IES to the summit on 3/6-2010.
Eruption plume: Height (a.s.l.): On 4 June at 1950h the plume was at a height of 4.5 km. Last night a plume of steam was observed from a plane at a height of 4.5 - 6 km. This morning a steam plume was observed for a short period at a height of 3 km. Heading: to the southwest on 4 and 5 June. Yesterday and this morning to the south. Colour: Mostly white at the top and grayish and dark at the bottom following explosive activity. Tephra fallout: Off and on near the crater. Considerable ash drift on 4 June. Lightning: An eyewitness at Ásólfsskálaheiði (9 km SW of crater) observed two small flashes of lightning in the evening of 4 June. Four lightning flashes were recorded yesterday morning, 6 June. Noises: Considerable rumbling was heard at Raufarfell (10 km south of the crater) in the afternoon of 4 June.
Meltwater: Low discharge from Gígjökull. Conditions at eruption site: Considerable steam emanates from the big crater and has increased since 3 June. In the western part of the crater, a new crater has formed at the site of explosive activity. Tremor pulses late 6 June accompanied steam plumes from this new crater. The plumes and explosions are small. Caving in of lava in the conduit can be heard
190
between explosions. Only a part of the new active crater has been seen due to the steam. The glacial ice at the top is advancing rapidly to the Gígjökull outlet glacier.
Seismic tremor: In the afternoon of 4 June an increase in tremor was recorded at seismic stations around the volcano, but decreased again in the evening. Small pulses of tremor were recorded off and on during the night. At around 0900h on 5 June the tremor reached a maximum before decreasing again. An increase was recorded late 6 June for a short time and small pulses were recorded last night. The tremor has been predominantly at high frequencies.
Earthquakes: A few small, shallow earthquakes have been recorded beneath the top crater in the last few days. GPS deformation: No significant deformation at sites around Eyjafjallajökull. Overall assessment: Some eruptive activity is still in the western side of the crater. Magma explosions occur off and on producing ash, which falls near the crater. This explosive activity is accompanied by an abrupt increase in tremor. White steam clouds have reached a height of 6 km following these explosions. We continue to monitor the volcano closely.
Eruption in Eyjafjallajökull - Status Report: 15:00 GMT, 10 June 2010 Icelandic Meteorological Office and Institute of Earth Sciences, University of Iceland.
Compiled by: Sigurlaug Hjaltadóttir, Sigrún Hreinsdóttir, Hrafn Guðmundsson, Bergthóra S. Thorbjarnardóttir and Martin Hensch.
Based on: IMO seismic monitoring; IES-IMO GPS monitoring; IMO hydrological data; web cameras, lightning detection system, web-based ash reports from the public and research expedition of the IES to the summit on 3/6-2010.
Eruption plume: Height (a.s.l.): No information Heading: SW-wind today, turning towards NW-wind tonight. Colour: White (when last seen late on 7-8 June). Tephra fallout: No information Lightning: None were measured on the UK Met Office's system but 32 lightnings were measured on the New Mexico network on the 7 June. Noises: Rumbling was heard at Gígjökull yesterday at around 15:00h just before a steam cloud rose from the crater. Meltwater: Low discharge from Gígjökull.
Conditions at eruption site: The eruption site has not been visible today. White steam clouds were observed on a web-camera from Thórólfsfell on Monday evening, 7 May.
Seismic tremor: A slight increase was observed on Monday evening in the frequency range 1-2 Hz. The increase in the 0,5-1 Hz range today is probably due the weather.
Earthquakes: A few small, shallow earthquakes have been recorded beneath the top crater in the last few days.
GPS deformation: Slow and continuous deformation towards the volcano in the last two weeks.
191
Overall assessment: A small increase in tremor was observed on Monday evening and higher steam clouds were seen at the same time on a web-camera. The clouds were white and contained little or no ash. We continue to monitor the volcano closely.
Eruption in Eyjafjallajökull - Status Report: 23:00 GMT, 11 June 2010 Icelandic Meteorological Office and Institute of Earth Sciences, University of Iceland
Compiled by: Sigurlaug Hjaltadóttir, Magnús Tumi Guðmundsson, Jón Kristinn Helgason, Sigrún Hreinsdóttir, Bergthóra S. Thorbjarnardóttir.
Based on: IMO seismic monitoring; IES-IMO GPS monitoring; IMO hydrological data; web cameras, lightning detection system and overflights at 8 and 21 on 11 June.
Eruption plume: Height (a.s.l.): Mostly within the crater, every now and then the steam clouds rise above the crater rim. Heading: Colour: White. Tephra fallout: None. Lightning: None were measured on the UK Met Office's system. Noises: No reports
Meltwater: Low discharge from Gígjökull.
Mudflood: Heavy rainfall during the night before last and early yesterday morning caused considerable swelling in Svaðbælisá River. The water contained a great amount of mud, that flowed over fields despite the levee that was erected to protect the farming land at Thorvaldseyri. Considerable mud has accumulated in the river channel since the eruption began, decreasing the depth of the channel. This has caused water to flow up onto a road west of a bridge, as there it now not much difference between the height of the bridge and the river channel.
Conditions at eruption site: A lake, about 300 m in diameter, has formed at the bottom of the big crater. Steam is rising from the rims, especially from the north side. In the morning the steam cloud only rose about 100 m over the crater but reached 500-1000 m in the evening. On the western side of the crater, above the water surface, a brown-colored cloud can be seen rising from two small openings. Mounds of sulphur have formed by steam eyes in the lava rein, just north of the crater.
Seismic tremor: Low tremor level. No pulses have been observed for the last 24 hours.
Earthquakes: A few small, shallow earthquakes have been recorded beneath the summit in the last few days.
GPS deformation: Slow and continuous deformation towards the volcano in the last two weeks.
Overall assessment: No magma is being erupted at present with activity being confined to steaming. Water has started to accumulate in the main crater and poses a threat of drainage in a flood down Gígjökull in the coming weeks.
192
Eruption in Eyjafjallajökull - Status Report: 17:00 GMT, 15 June 2010 Icelandic Meteorological Office and Institute of Earth Sciences, University of Iceland
Compiled by: Bergthóra S. Thorbjarnardóttir, Magnús Tumi Guðmundsson, Sigrún Hreinsdóttir and Gunnar Sigurðsson.
Based on: IMO seismic monitoring; IES-IMO GPS monitoring; IMO hydrological data; web camera; lightning detection system and flights over the eruption site 11 and 14 June.
Steam clouds: Height (a.s.l.): Have been observed at over a hundred meters. Heading: Colour: White. Tephra fallout: None. Lightning: None were measured on the UK Met Office's system. Noises: No reports
Meltwater: Low discharge from Gígjökull.
Mudflood: No mudfloods in the past few days.
Conditions at eruption site: At the eastern, southern and western sides of the crater lake is a wall of ice. On the northern side a tephra wall rises 20 meters above the water. The ice walls at the southwestern corner of the crater are melting, i.e. at the site of the vent that was active 4 – 6 June. The rate of melting is assumed to be about one cubic meter per second.
Seismic tremor: Low tremor level. Pulses are observed off and on.
Earthquakes: A few small, shallow earthquakes have been recorded beneath the Eyjafjallajökull summit in the last weeks. Thirteen microearthquakes were recorded in the Mýrdalsjökull caldera from 11 to 14 June, most at a shallow depth.
GPS deformation: The seismic activity beneath Mýrdalsjökull glacier does not appear to be related to inflation of the area. No significant vertical deformation has been observed at GPS stations at or around the glacier. However, a station at the northeastern caldera rim (AUST), moved about three centimeters towards the southwest from the 9th to the 13th of June, inward to the caldera.
Overall assessment: The level of water in the crater lake only rose about 1 – 2 meters over the weekend. Several days or weeks are therefore likely to pass before the crater has filled with water, and up to months if the melting slows down. It is important that the water level be checked regularly. The water volume is now less than 0.5 million cubic meters. If the water level rises 20 meters, the volume will be 3 million cubic meters. The resulting flood would flow to the north, down the Gígjökull valley glacier, and could reach a maximum of 1500-2000 cubic meters per second.
193
Eruption in Eyjafjallajökull - Status Report, 23 June 2010
Compiled by: Steinunn S. Jakobsdóttir and Magnús Tumi Guðmundsson
Very little activity at Eyjafjallajökull volcano. Small ash clouds are seen occasionally, they disappear again in some minutes. Water accumulation in the crater is slow as the ice is no longer in contact with hot material. GPS measurements show slight movements towards the mountain except at Austmannsbunga in Mýrdalsjökull, which shows movement towards southwest. No obvious explanation has been found for this movement.
6.10 Observations made by international research groups
A number of international research groups came to Iceland during the flank and summit eruptive phases. The following list may not be exhaustive, as some groups may not have made contact with the Icelandic research and monitoring institutes. 1. University of Cambridge, United Kingdom (24 March–24 April) carried out field measurements during the flank and summit eruptive phases. The eruption was observed using HD video, a thermal camera, UV spectroscopy (DOAS) and satellite imagery. Aerosol size and chemistry, snow chemistry and mineralogical data were also obtained. Spectral analysis of audio was used to time the arrival of individual gas packets at the vent. Trace gas ratios were also measured at a range of distances from the vent, and over the lava flows, and compared to melt inclusion data for volatile contents.
Publications: Donovan A., and C Oppenheimer "The 2010 Eyjafjallajokull eruption and the reconstruction of Geography", The Geographical Journal 177(1):4-11, 2011 Donovan, A., C Oppenheimer "Governing the lithosphere: Insights from Eyjafjallajokull", submitted to the Special Edition of JGR-Solid Earth Donovan, A., T Barnie, E Ilyinskaya, V Tsanev, C Oppenheimer "Multidisciplinary remote sensing of the Fimmvorduhalsi fissure eruption, South Iceland, March-April 2010" at the William Smith meeting of the Geological Society of London, October 4-5 2011.
Ilyinskaya, E., V. I. Tsanev, R. S. Martin, C. Oppenheimer, J. Le Blond, G. M. Sawyer, & Magnús Tumi Gudmundsson (2011). Near-source observations of aerosol size distributions in the eruptive plumes from Eyjafjallajökull volcano, March-April 2010, Atmospheric Environment 45(18), 3210-3216.
Ilyinskaya, E., R. S. Martin, and C. Oppenheimer (submitted). Aerosol formation in basaltic lava fountaining: Eyjafjallajökull volcano, Iceland, JGR-Atmospheres special issue.
Martin, R. S. & Evgenia Ilyinskaya (2011): Volcanic lightning as a source of reactive radical species in eruption plumes. Geochemistry Geophysics Geosystems 45(3), 547-560, doi:10.1029/2010GC003420. Sawyer, G. M., V. I. Tsanev, E. Ilyinskaya, R. S. Martin, C. Oppenheimer (submitted), The evolution of BrO/SO2 in the plume from the 2010 summit eruption of Eyjafjallajökull volcano, JGR-Atmospheres special issue.
2. Chalmers University, Sweden, installed 2 scanning UV spectrometers for automatic SO2 emission monitoring at Eyjafjallajökul 2010-05-27. The first month of collected data has been evaluated, and no SO2 emission was detected. Processing of the whole dataset is underway.
194
3. Durham University, United Kingdom. Dr Claire Horwell directed a NERC-funded multi-laboratory mineralogical and toxicological study to assess the potential respiratory toxicity of ash which fell on Iceland. The team followed an existing protocol designed by Horwell et al specifically for rapid health response in volcanic eruptions. The protocol had previously been tested at several eruptions worldwide and techniques have been developed specifically for the purpose. Fourteen ash samples were analysed for mineralogical parameters associated with bio-reactivity and were evaluated using established in vitro techniques for measuring hydroxyl radical generation, oxidative capacity, haemolysis, and markers of cytotoxicity and pro-inflammatory activity. The potential for the Eyjafjallajökull ash to trigger acute or chronic pulmonary inflammation at ambient exposure levels is considered to be low, and unlikely to present a significant respiratory health hazard to farmers and outdoor workers who would have received the greatest exposures. Publication: Horwell CJ, Baxter PJ, Hillman SE, Damby DE, Delmelle P, Donaldson K, et al. Respiratory health hazard assessment of the ash from the 2010 eruption of Eyjafjallajökull volcano, Iceland. American Journal of Public Health. Submitted. 4. INGV, Italy, (April 1 - 6) carried out field measurements during the flank eruption. Measurements of erupted volcanic gases were made using UV spectroscopy, UV imaging and open-path Fourier transform spectroscopy, measuring both flux and composition of gas. Publication: Burton, M. R., Salerno, G. G., La Spina, A. Stefansson, A. Kaasalainen, H. S. (2010), Measurements of volcanic gas emissions during the first phase of 2010 eruptive activity of Eyjafallajökull, Abstract V41E-2310 presented at 2010 Fall Meeting, AGU, San Francisco, Calif., 13-17 Dec. 5. IPGP and INGV, France and Italy (May 6 –11) Carried out field measurements during the summit eruption. Measurements of erupted volcanic gases were made using UV spectroscopy, and open-path Fourier transform spectroscopy, measuring flux and composition of gas, at the summit and downwind. Publication: Allard, P., Burton, M., Oskarsson, N., Michel, A., Polacci, M., Magmatic gas composition and fluxes during the 2010 Eyjafjallajökull explosive eruption: implications for degassing magma volumes and volatile sources Geophysical Research Abstracts, Vol. 13, EGU2011-12040-1, 2011. 6. University of York, United Kingdom (April 22 – May 4, July 21 – August 3/2010) carried out two field campaigns to collect a large set of ash, soil, water and vegetation samples. The emphasis was placed on environmental contamination and fate of volcanic fluoride released from ash deposits. The field work has been complemented by laboratory analyses and experiments. The isotopic composition of Si in streams and rivers draining ash-impacted areas was also measured across the 3 different eruptive phases of the summit eruption. A field experiment was performed to test if soil respiration (soil CO2 flux) was affected by an ash layer. Publication:
Calkins J, Delmelle P, Opfergelt S, van den Berg L, Ilyinskaya, E. (in preparation) Scavenging of magmatic fluorine by ash in volcanic plumes: new insights from the 2010 Eyjafjallajokull eruption.
195
7. Newcastle university and Northumbria University, United Kingdom (March 9-16 2010) Escalating rates of seismicity at Eyjafjallajökull in March 2010 prompted discussion between IMO and Newcastle University (NU) about a pre-eruption survey of the glacial lagoon at Gígjökull. The goal was to acquire a three-dimensional dataset of the lagoon using a terrestrial laser scanner (TLS). In the event of an eruption, the survey data would help to quantify landscape changes due to glacial flooding. With logistical support from IMO, survey work took place at Gígjökull between 09 and 16 March 2010. The survey team comprised Andrew J. Russell (NU), Andrew Large (NU), Anne-Sophie Mériaux (NU), and Stuart Dunning of Northumbria University. In addition to a TLS survey in front of Gígjökull, the team also surveyed a section of the Markarfljót river near to Stóra-Dímon and several glacial streams on the southern flank of Eyjafjallajökull. Over 17 million data points were acquired at a speed of 11,000 points-per-second using a Riegl LMS Z620 scanner, accurate to within 10 mm. In the wake of the summit eruption, an ‘urgency’ grant was approved by the UK Natural Environment Research Council (NERC) for a repeat survey of the Gígjökull lagoon. This work was undertaken in July 2010 from nine survey positions, resulting in over 93 million data points. Publication: The goals of the NERC grant, together with a list of publications, are available at the project’s web-site: http://www.jokulhlaup.org.uk/. 8. The Deutsche Zentrum fűr Luft- und Raumfahrt (DLR, German Aerospace Centre) (April-May 2010) performed a measurements mission with the research aircraft Falcon 20E of the volcanic plume south of Iceland, 29 April, 1 and 2 May 2010. This was as a part of a larger volcanic ash measurement suite lasting from 19 April to 18 May and including 17 flights. The mission in Iceland included five flights that coincided with an increase in the explosive character of the eruption. On 29 April, the plume was visible as an enhanced cloud plume up to 3.9 km and during decent to Keflavík airport thin layers with very low traces of volcanic ash, non-critical to flight safety, were found at altitudes between 3.6 and 4.6 km. On 1 May, with enhanced activity the emission was clearly visible above the boundary layer clouds. The Falcon performed visual/photo and LiDAR (Light Detection And Ranging) observations of the plume but the ash concentration in the plume itself was judged to be too high for allowing in-situ observations. The plume top altitude ascended from 3.5–3.8 km, at the volcano and up to 70 km downstream, to 5.1 km at about 200 km distance. It then varied between 4.5 and 4.9 km. On 2 May, the Falcon departed again from Keflavík and first passed over the volcanic ash plume at distances of 50 and 160 km. At the volcano, the plume reached to about 4.2 km altitude, similar to the day before. From the volcano the Falcon headed south until 60oN latitude, where it turned east crossing the plume at a flight altitude of about 6.7 km, and then returned first westward and then again eastward while descending slowly to perform in-situ measurements. The plume was located with the LiDAR at altitudes between around 1.6 km and 3 km, partly above and partly within maritime boundary layer clouds (cloud top at about 1.6 km). The LiDAR signal indicated broken cloud cover below the plume. Further information on the mission and results can be found in Schumann et al. (2011).
Publication: Schumann et al.: Airborne observations of the Eyjafjalla volcano ash cloud over Europe during air space closure in April and May 2010, Atmos. Chem. Phys., 11, 2245-2279, doi:10.5194/acp-11-2245-2011, 2011.
196
9. University of Applied Science, Dusseldorf (August 2010). A two-week measurement campaign was carried out by Prof. Konradin Weber et al. in south Iceland. Several gravimetric filter particle measurement devices with PM10, PM2.5 and PM1 sampling heads, respectively as well as optical particle counters (OPCs) were set up at two locations: one in Hvolsvöllur and one in Drangshlíðardalur nearby Skógar, respectively. Mobile measurements were performed in the south and west of Eyjafjallajökull. An isokinetic sampling device was mounted outside the car and an OPC and nano particle counter were put inside. Furthermore aircraft measurements were performed with an ultralight airplane equipped with 3 OPCs (Sky-OPC, Grimm 1.107, Dustmate), a passive DOAS system to measure SO2, and a sensor for CO2 and higher concentrations of SO2 and H2S. 10. University of Bristol, Department of Geology (Mars 2010) carried out sampling of the lava flow for viscosity measurements and flow rheology. Collaborators: Prof. Steve Sparks and Angelo Castruccio.
11. Section of Earth and Environmental Sciences, University of Geneva, Department of Earth Sciences, University of Florence, Laboratoire Magmas et Volcans, Université Blaise Pascal, Clermont‐Ferrand, Department of Earth Sciences, University of Pisa, Department of Earth Sciences, University of Cagliari, Cagliari, Istituto Nazionale di Geofisica e Vulcanologia, Sezione di Pisa (May 2010). Led by Prof. Costanza Bonnadona, plume dispersion modeling and ash generation test runs of PluDix, radar for grain size analysis in falling ash. Collaborators: C. Bonnadonna, R. Genco, M. Gouhier, M. Pistolesi, R. Cioni, F. Alfano, and M. Ripepe.
Publication: Tephra sedimentation during the 2010 Eyjafjallajökull eruption (Iceland) from deposit, radar, and satellite observations, J. Geophysical Research, vol. 116
12. Institute for Atmospheric and Climate Science, ETH Zurich, Institute for Geochemistry and Petrology, ETH Zurich, Zurich, Laboratory of Atmospheric Chemistry, Paul Scherrer Institut. Ice nucleation in volcanic clouds. Collaborators: Hoyle, C. R., Pinti, V., Welti, A., Zobrist, B., Marcolli, C., Luo, B., Höskuldsson, Á., Mattsson, H. B., Stetzer, O., Thorsteinsson, T., Larsen, G., and Peter, T. Publication: Ice nucleation properties of volcanic ash from Eyjafjallajökull C., Atmos. Chem. Phys., 11, 9911–9926, 2011 13. CEA/DAM/DIF, Arpajon, BGR, Hannover, Germany, AWE Blacknest, Reading, UK, Royal Netherlands Meteorological Institute, De Bilt, Netherlands, Faculty of Aerospace Engineering, Acoustic Remote Sensing, Delft University of Technology, Delft, Netherlands, Dipartimento Scienze della Terra, Università di Firenze, Swedish Institute for Space Physics, Umea, ORSAR, Kjeller, Norway. Acoustic observations of the Eyjafjallajökull eruption. Collaborators: Robin S. Matoza, Julien Vergoz, Alexis Le Pichon, Lars Ceranna, David N. Green, Läslo G. Evers, Maurizio Ripepe, Paola Campus, Ludwik Liszka, Tormod Kvaerna.
Publication: Long‐range acoustic observations of the Eyjafjallajökull eruption, Iceland, April–May 2010. Geophysical Research Letters, vol. 38.
14. Laboratoire Magmas et Volcans, CNRS-Université Blaise Pascal-IRD, Clermont-Ferrand, France; Department of Earth Science and Engineering, Imperial College London, United Kingdom; Department of Geological Sciences, University of Oregon, USA; GeoForschungsZentrum Potsdam, Germany; School of GeoScience, University of Edinburgh, United Kingdom. Geochemistry of the eruption products.
197
Publication: Remobilization of silicic intrusion by mafic magmas during the 2010 Eyjafjallajökull eruption. Solid Earth, 2, 271–281, 2011. 15. CNR-IAMC, Capo Granitola, Italy; DiSTeM, Università degli Studi di Palermo, Italy; Istituto Nazionale di Geofisica e Vulcanologia, Sezione di Palermo, Italy; Istituto Nazionale di Geofisica e Vulcanologia, Sezione di Pisa, Italy ; Université de Genève, Section des Sciences de la Terre, Genève, Suisse; DiSTer, Università degli Studi di Cagliari, Italy; Dipartimento Scienze della Terra, Università degli Studi di Pisa, Italy. Sulfur and tracemetals in volcanic ash. Collaborators: E. Bagnato, A. Aiuppa, A. Bertagnini, C. Bonadonna, R. Cioni. M. Pistolesi, M. Pedone.
Publication: Scavenging of sulphur, halogens and trace metals by volcanic ash: the March-May 2010 Eyjafjallajökull eruption. (in press)
16. Earth and Life Institute, Université catholique de Louvain, Belgium; the Department of Earth Sciences, University of Oxford, United Kingdom. Drs Sophie Opfergelt and Kevin Burton collaborated with Dr Sigurdur Reynir Gislason at IES on investigating volcanic gases and sublimates.
17. Nano-Science Center, Department of Chemistry, University of Copenhagen, Denmark. T. Hassenkam and S.L.S. Stipp collaborated with Dr Sigurdur Reynir Gislason at IES on investigating volcanic ash from the 2010 Eyjafjallajökull eruption. Publication: S. R. Gislason, T. Hassenkam, S. Nedel, N. Bovet, E. S. Eiriksdottir, H. A. Alfredsson, C. P. Hem, Z. I. Balogh, K. Dideriksen, N. Oskarsson, B. Sigfusson, G. Larsen, and S. L. S. Stipp, Characterization of Eyjafjallajökull volcanic ash particles and a protocol for rapid risk assessment. PNAS May 3, 2011 vol. 108 no. 18 7307-7312 18. Istituto Nazionale di Geofisica e Vulcanologia (INGV) and University of Munich (LMU). A five man group visited in the last week of the eruption to do high-speed video recordings of vent activity. Poor weather prevented a visit to the summit but measurements of fallout and particle aggregation could be carried out. The group consisted of Piergiorgio Scarlato, Lilli Freda, Daniele Andronico, Elisabetta Del Bello (INGV) and Corrado Cimarelli University of Munich (LMU). Publication: Taddeucci, J, P. Scarlato, C. Montanaro, C. Cimarelli, E. Del Bello, C. Freda, D. Andronico, Gudmundsson, M.T., and Dingwell, D.B. 2011. Aggregation-dominated ash settling from the Eyjafjallajökull volcanic cloud illuminated by field and laboratory high-speed imaging. Geology, 39, 891-894. 19. Uppsala University, Sweden. Ari Tryggvson installed three seismometers that are used with processing in the project Volcano Anatomy.
198
6.11 Bibliography
6.11.1 Papers Ansmann A., Tesche M., Gross S. et al. (2010). The 16 April 2010 major volcanic ash plume
over central Europe: EARLINET lidar and AERONET photometer observations at Leipzig and Munich, Germany. Geophysical Research Letters 37, Article Number: L13810.
Arason, P., Bennett, A. J. & Burgin, L. E. (2011). Charge mechanism of volcanic lightning revealed during the 2010 eruption of Eyjafjallajökull. Journal of Geophysical Research 116, B00C03, 15 s., doi:10.1029/2011JB008651.
Arason, P., Petersen, G. N. & Björnsson, H. (2011). Observations of the altitude of the volcanic plume during the eruption of Eyjafjallajökull, April–May 2010. Earth System Science Data 3, 9–17, doi:10.5194/essd-3-9-2011.
Bennett, A. J., Odams, P., Edwards, D. & Arason, P. (2010). Monitoring of lightning from the April-May 2010 Eyjafjallajökull volcanic eruption using a very low frequency lightning location network. Environment Research Letters 5(4), 8 s., doi: 10.1088/1748-9326/5/4/044013.
Bird, D., Gísladóttir, G. & Dominey-Howes, D. (2010). Volcanic risk and tourism in southern Iceland, Journal of Volcanology and Geothermal Research 189 (2010) 33–48, doi:10.1016/j.jvolgeores.2009.09.020.
Bird D., Gísladóttir G. & Dominey-Howes D. (2011). Different communities, different perspectives: issues affecting residents’ response to a volcanic eruption in southern Iceland, Bulletin of Volcanology 73:1209–1227, doi:10.1007/s00445-011-0464-1.
Bonadonna, C., Genco, R., Gouhier, M., Pistolesi, M., Cioni, R., Alfano, F., Hoskuldsson, A. & Ripepe, M. (2011). Tephra sedimentation during the 2010 Eyjafjallajökull eruption (Iceland) from deposit, radar, and satellite observations, Journal of Geophysical Research. 116, B12202, doi:10.1029/2011JB008462.
Böðvarsson, R., Rögnvaldsson, S. Th., Jakobsdóttir, S. S., Slunga, R. & Stefánsson, R. (1996). The SIL data acquisition and monitoring system. Seismological Research Letters 67, 35–46.
Böðvarsson, R., Rögnvaldsson, S. Th., Slunga, R. & Kjartansson, E. (1999). The SIL data acquisition system at present and beyond year 2000. Physics of the Earth and Planetary Interiors, 113, 89–101.
Davies, S. M., Larsen, G., Wastegard, S., Turney, C. S. M., Hall, V. A., Coyle, L. & Tordarson, Th. (2010). Widespread dispersal of Icelandic tephra: how does the Eyjafjoll eruption of 2010 compare to past Icelandic events? Journal of Quaternary Science 25 (5), pp. 605-611, doi: 10.1002/jqs.1421.
Gislason, S. R., Hassenkam, T., Nedel, S., Bovet, N., Eiríksdóttir, E. S., Alfredsson, H. A., Hem, C. P., Baloghb, Z. I., Dideriksen, K., Óskarsson, N., Sigfússon, B., Larsena, G. & Stipp, S. L. S. (2011). Characterization of Eyjafjallajökull volcanic ash particles and a protocol for rapid risk assessment, Proceedings of the National Academy of Sciences, PNAS 108 (18), 7307-7312. doi: 10.1073/pnas.1015053108.
Guðmundsson, M. T., Pedersen, R., Vogfjörð, K. S., Þorbjarnardóttir, B., Jakobsdóttir, S. S. & Roberts, M. J. (2010). Eruptions of Eyjafjallajökull Volcano, Iceland (News). EOS 91(21), 190-191.
Hoyle, C. R., Pinti, V., Welti, A., Zobrist, B., Marcolli, C., Luo, B., Höskuldsson, Á., Mattsson, H. B., Stetzer, O., Thorsteinsson, T., Larsen, G., & Peter, T. (2011). Ice
199
nucleation properties of volcanic ash from Eyjafjallajökull, Atmospheric Chemistry and Physics, 11, 9911-9926, doi:10.5194/acp-11-9911-2011.
Ilyinskaya, E., Tsanev, V. I., Martin, R. S., Oppenheimer, C., Le Blond, J., Sawyer, G. M. & Guðmundsson, M. T. (2011). Near-source observations of aerosol size distributions in the eruptive plumes from Eyjafjallajökull volcano, March-April 2010. Atmospheric Environment 45(18), 3210-3216.
Jóhannesdóttir, G. & Gísladóttir, G. (2010). People living under threat of volcanic hazard in south Iceland: vulnerability and perception, Natural Hazard and Earth System Sciences 10, 407–420.
Langmann, B., Folch, A., Hensch, M. & Matthias, V. (2012). Volcanic ash over Europe during the eruption of Eyjafjallajökull on Iceland, April-May 2010, Atmospheric Environment 48, p. 1–8, doi: 10.1016/j.atmosenv.2011.03.054.
Leadbetter, S. J., Hort, M. C., von Löwis, S., Weber, K. & Witham, C. S. (2012). Modeling the resuspension of ash deposited during the eruption of Eyjafjallajökull in spring 2010. Journal of Geophysical Research 117, D00U10, doi:10.1029/2011JD016802.
Matoza, R. S., Vergoz, J., Le Pichon, A., Ceranna, L., Green, D. N., Evers, L. G. et al. (2011). Long-range acoustic observations of the Eyjafjallajökull eruption, Iceland, April - May 2010, Geophysical Research Letters 38, L06308, doi:10.1029/2011GL047019.
Petersen, G. N. (2010). A short meteorological overview of the Eyjafjallajokull eruption 14 April - 23 May 2010. Weather 65(6), 203-207.
Petersen, G. N., Björnsson, H. & Arason, P. (2012). The impact of the atmosphere on the Eyjafjallajökull 2010 eruption plume, Journal of Geophysical Research 117, D00U07, 14 s., doi:10.1029/2011JD016762.
Sigmundsson, F. & Höskuldsson. Á. (2010). Develop instruments to monitor volcanic ash fallout (Correspondence). Nature 466, 28.
Sigmundsson, F., Hreinsdóttir, S., Hooper, A., Árnadóttir, Þ., Pedersen, R., Roberts, M. J. et al. (2010). Intrusion triggering of the 2010 Eyjafjallajökull explosive eruption. Nature 468, 426-430, doi: 10.1038/nature09558.
Tarasewicz, J., Brandsdóttir, B., White, R. S., Hensch, M., Thorbjarnardóttir, B. (2012). Using microearthquakes to track repeated magma intrusions beneath the Eyjafjallajökull stratovolcano, Iceland, Journal of Geophysical Research 117, B00C06, doi:10.1029/2011JB008751.
Tarasewicz, J., White, R. S., Brandsdóttir, B. & Þorbjarnardóttir, B. S. (2011). Location accuracy of earthquake hypocentres beneath Eyjafjallajökull, Iceland, prior to the 2010 eruptions. Jökull 61, 33-50.
6.11.2 Reports Helgason, J. K. & Jensen, E. H. (2011). Eðjuflóð, aurskriður og framburður gosefna niður á
láglendi með vatnsföllum vorið 2011 vegna gjósku úr Eyjafjallajökulsgosinu. (In Icelandic.) Report VI/2011-001, 33 pp. Reykjavik: Icelandic Meteorological Office.
Hjaltadóttir, S., Vogfjörð, K. S., & Slunga, R. (2009). Seismic signs of magma pathways through the crust in the Eyjafjallajökull volcano, South Iceland. Report, VÍ/2009-013, 33 pp. Reykjavik: Icelandic Meteorological Office.
6.11.3 Presentations and posters Ali, T., K., Feigl, R. Pedersen, Sigmundsson, F. (2011). 1993-2011 Time dependent
deformation of Eyjafjallajokull volcano, Iceland [S31B-2235]. AGU Fall meeting, San Francisco, California, Dec.
200
Allard, P. et al. (2010). Chemistry and fluxes of magmatic gases powering the explosive trachyandesitic phase of Eyjafjallajokull 2010 eruption: constraints on degassing magma volumes and processes, AGU, San Francisco, California.
Allard, P., Burton, M., Oskarsson, N., Michel, A. & Polacci, M. (2011). Magmatic gas composition and fluxes during the 2010 Eyjafjallajökull explosive eruption: implications for degassing magma volumes and volatile sources. [EGU2011-12040].
Arason, P. (2011). Eldingar í gosmekki Eyjafjallajökulsgossins 2010 [in Icelandic]. The Geoscience Society of Iceland – Spring Conference, Reykjavik, 15 April.
Arason, P., Björnsson, H. & Petersen, G. N. (2011). Hæð gosmakkar í Eyjafjallajökulsgosinu 2010[in Icelandic]. The Geoscience Society of Iceland– Spring Conference, Reykjavik, 15 April.
Arason, P, Björnsson, H. & Petersen, G. N. (2011). Plume-top altitudes during the Eyjafjallajökull 2010 eruption. EGU General Assembly, Vienna, Austria, 3–8 April.
Arason, P, Björnsson, H., Petersen, G. N. & Roberts, M. J. (2011). Mælingar á hæð gosmakkar í Eyjafjallajökulsgosinu 2010 [In Icelandic]. Researcher’s Night of Rannis - The Icelandic Centre for Research, Reykjavík, 23 Sept.
Arason, P, Björnsson, H., Petersen, G. N. & Roberts, M. J. (2011). Volcanic plume-top altitudes during the Eyjafjallajökull 2010 eruption. IUGG XXV General Assembly, Melbourne, Australia, 28 June-7 July.
Arason, P., Bennett, A. J. & Burgin, L. E. (2011). Volcanic lightning during the 2010 Eyjafjallajökull eruption. 92nd American Meteorological Society Annual Meeting / 28th Conference on Interactive Information Processing Systems (IIPS), New Orleans, 22.-26 Jan.
Arason, P. &. Bennett A. J. (2010). Charge mechanism of volcanic lightning revealed during the Eyjafjallajökull 2010 eruption. AGU 91 Fall Meeting, San Francisco, California, 13–17 Dec. [AE33B-0278].
Árnadóttir, Th. (2011). Tracking magma movements within Eyjafjallajökull with geodetic observations. SPASE (Structural, Minerological and Petrological Advances in Solid Earth Geology) workshop at the Geological Survey of Sweden (SGU), Uppsala, Sweden, May 13.
Árnadóttir, Th., Hreinsdóttir, S., Hooper, A., Roberts, M. J., Geirsson, H., Sigmundsson, F. et al. (2010). Tracking magma movements within Eyjafjallajökull from spatial and temporal variations in GPS time series. AGU Fall Meeting, San Francisco, Calif., 13-17 Dec. [V33C-2396].
Auriac, A., Hreinsdóttir, S., Sigmundsson, F., Hooper, A., Pedersen, R., Roberts, M. J. et al. (2010). Deformation associated with the ongoing Eyjafjallajökull intrusion: Constraints from GPS and InSAR observations. Geoscience Society of Iceland, Spring meeting, Reykjavik, Iceland, 26 March.
Auriac, A. Hreinsdóttir, S., Sigmundsson, F., Hooper, A., Pedersen, R., Roberts, M. J. et al. (2010). GPS and InSAR investigations on the ongoing activity at Eyjafjallajökull volcano. Geoscience Society of Iceland, Spring meeting, Reykjavik, Iceland, 26 March.
Björnsson, H., Jóhannesson, T., Pálsson, F., Magnússon, E., Guðmundsson, S. Thorsteinsson, Th. et al. (2010). Kortagerð af íslenskum jöklum með lidar-mælingum (Mapping Icelandic glaciers with lidar -in Icelandic). UOOR conference, Reykjavík 14 May.
Björnsson, H., Magnússon, S., Arason, P. & Petersen, G. N. (2011). Assessing simple models of volcanic plumes using observations from the summit eruption of Eyjafjallajökull in 2010. AGU Fall Meeting, San Francisco, California, 5 –9 Dec. [V41E-01].
201
Björnsson, H., Petersen, G. N., Arason, P., Karlsdóttir, S., Vogfjörð, K. S., Thorsteinsson, H. et al. (2010). Near-field monitoring of the Eyjafjallajökull eruption cloud. AGU 91 Fall Meeting. San Francisco, California, 13 –17 Dec. [V53F-03].
Bonadonna, C., Riccardo, G., Mathieu, G., Marco, P., Fabrizio, A., Raffaello, C., Höskuldsson Á. et al. (2011). Tephra sedimentation during the 2010 Eyjafjallajökull eruption (Iceland) from deposit, radar and satellite observations. [EGU2011-3476].
Chien, S., Davies, A. G., Doubleday, J., Tran, D. Q., Guðmundsson, M. T., Jónsdóttir, I. et al. (2010). Data flow in a volcanic crisis through use of autonomy. AGU 91 Fall meeting, San Francisco, California, 13–17 Dec. [V41E-2316].
Chien, S., Davies, A. G., Doubleday, J., Tran, D. Q., Guðmundsson, M. T., Jónsdóttir, I. et al. (2010). Observing the 2010 Eyjafjallajökull, Iceland, Eruptions with NASA’s Earth Observing-1 Spacecraft - Improving Data Flow In a Volcanic Crisis Through Use of Autonomy. 2010 Fall Meeting, AGU, San Francisco, California, 13-17 Dec.
Crochet, P, von Löwis, S. & Thorsteinsson, Th. (2010). Radar monitoring of the Eyjafjallajökull volcanic eruption. 8th Baltic Weather Radar Workshop (BWRW), Helsinki, Finland, 7–8 June.
Davies, A.G., Chien S., Doubleday, J., Tran, D. Q., Guðmundsson, M. T., Jónsdóttir, I. et al. (2010). Observing the 2010 Eyjafjallajökull, Iceland, Eruptions with NASA's EO-1 Spacecraft - Improving data flow In a volcanic crisis through use of autonomy. Volcanological Workshop. Hvolsvöllur, Iceland, 17–19 Sept.
Eiriksdóttir, S., Alfredsson, H. A., Hem, C. P., Balogh, Z. I., Dideriksen, K., Oskarsson, N. et al. (2011). Characterization of Eyjafjallajökull volcanic ash particles and a protocol for rapid risk assessment. EGU General Assembly Vienna, Austria 03-08 April. [PNAS 108, 7307-7312].
Gíslason S. R, Alfredsson H., Olsson J., Eiriksdóttir E., Oskarsson N., Hassenkam T. et al. (2011). The Ash that Closed Europe’s Airspace in 2010. AGU Fall Meeting 2011, San Francisco, California.
Guðmundsson, M. T. & Magnússon, E.. Gosið á Fimmvörðuhálsi. Magn gosefna og kvikurennsli, 20.-26. mars (The eruption in Fimmvörðuháls. The volume of erupted material and magma discharge - in Icelandic). The Icelandic Geology Society Spring meeting, Reykjavík. 26 March.
Guðmundsson, M. T., Höskuldsson, A., Larsen, G., Sigmarsson, O., Högnadóttir, Th., Oddsson, B. et al. (2010). The April 2010 eruption of the ice-capped Eyjafjallajökull, South Iceland. EGU General Assembly, Vienna, Austria 2-7 May.
Guðmundsson, M. T., Magnússon, E., Högnadóttir, Th., Oddsson, B., Roberts, M. J., Sigurðsson, O. et al. (2010). Volcano-Ice Interaction during the April-May 2010 eruption of Eyjafjallajökull, Iceland. AGU Fall meeting, San Francisco, California, 13-17 Dec.
Guðmundsson, M. T., Thordarson, Th,. Höskuldsson, Á., Larsen, G., Jónsdóttir, I., Oddsson, B. et al. (2010). The Eyjafjallajökull eruption in April-May 2010; course of events, ash generation and ash dispersal. AGU Fall meeting, San Francisco, California 13-17 Dec.
Guðmundsson, M. T., Magnússon, E., Högnadóttir Th., Oddsson, B., Roberts, M. J. , Sigurðsson, O., Jóhannesson, T. & Höskuldsson, F. (2010). Volcano-Ice Interaction during the April-May 2010 eruption of Eyjafjallajökull, Iceland. AGU Fall Meeting, San Francisco, California, 13-17 Dec. [NH13C-01AGU 91]
Gunnlaugsson, H. P., Steinthorsson, S., Oskarsson, N., Madsen, M. B., Nørnberg, P.& Merrison, J. (2011). Mössbauer Spectroscopy of Samples from the 2010 Eyjafjallajökull Summit Eruption [EGU2011-3686].
Gylfason, A. G., Guðmundsson, M. T., Jakobsdóttir, S. S. & Reynisson, V. (2010). Public and media communication of volcanic hazard before and during the 2010 eruption in
202
Eyjafjallajökull, Iceland. AGU 91 Fall meeting, San Francisco, California, 13.-17 Dec. [NH43B-04]
Helgason, J. K. Jensen, E. H. & Einarsson, S. (2011). Eðjuflóð, aurskriður og framburður gosefna niður á láglendi með vatnsföllum vorið 2011 vegna gjósku úr Eyjafjallajökulsgosinu [in Icelandic]. Geoscience Society of Iceland Spring meeting, Reykjavík, 15. apríl.
Hensch, M., Brandsdóttir, B., Árnadóttir, Th., Hreinsdóttir, S., Tarasewicz, J. & Thorbjarnardóttir, B. (2011). Intrusive activity beneath Eyjafjallajökull heralding the 2010 flank and summit eruptions: An analysis of earthquake and geodetic data EGU, Vienna, Austria, April. [Vol. 13, EGU2011-12833].
Hensch, M., Brandsdóttir, B., Árnadóttir, Th., Auriac, A., Thorbjarnardóttir, B. S. (2010). Intrusive activity beneath Eyjafjallajökull 1991-2010 from analysis of earthquake and geodetic data AGU Fall Meeting, San Francisco, California, 13-17 Dec. [V21F-05].
Hensch, M., Brandsdóttir, B., Árnadóttir, Th. &, Tarasewicz, J. (2011). Intrusive activity beneath Eyjafjallajökull heralding the 2010 flank and summit eruptions: An analysis of earthquake and geodetic data, 42nd Nordic Seismology Seminar, Reykjavík, 5-7Oct..
Hjaltadóttir, S., Hreinsdóttir, S., Vogfjörð, K. S., Sigmundsson, F., Árnadóttir, Th. & Slunga, R. (2011). Eyjafjallajökull 2009-2010: Magma movements tracked with relocated earthquakes and GPS measurements, 42nd Nordic Seismology Seminar, Reykjavík, 5-7 Oct..
Hjaltadóttir, S., Vogfjörð, K. S. & Slunga R. (2011). Magma Movements at Eyjafjallajökull tracked with highprecision earthquake locations. IUGG XXV General Assembly, Melbourne, Australia, 28 June–7 July.
Hjaltadóttir, S., Hreinsdóttir, S., Roberts, M. J., Guðmundsson, G. B., Auriac, A., Sigmundsson, F. et al. (2010). Jarðskjálftavirkni og landbreytingar samfara kviku-hreyfingunum undir Eyjafjallajökli 2009-2010 [in Icelandic]. The Geoscience Society of Iceland– Spring Conference, Reykjavik, 26 March.
Hjaltadóttir, S.,Vogfjörð, K. S., Roberts, M. J. & Guðmundsson, G. B. (2010). Mapping magmatic activity beneath the Eyjafjallajökull volcano, South Iceland, using seismic and GPS networks. GI-Norden conference, Selfoss, 14-15 June.
Hooper, A., Sigmundsson, F., Hreinsdóttir, S., Árnadóttir, Th., Bekaert, D., Pedersen, R. et al. (2011).The 2010 inflation and deflation sources of Eyjafjallajökull: Modelling of geodetic data from InSAR and GPS, EGU Vienna, Austria, April. [Vol. 13, EGU2011-12804].
Höskuldsson, Á., Thordarson, Th., Sigmarsson, O., Guðmundsson, M. T., Larsen, G., Oddsson, B. et al. (2011). The Fimmvörðuháls flank eruption 2010 Iceland, complex emplacement of basaltic lava flow onto ice and snow. [EGU2011-10618].
Höskuldsson, Á & the Eyjafjallajokull eruption Team (2011). Eruption dynamics of the 2010 summit eruption at the Eyjafjallajökull volcano (Iceland): Magma fragmentation, tephra stratigraphy and transport. [EGU2011-14165].
Höskuldsson, Á. et al. (2010). The Eyjafjallajökull eruption April to May 2010: Magma fragmentation, plume and tephra transport, and course of events. Keilir conference on the Eruption in Eyjafjallajökull 2010. Workshop in September.
Höskuldsson Á. (2010). The Eyjafjallajökull eruption 2010: Course of events, intensity and magnitude. Atlantic Conference on Eyjafjallajökull and Aviation. Keflavik, Iceland, 15-16 Sept.
Höskuldsson, Á. (2010). Ash transport and ash collection during the 2010 Eyjafjallajökull eruption Keynote lecture. Workshop on Ash dispersal forecast and civil aviation. World Meteorological Organization, Geneva, Switzerland, 18-20 Oct..
203
Hreinsdóttir, S., Árnadóttir, Th., Sigmundsson, F., Hooper, A., Roberts, M. J., Geirsson, H. & Ófeigsson, B. (2011). Surface Deformation Prior to and During the 2010 Eyjafjallajökull Eruptions from Spatial and Temporal Variations in GPS Time Series, EGU, Vienna, April. [Vol. 13 EGU2011-10353].
Hreinsdóttir, S., Árnadóttir, Th., Sigmundsson, F., Hooper, A. & Roberts, M. J. (2011). The 2010 Eyjafjallajökull Volcano Unrest and eruptions: Spatial and temporal variations in ground deformation. IUGG, Melbourne, Australia, 28 June–7July. [Abstract 4367].
Hreinsdóttir, S., Auriac, A., Sigmundsson, F., Hensch, M., Árnadóttir, Th., Roberts, M. J. et al. (2010). Surface deformation of Eyjafjallajökull volcano observed with GPS geodetic measurements during the 2009-2010 unrest. Engineering and Natural Sciences Research Symposium, Reykjavík, 8–9 Oct. [R-VoN 2010, p. 65].
Hreinsdóttir, S., Hooper, A., Auriac, A., Sigmundsson, F., Árnadóttir, Th. & Roberts, M. J. (2010). Surface Deformation of Eyjafjallajokull Volcano During the 2009-2010 Unrest. AGU 91 Fall meeting, San Francisco, California, 13–17 Dec. [V-21F-03].
Hreinsdóttir, S., Hooper, A., Árnadóttir, Th, Sigmundsson, F., Pedersen, F., Geirsson, H. et al. (2010). Inside the volcano: mapping the convoluted path of magma ascent in Eyjafjallajökull volcano with GPS and InSAR. EGU General Assembly, Vienna, Austria, 2–7 May. [15759]
Hreinsdóttir, S., Hooper, A., Auriac, A., Sigmundsson, F., Hensch, M., Árnadóttir, Th. et al. (2010). Surface deformation of Eyjafjallajökull Volcano During the 2009-2010 Unrest. AGU Fall Meeting, San Francisco, California, 13-17 Dec. [V21F-03].
Hreinsdóttir, S., Hooper, A., Árnadóttir, Th., Sigmundsson, F., Pedersen, R., Geirsson, H. et al. (2010). Inside the volcano: Mapping the convoluted path of magma ascent in Eyjafjallajökull volcano with GPS and InSAR. EGU, Vienna, May. [Vol. 12. EGU2010-15759].
Jakobsdóttir, S. S. (2010). Vöktun á jarðvá með sérstöku tilliti til eldgosa [in Icelandic]. IMO´s 90 years anniversary meeting, Reykjavík, 14 Dec.
Jakobsdóttir, S. S. (2010). Monitoring volcanoes and volcanic eruptions in Iceland. The 41st Nordic Seminar on Detection Seismology, Aarhus, Denmark 6–8 Oct.
Jakobsdóttir, S. S., Roberts, M. J., Guðmundsson, G. B. & Vogfjörð, K. S. (2010). Geophysical monitoring of Eyjafjallajökull volcano: flank and summit eruptions in 2010. EGU General Assembly. Geophysical Research Abstracts 12.
Jakobsdóttir, S. S., Hjaltadóttir, S., Roberts, M. J., Guðmundsson, G. B. & IMO’s Geologic Hazard Group (2010). Eruptions of Eyjafjallajökull Volcano, 2010: monitoring the precursors. European Seismological Commission 32nd General Assembly, Montpellier, France, 6-10 Sept. [SD14/Tu/O4].
Jakobsdóttir, S. S., Hjaltadóttir, S., Roberts, M. J., Guðmundsson, G. B. & IMO’s Geologic Hazard Group (2010). Eruptions of Eyjafjallajökull Volcano, 2010: monitoring the flank and the summit eruptions. European Seismological Commission 32nd General Assembly, Montpellier, France, 6-10 Sept. [SD14/P10/ID238].
Jensen, E. H., Helgason, J. K., Höskuldsson, Á., Sverrisdóttir, G., Oddsson, B., Ólafsdóttir, R., Roberts, M. J. & Einarsson, S. (2011). Post-Eruptive Lahar and Floods Resulting from the 2010 Eruption of Eyjafjallajökull: Observations, Mapping, and Modelling. IUGG General Assembly, Melbourne, Australia, 28 June–7 July. [5121]
Jensen, E. H., Helgason, J. K., Einarsson, S., Sverrisdóttir, G., Höskuldsson, A. & Oddsson, B. (2011). Lahar, Floods and Debris flows resulting from the 2010 Eruption of Eyjafjallajökull: Observations, Mapping, and Modelling. The Second World Landslide Forum, 3-9 Oct., Rom, [WLF2-2011–0698].
Jensen, E. H. (2010). Lava flow simulations and ash fallout predictions. GI Norden Workshop, Selfoss, Iceland, 14–16 June.
204
Jensen E. H. (2010). Öskuskráning og kortlagning. Landupplýsingar 2010. [In Icelandic] LÍSA workshop, Kópavogur, Iceland, 21 Oct.
Jónsdóttir, I., Larsen, G., Thordarson, Th., Höskuldsson, Á., Höskuldsson, F. & Gerard Davies, A. (2011). Tephra dispersal monitoring by satellite images [EGU2011-13167[.
Guðmundsson, M. T., Höskuldsson, Á., Larsen, G., Thordarson, Th., Oddsson, B., Högnadóttir, Th. et al. (2011). Eyjafjallajökull April-June 2010: An explosive-mixed eruption of unusually long duration. [EGU2011-12542].
Jónsdóttir, I., Larsen, G., Thordarson, T., Höskuldsson, A., Höskuldsson, F. & Davies, A. G. (2010). I Near-field tephra dispersal monitoring by satellites. AGU 2010 Fall Meeting, San Francisco, California, 13-17 Dec.
Karlsdóttir, S. Thorsteinsson, H., Vogfjörð, K. S. & Snorrason, Á. (2010). Volcanic Eruptions; a Threat to aviation. The IcelandicDefence Agency (IDA) Keflavik Airport, 10 June.
Karlsdóttir, S., Björnsson, H., Arason, P., Petersen, G. N., Thorsteinsson, H. & Pétursson, H. (2010). Monitoring and detection of Eyjafjallajökull and volcanic ash. Atlantic Conference on Eyjafjallajökull and Aviation, Keilir, Keflavik Airport, Sept. [1516].
Karlsdóttir, S. (2010) Monitoring and detection of Eyjafjallajökull and volcanic ash. EU Think Tank meeting, Brussel, 14-15 Oct.
Karlsdóttir, S., Pétursson, H., Petersen, G. N., Björnsson, H., Thorsteinsson, H., Hervarsson, Th. F. et al. (2011). Ash plume monitoring at the Eyjafjallajökull eruption 2010. AMS 91st annual meeting, Seattle, 23 –27 Jan. [184445.]
Karlsóttir, S., von Löwis, S., Þorsteinsson, H. & Vogfjörð, K. S. (2010). The volcanic eruption in Eyjafjallajökull 2010; an overview of the monitoring of the eruption plume. Work meeting in Geneva, Svitzerland, 18-20 Oct.
Karlsdóttir, S., Petersen, G. N., Björnsson, H., Pétursson, h., Þorsteinsson, H., Vogfjörð K. S. (2010). Eldgos í Eyjafjallajökli - hlutverk Veðurstofu Íslands [in Icelandic]. IMO´s 90 years anniversary meeting, Reykjavík, 14 Dec.
Larsen, G., Thordarson, T., Höskuldsson, A., Guðmundsson, M. T., Sverrisdóttir, G., Oddsson, B., Oskarsson, B. V., Jonsdóttir, I., Oladóttir, B., Thorsteinsson, T., Hartley, M. E. and Meara, R. On-land distribution and modes of deposition of the Eyjafjallajökull 2010 tephra. AGU 2010 Fall Meeting, San Francisco, California, 13-17 Dec.
von Löwis, S., Weber, K., Fischer, C., Dietze, V. & Kaminski, U. (2011). Measurements of ambient aerosols in the south of Eyjafjallajökull. Focused on resuspension of volcanic ash. [Poster.] Environmental pollution in Iceland - monitoring & research, Reykjavík, 25 Feb.
Magnússon, E., Guðmundsson, M. T., Höskuldsson, F. & Högnadóttir, Th. (2010). Ice-volcano interactions in Eyjafjallajökull volcano, Iceland. SPIRIT workshop Toulouse 29-30 April,.
Oddsson, B., Guðmundsson, M. T., Högnadóttir, Th., Magnússon, e. & Höskuldsson, F. (2010). Lava-ice interaction during the advance of a trachyandsitic lava flow down the Gígjökull outlet glacier in the April-May 2010 Eyjafjallajökull eruption, Iceland. AGU Fall meeting, San Francisco, California,13-17 Dec.
Óladóttir, B. A., Larsen, G. & Sigmarsson F. (2011). The neighbours of the Eyjafjallajökull volcano: Katla, Grímsvötn and Bárðarbunga. EGU. Geophysical Research Abstracts Vol. 13, [EGU2011-3522]
Pagneux, E. P., Sigurðsson, G. & Björnsson, B. B. (2010). Overview on glacial bursts following the eruption of Eyjafjallajökull volcano on April 14 2010. EGU General Assembly, Vienna, Austria, 2–7 May.
Pedersen, R. (2011) Eyjafjallajökull – vulkanen der lammede Europa [in Danish], Dansk Geologisk Forenings årsmøde. Copenhagen, 12 March.
205
Pedersen, R., Sigmundsson, F., Hooper, A. J. Hreinsdóttir, S., Árnadóttir, Th., Roberts, M. J. et al. (2011) Imaging the magmatic plumbing system at Eyjafjallajökull volcano, Iceland, through 18 years of surface deformation observations, EGU General Assembly. Geophysical Research Abstracts, Vol. 13 [EGU2011-11656].
Pedersen, R., Sigmundsson, F., Hreinsdóttir, S., Árnadóttir, Th., Höskuldsson, Á., Guðmundsson, M. T. et al. (2010). Surface deformation versus eruption rates of the two Eyjafjallajökull 2010 eruptions; implications for the magma plumbing system and origin of melts. AGU 2010 Fall Meeting, San Francisco, California, 13-17 Dec. [Abstr. G22B-01],
Pedersen, R., Sigmundsson F. & Einarsson, P. (2010). What’s up below Eyjafjallajökull volcano? - relations between seismicity and deformation. Geoscience Society of Iceland, Spring meeting, Reykjavik, Iceland, 26 March.
Pedersen, R., Sigmundsson, F., Hreinsdóttir, S., Árnadóttir, Th., Höskuldsson, Á., Guðmundsson, M. T. & Magnússon, E. (2010). Surface deformation versus eruption rates of the two Eyjafjallajökull 2010 eruptions; implications for the magma plumbing system and origin of melts. AGU Fall meeting, San Francisco, California, 13-17 Dec.
Petersen G. N., Arason, P. & Björnsson, H. (2011). Observed interaction of the Eyjafjallajökull eruption plume and the ambient atmosphere. EGU General Assembly, Vienna, Austria, 3-8 April. [7983].
Petersen, G. N. (2010). Gosmökkurinn úr Eyjafjallajökli og samskipti hans við andrúmsloftið [in Icelandic]. IMO´s 90 years anniversary meeting, Reykjavík, 14 Dec.
Petersen, G. N. & Arason, P. (2010). Með gosmökk á radarnum [in Icelandic]. Veðurfræðifélagið (Meteorological Society) Fall meeting, Reykjavík, 20 Oct.
Ripepe, M., Lacanna, G., Delle Donne, D., Genco, R., Marchetti, E., Ulivieri, G., Höskuldsson, Á. & Cioni, R. (2010) Monitoring the Eyjafjalljokull ash eruption with a near-source Infrasonic Array. AGU 2010 Fall Meeting, San Francisco, California 13-17 Dec.
Roberts, M. J., Sigurðsson, G., Sigurðsson, O., Pagneux, E. P., Jóhannesson, T., Zóphóníasson, S., Guðmundsson, M. T., Russell, A. J., Gylfason, A. G., Höskuldsson, F. & Björnsson, B. B. (2011). The April 2010 Eruption of Eyjafjallajökull Volcano: Glacial Flooding and Attendant Hazards. IAVCEI–IUGG, Melbourne, Australia, 28 June–7 July.
Sigmundsson, F., Guðmundsson, M. T., Thordarson, Th., Hreinsdóttir, S., Hjaltadóttir, S., Vogfjörð, K. S. et al. (2011). Pulsating activity during the 2010 summit eruption of Eyjafjallajökull: Correlation of eruption style, plume height, deformation, seismicity, earthquake tremor and chemical evolution of eruptive products. EGU General Assembly, Vienna, Austria, 3-8 Apríl [EGU2011-13388].
Sigmundsson, F., Hreinsdóttir, S. Björnsson, H., Arason, P., Grapenthin, R. Roberts, M. J. et al. (2011). The 2011 explosive eruption, Iceland: Relation between magma chamber pressure drop inferred from high rate geodesy and plume strength from radar observations. AGU Fall meeting, San Francisco, Dec. [V41E-08].
Sigmundsson, F., Sigmarsson, O., Hooper, A., Hreinsdóttir, S., Hjaltadóttir, S., Vogfjörð, K. S. et al. (2011). The 2010 inflation and deflation sources of Eyjafjallajökull: Magma flow, geochemical characteristics and evidence for intrusion triggering of the explosive summit eruption. EGU General Assembly. [Vol. 13, EGU2011-13562].
Sigmundsson, F., Hreinsdóttir, S., Hooper, A., Árnadóttir, Th., Pedersen, R., Roberts, M. J. et al. (2010). Intrusion triggering of explosive eruptions: Lessons learned from Eyjafjallajökull 2010 eruptions and crustal deformation studies. AGU 2010 Fall Meeting, San Francisco, California, 13-17 Dec. [Abstract V53F-02].
Sigmundsson, F., Hooper, A., Pedersen, R., Hreinsdóttir, S., Árnadóttir, Þ., Roberts, M. J. et al. (2010). Satellite radar interferometric observations 1992-2010 of Eyjafjallajökull
206
volcano: Relating deformation sources to volcano behaviour. Engineering and Natural Sciences Research Symposium, Reykjavík 8 –9 Oct. [Abstract R-VoN 2010, s.34].
Sigurðsson, Á. (2010). The volcanic ash plume. Lecture for Nordic Civil Protection Group. Reykjavík,10 June.
Sigurðsson, Á., Pálmason, B., Jensen, E. H., Petersen, G. N., Björnsson, H., Þorsteinsson, H. & Arason, P. (2010). Eyjafjallajökull 2010 - The activity of the eruption plume during the first 2 weeks. EGU General Assembly, Vienna, Austria, 2–7 May. [EGU2010-15768].
Sigurðsson, O., Sigurðsson, G., Björnsson, B. B., Pagneux, E. P., Zóphóníasson, S., Einarsson, B. et al. (2010). Flóðavöktun og jökulhlaup - Eyjafjallajökull.[in Icelandic]. IMO´s 90 years anniversary meeting, Reykjavík, 14 Dec.
Stevenson, J., Gilbert, J., Höskuldsson, Á., Milodowski, A., Loughlin, S. & Thordarson, Th. (2011). Morphology of proximal and distal ash grains from the 2010 Eyjafjallajökull summit eruption. [EGU2011-9091].
Sverrisdóttir, G., Ólafsdóttir, R., Höskuldsson, Á., Oddsson, B., Helgason, J. K., Jensen, E. H. et al. (2011). May 19th rain triggered lahar originating in the Eyjafjallajökull 2010 volcanic ash. Observation, mapping and granulometric study. EGU General Assembly, Vienna, Austria, 3–8 April. [Poster 6621].
Thordarson, Th., Hayward, C. Moune, S., Hartley, M., Sigmarsson, O., Höskuldsson, Á., (2011). The 20 March - 12 April 2010 Fimmvörðuháls eruption, Eyjafjallajöull volcano, Iceland: Volatile contents and magma degassing. [EGU2011-12147].
Thordarson, Th., Höskuldsson, Á., Sigmarsson, O., Guðmundsson, M. T., Magnússon E. & Sigmundsson, F. (2011). The 20 March to 12 April basaltic Fimmvörðuháls flank eruption at Eyjafjallajökull volcano, Iceland: course of events [EGU2011-12212].
Thordarson, Th., Hayward, C., Hartley, M., Sigmarsson, O., Höskuldsson Á. & Larsen, G. (2011). The 14 April–22 May 2010 summit eruption at Eyjafjallajökull volcano, Iceland: Volatile contents and magma degassing [EGU2011-12046].