Embed Size (px)
Citation preview
www.aragon.es/iaest
TERRITORY AND INFRASTRUCTURES
› TERRITORY
› INFRASTRUCTURES
ARAGON BASIC DATA, 2017 · Instituto Aragonés de Estadística
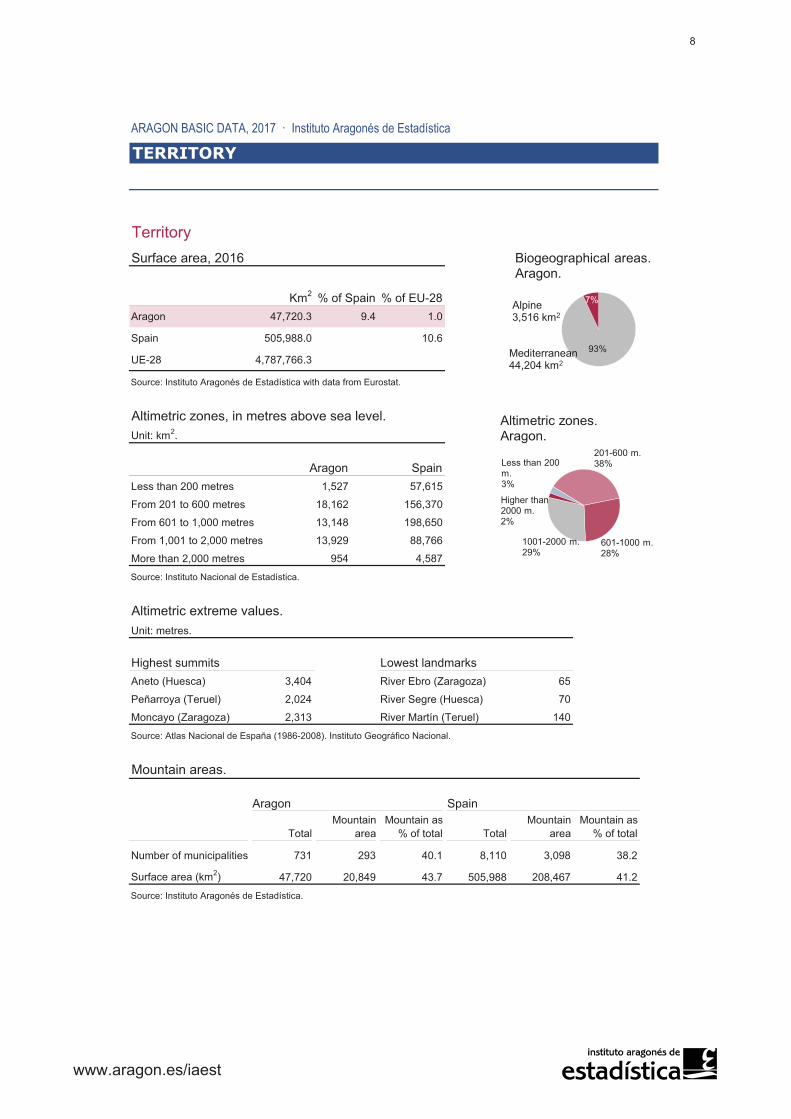
TerritorySurface area, 2016
Km2 % of Spain % of EU-28Aragon 47,720.3 9.4 1.0
Spain 505,988.0 10.6
UE-28 4,787,766.3
Source: Instituto Aragonés de Estadística with data from Eurostat.
Altimetric zones, in metres above sea level.Unit: km2.
Aragon SpainLess than 200 metres 1,527 57,615
From 201 to 600 metres 18,162 156,370
From 601 to 1,000 metres 13,148 198,650
From 1,001 to 2,000 metres 13,929 88,766
More than 2,000 metres 954 4,587
Source: Instituto Nacional de Estadística.
Altimetric extreme values.Unit: metres.
Highest summits Lowest landmarksAneto (Huesca) 3,404 River Ebro (Zaragoza) 65
Peñarroya (Teruel) 2,024 River Segre (Huesca) 70
Moncayo (Zaragoza) 2,313 River Martín (Teruel) 140
Source: Atlas Nacional de España (1986-2008). Instituto Geográfico Nacional.
Mountain areas.
Spain
TotalMountain
areaMountain as
% of total TotalMountain
areaMountain as
% of total
Number of municipalities 731 293 40.1 8,110 3,098 38.2
Surface area (km2) 47,720 20,849 43.7 505,988 208,467 41.2
Source: Instituto Aragonés de Estadística.
Aragon
TERRITORY
Alpine 3,516 km2
Mediterranean 44,204 km2
Biogeographical areas.Aragon.
7%
93%
Less than 200 m.3%
201-600 m.38%
601-1000 m.28%
1001-2000 m.29%
Higher than 2000 m.2%
Altimetric zones. Aragon.
www.aragon.es/iaest
8
ARAGON BASIC DATA, 2017 · Instituto Aragonés de Estadística
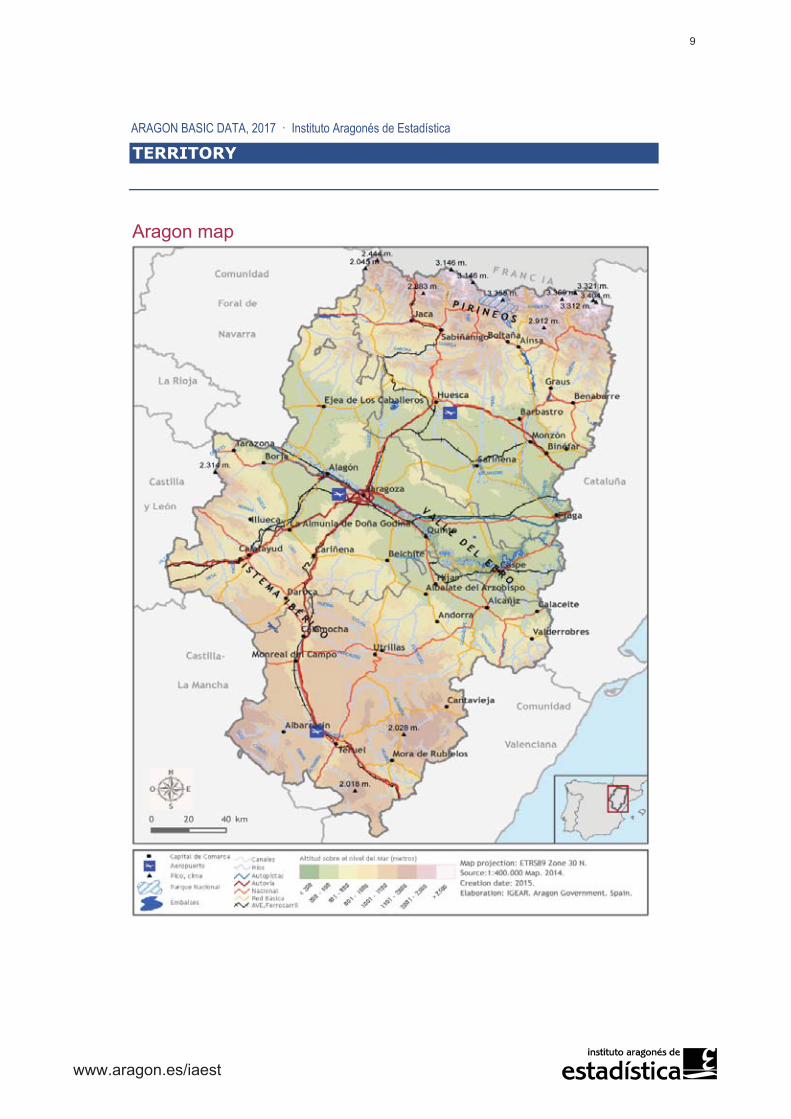
Aragon map
TERRITORY
www.aragon.es/iaest
9
ARAGON BASIC DATA, 2017 · Instituto Aragonés de Estadística
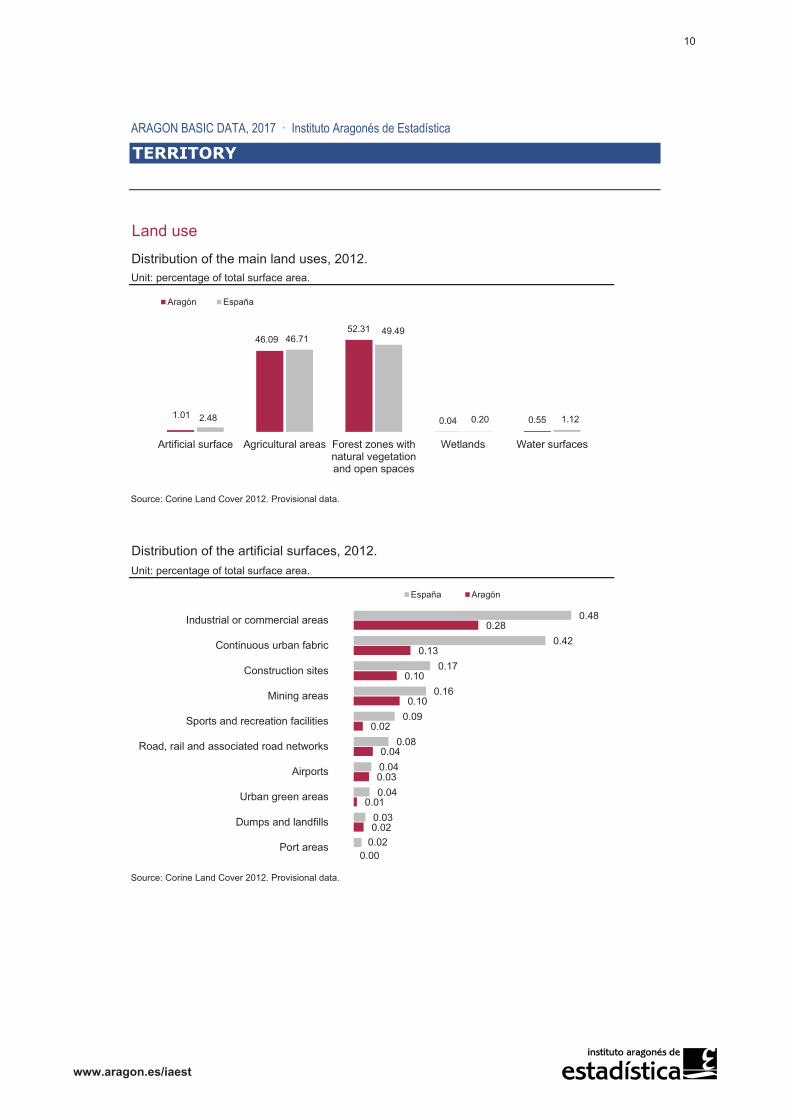
Land use
Distribution of the main land uses, 2012.Unit: percentage of total surface area.
Distribution of the artificial surfaces, 2012.Unit: percentage of total surface area.
Source: Corine Land Cover 2012. Provisional data.
Source: Corine Land Cover 2012. Provisional data.
TERRITORY
0.00
0.02
0.01
0.03
0.04
0.02
0.10
0.10
0.13
0.28
0.02
0.03
0.04
0.04
0.08
0.09
0.16
0.17
0.42
0.48
Port areas
Dumps and landfills
Urban green areas
Airports
Road, rail and associated road networks
Sports and recreation facilities
Mining areas
Construction sites
Continuous urban fabric
Industrial or commercial areas
España Aragón
1.01
46.0952.31
0.04 0.552.48
46.7149.49
0.20 1.12
Artificial surface Agricultural areas Forest zones withnatural vegetationand open spaces
Wetlands Water surfaces
Aragón España
www.aragon.es/iaest
10

ARAGON BASIC DATA, 2017 · Instituto Aragonés de Estadística
Land use map
MAPA OCUPACIÓN DEL SUELO CORINE LAND COVER
TERRITORY
www.aragon.es/iaest
11
ARAGON BASIC DATA, 2017 · Instituto Aragonés de Estadística
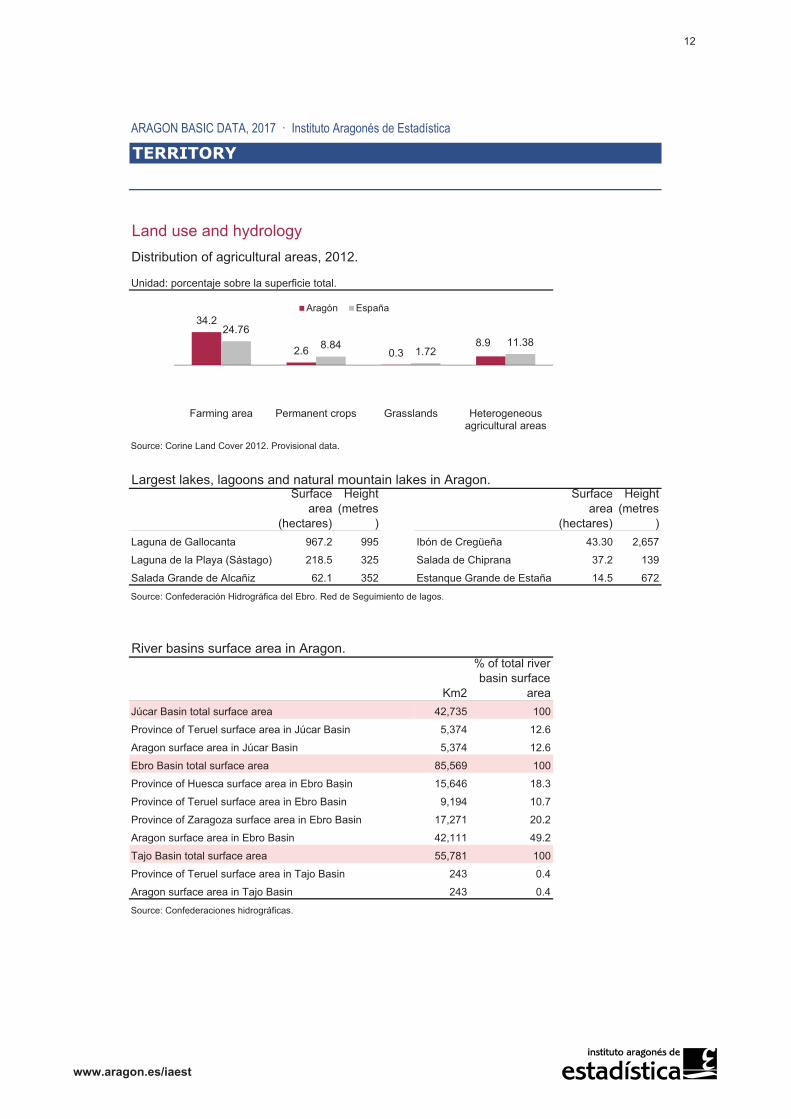
Land use and hydrologyDistribution of agricultural areas, 2012.
Unidad: porcentaje sobre la superficie total.
Largest lakes, lagoons and natural mountain lakes in Aragon.Surface
area(hectares)
Height(metres
)
Surfacearea
(hectares)
Height(metres
)Laguna de Gallocanta 967.2 995 Ibón de Cregüeña 43.30 2,657
Laguna de la Playa (Sástago) 218.5 325 Salada de Chiprana 37.2 139
Salada Grande de Alcañiz 62.1 352 Estanque Grande de Estaña 14.5 672
Source: Confederación Hidrográfica del Ebro. Red de Seguimiento de lagos.
River basins surface area in Aragon.
Km2
% of total river basin surface
areaJúcar Basin total surface area 42,735 100
Province of Teruel surface area in Júcar Basin 5,374 12.6
Aragon surface area in Júcar Basin 5,374 12.6
Ebro Basin total surface area 85,569 100
Province of Huesca surface area in Ebro Basin 15,646 18.3
Province of Teruel surface area in Ebro Basin 9,194 10.7
Province of Zaragoza surface area in Ebro Basin 17,271 20.2
Aragon surface area in Ebro Basin 42,111 49.2
Tajo Basin total surface area 55,781 100
Province of Teruel surface area in Tajo Basin 243 0.4
Aragon surface area in Tajo Basin 243 0.4
Source: Confederaciones hidrográficas.
Source: Corine Land Cover 2012. Provisional data.
TERRITORY
34.2
2.6 0.38.9
24.768.84 1.72
11.38
Farming area Permanent crops Grasslands Heterogeneousagricultural areas
Aragón España
www.aragon.es/iaest
12

ARAGON BASIC DATA, 2017 · Instituto Aragonés de Estadística
River basins map of Aragon
TERRITORY
www.aragon.es/iaest
13

ARAGON BASIC DATA, 2017 · Instituto Aragonés de Estadística
Hydrology and climate networkMain rivers in Aragon.Total river length in kilometres.
Ebro (1) 954.6Aguasvivas 108.9 Alcanadre 148.1Arroyo del Regallo 49.7 Ara 67.6Guadalope 187.8 Aragón 205.1Huecha 50.7 Arba de Luesia 106.2Huerva 138 Cinca 190.8Jalón 234.7 Ésera 101.3Jiloca 128.5 Gállego 202.9Martín 102.7 Noguera-Ribagorzana (1) 133.2Matarraña 110.2 Segre (1) 271.3Queiles (1) 42.5
Mijares (1) 184.09 Gallo (1) 98Guadalaviar or Turia (1) 336.41Alfambra 110.07
(1) Rivers that partially flow throughout Aragon territory.
Source: Confederaciones Hidrográficas.
Climate types in Aragon.
Temperature (ºC) PrecipitationAnnual
meanAbsolute
min.Absolute
max.Annual
(mm)Days in
yearSteppe dry
Caspe 15.9 -10.3 45.4 316.0 50 1,216.0Zaragoza-Airport 14.6 -11.3 42.3 344.9 60 1,200.7
Continental mediterraneanEjea de los Caballeros 14.4 -11.6 41.3 454.3 65 1,212.0Monzón - -12.2 42.2 386.6 45 1,285.2
Transition mediterranean-oceanicAnsó - -16.2 38.6 1,134.2 108 1,005.5
Submediterranean humidBoltaña 14.8 -13.9 40.0 911.3 83 1,251.2
Submediterranean continental warmAndorra 14.3 -11.0 41.5 431.1 54 1,075.4Calatayud 13.4 -13.8 41.3 346.4 59 1,258.9
Submediterranean continental coldCalamocha 10.5 -19.1 39.6 437.7 68 1,196.8
Mountain climateFanlo-Refugio de Góriz 4.9 -15.6 39.8 1,646.9 96 770.5
Source: Atlas climático de Aragón del Departamento de Agricultura, Ganadería y Medio Ambiente. Gobierno de Aragón.
TERRITORY
Ebro basin Ebro tributaries
Gave d'Aspe(1) 57
Annualevapotranspiration
Climate types-Representative observatory
Júcar basinTajo basin
L'Adour basin
www.aragon.es/iaest
14
ARAGON BASIC DATA, 2017 · Instituto Aragonés de Estadística
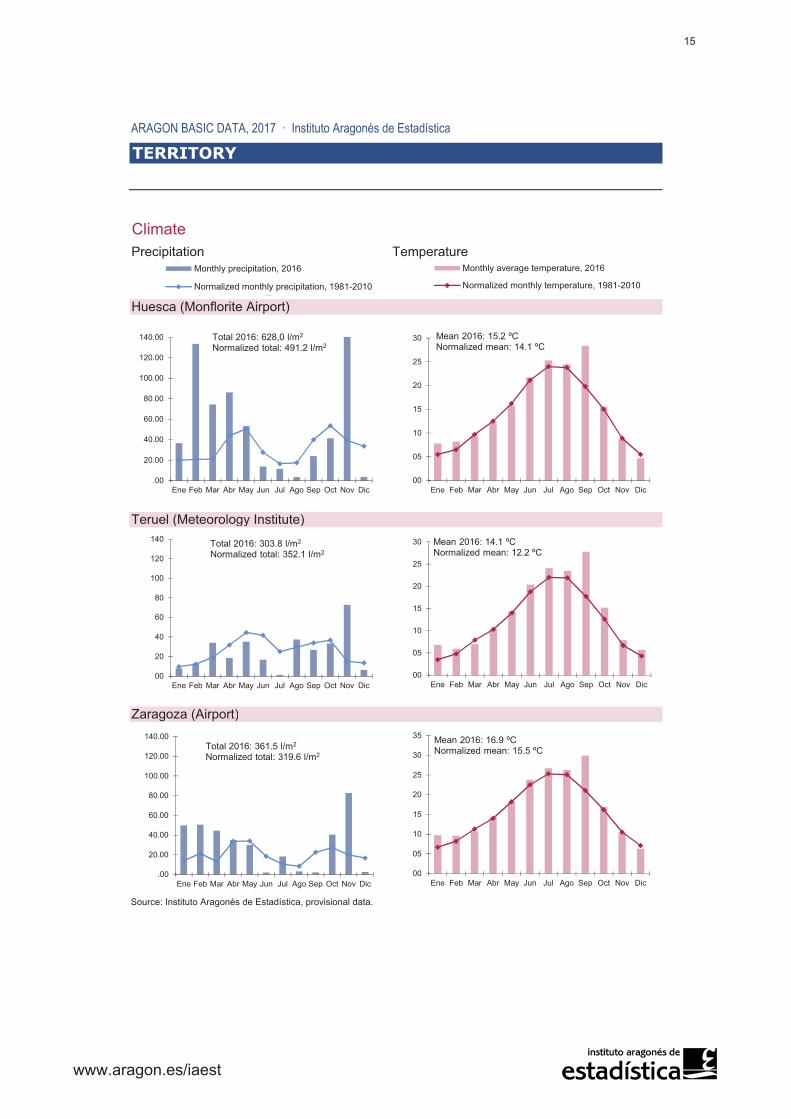
ClimatePrecipitation Temperature
Huesca (Monflorite Airport)
Teruel (Meteorology Institute)
Zaragoza (Airport)
Source: Instituto Aragonés de Estadística, provisional data.
TERRITORY
.00
20.00
40.00
60.00
80.00
100.00
120.00
140.00
Ene Feb Mar Abr May Jun Jul Ago Sep Oct Nov Dic
Total 2016: 628,0 l/m2
Normalized total: 491.2 l/m2
00
05
10
15
20
25
30
Ene Feb Mar Abr May Jun Jul Ago Sep Oct Nov Dic
Mean 2016: 15.2 ºCNormalized mean: 14.1 ºC
.00
20.00
40.00
60.00
80.00
100.00
120.00
140.00
Ene Feb Mar Abr May Jun Jul Ago Sep Oct Nov Dic
Total 2016: 361.5 l/m2
Normalized total: 319.6 l/m2
00
05
10
15
20
25
30
Ene Feb Mar Abr May Jun Jul Ago Sep Oct Nov Dic
Mean 2016: 14.1 ºCNormalized mean: 12.2 ºC
00
05
10
15
20
25
30
35
Ene Feb Mar Abr May Jun Jul Ago Sep Oct Nov Dic
Mean 2016: 16.9 ºCNormalized mean: 15.5 ºC
2628
1 2
Monthly precipitation, 2016
Normalized monthly precipitation, 1981-2010 010
1 2
Monthly average temperature, 2016
Normalized monthly temperature, 1981-2010
00
20
40
60
80
100
120
140
Ene Feb Mar Abr May Jun Jul Ago Sep Oct Nov Dic
Total 2016: 303.8 l/m2
Normalized total: 352.1 l/m2
www.aragon.es/iaest
15

ARAGON BASIC DATA, 2016 · Instituto Aragonés de Estadística
Volume of water in rivers
MAPA CAUDAL MEDIO ANUAL
TERRITORY
www.aragon.es/iaest
16
ARAGON BASIC DATA, 2017 · Instituto Aragonés de Estadística
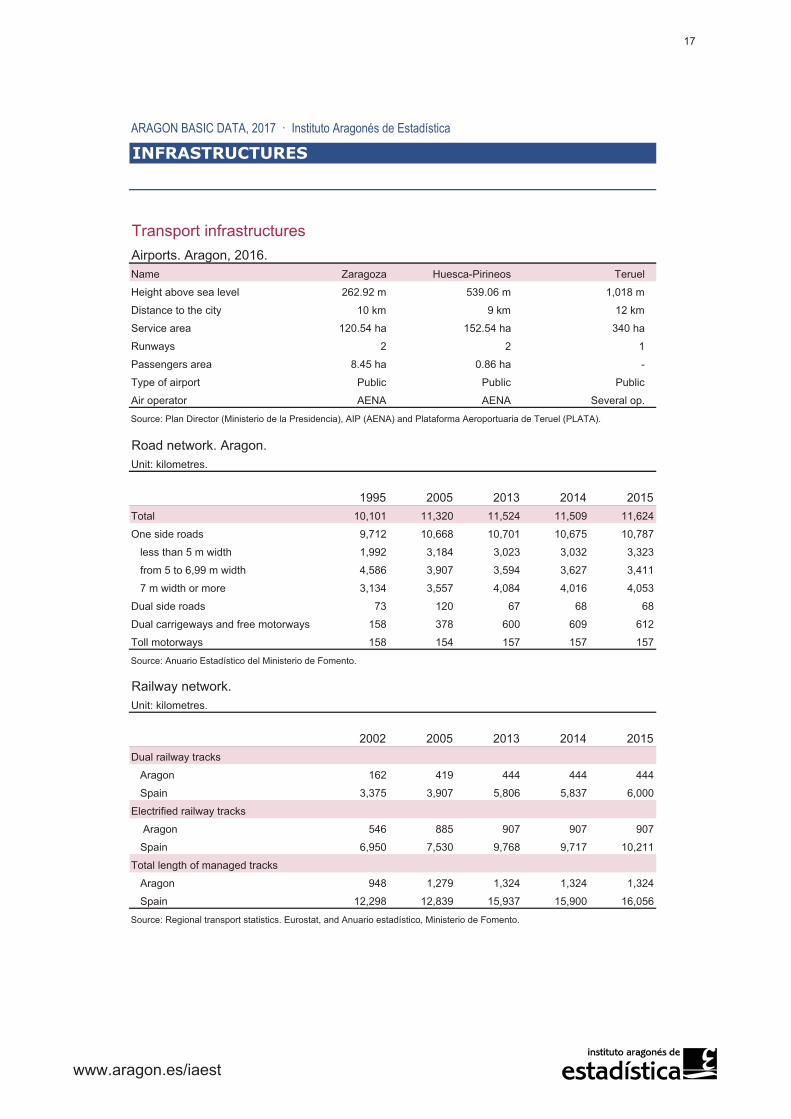
Transport infrastructures
Name Zaragoza Huesca-Pirineos Teruel
Height above sea level 262.92 m 539.06 m 1,018 m
Distance to the city 10 km 9 km 12 km
Service area 120.54 ha 152.54 ha 340 ha
Runways 2 2 1
Passengers area 8.45 ha 0.86 ha -
Type of airport Public Public Public
Air operator AENA AENA Several op.
Source: Plan Director (Ministerio de la Presidencia), AIP (AENA) and Plataforma Aeroportuaria de Teruel (PLATA).
Unit: kilometres.
1995 2005 2013 2014 2015Total 10,101 11,320 11,524 11,509 11,624
One side roads 9,712 10,668 10,701 10,675 10,787
less than 5 m width 1,992 3,184 3,023 3,032 3,323
from 5 to 6,99 m width 4,586 3,907 3,594 3,627 3,411
7 m width or more 3,134 3,557 4,084 4,016 4,053
Dual side roads 73 120 67 68 68
Dual carrigeways and free motorways 158 378 600 609 612
Toll motorways 158 154 157 157 157
Source: Anuario Estadístico del Ministerio de Fomento.
Unit: kilometres.
2002 2005 2013 2014 2015Dual railway tracks
Aragon 162 419 444 444 444
Spain 3,375 3,907 5,806 5,837 6,000
Electrified railway tracks
Aragon 546 885 907 907 907
Spain 6,950 7,530 9,768 9,717 10,211
Total length of managed tracks
Aragon 948 1,279 1,324 1,324 1,324
Spain 12,298 12,839 15,937 15,900 16,056
Source: Regional transport statistics. Eurostat, and Anuario estadístico, Ministerio de Fomento.
Road network. Aragon.
Railway network.
INFRASTRUCTURES
Airports. Aragon, 2016.
www.aragon.es/iaest
17

ARAGON BASIC DATA, 2017 · Instituto Aragonés de Estadística
Reservoirs and irrigation systems
Basin district BasinNo. of
reservoirsTotal
capacity (Hm3)Total surface
area (Ha)Ebro
Ebro Aguas Vivas 1 8.0 75.0Ebro Alcanadre 2 65.1 286.2Ebro Aragón 2 451.9 2,116.0Ebro Arba 3 57.3 445.3Ebro Baja Ebro 2 1,824.8 9,748.9Ebro Cinca 5 867.6 3,213.8Ebro Ésera 1 84.7 664.3Ebro Gállego 9 431.1 2,946.4Ebro Guadalope 5 203.0 1,575.5Ebro Huerva 1 6.7 77.0Ebro Jalón 3 122.9 856.0Ebro Martín 1 22.1 190.0Ebro Matarraña 1 17.9 149.0Ebro Noguera Ribagorzana 5 1,115.3 2,876.1Ebro Queiles 1 24.2 112.2Ebro Semibaja Ebro 1 104.1 1,086.7
Júcar
Júcar Guadalaviar 2 31.0 155.0
Source: Instituto Aragonés de Estadística with data from Inventario de Presas y Embalses de España.
Channel
Irrigationhectares in
AragonTotal irrigation
hectaresTotal channel
length (km)Riegos del Alto Aragón 125,899 125,899 133
Riegos del Canal de Aragón y Cataluña 62,306 98,402 124
Riegos del Canal de Bardenas 40,074 81,688 132
Riegos Plan Estratégico Bajo Ebro (PEBEA) 17,551 17,551 -
Riegos del Canal Imperial 23,600 27,568 108
Regadíos del Jalón y Jiloca 21,066 21,066 -
Riegos de la Cuenca del Guadalope 12,158 12,158 -
Riegos del Canal de Tauste 6,167 8,407 44
Source: Confederación Hidrográfica del Ebro.
Reservoirs whose capacity is under 5 hm3 are not considered.
Main irrigation systems from surface water. Aragon, 2016.
INFRASTRUCTURES
Reservoirs per hydrographical basins. Aragon, 2016.
www.aragon.es/iaest
18
ARAGON BASIC DATA, 2017 · Instituto Aragonés de Estadística
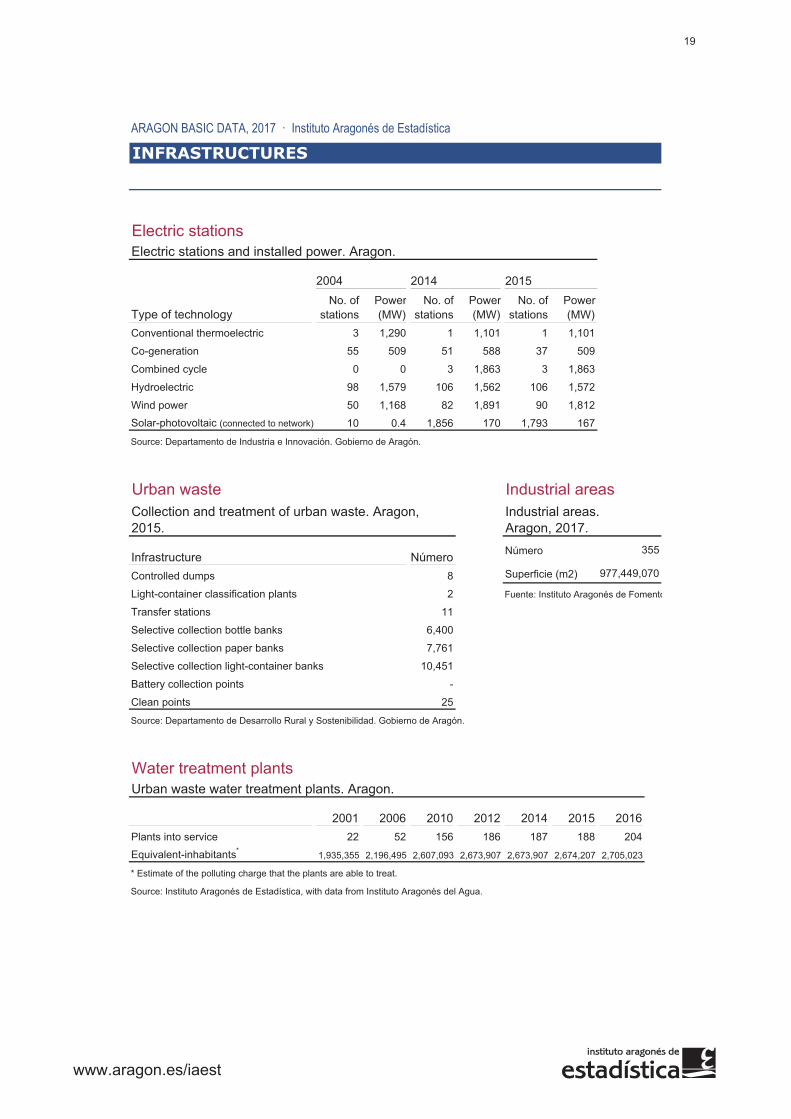
Electric stations
2004 2014 2015
Type of technologyNo. of
stationsPower(MW)
No. of stations
Power(MW)
No. of stations
Power(MW)
Conventional thermoelectric 3 1,290 1 1,101 1 1,101
Co-generation 55 509 51 588 37 509
Combined cycle 0 0 3 1,863 3 1,863
Hydroelectric 98 1,579 106 1,562 106 1,572
Wind power 50 1,168 82 1,891 90 1,812Solar-photovoltaic (connected to network) 10 0.4 1,856 170 1,793 167
Source: Departamento de Industria e Innovación. Gobierno de Aragón.
Urban waste Industrial areas
Infrastructure Número Número
8 Superficie (m2)
Light-container classification plants 2 Fuente: Instituto Aragonés de Fomento
11
6,400
7,761
10,451
-
25
Source: Departamento de Desarrollo Rural y Sostenibilidad. Gobierno de Aragón.
Water treatment plants
2001 2006 2010 2012 2014 2015 2016Plants into service 22 52 156 186 187 188 204Equivalent-inhabitants* 1,935,355 2,196,495 2,607,093 2,673,907 2,673,907 2,674,207 2,705,023
* Estimate of the polluting charge that the plants are able to treat.
Source: Instituto Aragonés de Estadística, with data from Instituto Aragonés del Agua.
Clean points
Selective collection paper banks
Urban waste water treatment plants. Aragon.
Battery collection points
Collection and treatment of urban waste. Aragon, 2015.
Transfer stations
Selective collection light-container banks
Selective collection bottle banks
Controlled dumps
Industrial areas.Aragon, 2017.
977,449,070
INFRASTRUCTURES
Electric stations and installed power. Aragon.
355
www.aragon.es/iaest
19