Embed Size (px)
Citation preview
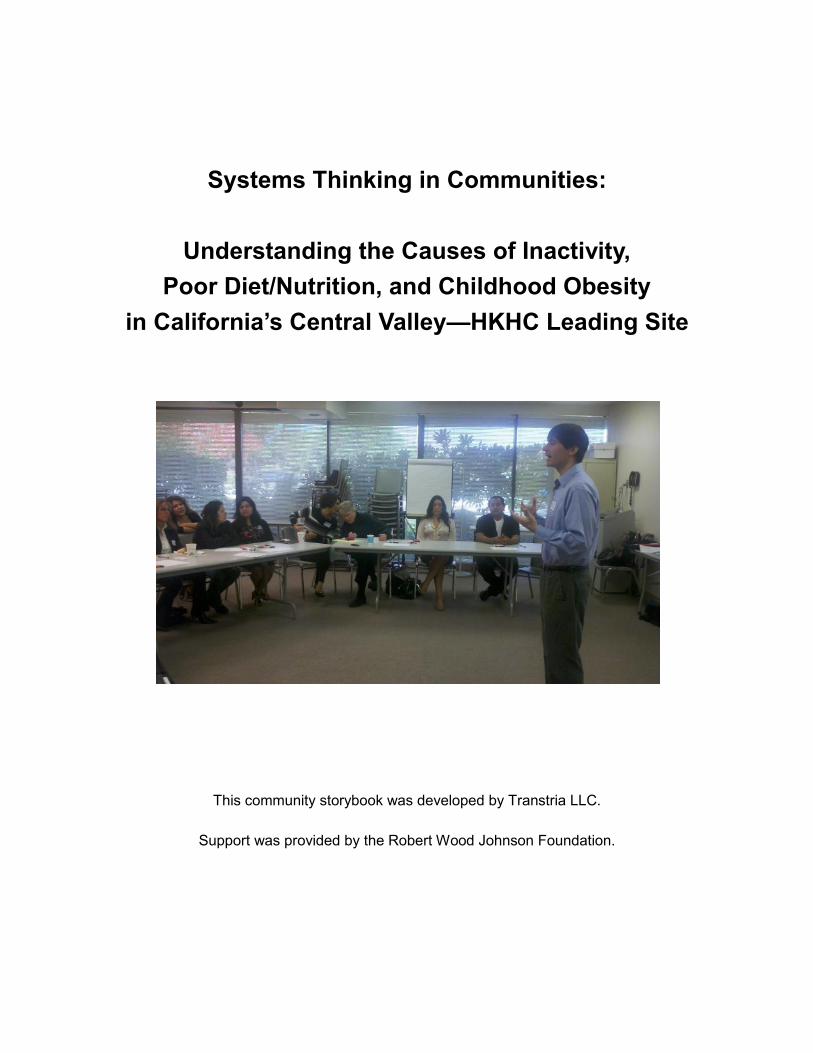
Systems Thinking in Communities:
Understanding the Causes of Inactivity,
Poor Diet/Nutrition, and Childhood Obesity
in California’s Central Valley—HKHC Leading Site
This community storybook was developed by Transtria LLC.
Support was provided by the Robert Wood Johnson Foundation.

Acknowledgments
Support for this evaluation was provided by a grant from the Robert Wood Johnson Foundation (#67099).
Transtria LLC led the evaluation and dissemination activities from April 2009 to March 2014. Representatives
from California’s Central Valley—Healthy Kids, Healthy Communities partnership actively participated in the
evaluation planning, implementation, and dissemination activities.
We are grateful for the collaboration with and support from the Robert Wood Johnson Foundation (Laura
Leviton, PhD and Tina Kauh, PhD), the Washington University Institute for Public Health (Ross Brownson,
PhD), the Healthy Kids, Healthy Communities (HKHC) National Program Office (Casey Allred; Rich Bell,
MCP; Phil Bors, MPH; Mark Dessauer, MA; Fay Gibson, MSW; Joanne Lee, LDN, RD, MPH; Mary Beth
Powell, MPH; Tim Schwantes, MPH, MSW; Sarah Strunk, MHA; and Risa Wilkerson, MA), the HKHC
Evaluation Advisory Group (Geni Eng, DrPH, MPH; Leah Ersoylu, PhD; Laura Kettel Khan, PhD; Vikki
Lassiter, MS; Barbara Leonard, MPH; Amelie Ramirez, DrPH, MPH; James Sallis, PhD; and Mary Story,
PhD), the Social System Design Lab at Washington University in St. Louis (Peter Hovmand, PhD), the
University of Memphis (Daniel Gentry, PhD), and Innovative Graphic Services (Joseph Karolczak).
Special thanks to the many individuals who have contributed to these efforts from Transtria LLC, including
Evaluation Officers (Tammy Behlmann, MPH; Kate Donaldson, MPH; Cheryl Carnoske, MPH; Carl Filler,
MSW; Peter Holtgrave, MPH, MA; Christy Hoehner, PhD, MPH; Allison Kemner, MPH; Jessica Stachecki,
MSW, MBA), Project Assistants (James Bernhardt; Rebecca Bradley; Ashley Crain, MPH; Emily Herrington,
MPH; Ashley Farell, MPH; Amy Krieg; Brandye Mazdra, MPH; Kathy Mora, PhD; Jason Roche, MPH; Carrie
Rogers, MPH; Shaina Sowles, MPH; Muniru Sumbeida, MPH, MSW; Caroline Swift, MPH; Gauri Wadhwa,
MPH; Jocelyn Wagman, MPH), additional staff (Michele Bildner, MPH, CHES; Daedra Lohr, MS; Melissa
Swank, MPH), Interns (Christine Beam, MPH; Skye Buckner-Petty, MPH; Maggie Fairchild, MPH; Mackenzie
Ray, MPH; Lauren Spaeth, MS), Transcriptionists (Sheri Joyce; Chad Lyles; Robert Morales; Vanisa Verma,
MPH), and Editors (Joanna Bender and Julie Claus, MPH).
This material may be reproduced or copied with permission from California’s Central Valley—Healthy Kids,
Healthy Communities, Robert Wood Johnson Foundation, the Healthy Kids, Healthy Communities National
Program Office, or Transtria LLC. Citation of the source is appreciated.
Suggested citation:
Brennan L, Sabounchi N, Islas-Hooker G. Systems Thinking in Communities: Understanding the Causes of Inactivity, Poor Diet/Nutrition, and Childhood Obesity in Central Valley, California. 2013. http://www.transtria.com/hkhc. Accessed <Date Accessed>.

Introduction
California’s Central Valley—Healthy Kids, Healthy Communities (HKHC) Leading Site is one of 49 community partnerships participating in the national Healthy Kids, Healthy Communities program of the Robert Wood Johnson Foundation (www.healthykidshealthycommunities.org). The purpose of this California’s Central Valley—HKHC Leading Site project was to introduce systems thinking at the community level by identifying the essential parts of the Central Valley, California system and how the system influences policy and environmental changes to promote healthy eating and active living as well as to prevent childhood obesity. To accomplish this goal, community partners and residents participated in a group model building session and discussions. The group model building exercises were designed by staff from Transtria LLC and the Social System Design Lab at Washington University in St. Louis, Missouri as part of the Evaluation of Healthy Kids, Healthy Communities funded by the Robert Wood Johnson Foundation. These exercises actively involved a wide range of participants in modeling complex systems and provided a way for different representatives (e.g., residents, government agencies, community-based organizations, foundations, academic institutions) to better understand the systems (i.e., dynamics and structures) in the community (see the Healthy Kids, Healthy Communities Group Model Building Facilitation Handbook, www.transtria.com/hkhc). Overall, the evaluation was designed to assess policy, system, and environmental changes as a result of the community partnerships’ efforts to increase healthy eating and active living in order to reduce childhood obesity.
Central Valley, California: Background and Local Participation
The 240-mile long San Joaquin Valley is a major agricultural region encompassing eight counties in Central California (Kern, Kings, Tulare, Fresno, Madera, Merced, Stanislaus, and San Joaquin). However, residents, many of them migrant workers, are often unable to enjoy the abundance of food grown all around them, as Central Valley grows the bulk of the nation’s fruits and vegetables. People living here have among the lowest per capita income, highest rates of poverty, and lowest educational attainment in the state (see Table 1). All are factors contributing to pronounced rates of overweight and obesity, particularly among youth.
There are over 70 ethnicities represented in Central Valley and over 100 languages spoken. Outside of the City of Los Angeles, the region has the largest concentration of Latinos in the United States. However, there are distinct differences between the North and South Central Valleys. North Valley, close to Oakland and San Francisco, adopts culture and the leadership that is almost all African American women. Whereas, the South Valley leadership is mostly Hispanic women.
The Central California Regional Obesity Prevention Program (CCROPP), a program developed by the Central California Public Health Partnership, was the lead agency for Healthy Kids, Healthy Communities (HKHC) Central Valley project. CCROPP is facilitated by California State University, Fresno and brought together eight public health departments, community-based organizations, and community councils to build the capacity of community residents as advocates for change in improving local food and physical activity environments. Through funding from THE California Endowment, Robert Wood Johnson Foundation, and James Irvine Foundation, the coalition has strengthened the capacity of county public health departments to collaborate with communities to improve local environments for healthy eating and physical activity. It also has built a regional infrastructure to leverage resources, skills, communication, and policy efforts for other health improvement activities.
California’s Central Valley—HKHC Leading Site’s Priorities and Strategies
The partnership and capacity building strategies of California’s Central Valley—HKHC Leading Site included:
Powerful People: Building Leadership for Healthy Communities: The Project Director worked with
community partners and residents to design a leadership development training program and curriculum
with the goal of enabling those who have traditionally been marginalized to speak for themselves. The 12-
module community leadership curriculum provided training around the basic skills needed to help
residents become change agents. It is culturally, linguistically, and literacy-level appropriate for low-
income communities of color, and available in English and Spanish.
The healthy eating and active living strategies of California’s Central Valley—HKHC Leading Site included:
Active Transportation: Leaders advocated for Safe Routes To School in Stockton, Ceres, and Merced,
resulting in improved pedestrian and bicycling access around two schools. The partnership also
implemented a Walking School Bus and secured additional funding to improve pedestrian and bicycling
environments.
Parks and Play Spaces: HKHC partners improved safety and park amenities (e.g., installed lighting,
planted trees, repaired swings) in Bakersfield and increased secured joint use agreements in Fresno,
Fairmead, and Stockton between neighborhood schools and the community, for example.
Healthy Eating: Graduates of the Power People program established school farm stands in Fresno and
Ceres solidified Electronic Benefit Transfer (EBT) acceptance at a flea market in Merced, increased
access to fruits and vegetables at a corner store in Stockton, and started community gardens in Pixley
and Bakersfield.
For more information on the partnership, please refer to the Central Valley case report (www.transtria.com/
hkhc).
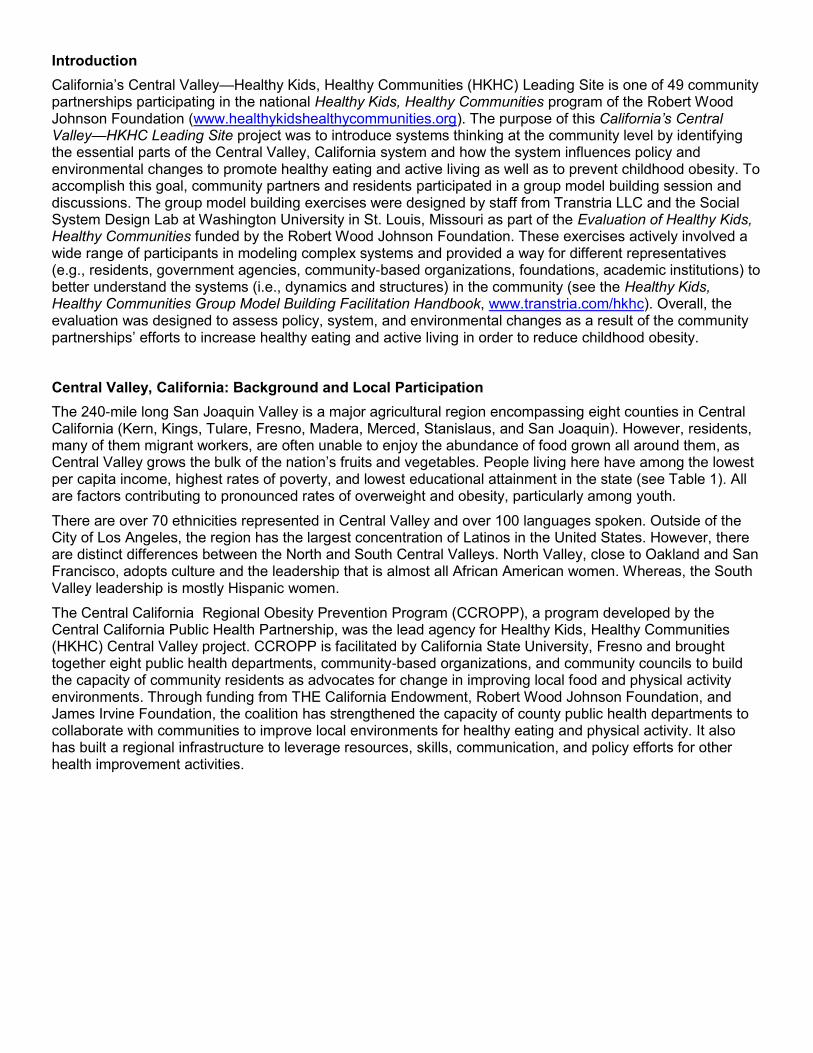
Figure 1: North Central Valley—HKHC Causal Loop Diagram
Systems Thinking in Communities: North Central Valley, California
“Systems thinking” represents a range of methods, tools, and approaches for observing the behaviors of a system (e.g., family, community, organization) and how these behaviors change over time; changes may occur in the past, present, or future. Figure 1 illustrates a system of policies, environments, local collaborations, and social determinants in North Central Valley, California that influence healthy eating, active living, and, ultimately, childhood obesity. This system and the dynamics within the system are complicated with many different elements interacting.
Models, such as Figure 1, provide a way to visualize all the elements of the system and their interactions, with a focus on causal relationships as opposed to associations. Through the model, specific types of causal relationships, or feedback loops, underlying the behavior of the dynamic system, can be identified to provide insights into what is working or not working in the system to support the intended outcomes (in this case, increases in healthy eating and active living, and decreases in childhood overweight and obesity). In system dynamics, the goal is to identify and understand the system feedback loops, or the cause-effect relationships that form a circuit where the effects “feed back” to influence the causes.
Group Model Building
Members of North Central Valley—HKHC partnership participated in a group model building session in November, 2011 and generated this system. also referred to as a causal loop diagram (Figure 1). Participants in the group model building session included residents and representatives from government agencies, community-based organizations, foundations, and academic institutions. The group model building session had two primary activities: 1) a Behavior Over Time Graph exercise; and 2) a Causal Loop Diagram (or structural elicitation) exercise.
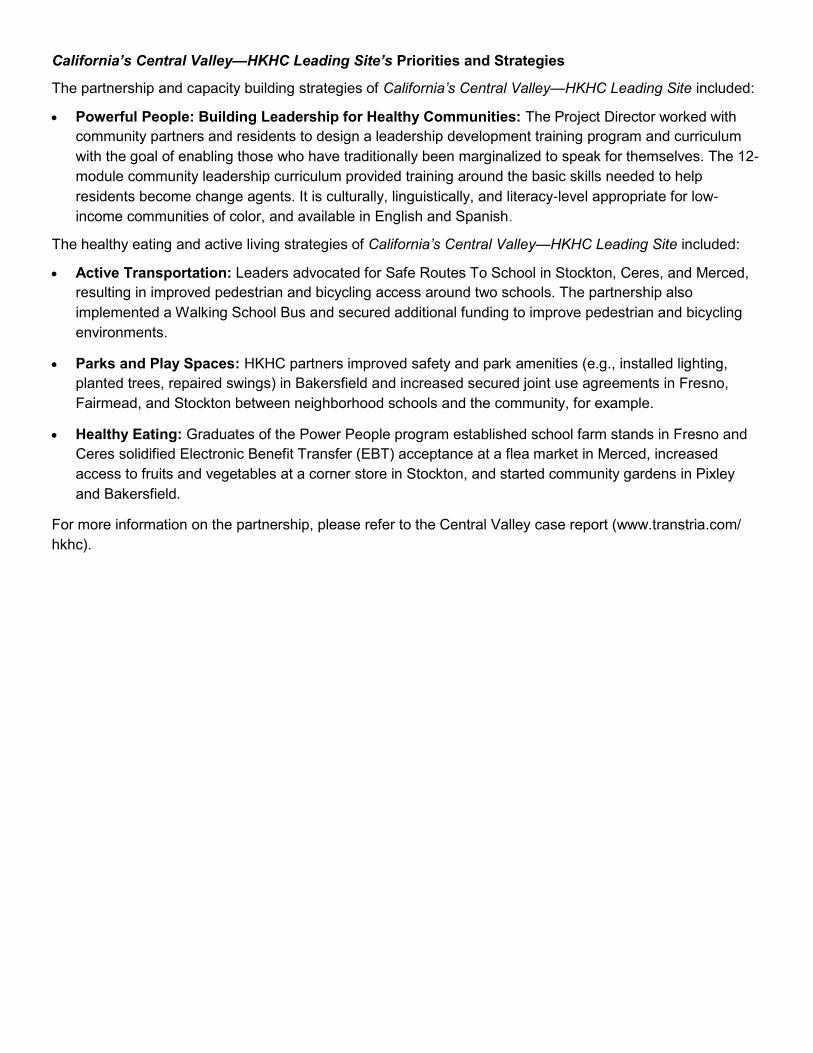
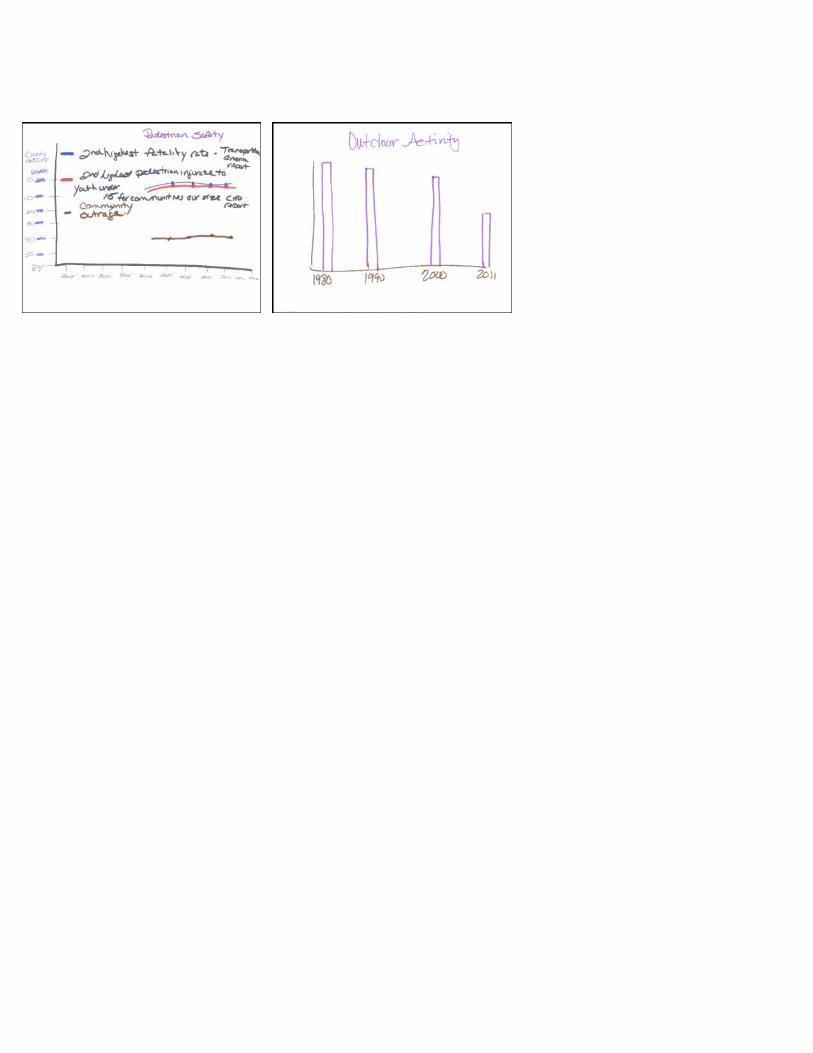
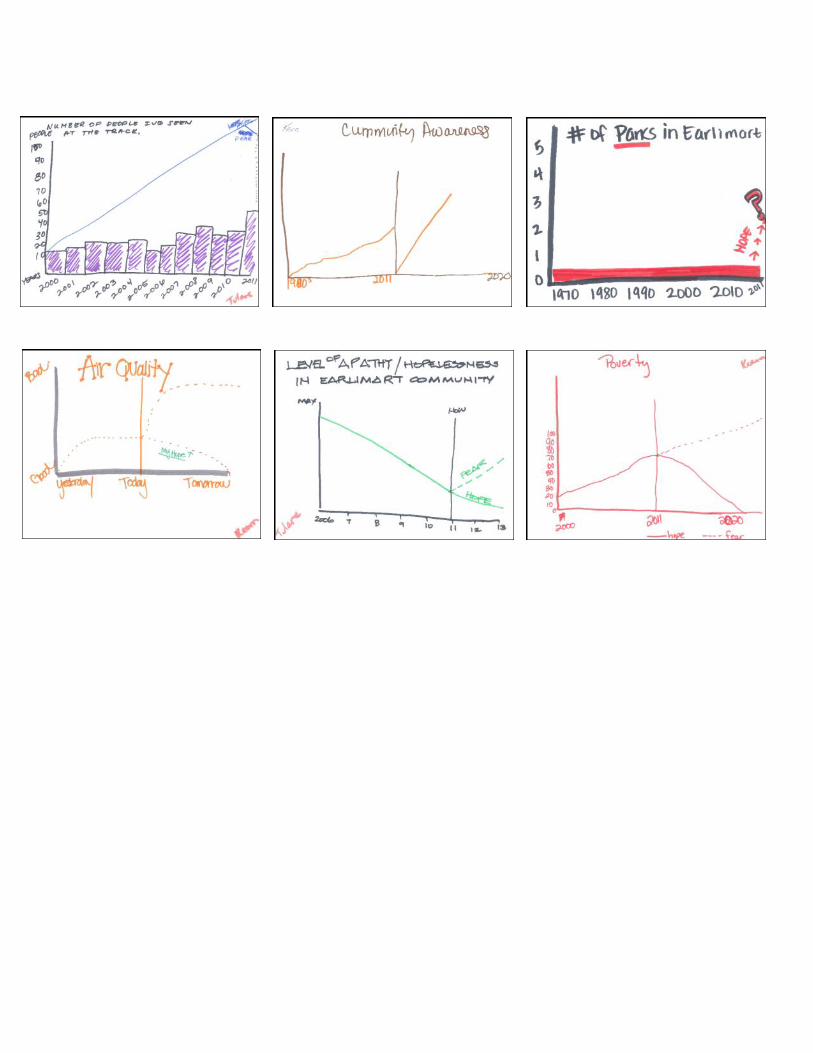
Behavior Over Time Graphs
To identify the range of things that affect or are affected by policy, system, and environmental changes in North Central Valley related to healthy eating, active living, and childhood obesity, participants designed graphs to name the influences and to illustrate how the influences have changed over time (past,
Crime/
violence
Communitysafety
Access to qualitychildcare
Traffic safety
Access toparks/ opengreen space
Dailyphysicalactivity
Access to schoolrecreation facilities
Migrantcamps
People leavingcommunity
Employment(living wages)
Poverty
Housingquality
Volunteertime
Communityrepresentation
(e.g., city council,county govt)
Civic engagement(marginalizedpopulations)
Communityinvestment(funding,
resources)
Number ofyouth/ peopleincarcerated
Communityleadership
Parentengagement
Parentknowledge
Unhealthy schoolfoods & beverages
Parental influenceon school policy
Health/ qualityof life
Sugar sweetenedbeverage
consumption
Decision-makerengagement w/
marginalizedpopulations
Sociallyresponsible
policies
Time invested in advocacy& policy change
(marginalized populations)Equitable access
to resources
Waterquality
Number of peoplew/o citizenship
Educationalattainment
Access tohealthyfoods
Cost ofdrinking water
-
+
-
+
+
+
-
-
+
+
+
-
+
+
+
+
+
-
+
+
-
+
++
-
+
-
-
+
++
+
Screentime
-
Recreationactivities (outdoor)
+
++
-
Healthyeating
Childhoodobesity
-- +
+
-
Walk/ bike toschool
+
Disparities in injuries/fatalities (marginalized
populations)-
+
Hopelessness
-
-
Organizedsports &
recreationfees
-
+
+
+
+
+
++
-
Quality of thebuilt
environment
+
+
+
-
+
-
+
-
+
+
-
+
-
-
+
-
+
+
-
+
+
<Housingquality>
+<Daily physical
activity>+
<Poverty>
-
-
<Sociallyresponsible
policies>
+
+
<Sociallyresponsible
policies>
+
+
<Number of peoplew/o citizenship>
-
-
<Poverty>
--
<Access toquality
childcare>
+
<Poverty> -
-
+
+
<Communityinvestment (funding,
resources)>
+
<Number of youth/people incarcerated>
-
+
<Time invested inadvocacy & policy
change (marginalizedpopulations)>
++
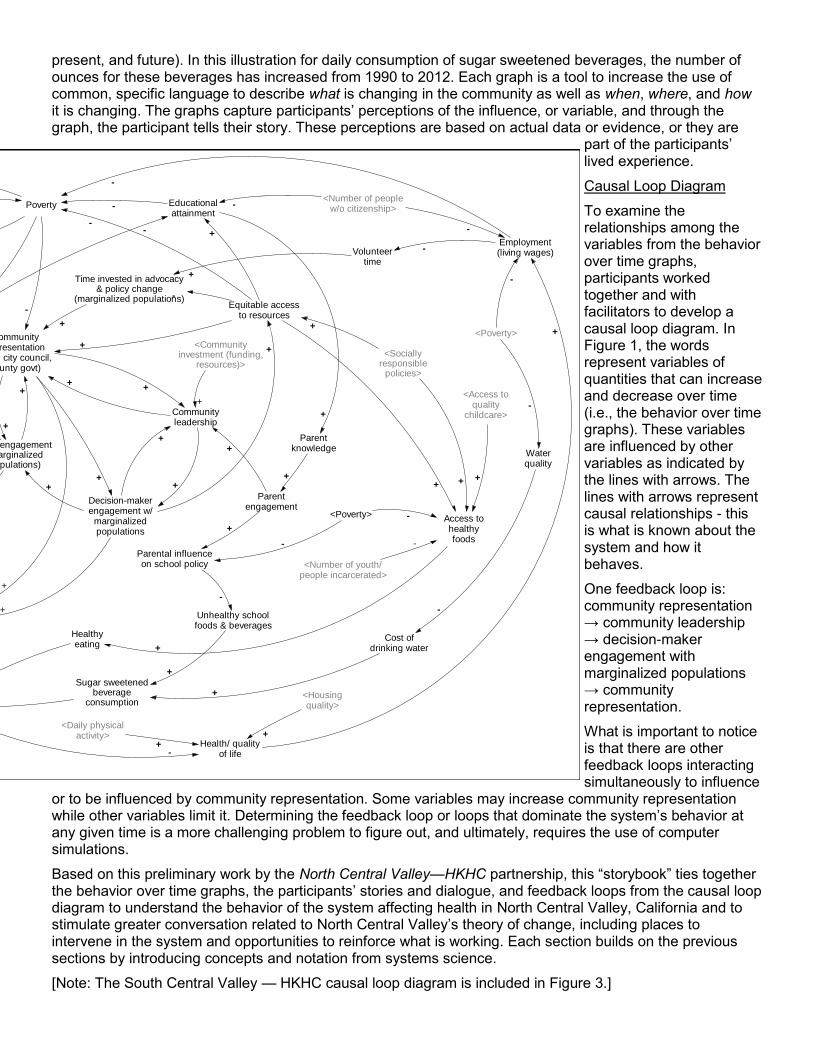
Figure 1: North Central Valley—HKHC Causal Loop Diagram
present, and future). In this illustration for daily consumption of sugar sweetened beverages, the number of ounces for these beverages has increased from 1990 to 2012. Each graph is a tool to increase the use of common, specific language to describe what is changing in the community as well as when, where, and how it is changing. The graphs capture participants’ perceptions of the influence, or variable, and through the graph, the participant tells their story. These perceptions are based on actual data or evidence, or they are
part of the participants’ lived experience.
Causal Loop Diagram
To examine the relationships among the variables from the behavior over time graphs, participants worked together and with facilitators to develop a causal loop diagram. In Figure 1, the words represent variables of quantities that can increase and decrease over time (i.e., the behavior over time graphs). These variables are influenced by other variables as indicated by the lines with arrows. The lines with arrows represent causal relationships - this is what is known about the system and how it behaves.
One feedback loop is: community representation → community leadership → decision-maker engagement with marginalized populations → community representation.
What is important to notice is that there are other feedback loops interacting simultaneously to influence
or to be influenced by community representation. Some variables may increase community representation while other variables limit it. Determining the feedback loop or loops that dominate the system’s behavior at any given time is a more challenging problem to figure out, and ultimately, requires the use of computer simulations.
Based on this preliminary work by the North Central Valley—HKHC partnership, this “storybook” ties together the behavior over time graphs, the participants’ stories and dialogue, and feedback loops from the causal loop diagram to understand the behavior of the system affecting health in North Central Valley, California and to stimulate greater conversation related to North Central Valley’s theory of change, including places to intervene in the system and opportunities to reinforce what is working. Each section builds on the previous sections by introducing concepts and notation from systems science.
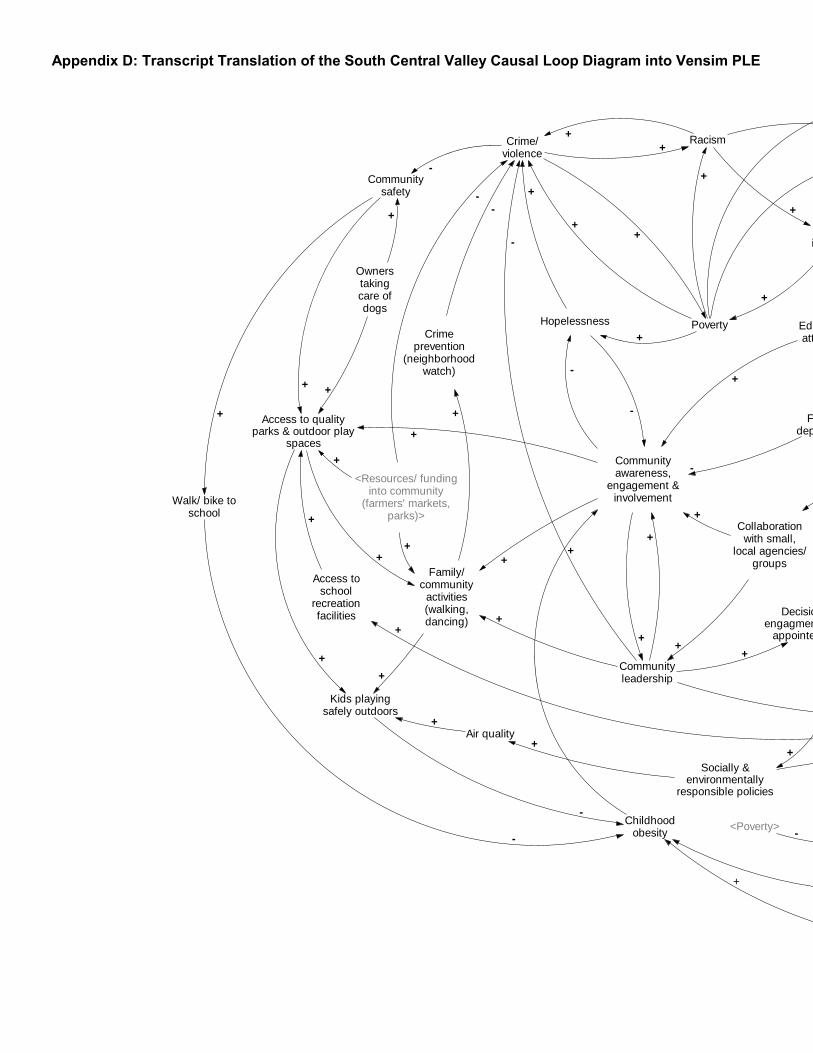
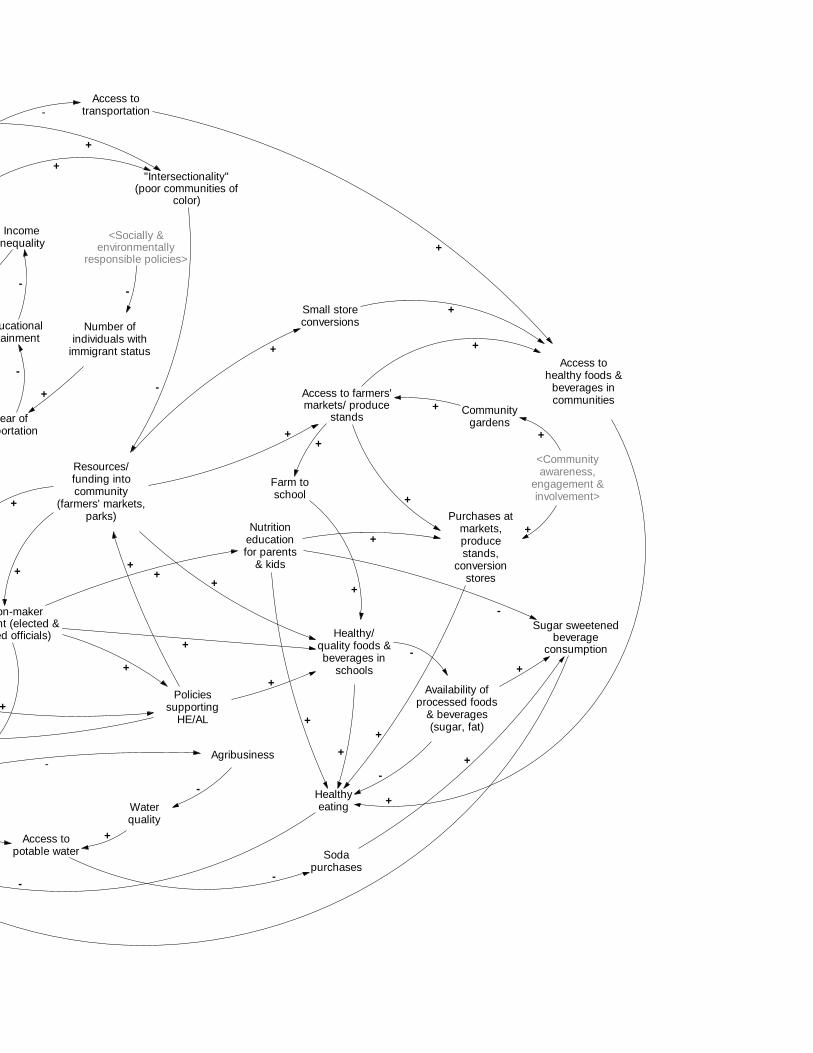
[Note: The South Central Valley — HKHC causal loop diagram is included in Figure 3.]
Crime/
violence
Communitysafety
Access to qualitychildcare
Traffic safety
Access toparks/ opengreen space
Dailyphysicalactivity
Access to schoolrecreation facilities
Migrantcamps
People leavingcommunity
Employment(living wages)
Poverty
Housingquality
Volunteertime
Communityrepresentation
(e.g., city council,county govt)
Civic engagement(marginalizedpopulations)
Communityinvestment(funding,
resources)
Number ofyouth/ peopleincarcerated
Communityleadership
Parentengagement
Parentknowledge
Unhealthy schoolfoods & beverages
Parental influenceon school policy
Health/ qualityof life
Sugar sweetenedbeverage
consumption
Decision-makerengagement w/
marginalizedpopulations
Sociallyresponsible
policies
Time invested in advocacy& policy change
(marginalized populations)Equitable access
to resources
Waterquality
Number of peoplew/o citizenship
Educationalattainment
Access tohealthyfoods
Cost ofdrinking water
-
+
-
+
+
+
-
-
+
+
+
-
+
+
+
+
+
-
+
+
-
+
++
-
+
-
-
+
++
+
Screentime
-
Recreationactivities (outdoor)
+
++
-
Healthyeating
Childhoodobesity
-- +
+
-
Walk/ bike toschool
+
Disparities in injuries/fatalities (marginalized
populations)-
+
Hopelessness
-
-
Organizedsports &
recreationfees
-
+
+
+
+
+
++
-
Quality of thebuilt
environment
+
+
+
-
+
-
+
-
+
+
-
+
-
-
+
-
+
+
-
+
+
<Housingquality>
+<Daily physical
activity>+
<Poverty>
-
-
<Sociallyresponsible
policies>
+
+
<Sociallyresponsible
policies>
+
+
<Number of peoplew/o citizenship>
-
-
<Poverty>
--
<Access toquality
childcare>
+
<Poverty> -
-
+
+
<Communityinvestment (funding,
resources)>
+
<Number of youth/people incarcerated>
-
+
<Time invested inadvocacy & policy
change (marginalizedpopulations)>
++

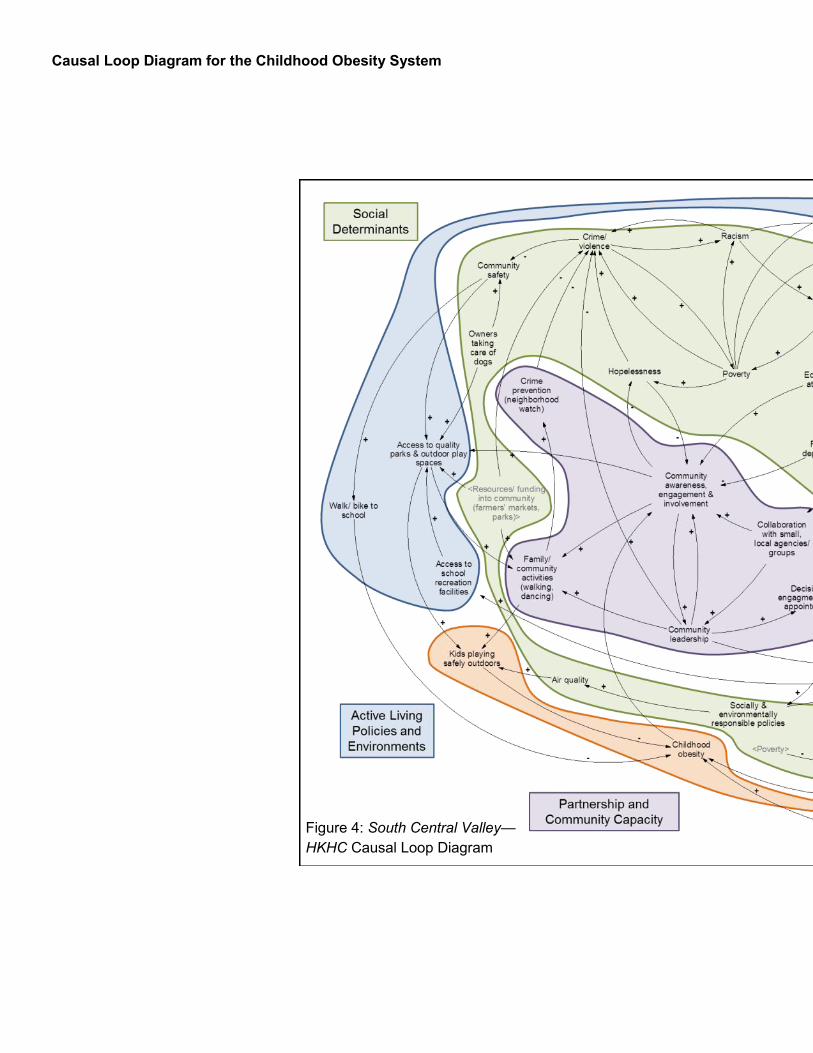
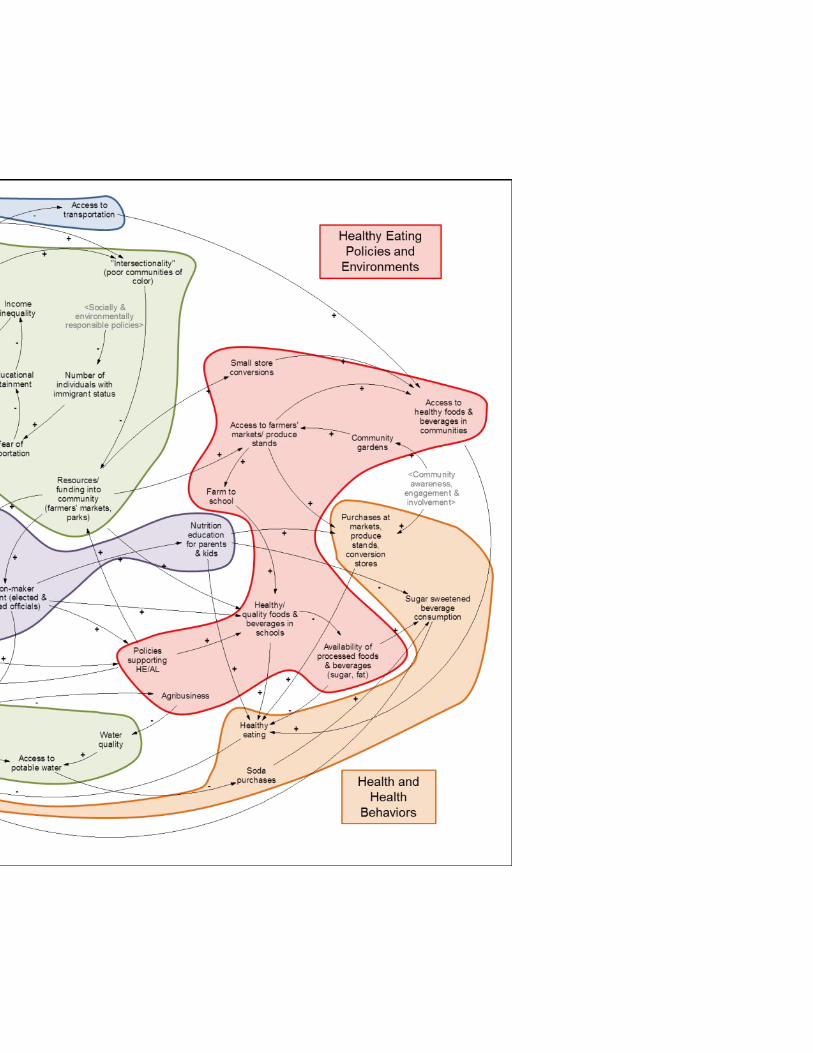
Causal Loop Diagram for the Childhood Obesity System
The causal loop diagram (CLD) represents a holistic system and several subsystems interacting in North Central Valley, California. In order to digest the depth and complexity of the diagram, it is helpful to examine the CLD in terms of the subsystems of influence. Because of this project’s focus on healthy eating, active living, and childhood obesity, this system draws attention to a number of corresponding subsystems, including: healthy eating policies and environments (red), active living policies and environments (blue), health and health behaviors (orange), partnership and community capacity (purple), and social determinants (green).
From the group model building exercises, several variables and causal relationships illustrated in Figure 2 were identified within and across subsystems. This section describes the subsystems in the CLD.
Healthy Eating Policies and Environments (Red)
The healthy eating policy and environmental subsystem includes food production, food distribution and procurement, and food retail. During the behavior over time graphs exercise, the participants generated 4 graphs related to policy or environmental strategies (e.g., unhealthy school foods and beverages) or contexts (e.g., cost of drinking water) that affected or were affected by the work of North Central Valley—HKHC. The variables represent participants’ conversations from the behavior over time graph and causal loop diagram exercises.
Active Living Policies and Environments (Blue)
The active living policy and environmental subsystem includes design, planning, construction, and enforcement or maintenance related to access to opportunities for active transportation and recreation. For this topic, the group model building participants developed 4 graphs related to policy or environmental strategies (e.g., access to school recreation facilities) or contexts (e.g., quality of the built environment) that affected or were affected by the partnership’s work.
Health and Health Behaviors (Orange)
The subsystem for health and health behaviors includes health outcomes (e.g., obesity), health behaviors (e.g., healthy eating, physical activity), and behavioral proxies or context-specific behaviors (e.g., walk/bike to school, sugar sweetened beverage consumption).
Figure 2: Subsystems in the North Central Valley, California Causal Loop Diagram
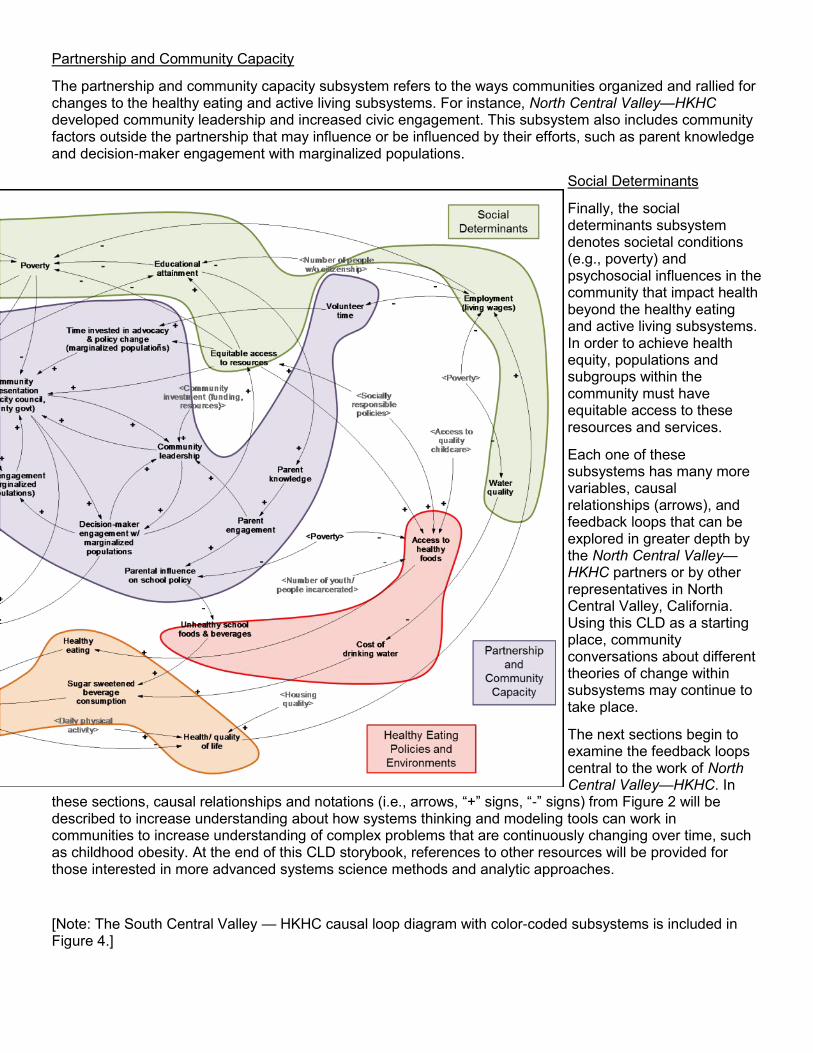
Partnership and Community Capacity
The partnership and community capacity subsystem refers to the ways communities organized and rallied for changes to the healthy eating and active living subsystems. For instance, North Central Valley—HKHC developed community leadership and increased civic engagement. This subsystem also includes community factors outside the partnership that may influence or be influenced by their efforts, such as parent knowledge and decision-maker engagement with marginalized populations.
Social Determinants
Finally, the social determinants subsystem denotes societal conditions (e.g., poverty) and psychosocial influences in the community that impact health beyond the healthy eating and active living subsystems. In order to achieve health equity, populations and subgroups within the community must have equitable access to these resources and services.
Each one of these subsystems has many more variables, causal relationships (arrows), and feedback loops that can be explored in greater depth by the North Central Valley—HKHC partners or by other representatives in North Central Valley, California. Using this CLD as a starting place, community conversations about different theories of change within subsystems may continue to take place.
The next sections begin to examine the feedback loops central to the work of North Central Valley—HKHC. In
these sections, causal relationships and notations (i.e., arrows, “+” signs, “-” signs) from Figure 2 will be described to increase understanding about how systems thinking and modeling tools can work in communities to increase understanding of complex problems that are continuously changing over time, such as childhood obesity. At the end of this CLD storybook, references to other resources will be provided for those interested in more advanced systems science methods and analytic approaches.
[Note: The South Central Valley — HKHC causal loop diagram with color-coded subsystems is included in Figure 4.]
Figure 2: Subsystems in the North Central Valley, California Causal Loop Diagram
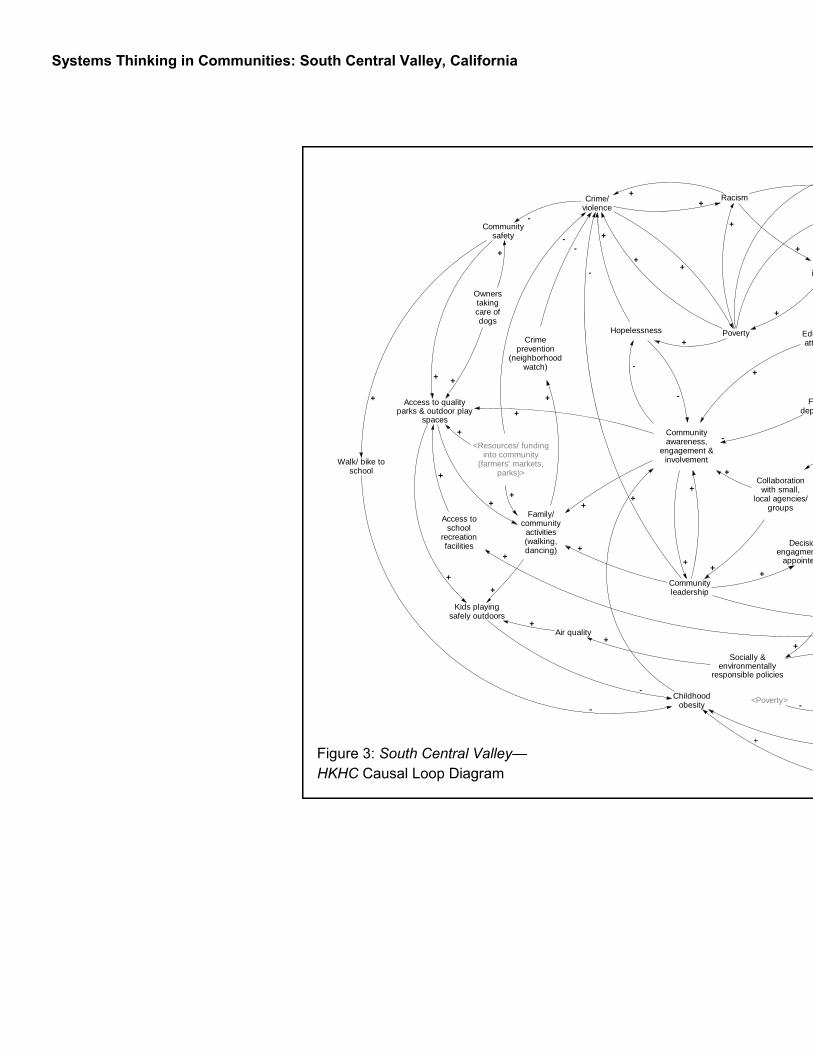
Systems Thinking in Communities: South Central Valley, California
Crime/violence
Communitysafety
Access to qualityparks & outdoor play
spaces
Ownerstakingcare ofdogs
Kids playingsafely outdoors
Crimeprevention
(neighborhoodwatch)
-
+
+
+
+-
Resources/funding intocommunity
(farmers' markets,parks)
"Intersectionality"(poor communities of
color)
-
Healthy/quality foods &beverages in
schoolsCommunityleadership
Decision-makerengagment (elected &
appointed officials)
Racism
Family/community
activities(walking,dancing)
Incomeinequality
Poverty
Socially &environmentally
responsible policies
Communityawareness,
engagement &involvement
Number ofindividuals with
immigrant status
Fear ofdeportation
Educationalattainment
+
+
+
+
+
+
+
+
+
+
-
++
++
+
-
-
-
+
Hopelessness
Access topotable water
Agribusiness
Waterquality
Policiessupporting
HE/AL
Sodapurchases
Sugar sweetenedbeverage
consumption
Availability ofprocessed foods
& beverages(sugar, fat)
Nutritioneducationfor parents
& kids
Healthyeating
Communitygardens
Purchases atmarkets,producestands,
conversionstores
Access to farmers'markets/ produce
stands
+
-
-
+
+
-
+
+
+
+
+
-
+
+
+
+
+
+
+
Access totransportation
Access tohealthy foods &
beverages incommunities
+
+
Farm toschool
+
+
Collaborationwith small,
local agencies/groups
++
Childhoodobesity
-
+
+
-
+
Access toschool
recreationfacilities
+
Air quality+
+
+
+
Walk/ bike toschool
+
-
+
-
-
Small storeconversions
+
+
+
-
+
++
+
+
<Resources/ fundinginto community
(farmers' markets,parks)>
+
+
-
<Communityawareness,
engagement &involvement>
+
+
<Poverty>-
<Socially &environmentally
responsible policies>
-
+
+
+
-
-
Figure 3: South Central Valley—
HKHC Causal Loop Diagram
Crime/violence
Communitysafety
Access to qualityparks & outdoor play
spaces
Ownerstakingcare ofdogs
Kids playingsafely outdoors
Crimeprevention
(neighborhoodwatch)
-
+
+
+
+-
Resources/funding intocommunity
(farmers' markets,parks)
"Intersectionality"(poor communities of
color)
-
Healthy/quality foods &beverages in
schoolsCommunityleadership
Decision-makerengagment (elected &
appointed officials)
Racism
Family/community
activities(walking,dancing)
Incomeinequality
Poverty
Socially &environmentally
responsible policies
Communityawareness,
engagement &involvement
Number ofindividuals with
immigrant status
Fear ofdeportation
Educationalattainment
+
+
+
+
+
+
+
+
+
+
-
++
++
+
-
-
-
+
Hopelessness
Access topotable water
Agribusiness
Waterquality
Policiessupporting
HE/AL
Sodapurchases
Sugar sweetenedbeverage
consumption
Availability ofprocessed foods
& beverages(sugar, fat)
Nutritioneducationfor parents
& kids
Healthyeating
Communitygardens
Purchases atmarkets,producestands,
conversionstores
Access to farmers'markets/ produce
stands
+
-
-
+
+
-
+
+
+
+
+
-
+
+
+
+
+
+
+
Access totransportation
Access tohealthy foods &
beverages incommunities
+
+
Farm toschool
+
+
Collaborationwith small,
local agencies/groups
++
Childhoodobesity
-
+
+
-
+
Access toschool
recreationfacilities
+
Air quality+
+
+
+
Walk/ bike toschool
+
-
+
-
-
Small storeconversions
+
+
+
-
+
++
+
+
<Resources/ fundinginto community
(farmers' markets,parks)>
+
+
-
<Communityawareness,
engagement &involvement>
+
+
<Poverty>-
<Socially &environmentally
responsible policies>
-
+
+
+
-
-
Causal Loop Diagram for the Childhood Obesity System
Figure 4: South Central Valley—
HKHC Causal Loop Diagram
Community awareness,engagement &
involvement
Healthy eating
Communitygardens
Purchases at markets,produce stands,conversion stores
Access to farmers'markets/ produce
stands+
+
+
Childhoodobesity
-
+
+
B1 -Community
Gardens
Crime/violenceCommunity
safety
-
Hopelessness
+
Walk/ biketo school
+
-
-
B3 - SafeRoutes to
School
Healthy/ quality foods& beverages in schools
Sugar sweetenedbeverage
consumption
Availability of processedfoods & beverages
(sugar, fat)
+
-
Farm toschool
+
+
+
B5 -Farm toSchool
Resources/ funding intocommunity (farmers'
markets, parks)
Communityleadership Decision-maker
engagment (elected &appointed officials)
+
+
Policiessupporting HE/AL
Access to healthy foods& beverages incommunities
+
+
++
+
B6 -Farmers'Markets /ProduceStands
Communityrepresentation (e.g., city
council, county govt)
R1 -CommunityLeadershipProgram+
+
+
Daily physicalactivity
Access to schoolrecreation facilities
Civic engagement(marginalizedpopulations)
+
Screen time
-
Recreationactivities (outdoor)
-
+
-
+
B2 - JointUse
Agreements
Access to parks/open green space
Sociallyresponsible policies
Quality of thebuilt environment+ +
+
+
+
B4 -Parks &
PlaySpaces
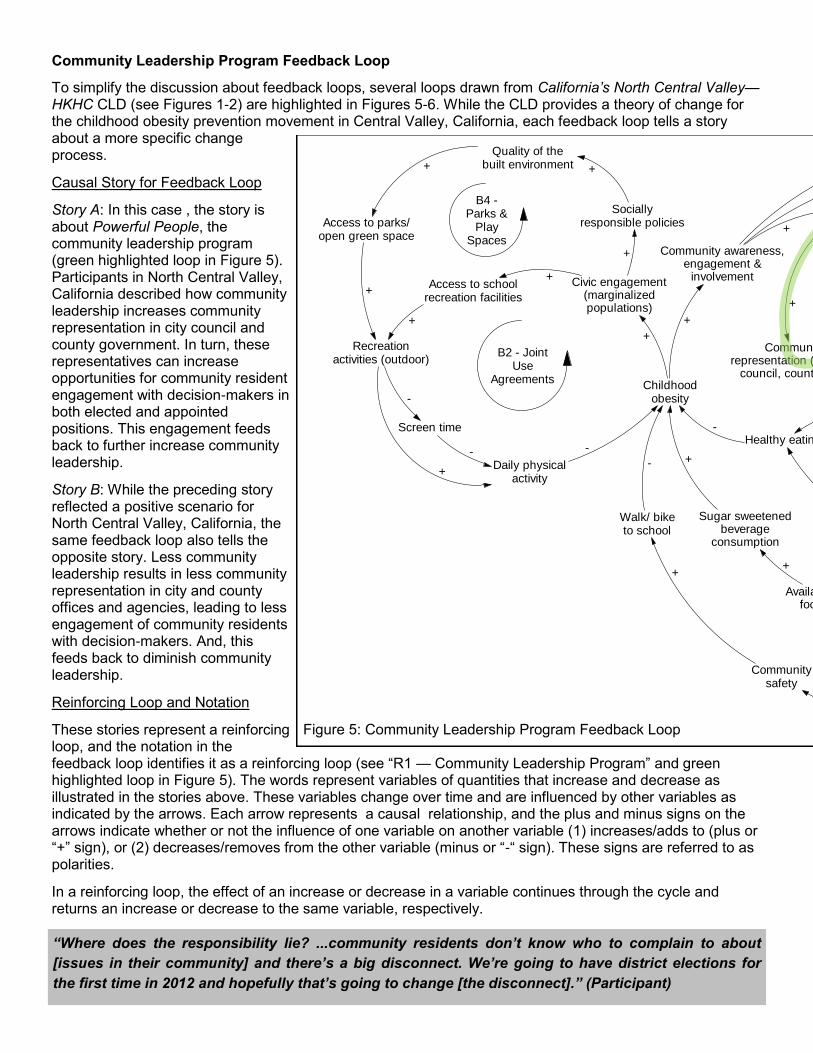
Community Leadership Program Feedback Loop
To simplify the discussion about feedback loops, several loops drawn from California’s North Central Valley—HKHC CLD (see Figures 1-2) are highlighted in Figures 5-6. While the CLD provides a theory of change for the childhood obesity prevention movement in Central Valley, California, each feedback loop tells a story about a more specific change process.
Causal Story for Feedback Loop
Story A: In this case , the story is about Powerful People, the community leadership program (green highlighted loop in Figure 5). Participants in North Central Valley, California described how community leadership increases community representation in city council and county government. In turn, these representatives can increase opportunities for community resident engagement with decision-makers in both elected and appointed positions. This engagement feeds back to further increase community leadership.
Story B: While the preceding story reflected a positive scenario for North Central Valley, California, the same feedback loop also tells the opposite story. Less community leadership results in less community representation in city and county offices and agencies, leading to less engagement of community residents with decision-makers. And, this feeds back to diminish community leadership.
Reinforcing Loop and Notation
These stories represent a reinforcing loop, and the notation in the feedback loop identifies it as a reinforcing loop (see “R1 — Community Leadership Program” and green highlighted loop in Figure 5). The words represent variables of quantities that increase and decrease as illustrated in the stories above. These variables change over time and are influenced by other variables as indicated by the arrows. Each arrow represents a causal relationship, and the plus and minus signs on the arrows indicate whether or not the influence of one variable on another variable (1) increases/adds to (plus or “+” sign), or (2) decreases/removes from the other variable (minus or “-“ sign). These signs are referred to as polarities.
In a reinforcing loop, the effect of an increase or decrease in a variable continues through the cycle and returns an increase or decrease to the same variable, respectively.
Figure 5: Community Leadership Program Feedback Loop
“Where does the responsibility lie? ...community residents don’t know who to complain to about
[issues in their community] and there’s a big disconnect. We’re going to have district elections for
the first time in 2012 and hopefully that’s going to change [the disconnect].” (Participant)

Community awareness,engagement &
involvement
Healthy eating
Communitygardens
Purchases at markets,produce stands,conversion stores
Access to farmers'markets/ produce
stands+
+
+
Childhoodobesity
-
+
+
B1 -Community
Gardens
Crime/violenceCommunity
safety
-
Hopelessness
+
Walk/ biketo school
+
-
-
B3 - SafeRoutes to
School
Healthy/ quality foods& beverages in schools
Sugar sweetenedbeverage
consumption
Availability of processedfoods & beverages
(sugar, fat)
+
-
Farm toschool
+
+
+
B5 -Farm toSchool
Resources/ funding intocommunity (farmers'
markets, parks)
Communityleadership Decision-maker
engagment (elected &appointed officials)
+
+
Policiessupporting HE/AL
Access to healthy foods& beverages incommunities
+
+
++
+
B6 -Farmers'Markets /ProduceStands
Communityrepresentation (e.g., city
council, county govt)
R1 -CommunityLeadershipProgram+
+
+
Daily physicalactivity
Access to schoolrecreation facilities
Civic engagement(marginalizedpopulations)
+
Screen time
-
Recreationactivities (outdoor)
-
+
-
+
B2 - JointUse
Agreements
Access to parks/open green space
Sociallyresponsible policies
Quality of thebuilt environment+ +
+
+
+
B4 -Parks &
PlaySpaces
Looking specifically at the “+” or “-” notation, a feedback loop that has zero or an even number of “-” signs, or polarities, is considered a reinforcing loop. Balancing loops, with an odd number of “-” signs in the loop, are another type of feedback loop.
In isolation, this reinforcing loop represents a virtuous cycle in Story A as these assets positively support one another, or a vicious cycle in Story B as these challenges perpetuate a downward spiral. Yet, the increase in community leadership likely levels off at some point when the city council and county government have sufficient representation from community residents. To understand what causes community leadership to increase or decrease, it may be helpful for the partners in North Central Valley, California to consider other variables that influence or are influenced by community leadership. In addition, it is important to remember that this reinforcing loop is only one part of the larger CLD (see Figures 1 and 3), and the other loops and causal relationships can have an impact on the variables in this loop.
System Insights for California’s Central Valley—HKHC Sites Participants identified insufficient representation of community residents on city council in North Central Valley, California (see behavior over time graph).
From the systems thinking exercises, several insights can inform the community leadership program, including the benefits of having community residents engaging with local decision-makers (e.g., forums, events).
In addition to these insights, systems thinking can also help to
pose key questions for assessment and evaluation, including
assessment of various forms of community leadership and
evaluation of leaders’ respective influence on
representativeness in local offices and agencies (e.g., school
board, neighborhood association, city council) as well as
opportunities to engage with other local elected and appointed
officials.
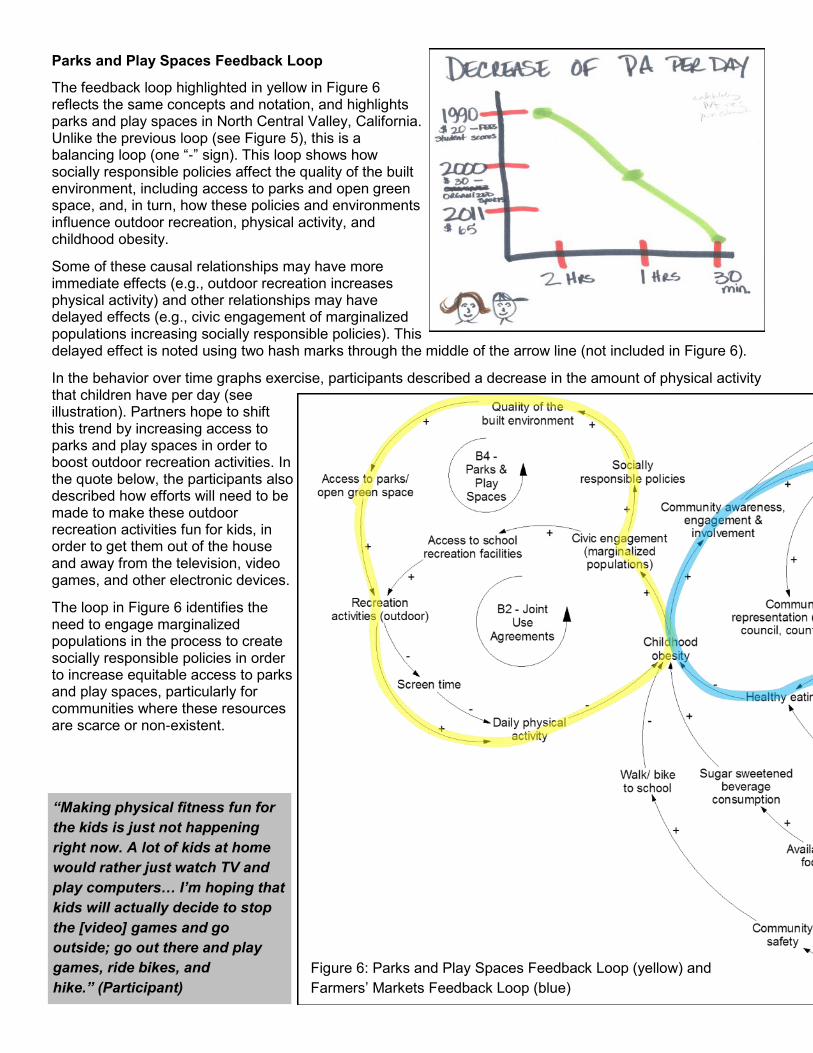
Parks and Play Spaces Feedback Loop
The feedback loop highlighted in yellow in Figure 6 reflects the same concepts and notation, and highlights parks and play spaces in North Central Valley, California. Unlike the previous loop (see Figure 5), this is a balancing loop (one “-” sign). This loop shows how socially responsible policies affect the quality of the built environment, including access to parks and open green space, and, in turn, how these policies and environments influence outdoor recreation, physical activity, and childhood obesity.
Some of these causal relationships may have more immediate effects (e.g., outdoor recreation increases physical activity) and other relationships may have delayed effects (e.g., civic engagement of marginalized populations increasing socially responsible policies). This delayed effect is noted using two hash marks through the middle of the arrow line (not included in Figure 6).
In the behavior over time graphs exercise, participants described a decrease in the amount of physical activity that children have per day (see illustration). Partners hope to shift this trend by increasing access to parks and play spaces in order to boost outdoor recreation activities. In the quote below, the participants also described how efforts will need to be made to make these outdoor recreation activities fun for kids, in order to get them out of the house and away from the television, video games, and other electronic devices.
The loop in Figure 6 identifies the need to engage marginalized populations in the process to create socially responsible policies in order to increase equitable access to parks and play spaces, particularly for communities where these resources are scarce or non-existent.
“Making physical fitness fun for
the kids is just not happening
right now. A lot of kids at home
would rather just watch TV and
play computers… I’m hoping that
kids will actually decide to stop
the [video] games and go
outside; go out there and play
games, ride bikes, and
hike.” (Participant)
Figure 6: Parks and Play Spaces Feedback Loop (yellow) and
Farmers’ Markets Feedback Loop (blue)
“Farmers’ markets, school farm
stands, and small store
conversions actually take
intense and sustained
engagement for them to: 1) get
the number of consumers that
makes the outlet viable to be
sustained; and, 2) the working
relationship with the farmers’
market manager, school farm
stand and local farmers. And so,
if there isn’t this profit, they
deplete — they’re not viable to
continue.” (Participant)
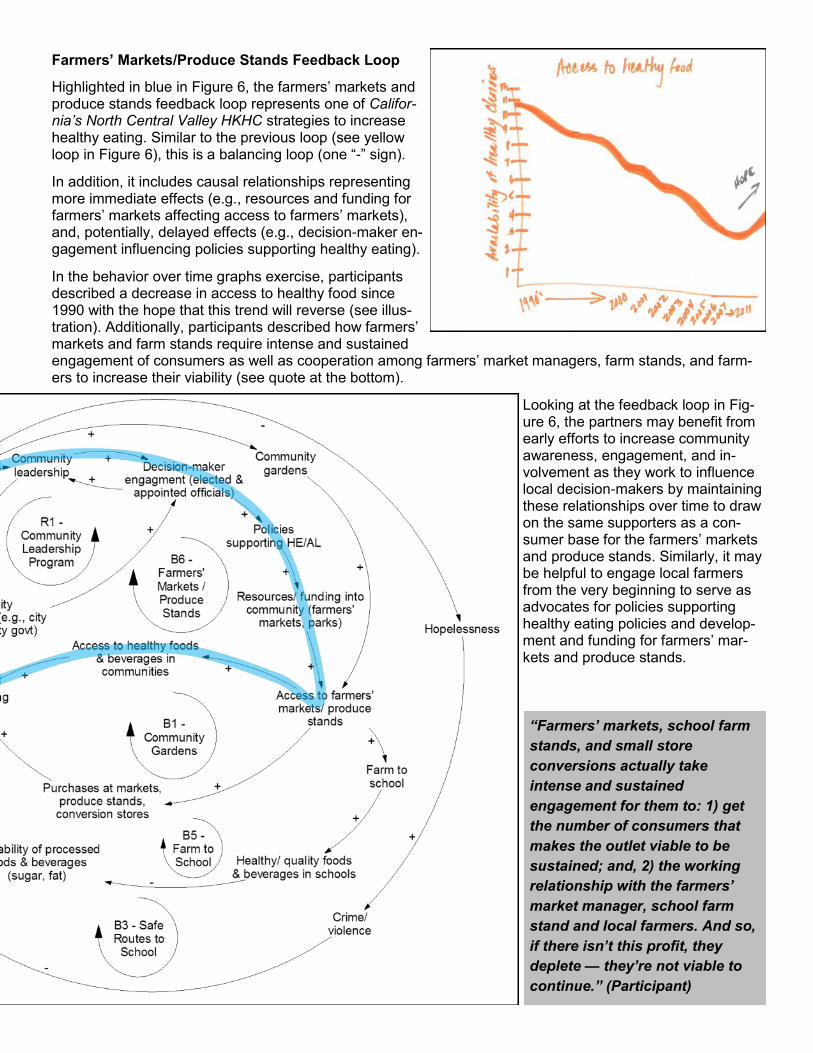
Farmers’ Markets/Produce Stands Feedback Loop
Highlighted in blue in Figure 6, the farmers’ markets and produce stands feedback loop represents one of Califor-nia’s North Central Valley HKHC strategies to increase healthy eating. Similar to the previous loop (see yellow loop in Figure 6), this is a balancing loop (one “-” sign).
In addition, it includes causal relationships representing more immediate effects (e.g., resources and funding for farmers’ markets affecting access to farmers’ markets), and, potentially, delayed effects (e.g., decision-maker en-gagement influencing policies supporting healthy eating).
In the behavior over time graphs exercise, participants described a decrease in access to healthy food since 1990 with the hope that this trend will reverse (see illus-tration). Additionally, participants described how farmers’ markets and farm stands require intense and sustained engagement of consumers as well as cooperation among farmers’ market managers, farm stands, and farm-ers to increase their viability (see quote at the bottom).
Looking at the feedback loop in Fig-ure 6, the partners may benefit from early efforts to increase community awareness, engagement, and in-volvement as they work to influence local decision-makers by maintaining these relationships over time to draw on the same supporters as a con-sumer base for the farmers’ markets and produce stands. Similarly, it may be helpful to engage local farmers from the very beginning to serve as advocates for policies supporting healthy eating policies and develop-ment and funding for farmers’ mar-kets and produce stands.

Opportunities for Systems Thinking in Central Valley, California
This storybook provided an introduction to some basic concepts and methods for systems thinking at the community level, including: causal loop diagrams, variables, causal relationships and polarities, reinforcing feedback loops, and balancing feedback loops, among others. For California’s Central Valley HKHC partners, this storybook also summarized the healthy eating, active living, partnership and community capacity, social determinants, and health and health behaviors subsystems in the North and South Central Valley causal loop diagrams as well as three specific feedback loops corresponding to the partnership’s primary strategies.
This causal loop diagram reflects a series of conversations among partners and residents from 2011 to 2013. Some discussions probed more deeply into different variables through the behavior over time graphs exercise, or causal relationships through the causal loop diagram exercise.
This represented a first attempt to collectively examine the range of things that affect or are affected by policy, system, and environmental changes in North and South Central Valley, California to promote healthy eating and active living as well as preventing childhood overweight and obesity.
Yet, there are several limitations to this storybook, including:
the participants represent a sample of the California’s Central Valley HKHC partners (organizations and residents) as opposed to a representative snapshot of government agencies, community organizations, businesses, and community residents;
the behavior over time graphs and the causal loop diagram represent perceptions of the participants in these exercises (similar to a survey or an interview representing perceptions of the respondents);
the exercises and associated dialogue took place in brief one- to two-hour sessions, compromising the group’s capacity to spend too much time on any one variable, relationship, or feedback loop; and
the responses represent a moment in time so the underlying structure of the diagram and the types of feedback represented may reflect “hot button” issues of the time.
Much work is yet to be done to ensure that this causal loop diagram is accurate and comprehensive, for
Figure 7: California’s North Central Valley HKHC Causal Loop Diagram
Crime/violence
Communitysafety
Access to qualitychildcare
Traffic safety
Access toparks/ opengreen space
Dailyphysicalactivity
Access to schoolrecreation facilities
Migrantcamps
People leavingcommunity
Employment(living wages)
Poverty
Housingquality
Volunteertime
Communityrepresentation
(e.g., city council,county govt)
Civic engagement(marginalizedpopulations)
Communityinvestment(funding,
resources)
Number ofyouth/ peopleincarcerated
Communityleadership
Parentengagement
Parentknowledge
Unhealthy schoolfoods & beverages
Parental influenceon school policy
Health/ qualityof life
Sugar sweetenedbeverage
consumption
Decision-makerengagement w/
marginalizedpopulations
Sociallyresponsible
policies
Time invested in advocacy& policy change
(marginalized populations)Equitable access
to resources
Waterquality
Number of peoplew/o citizenship
Educationalattainment
Access tohealthyfoods
Cost ofdrinking water
-
+
-
+
+
+
-
-
+
+
+
-
+
+
+
+
+
-
+
+
-
+
++
-
+
-
-
+
++
+
Screentime
-
Recreationactivities (outdoor)
+
++
-
Healthyeating
Childhoodobesity
-- +
+
-
Walk/ bike toschool
+
Disparities in injuries/fatalities (marginalized
populations)-
+
Hopelessness
-
-
Organizedsports &
recreationfees
-
+
+
+
+
+
++
-
Quality of thebuilt
environment
+
+
+
-
+
-
+
-
+
+
-
+
-
-
+
-
+
+
-
+
+
<Housingquality>
+<Daily physical
activity>+
<Poverty>
-
-
<Sociallyresponsible
policies>
+
+
<Sociallyresponsible
policies>
+
+
<Number of peoplew/o citizenship>
-
-
<Poverty>
--
<Access toquality
childcare>
+
<Poverty> -
-
+
+
<Communityinvestment (funding,
resources)>
+
<Number of youth/people incarcerated>
-
+
<Time invested inadvocacy & policy
change (marginalizedpopulations)>
++
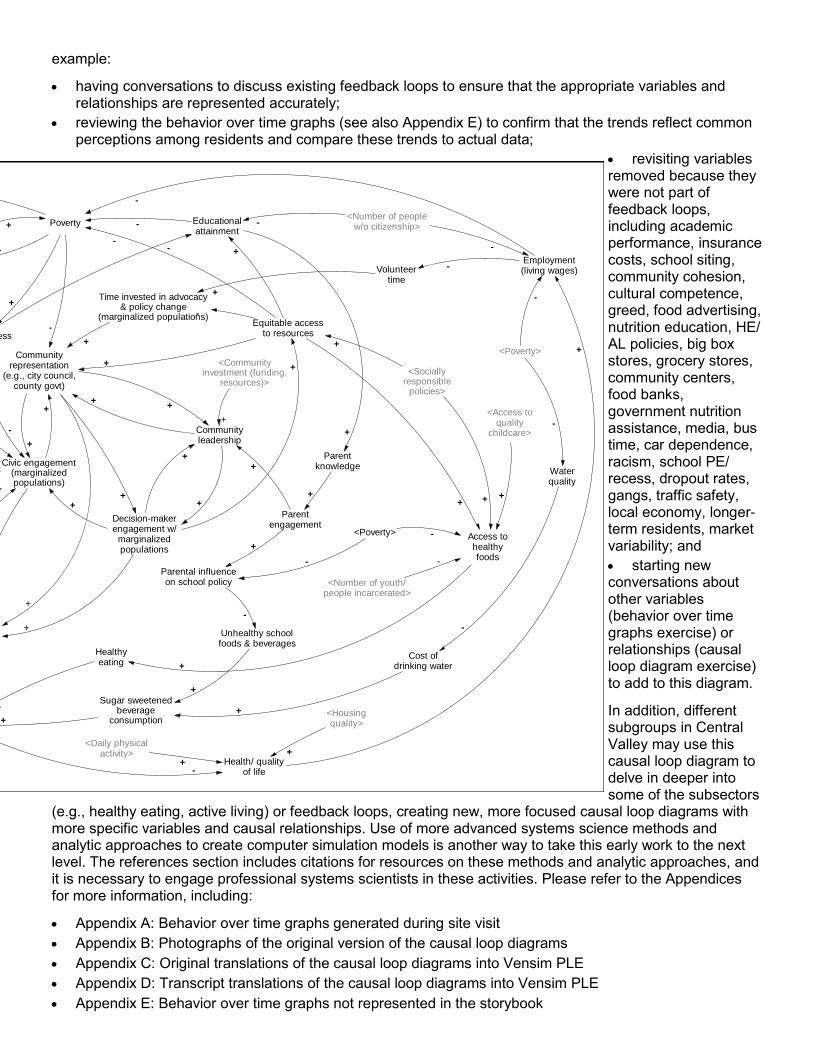
Figure 7: California’s North Central Valley HKHC Causal Loop Diagram
example:
having conversations to discuss existing feedback loops to ensure that the appropriate variables and relationships are represented accurately;
reviewing the behavior over time graphs (see also Appendix E) to confirm that the trends reflect common perceptions among residents and compare these trends to actual data;
revisiting variables removed because they were not part of feedback loops, including academic performance, insurance costs, school siting, community cohesion, cultural competence, greed, food advertising, nutrition education, HE/AL policies, big box stores, grocery stores, community centers, food banks, government nutrition assistance, media, bus time, car dependence, racism, school PE/ recess, dropout rates, gangs, traffic safety, local economy, longer-term residents, market variability; and
starting new conversations about other variables (behavior over time graphs exercise) or relationships (causal loop diagram exercise) to add to this diagram.
In addition, different subgroups in Central Valley may use this causal loop diagram to delve in deeper into some of the subsectors
(e.g., healthy eating, active living) or feedback loops, creating new, more focused causal loop diagrams with more specific variables and causal relationships. Use of more advanced systems science methods and analytic approaches to create computer simulation models is another way to take this early work to the next level. The references section includes citations for resources on these methods and analytic approaches, and it is necessary to engage professional systems scientists in these activities. Please refer to the Appendices for more information, including:
Appendix A: Behavior over time graphs generated during site visit
Appendix B: Photographs of the original version of the causal loop diagrams
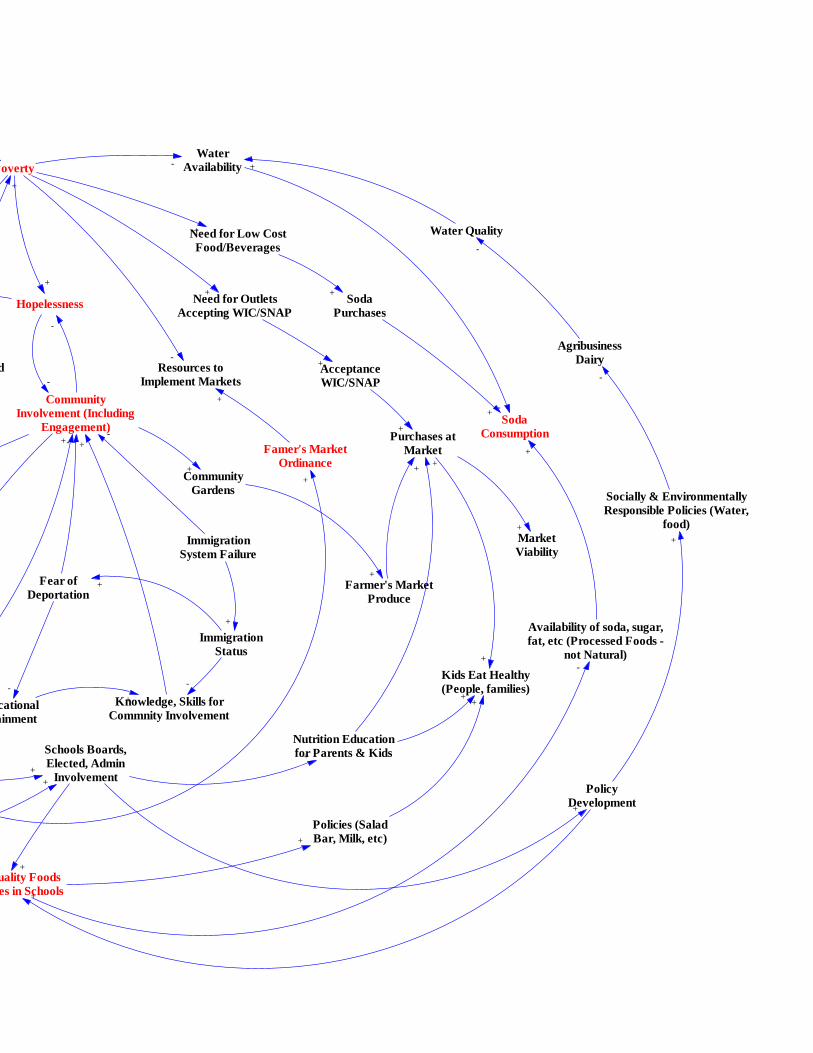
Appendix C: Original translations of the causal loop diagrams into Vensim PLE
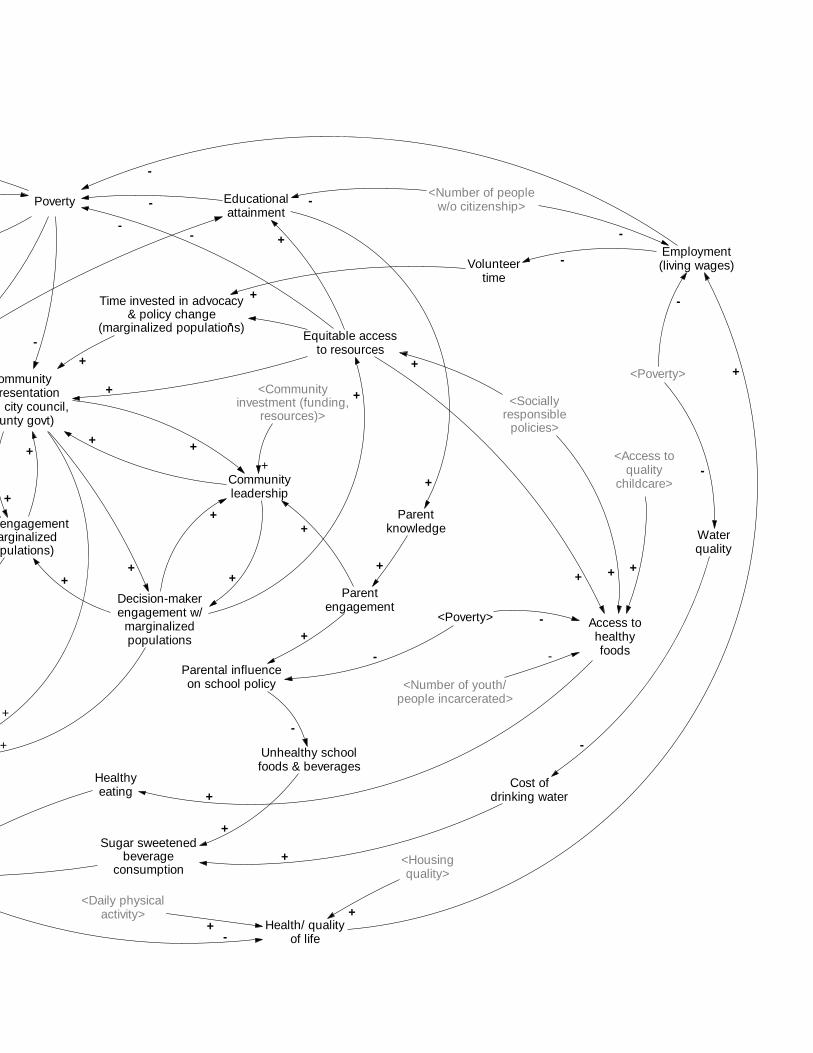
Appendix D: Transcript translations of the causal loop diagrams into Vensim PLE
Appendix E: Behavior over time graphs not represented in the storybook
Crime/violence
Communitysafety
Access to qualitychildcare
Traffic safety
Access toparks/ opengreen space
Dailyphysicalactivity
Access to schoolrecreation facilities
Migrantcamps
People leavingcommunity
Employment(living wages)
Poverty
Housingquality
Volunteertime
Communityrepresentation
(e.g., city council,county govt)
Civic engagement(marginalizedpopulations)
Communityinvestment(funding,
resources)
Number ofyouth/ peopleincarcerated
Communityleadership
Parentengagement
Parentknowledge
Unhealthy schoolfoods & beverages
Parental influenceon school policy
Health/ qualityof life
Sugar sweetenedbeverage
consumption
Decision-makerengagement w/
marginalizedpopulations
Sociallyresponsible
policies
Time invested in advocacy& policy change
(marginalized populations)Equitable access
to resources
Waterquality
Number of peoplew/o citizenship
Educationalattainment
Access tohealthyfoods
Cost ofdrinking water
-
+
-
+
+
+
-
-
+
+
+
-
+
+
+
+
+
-
+
+
-
+
++
-
+
-
-
+
++
+
Screentime
-
Recreationactivities (outdoor)
+
++
-
Healthyeating
Childhoodobesity
-- +
+
-
Walk/ bike toschool
+
Disparities in injuries/fatalities (marginalized
populations)-
+
Hopelessness
-
-
Organizedsports &
recreationfees
-
+
+
+
+
+
++
-
Quality of thebuilt
environment
+
+
+
-
+
-
+
-
+
+
-
+
-
-
+
-
+
+
-
+
+
<Housingquality>
+<Daily physical
activity>+
<Poverty>
-
-
<Sociallyresponsible
policies>
+
+
<Sociallyresponsible
policies>
+
+
<Number of peoplew/o citizenship>
-
-
<Poverty>
--
<Access toquality
childcare>
+
<Poverty> -
-
+
+
<Communityinvestment (funding,
resources)>
+
<Number of youth/people incarcerated>
-
+
<Time invested inadvocacy & policy
change (marginalizedpopulations)>
++
References for Systems Thinking in Communities:
Group model building handbook: Hovmand, P., Brennan L., & Kemner, A. (2013). Healthy Kids, Healthy Communities Group Model Building Facilitation Handbook. Retrieved from http://www.transtria.com/hkhc. Vensim PLE software for causal loop diagram creation and modification: Ventana Systems. (2010). Vensim Personal Learning Edition (Version 5.11A) [Software]. Available from http://vensim.com/vensim-personal-learning-edition/ System dynamics modeling resources and support: Andersen, D. F. and G. P. Richardson (1997). "Scripts for group model building." System Dynamics Review 13(2): 107-129. Hovmand, P. (2013). Community Based System Dynamics. New York, NY: Springer. Hovmand, P. S., et al. (2012). "Group model building "scripts" as a collaborative tool." Systems Research and Behavioral Science 29: 179-193. Institute of Medicine (2012). An integrated framework for assessing the value of community-based prevention. Washington, DC, The National Academies Press. Meadows, D. (1999). Leverage points: places to intervene in a system. Retrieved from http://www.donellameadows.org/archives/leverage-points-places-to-intervene-in-a-system/ Richardson, G. P. (2011). "Reflections on the foundations of system dynamics." System Dynamics Review 27(3): 219-243. Rouwette, E., et al. (2006). "Group model building effectiveness: A review of assessment studies." System Dynamics Review 18(1): 5-45. Sterman, J. D. (2000). Business dynamics: Systems thinking and modeling for a complex world. New York, NY: Irwin McGraw-Hill. System Dynamics in Education Project. (1994). Road maps: A guide to learning system dynamics. Retrieved from http://www.clexchange.org/curriculum/roadmaps/ Vennix, J. (1996). Group model building. New York, John Wiley & Sons. Zagonel, A. and J. Rohrbaugh (2008). Using group model building to inform public policy making and implementation. Complex Decision Making. H. Qudart-Ullah, J. M. Spector and P. I. Davidsen, Springer-Verlag: 113-138.
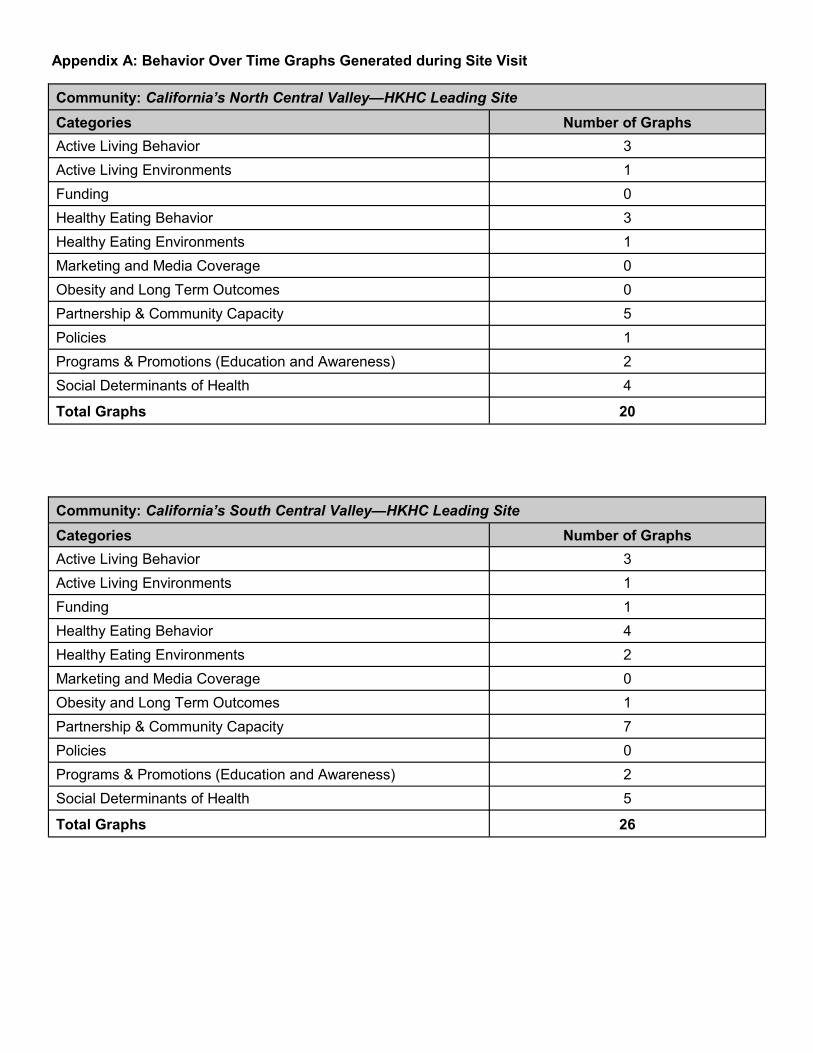
Appendix A: Behavior Over Time Graphs Generated during Site Visit
Community: California’s North Central Valley—HKHC Leading Site
Categories Number of Graphs
Active Living Behavior 3
Active Living Environments 1
Funding 0
Healthy Eating Behavior 3
Healthy Eating Environments 1
Marketing and Media Coverage 0
Obesity and Long Term Outcomes 0
Partnership & Community Capacity 5
Policies 1
Programs & Promotions (Education and Awareness) 2
Social Determinants of Health 4
Total Graphs 20
Community: California’s South Central Valley—HKHC Leading Site
Categories Number of Graphs
Active Living Behavior 3
Active Living Environments 1
Funding 1
Healthy Eating Behavior 4
Healthy Eating Environments 2
Marketing and Media Coverage 0
Obesity and Long Term Outcomes 1
Partnership & Community Capacity 7
Policies 0
Programs & Promotions (Education and Awareness) 2
Social Determinants of Health 5
Total Graphs 26
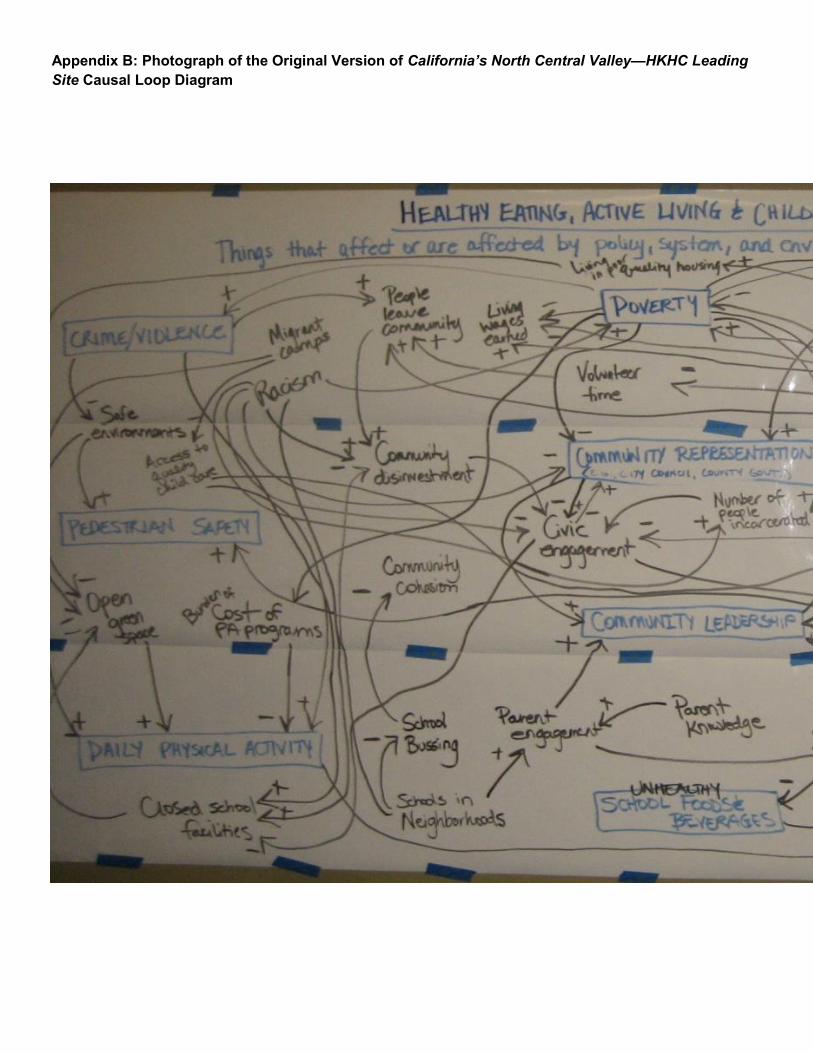
Appendix B: Photograph of the Original Version of California’s North Central Valley—HKHC Leading
Site Causal Loop Diagram

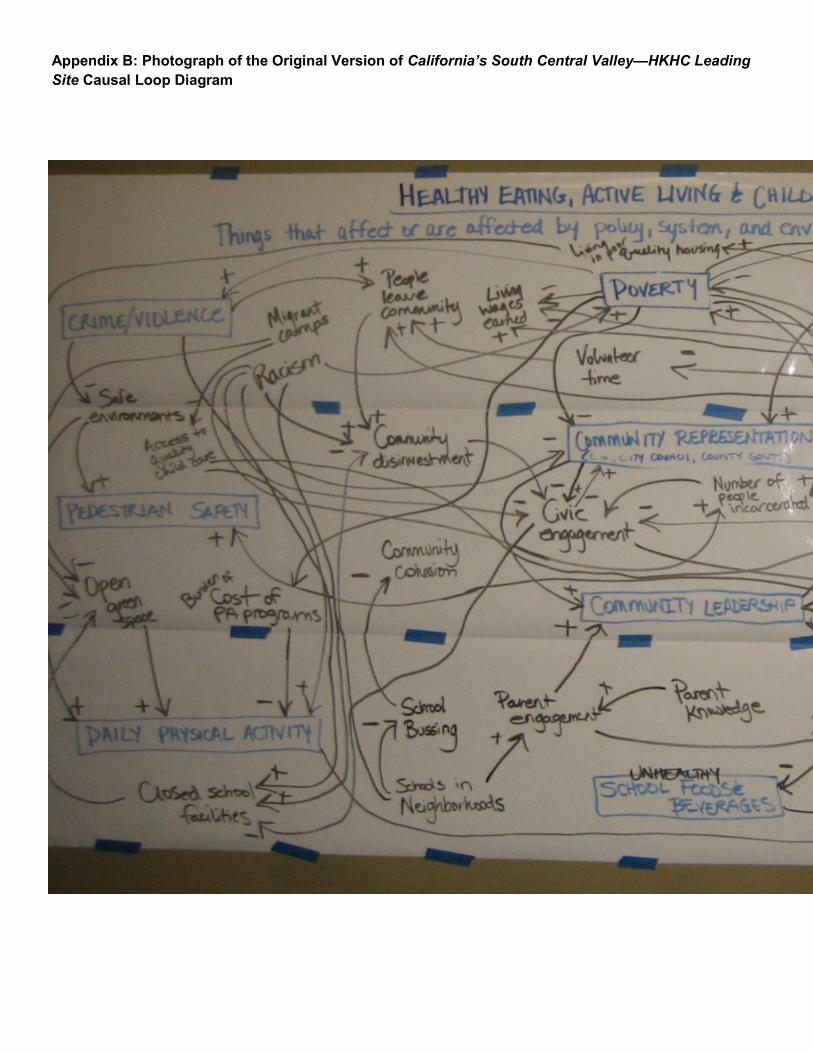
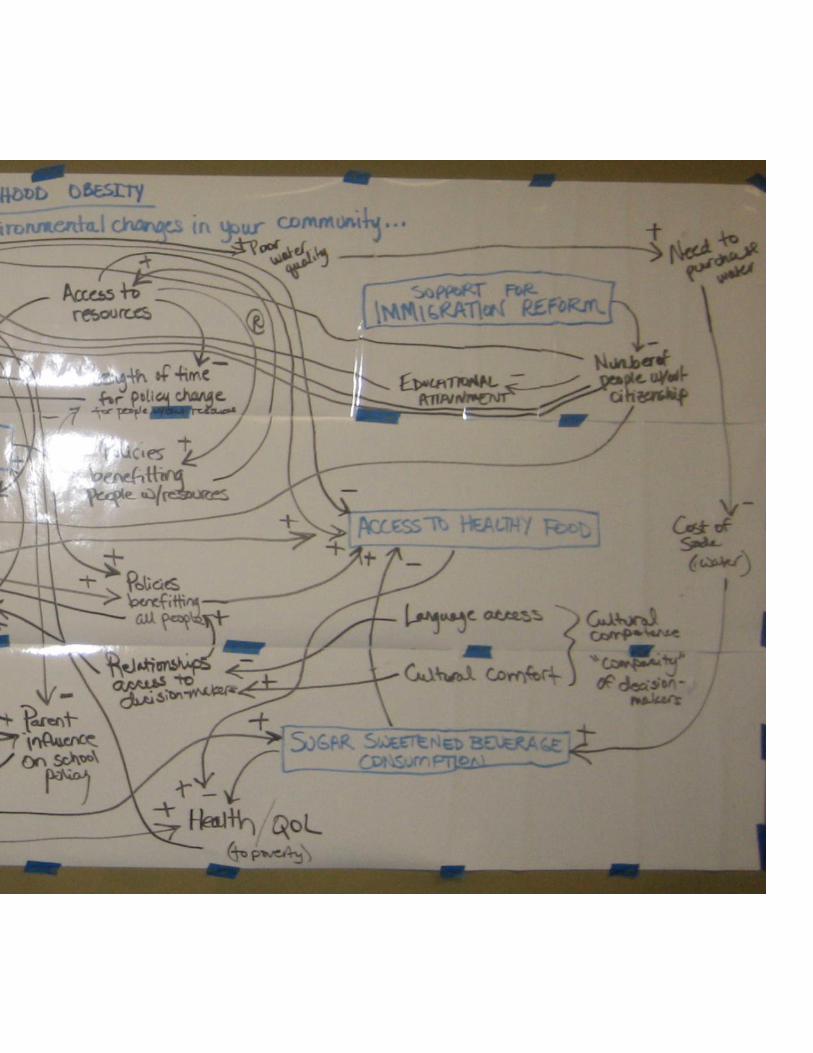
Appendix B: Photograph of the Original Version of California’s South Central Valley—HKHC Leading
Site Causal Loop Diagram

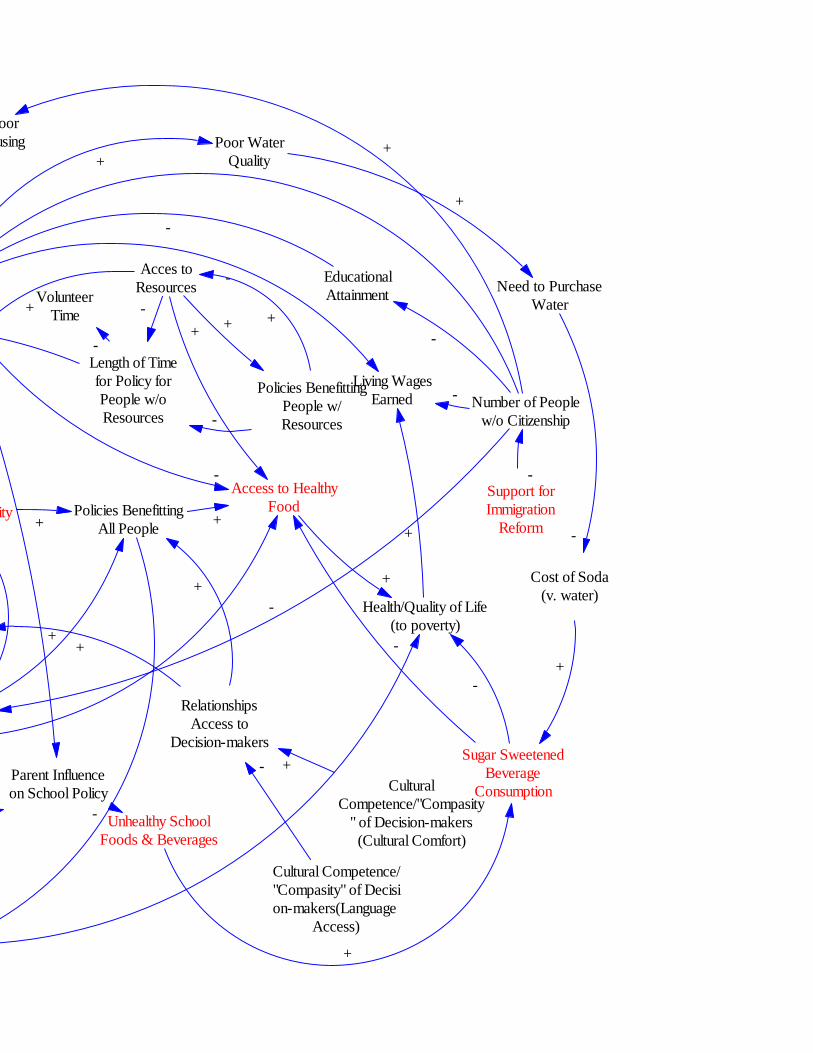
Appendix C: Original Translation of the North Central Valley Causal Loop Diagram into Vensim PLE
Crime/Violence
Safe
Environments
Access toQuality
Childcare
Pedestrian
Safety
Open Green
Space
Burden of
Cost of PA
Programs
Daily Physical
Activity
Closed School
Facilities
Migrant
Camps
Racism
People Leave
Community
Living Wages
Earned
Poverty
Living in Poor
Quality Housing
Volunteer
Time
Community
Representation (e.g., city
council, county govt)
Civic
Engagement
Community
Disinvestment
Number of
People
Incarcerated
Community
Leadership
Community
Cohesion
School Bussing
Schools in
Neighborhoods
Parent
Engagement
Parent Knowledge
Unhealthy School
Foods & Beverages
Parent Influence
on School Policy
Health/Quality of Life
(to poverty)
Sugar Sweetened
Beverage
Consumption
Relationships
Access to
Decision-makers
Policies Benefitting
All People
Policies Benefitting
People w/
Resources
Length of Time
for Policy for
People w/o
Resources
Acces to
Resources
Poor Water
Quality
Support for
Immigration
Reform
Need to Purchase
Water
Number of People
w/o Citizenship
Educational
Attainment
Access to Healthy
Food
Cost of Soda
(v. water)
Cultural
Competence/"Compasity
" of Decision-makers
(Cultural Comfort)
-
+
+
+
- -
+
-
-
+
-
+
+
-
- +
-
+
+
+
-
+
+
-
+
?
+
+
+-
+
-
+
+
++
-
-
++
+
-
+
Cultural Competence/
"Compasity" of Decisi
on-makers(Language
Access)
- +
-
+
+
- -
-
-
-
++
+
+
+
+
-
+
+
+
-
-
-
+ -
-
+
-
-
+
+
+
+
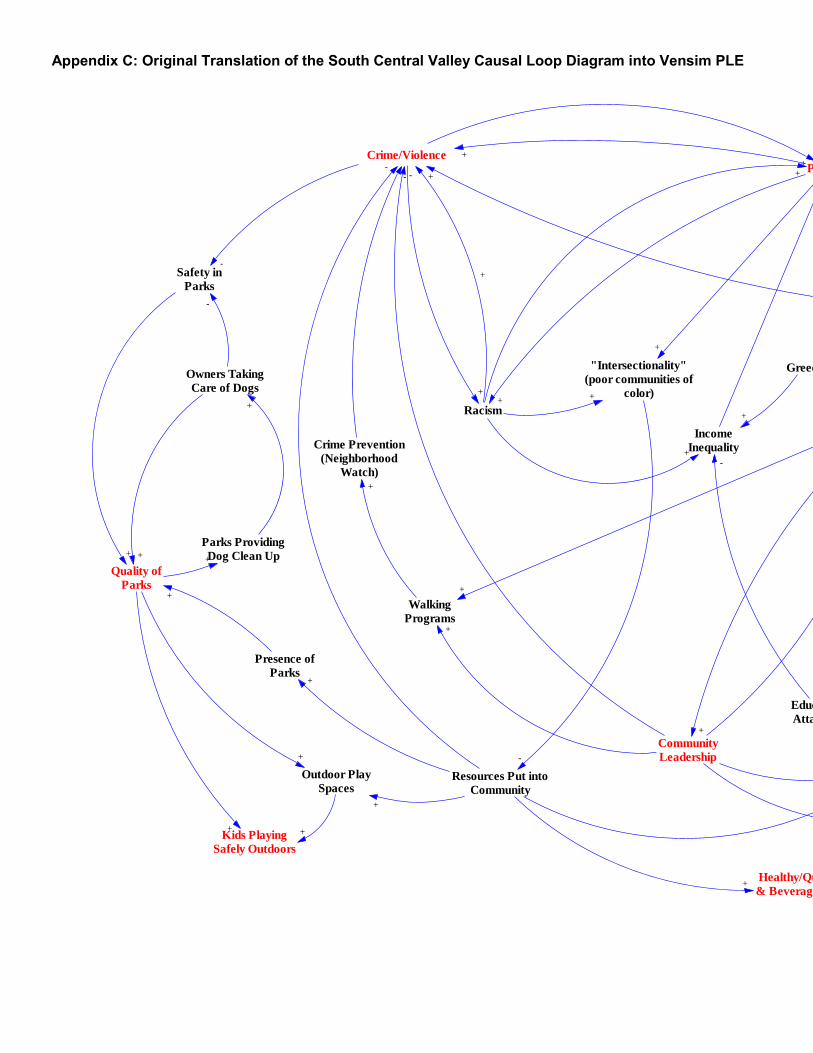
Appendix C: Original Translation of the South Central Valley Causal Loop Diagram into Vensim PLE
Crime/Violence
Safety in
Parks
Quality of
Parks
Owners Taking
Care of Dogs
Parks Providing
Dog Clean Up
Presence of
Parks
Kids Playing
Safely Outdoors
Crime Prevention
(Neighborhood
Watch)
-
+
+
+
+
+
+
-
-
Outdoor Play
SpacesResources Put into
Community
"Intersectionality"
(poor communities of
color)
+
+
+ -
+
Healthy/Quality Foods
& Beverages in Schools
Policy
Development
Community
LeadershipSchools Boards,
Elected, Admin
Involvement
Racism
Greed
Walking
Programs
Income
Inequality
Poverty
Socially & Environmentally
Responsible Policies (Water,
food)
Community
Involvement (Including
Engagement)
Immigration
Status
Immigration
System Failure
Fear of
Deportation
Educational
Attainment
Knowledge, Skills for
Commnity Involvement
+
+
+
+
+
+
+
+
+
+
+
-
+
+
+
+
+
+
-
-
+
-
+
-
-
+
+
Hopelessness
Need for Low Cost
Food/Beverages
Water
Availability
Agribusiness
Dairy
Water Quality
Famer's Market
Ordinance
Market
Viability
Soda
Purchases
Soda
Consumption
Availability of soda, sugar,
fat, etc (Processed Foods -
not Natural)
Policies (Salad
Bar, Milk, etc)
Nutrition Education
for Parents & Kids
Kids Eat Healthy
(People, families)
Community
Gardens
Resources to
Implement Markets
Need for Outlets
Accepting WIC/SNAP
Acceptance
WIC/SNAP
Purchases at
Market
Farmer's Market
Produce
+
-
-
+
-
-
-+
+
-
+
+
+
+
+
+
+
+
+
+
+
-
-
+
+
+
+
+
+
+
+-+
+
++
+
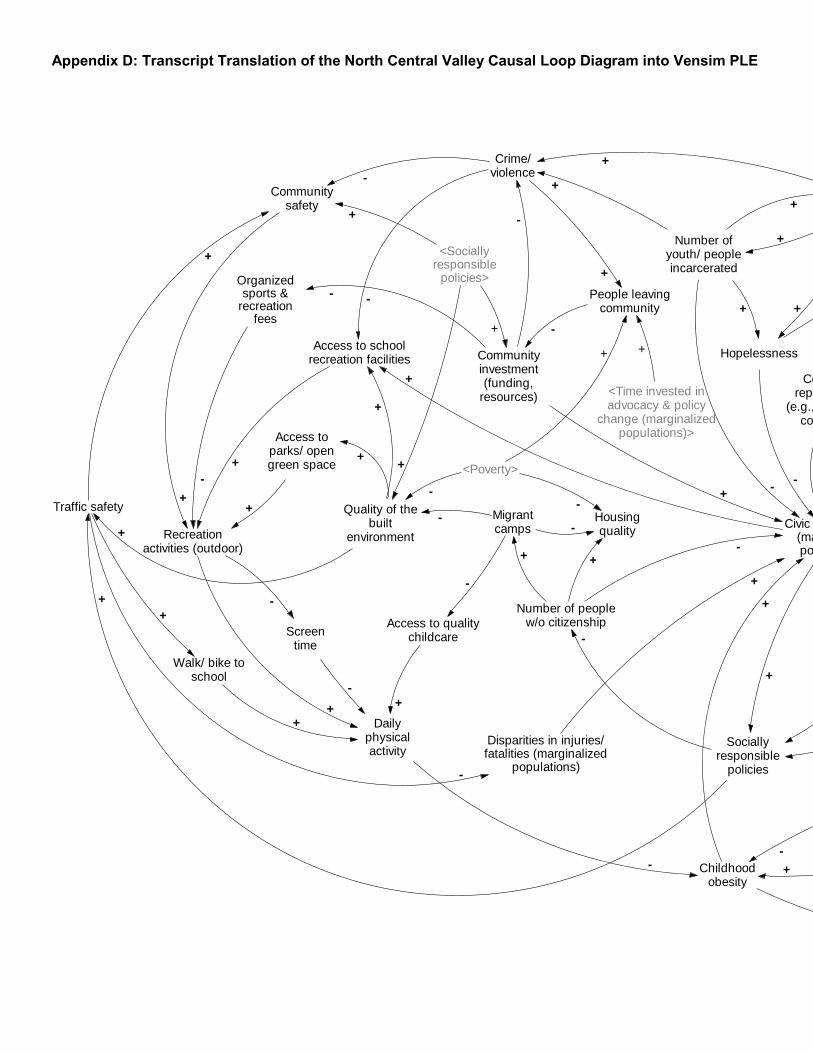
Appendix D: Transcript Translation of the North Central Valley Causal Loop Diagram into Vensim PLE
Crime/violence
Communitysafety
Access to qualitychildcare
Traffic safety
Access toparks/ opengreen space
Dailyphysicalactivity
Access to schoolrecreation facilities
Migrantcamps
People leavingcommunity
Employment(living wages)
Poverty
Housingquality
Volunteertime
Communityrepresentation
(e.g., city council,county govt)
Civic engagement(marginalizedpopulations)
Communityinvestment(funding,
resources)
Number ofyouth/ peopleincarcerated
Communityleadership
Parentengagement
Parentknowledge
Unhealthy schoolfoods & beverages
Parental influenceon school policy
Health/ qualityof life
Sugar sweetenedbeverage
consumption
Decision-makerengagement w/
marginalizedpopulations
Sociallyresponsible
policies
Time invested in advocacy& policy change
(marginalized populations)Equitable access
to resources
Waterquality
Number of peoplew/o citizenship
Educationalattainment
Access tohealthyfoods
Cost ofdrinking water
-
+
-
+
+
+
-
-
+
+
+
-
+
+
+
+
+
-
+
+
-
+
++
-
+
-
-
+
++
+
Screentime
-
Recreationactivities (outdoor)
+
++
-
Healthyeating
Childhoodobesity
-- +
+
-
Walk/ bike toschool
+
Disparities in injuries/fatalities (marginalized
populations)-
+
Hopelessness
-
-
Organizedsports &
recreationfees
-
+
+
+
+
+
++
-
Quality of thebuilt
environment
+
+
+
-
+
-
+
-
+
+
-
+
-
-
+
-
+
+
-
+
+
<Housingquality>
+<Daily physical
activity>+
<Poverty>
-
-
<Sociallyresponsible
policies>
+
+
<Sociallyresponsible
policies>
+
+
<Number of peoplew/o citizenship>
-
-
<Poverty>
--
<Access toquality
childcare>
+
<Poverty> -
-
+
+
<Communityinvestment (funding,
resources)>
+
<Number of youth/people incarcerated>
-
+
<Time invested inadvocacy & policy
change (marginalizedpopulations)>
++
Appendix D: Transcript Translation of the South Central Valley Causal Loop Diagram into Vensim PLE
Crime/violence
Communitysafety
Access to qualityparks & outdoor play
spaces
Ownerstakingcare ofdogs
Kids playingsafely outdoors
Crimeprevention
(neighborhoodwatch)
-
+
+
+
+-
Resources/funding intocommunity
(farmers' markets,parks)
"Intersectionality"(poor communities of
color)
-
Healthy/quality foods &beverages in
schoolsCommunityleadership
Decision-makerengagment (elected &
appointed officials)
Racism
Family/community
activities(walking,dancing)
Incomeinequality
Poverty
Socially &environmentally
responsible policies
Communityawareness,
engagement &involvement
Number ofindividuals with
immigrant status
Fear ofdeportation
Educationalattainment
+
+
+
+
+
+
+
+
+
+
-
++
++
+
-
-
-
+
Hopelessness
Access topotable water
Agribusiness
Waterquality
Policiessupporting
HE/AL
Sodapurchases
Sugar sweetenedbeverage
consumption
Availability ofprocessed foods
& beverages(sugar, fat)
Nutritioneducationfor parents
& kids
Healthyeating
Communitygardens
Purchases atmarkets,producestands,
conversionstores
Access to farmers'markets/ produce
stands
+
-
-
+
+
-
+
+
+
+
+
-
+
+
+
+
+
+
+
Access totransportation
Access tohealthy foods &
beverages incommunities
+
+
Farm toschool
+
+
Collaborationwith small,
local agencies/groups
++
Childhoodobesity
-
+
+
-
+
Access toschool
recreationfacilities
+
Air quality+
+
+
+
Walk/ bike toschool
+
-
+
-
-
Small storeconversions
+
+
+
-
+
++
+
+
<Resources/ fundinginto community
(farmers' markets,parks)>
+
+
-
<Communityawareness,
engagement &involvement>
+
+
<Poverty>-
<Socially &environmentally
responsible policies>
-
+
+
+
-
-

Appendix E: North Central Valley Behavior Over Time Graphs not Represented in the Storybook

Appendix E: South Central Valley Behavior Over Time Graphs not Represented in the Storybook


![Slideshare (lesson#2c)tauheed-course-(batch#6-januay-may-2017)-causes-of-wrong-thinking[contn'd]-8-februuary-2017](https://img.pdfslide.us/doc/110x75/589df0181a28ab773b8b6d11/slideshare-lesson2ctauheed-course-batch6-januay-may-2017-causes-of-wrong-thinkingcontnd-8-februuary-2017.jpg)