Embed Size (px)
Citation preview

13th Annual Meeting of WEPA
WEPA International workshop on Industrial Wastewater Management
Koichi FUJIE, Professor
Institute of Advanced Sciences
Yokohama National University
Sept.26, 2017, Jakarta, Indonesia
Sustainable Water Use in Development of Asian Countries
Evaluation and Control of Industrial Wastewater
Discharge based on Material Flow Analysis
1

Contents of this presentation
Categorization of industries
Process configurationInput/outputMaterial flow in the process
Kind of wastewater Kind of treatments
Conditions of surrounding environments
Kind of production process
Improvement of productionReduction of wastewater
Appropriate selection and operation of treatments
Recycle use for what?
(characterization)
Impact on environment and ecosystem
2
Water resource
Costal area
Flow rate &environment condition
Environment quality standard
Water pollution load
Effluent standard
Monitoring
Watershed management Wide variety of industries
Information on industrial activities in the watershed such as type of industry, water use and wastewater discharge, pollutants, treatment, recycle, and so on.
Impact on river water quality
Water flow and use in watershed
Daily life
Sewage treatment
Water intake & distribution
Treatment? Treatment& recycle?
Flow rate, pollutants and concentration, etc.
Agriculture
Process improvement and reduction of wastewater are required.
Appropriate treatment is required for the conservation of water environment and water resources with low cost and low consumptions of energy and materials.
3

W astewater
Screening
Oil Separation
pH Control
Preliminary Treatment
Primary
Sedimentation
Coaguration
Floatation
Secondary
Activated Sludge
Trickling Filter
Submereged Filter
Rotating Biological
Contactor
Advanced Treatment
Biological Treatments
Coagulation/Sedimentation
Stripping
Sand Filtration
Ultrafiltration
Microfiltration
Reverse Osmosis
Chemical Oxidation
Disinfection
Electrodyalisis
Ion Exchange
Effluent
Configuration of wastewater treatment process: Combination of various unit separation process based on the given conditions of wastewater and treatment.
Wastewater treatment process
1)Wastewater treatment is a separation process.Simple composition and/or similar properties of pollutants are the better for separation.
2)Selection and combination of unit process can be done based on the conditions as the quality and quantity of influent, effluent quality, and other requirements.
3)We have to know the wastewater for the appropriate selection and combination of unit process, and that the construction and operation of the wastewater treatment process consumes energy and additional materials. Trade-off!
4

Typical industries in the watershed
Industry and production process Related information and data to be collected
Public water body
1)Type of industry, raw materials and products2)Production process and material flow3)Wastes and wastewater discharge4)Environmental problems5)Environmental awareness and outlook of operator6)Surrounding environment and public awareness
Countermeasure for industrial wastewater(1) Categorization of industrial process
1)Operational condition of the industrial plant
2)Source of wastewater and the its information
3)Identification of pollutants and treatability, etc.
5

Countermeasure for industrial wastewater(2) Performance improvement of industrial plant
Industrial process and plant
Industry and production process Information on the plant performance
Material flow analysis on the plant will give;1)Conversion of raw materials,2)Yield of product and productivity, 3)By-products and wastes.
These information and data can be used to diagnose the process and plant.Optimal operating conditions will be given to reduce the pollutants discharge, while increasing the production performance.
6

Kurita Water & Environmental Foundation
Countermeasures for industrial wastewater(3)Selection of appropriate wastewater treatments
Preliminary Primary Secondary Advanced
Process configuration, operation and maintenance
Oil separation
Coagulationsedimentation
DisinfectionActivated sludge
example
Influent-pollutants-concentration-flow rate-others
Effluent-pollutants-concentration-discharge-recycle-othersPerformance, maintenance, problems, energy
consumption, etc. and comments on the process
Appropriate process of wastewater treatment is selected based on the information and
data of material flow on the production process and the information such as;
1)Existing water pollution problems, and those expected in the water body,
2)Environmental awareness and outlook/vison of plant manager/administrator, and
3)Surrounding environment and public awareness.
✖
Appropriate choice of
wastewater treatment process
Recycle use
Discharge
7

Kurita Water & Environmental Foundation
Countermeasures for industrial wastewater(4)For sustainable water use in development
✖
Appropriate wastewater treatment
with low cost and low consumptions
of energy and additional resources.
Discharge
Sound water environment
Effective use of limited water resources
Recycle use
Resources and energy saving
Domestic materials and energy input
Products
Increase of productivity
Decrease of wastes and wastewater discharge
Process and plant improvement
Watershed or regional area
Wastes, wastewater, exhaust gas
8

Balance & Flow:Material, Energy, Momentum, Cash ・・
Rate:Mass transfer, Reaction,・・・・・・・・Unit Operation:Separation & refining, mixing, other treatments・・
Process & System: Development and design, Analysis and
Evaluation, Operation and Control, Management
Chemical engineering approach for diagnosis of industrial process and plants
Chemical engineering aspects - mass & energy balances; choice of datum, overall & component
balances, simultaneous mass & energy balances, stoichiometry, combustion, recycle & purge
streams: fluid flow; dimensionless groups, viscosity, streamline & turbulent flow, Reynolds
number, roughness, energy losses: pumps; flow-head characteristics, sizing: heat transfer;
conductivity, resistance, overall heat transfer coefficients, fouling factors, heat exchangers: unit
operations; definition, categorization, typical applications: flow sheets: safety & environmental
aspects of plant design & operability.
Principles of chemical engineering
9

Reaction: A → R is proceeded in a single stage reactor
Input Output
Volumetric Efficiency=Q(CR1-CR0)/V1
Conversion :x=1-CA1/CA0
Energy for
operation
Q
liquid volume:V1
θ : hydraulic retention time)
Q Q
CA0=10
CR0=0
CA1=5
CR1θ =1h
Q
liquid volume:V1
θ : hydraulic retention time)
Q Q
CA0=10
CR0=0
CA1=5
CR1θ =1h
reactor
Material balance equation of
reactant A in reactor
Material Flow (or Balance) Analysis in a Reactor
Material flow analysis in production process
Reactant: AMixture ofProduct: R
Residual reactant: AIntermediates: IBy-products: X, etc.
10

recycle
Wastewater 2 wastes2wastes1 Wastewater 1
Energy
Raw material
Products
Wastes & wastewater
reactor
separationseparation
mixing
Reservoir Wastes 3
Amount and composition of wastes and wastewater can be clarified
What kind of and how much materials coming in and going out at each unit operation can be known!
Material flow analysis on the process will give information of:Productivity, yield, wastes & wastewater discharge, etc.
separation
Material flow analysis on industrial process
1)MFA on industrial process
11

Electro deposition
Evaporation
ProductsProducts
Previous process
Improvement of industrial process for the reduction of wastewater discharge
Washing water
Wastewater
12

Recycle use
Electro deposition
Water supply
Evaporation
Products
Wastewater
Products
With incorporation of UF membrane, the filtrate can used for products washing.
Closed process can be achieved for electro-deposition.
Previous process
Improvement of industrial process for the reduction of wastewater discharge
UF
EvaporationProcesswater
Recycle use
Products
Recycle use
Electro deposition
Products
Improved process
featured UF filtration
13

Onsite treatment and recycle of wastewater in unit industrial process
APROCESS PROCESS PROCESS PROCESS
RAW MATERIAL
ION
EX
CH
AN
GE
FIL
TR
AT
ION
BL
OW
WA
TE
R
COAGULATION
SE
DIM
EN
-
TA
TIO
N
PRODUCT
ACTIVATED CARBON
EFFLUENT
RECYCLE
FIL
TR
AT
ION
BL
OW
WA
TE
R
BL
OW
WA
TE
R COAGULATION
FILTRATION
Process
Water
B C D
Simple onsite
treatment and recycle
Simple treatment of
mixed similar wastewater
Final treatment in small
process for discharge
and recycle
Recycle
Recycle
Recycle
14

Process
A
Process
B
Process
C
Process
D
Raw materials Products
b' eSimple and
advanced treatment
Effluenta'
Similar wastewater
Novel and advanced wastewater treatment and recycle system
To meet the stringent effluent
standard, additional and high
cost treatments are needed.
Reduction in process water use
Mixing of wastewater makes the treatment difficult and increases the cost of treatments
Previous system
Mixed wastewater
Process
A
Process
BProcess
CProcess
D
Raw materials Products
Effluent
Process water
SecondaryPrimary Advanced
Simple and small
treatment is
enough to meet the
effluent standard
Advanced wastewater treatment and recycle
system of industries based on material flow analysis
15

Supply and recycle system of ultra pure water
by onsite treatment in electronics industries
Rawmaterial
Waterrecovery
Mainprocess
PackagingProducts
Wastewatertreatment
Ultra purewater
Pre-treatmentfiltration
Pure water
Wash & rinse
Wash& rinse
Industrial waterwell water
Cooling water
Boiler waterPrimaryprocess
LCDSemi-conductor
recycle water
Functionalwater
Huge ultra pure and functional water are used in the electronic industry, while the most
is recycled after sequential treatment. A little water is needed for the process operation.
RO: Reverse Osmosis
MF: micro-filtrationUF: ultra-filtration
Continuous Ion Exchange
Protection of Intellectual Properties
16

Amount and composition of wastes and wastewater can be clarified
Material flow analysis on the process will give the information on:raw material, reactants, products, inert, by-products, intermediates, etc.
Material flow analysis on industrial process
Improvement of production process(1)Essential information and data for the improvement
1)Improvement :conversion, yield, productivity, quality, etc.
2)Reduction : discharge of wastes and wastewater, energy consumption17

Products Processing Wastewater(l) BOD(g) COD(g)Oil &
Grease(g)SS(g)
Engine,Chassis Machining 20 - 200 145 100 - 700 80 10 - 400
Body Painting 1230 - 4100 300 - 900400 - 700 24 - 85100 -400
Brake Forging & Painting 30 - 390 0.14 - 6.71.0 - 13.41.6 - 26.82 - 40
Electroplating 20 - 70 0.86 0.42 - -
Transmission Casting 10 - 320 - 1 - 46 - 0.5 - 45
Pollutants discharge from automobile manufacturing plant
Improvement of production process(2)Characteristics of wastewaters from industrial process
18

Unit process
COD is CODMn
(BOD/CODMn)
*
Kitchen and toiletwastewaters
Effluent quality standard applied
COD<10 mg/L in average
COD<15 mg/L in maximum value
Effluent
Mixing
Activatedsludge
Sandfiltration
Activatedcarbon(AC)adsorption
Oil-waterseparation
CoagulationFloatation
Machining
Casting
Forging
Others
Rainfall, etc
wastewaters
72m3/d
743mg/L36m3/d
2309mg/L
16m3/d
3227mg/L
1955m3/d90mg/L
41m3/d
171mg/L
(1.06)
2120m3/d
235m3/d
66.8mg/L
2355m3/d
69.5mg/L
(1.03)
*37.9mg/L
35.5mg/L
(0.26)
BOD<5mg/L
COD:8.4mg/L
(0.595)
Improvement of production process(3)Identification of problems in the existing process
Refractory chemicals (pollutants) remain in the wastewater
High COD loading to AC adsorptionHigh operating cost of AC adsorption
System configuration and material flow in wastewater treatments of automobile factory
19

Eluent : Water
Flow rate: 1 ml/ min
Column: MCI GEL CQP10
Injection volume: 20 µl
252015105
DO
C (
mg/l)
10 1 0.15 0.5 x10³
MW=7000
( BOD/DOC=0)
MW=250
(MW)
Influentwastewater
Effluent
Elution Time (min)
0
10
20
30
40
50
BOD/COD ratio: Biodegradability
Analysis of molecular size distribution and biodegradability of pollutants contained in wastewater.
Pollutants remained in the effluent of biological treatment
Why the pollutant with
MW=7000 exists in the
wastewater from machining
process?
1)It was due to the continuous
leakage of hydraulic oil from
hydraulic cylinders to operate
machining tool.
2)Principal ingredient of non-
mineral hydraulic oil was
polyethylene glycol(PEG).Refractory chemicals
Removed by biological treatment
This material should be removed from the raw and auxiliary materials in the production process
Improvement of production process(4)Identification of pollutants to be removed
20

Bio
-degra
dabili
ty(B
OD
/ThO
D)
Molecular Size (MW)
102
103
104
105
0
1.0
0.8
0.6
0.4
0.2
ThOD:Theoretical Oxygen Demands
Coagulation with
Sedimentation or
Flotation
Membrane
Filtration
Biological Treatment
Adsorption by
activated carbonChemical
oxidation?
Selection of applicable wastewater treatments for organic pollutants based on molecular size and biodegradability
Improvement of production process(5)Characterization of pollutants to be removed
21

Effluent quality
Raw Materials, Process Wastewater
Bio-degradability
YesCoagulation or gravitational separation
Effluent quality Yes
No
Yes
Yes
Yes
No
Effluent (recycle, discharge)
Activated carbon adsorption, etc.
No
Organic removal Improvement of
biodegradability
Reduce utilization
No
Filtration, Membrane separation(flux, fouling, energy, life)
No
Yes
Biodegradability and bio-treatablity testBOD/TOC, BOD/ThOD, BOD/COD
> x Good for biological treatment < y Not good for bio-treatments
Effluent quality
Chemical
oxidation Yes
No
No
Procedure to determine appropriate treatment of organic pollutants
Evaluation of pollutants in terms of coagulation, filtration,biodegradation, chemical oxidation, adsorption.
22

Procedure to evaluate the physico-chemical technologies for suspended solids removal
Effluent
YesQuality
Size Screen
wastewater
Next stage treatment
Molecularsize
QualityYes
Filtration
Quality Yes
PolaritypH control+coagulation
Centrifuge P. floatation
QualityYes
Specificgravity Floatation
YesQuality
Sedimentation
23

エアレーションタンク最初沈殿池 最終沈殿池 塩素滅菌槽 放流
ポンプ
返送汚泥
余剰汚泥
生汚泥
焼却炉
脱水機
焼却灰
埋立て
汚泥消化 濃縮
脱水ケーキ
沈砂池スクリーン
脱離液
下水
空気
高度処理
再利用
screen
Advanced treatment
Primary
sedimentation
tank
aeration
tank
Secondary
sedimentation
tankDis-
infection
sludgetreatment
sludgeincineration
recycle
sewageSand separation
Activated sludge process for wastewater treatment
Energy consumption in activated sludge process
24

Month & Year Jan. 1965 Jan 1973 Nov. 1973 Feb. 1974
Wastewater
(m3/t-polymer) 36.2 17.0 8.8 0.2
Counter
measure (A) (B) (C)
(A) Increase the polymer concentration in the reactor,
(B) Wastewater recycle from polymer separation process,
(C) Wastewater recycle from catalyst washing and polymer drying processes.
Improvement of production process(6)Experience in polymer production for wastewater reduction
Countermeasures in polymer production process to reduce wastewater
discharge by enhanced recycle of recovered effluent from each unit
process and by increase of polymer concentration in the reactor.
Production rate of polymer in the reactor
was increased
25

3002001000Relative value to '75
Production
Water use
Water use/Production
BOD discharge
COD discharge
SS discharge
Wastewater Discharge from Paper and Pulp Mills
Improvement of production process(7)Reduction in water use and pollutants discharge
This figure shows the transition in water use and pollutants discharge in pulp industry.
26

This figure shows the transition of process water use for ¥1 million
($10,000) production in various industries. Water use was sharply
decreased around 1973!
Energy crisis@1973Energy crisis@1973
Improvement of production process(8)Reduction of water use in production process
27

Energy crisis@1973 Energy crisis@1973
This figure shows the increase in used water recovery for recycle in
industry. The energy crisis in 1973 and 1978 triggered the increase of
recycle ratio of recovered effluent after appropriate treatment.
Improvement of production process(9)Increase of water recycle ratio in industrial production
28

(×108m3/y)
Recycle ratio
Recycled water
Fresh water Intake
Wate
r use f
or
industr
y
Wate
r re
covery
and
recycle
use
Low contaminated effluent was preferentially
recycled after simple treatment.
Improvement of production process(10)Use of water and recycle in industries of Japan
29

79 84 89 94 990
1000
2000
産業系
生活系
その他
西暦年度
発生
汚濁
負荷
量(t
/日) 663
(37.0)
961 (53.5)
170 (9.5)
551 (34.5)
883 (55.2)
164 (10.3)
529 (36.1)
783 (53.5)
152 (10.4)
数値:上段(t/日) 下段(%)
437 (34.3)
696 (54.7)
140 (11.0)
429 (35.6)
637 (52.8)
138 (11.6)
Pollution loadupper (t/d)lower (%)
Year
Pollu
tio
n loa
d(t
/d)
Industrial
Domestic
Others
Figure shows the transition in reduction of COD loading into
closed sea area in Japan.
Improvement of production process(11)COD loading into closed sea area in Japan
30

Top priority for the sustainable water use in development is the
improvement of the production process
1)Analyze materials & energy flow in industrial production
process for diagnosis and to clarify the appropriate
countermeasure.
2)Before considering the treatment of wastes and wastewater,
improve the industrial process to minimize emission.
3)Select appropriate treatment technology and process based
on characterization of wastes and wastewater, and then
recycle after treatment.
Improvement of production process(12)Top priority for the sustainable water use in development
31

Improvement of production process(13)Management system for the stock and flow of chemicals
Report on materials: purchase & consume
Permission to purchase
Application for the permission to purchase materials
Factory for Industrial Production
Environment
Management HQ
Database of materials used in
production process in terms
of stock and flow
Environment management division can estimate the followings based on the information in the above:1)Composition of wastewater and the amount from the plant,
2)Appropriate treatment method for the wastewater,
3)Approach how to reduce the environment loading and the impact from the production process
Secondary materials: paint, lubricant,
coolant, detergents, hydraulic fluid, etc.
Supplier
Raw materials, secondary materials
Information of materialsSupply
materials
32

Palm oil mill (North Sumatra)
Material flow analyses of biomass, biomass residue and wastewater in plantation of palm oil and cassava for sustainable cultivation of crops.
Application of Material Flow AnalysisMFA in plantation for appropriate use of biomass residues
Tapioca mill (Lampung)
33

Onggkok26~42 t-C/d
Tapioca
56 t-C/d(weight 140-150t/d)
COD:18,000~25,500
(mg/ℓ)
Cassava
140 t-C/d(weight 700-750 t-wet/d)
Skin, tips10~14 t-C/d
100%
oil
6,750 ℓ/d
electricity
34.5MWh/d
water2,630 m3/d
Lagoon
Methane gas
Tapioca mill
26~40%
40%
Flow:3,000 m3/d
20~22%
Cassava yield:13t/ha
wastewater
28~30 t-C/d
Application of material flow analysisOrganic carbon flow in tapioca mill
34

Skin & tip8.1 kg
(1.0 kg-C)(0.02 kg-N)
Onggok102 kg
(40 kg-C)(0.4 kg-N)
タピオカ204 kg
(71.6 kg-C)(0.15 kg-N)
Elot
12 kg(4.4 kg-C)
(0.11 kg-N)
(108 kg-C) (1.34 kg-N)
1 t-cassava(164 kg-C)(1.26 kg-N)
処理水2.2m3
washing & peeling
crashing
separation
tapioca
residueprocess water wastewater
Carbon and Nitrogen flow in tapioca mill for 1 ton cassava processing (wet base)
2.4 m3
(46.7 kg-C)(0.43 kg-N)
Application of material flow analysisOrganic carbon and nitrogen flow in tapioca mill
35

36
Wastewater
400kg-C/h
Products:9.66t/hPalm oil: 8.72t/h
Kernel oil:0.94t/h
EFB8.6t/h
Steam
electricity
Lagoon
Boiler
For effective
use
COD:31000g/m3
GHG
emission
Flow:33.7m3/h
FFB:40t/h
Fiber(moist.)4.9t/h
Shell(dry)2.0t/h
Shell(moist.)0.24t/h
Kernel shell2.6t/h
Application of material flow analysisWet weight base material flow in palm oil mill
36

37
Electricity
Steam
Raw material
Biomass residue POME
7 kg-C
(354kg)
FFB
307 kg-C
(1,000 kg)
Products
CPO
163 kg-C
(215 kg)
EFB
38 kg-C (250kg)
COD 50,000 mg/ℓ
POM
34.4% 2.2%
100%
For POM
operation
PK
32 kg-C
(43.0kg)
Boiler
Shell
24 kg-C(54kg)
Fiber
44 kg-C (141kg)Lagoon
63.4%
Shell 13kg-C
Fiber 38kg-C
()moistened organic matter for FFB1,000kg
1)53 % of organic carbon in FFB is retained in CPO
2)77% of organic carbon flow into lagoon is biogas, 42% is methane.
CH4
42%
CO2
35%
100.0%Effluent
9%
Biogas
sediment*
14%
CO2
77%
Application of material flow analysisOrganic carbon flow in a palm oil mill (POM)
37
Tapioca (Cassava)
Org
an
ic c
arb
on
in
waste
wate
r
[kg
-C/t
on
]
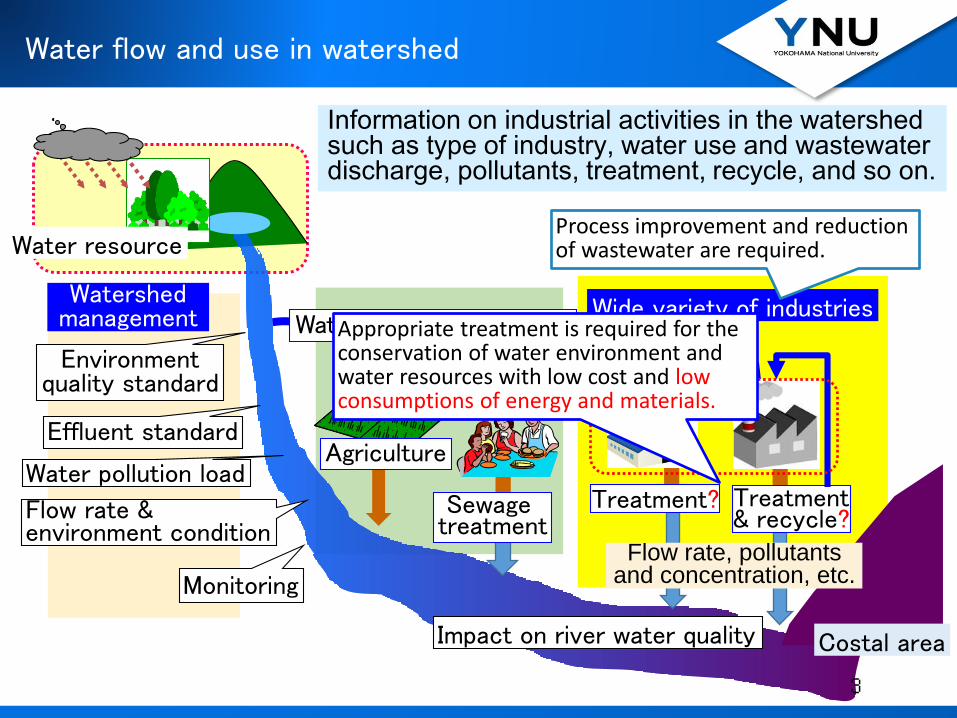
38~41
190~205
0
100
200
Cane sugarPalm oil
0.3~0.69.2~9.8
42~45
3.5~7.1
Entire energy
from outside No energy from outside
per 1ton of raw material
per 1ton of product
Amount of organic carbon discharge from agro-industries into wastewater per one ton of products.
Huge organic carbon is discharged from tapioca mill into wastewater
Application of material flow analysisDischarge of organic carbon from agro-industries
38

edimentation
8,000
25%100%
Biogas 0.60tonCH4 14%(35%)
CO2 26%(65%)
-Flow rate
400m3/day
-COD
31,550ppm
35%
Pond No.1
Sedimentation
COD8,000ppm
1.2t-C/day
Inlet Pond No.3
4.7t-C/day
25%
12%
Pond No.2
40%
COD ?ppm
1.5t-C/day
100%
Biogas 1.9ton-C/day
Biogas 0.60t-C/day
Biogas 53%
CH4 9%(67%)
CO2 4%(33%)13%
Application of material flow analysisCarbon flow in palm oil mill lagoon
39

Biomass residue
4.3 kg/day(1.6 kg-C)
(0.03 kg-N) Excreta
4.4 kg/day(1.8 kg-C)
(0.08 kg-N)
Fattening period
6 months
Daily weight increase
0.4 kg/day(0.2 kg-C)
(0.02 kg-N)
Breathing・burp
1.0 kg/day(0.3 kg-C)(0 kg-N)
Compression residue,sediment, skin, etc.
Corn1.1 kg/day(0.4 kg-C)
(0.04 kg-N)
Auxiliary feed0.7 kg/day(0.3 kg-C)
(0.03 kg-N)
Additional feedComposting
0.8 kg/dayRice husk
Compost
3.3 kg/day(1.2 kg-C/day)
(0.09 kg-N/day)
Carbon and Nitrogen flow in cattle fattening using biomass residue of tapioca mill as feed
Application of material flow analysisCarbon and nitrogen flow in cattle fattening
40

Summary of this presentation
Categorization of industries
Process configurationInput/outputMaterial flow
Kind of wastewater Kind of treatments
Conditions of surrounding environments
Kind of production process
Improvement of productionReduction of wastewater
Appropriate selection and operation of treatments
Recycle use for what?
(characterization)
Impact on environment and ecosystem
41

Thank you for your kind attention!
City of Yokohama
Sustainable Water Use in Development of Asian Countries
42

Suspended solids removal from industrial wastewaters
Process Wastewater
Property of suspended solids
size(μm) polaritySpecific gravity
SedimentationStarch, flour-milling
pulp & paper1~103 low 1) >1
FloatationBean curd & its
deep-fried, rubber- low 2) <1
Pressurized floatation
Pulp & paper
cleaning- low 2)
<1
or =1
CentrifugePig manure, paint-
production10-1~102 low 1) -
Coagulation Food, electro-plating 10-3~1 - -
Filtration Food, electro-plating 10-3~10 low 5) independent
43


![Introduction of Our Activity - wepa-db.netwepa-db.net/3rd/en/meeting/20190123/pdf/D1_S3_iv_Fujishima.pdf · Group Total Sales: US$ 18,811 million KOBELCO GROUP 3 [Note] ... ‐Hanoi](https://img.pdfslide.us/doc/110x75/5f895480380fda33a71671b3/introduction-of-our-activity-wepa-dbnetwepa-dbnet3rdenmeeting20190123pdfd1s3iv.jpg)