Embed Size (px)
Citation preview

Supplementary material 1:
Tables and figures of representative significant functional networks
identified by Ingenuity Pathway Analysis in brain cortex and
hippocampus following 3, 6, and 12 h of hypoxia exposure and with
NAP supplementation.
Hippocampus3h hypoxia
ID Molecules in network Score Focus Molecul
e
Top Function
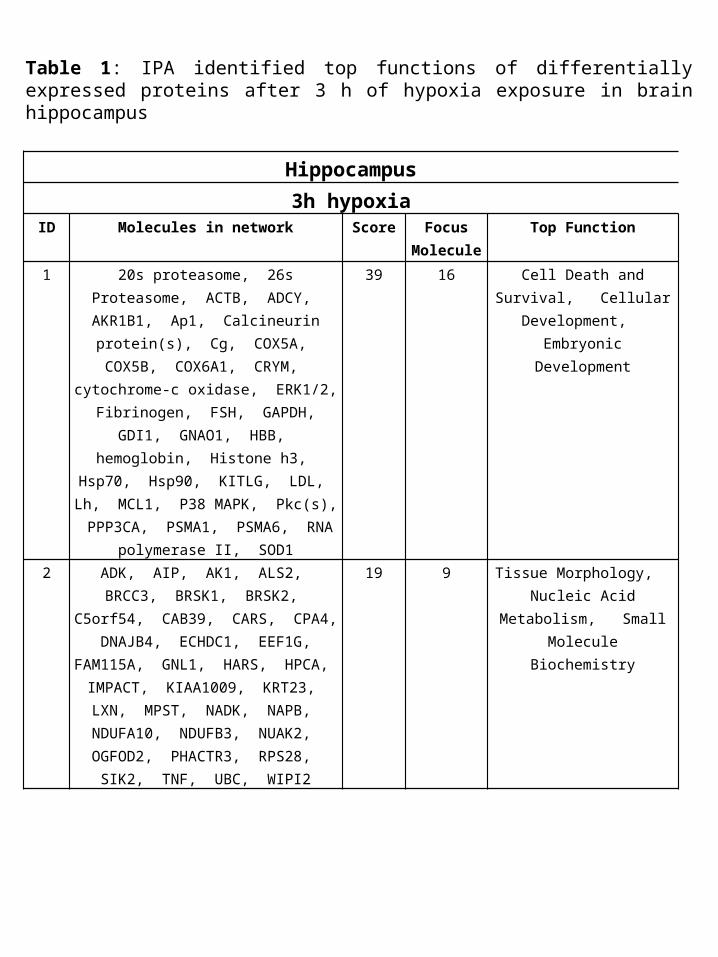
1 20s proteasome, 26s Proteasome, ACTB, ADCY, AKR1B1, Ap1,
Calcineurin protein(s), Cg, COX5A, COX5B, COX6A1, CRYM,
cytochrome-c oxidase, ERK1/2, Fibrinogen, FSH, GAPDH, GDI1,
GNAO1, HBB, hemoglobin, Histone h3, Hsp70, Hsp90, KITLG,
LDL, Lh, MCL1, P38 MAPK, Pkc(s), PPP3CA, PSMA1, PSMA6,
RNA polymerase II, SOD1
39 16 Cell Death and Survival, Cellular Development, Embryonic Development
2 ADK, AIP, AK1, ALS2, BRCC3, BRSK1, BRSK2, C5orf54, CAB39, CARS, CPA4, DNAJB4, ECHDC1, EEF1G, FAM115A, GNL1, HARS,
HPCA, IMPACT, KIAA1009, KRT23, LXN, MPST, NADK, NAPB,
NDUFA10, NDUFB3, NUAK2, OGFOD2, PHACTR3, RPS28, SIK2,
TNF, UBC, WIPI2
19 9 Tissue Morphology, Nucleic Acid
Metabolism, Small Molecule Biochemistry
Table 1: IPA identified top functions of differentially expressed proteins after 3 h of hypoxia exposure in brain hippocampus
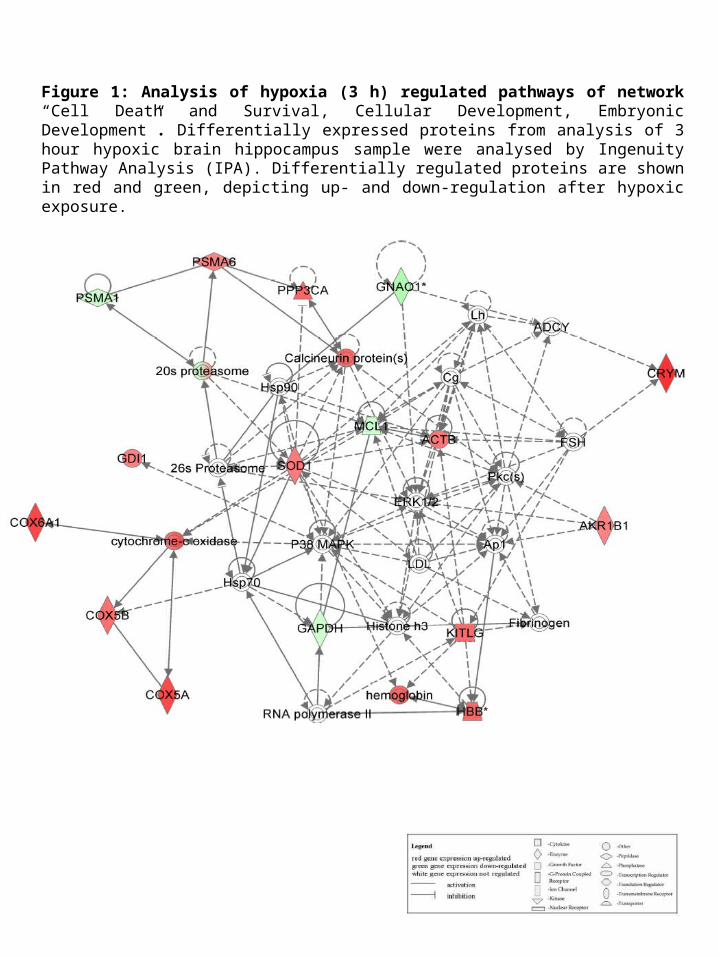
Figure 1: Analysis of hypoxia (3 h) regulated pathways of network “Cell Death and Survival, Cellular Development, Embryonic Development”. Differentially expressed proteins from analysis of 3 hour hypoxic brain hippocampus sample were analysed by Ingenuity Pathway Analysis (IPA). Differentially regulated proteins are shown in red and green, depicting up- and down-regulation after hypoxic exposure.
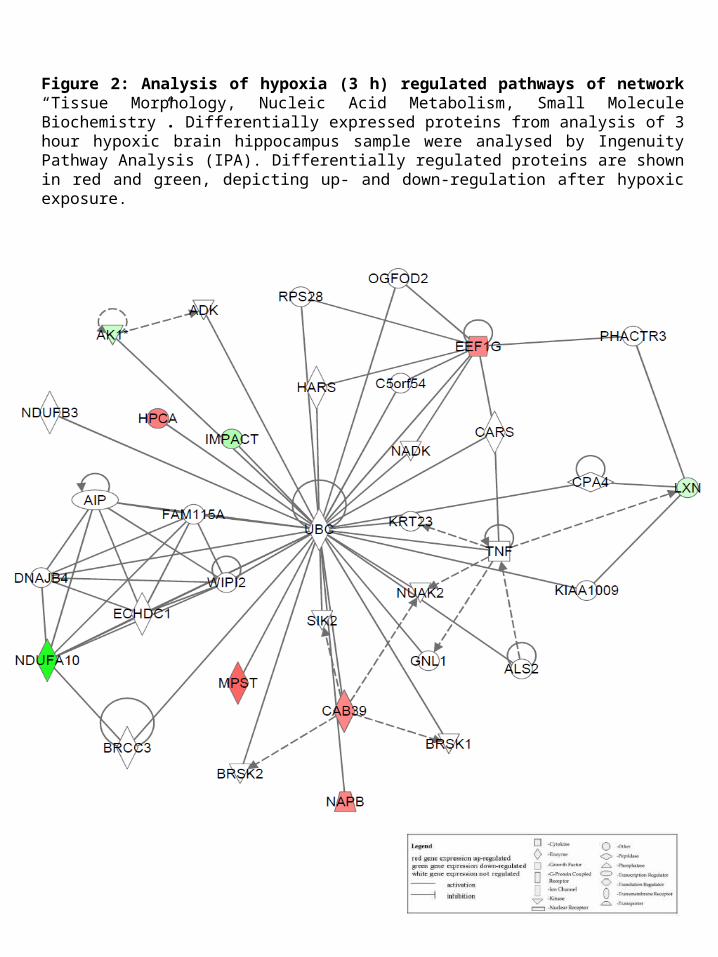
Figure 2: Analysis of hypoxia (3 h) regulated pathways of network “Tissue Morphology, Nucleic Acid Metabolism, Small Molecule Biochemistry”. Differentially expressed proteins from analysis of 3 hour hypoxic brain hippocampus sample were analysed by Ingenuity Pathway Analysis (IPA). Differentially regulated proteins are shown in red and green, depicting up- and down-regulation after hypoxic exposure.

3h hypoxia+NAPID Molecules in network Score Focus
Molecule
Top Function
1 ACTB, Actin, Alpha Actinin, CA2, Calcineurin protein(s), calpain, caspase, CD3, Cofilin, COX5A, COX5B, COX6A1, cytochrome-c oxidase, DDT, DNM1, DPYSL2,
Eno1, ERK1/2, F Actin, Fibrinogen, GAPDH, GDI1,
GNAO1, Hsp90, KITLG, Nfat (family), P38 MAPK, PAFAH1B1, PLC gamma, PPP3CA, PTK2B,
Rock, SOD1, Tpi1 (includes others), Tubulin
40 18 Cellular Assembly and Organization,
Neurological Disease, Hereditary Disorder
2 20s proteasome, 26s Proteasome, ADCY, Akt, Ap1, ATP5C1,
ATPase, Calmodulin, COPS3, CRYM, FSH, G protein beta
gamma, GNB1, Gpcr, GSTP1, HBB, hemoglobin, Histone h3, Hsp70, LDL, Lh, Mapk, NAPB,
NFkB (complex), PI3K (complex), Pka, PRDX2, PSMC2, PSMC5,
Ras, RNA polymerase II, STAT5a/b, Syntaxin, SYT1, VCP
26 12 DNA Replication, Recombination, and
Repair, Energy Production, Nucleic
Acid Metabolism
Table 2: IPA identified top functions of differentially expressed proteins after 3 h of hypoxia exposure with NAP supplementation in brain hippocampus

Figure 3: Analysis of hypoxia (3 h with NAP supplementation) regulated pathways of network “Cellular Assembly and Organization, Neurological Disease, Hereditary Disorder”. Differentially expressed proteins from analysis of NAP supplemented 3 hour hypoxic brain hippocampus sample were analysed by Ingenuity Pathway Analysis (IPA). Differentially regulated proteins are shown in red and green, depicting up- and down-regulation after hypoxic exposure.

Figure 4: Analysis of hypoxia (3 h with NAP supplementation) regulated pathways of network “DNA Replication, Recombination, and Repair, Energy Production, Nucleic Acid Metabolism”. Differentially expressed proteins from analysis of NAP supplemented 3 hour hypoxic brain hippocampus sample were analysed by Ingenuity Pathway Analysis (IPA). Differentially regulated proteins are shown in red and green, depicting up- and down-regulation after hypoxic exposure.
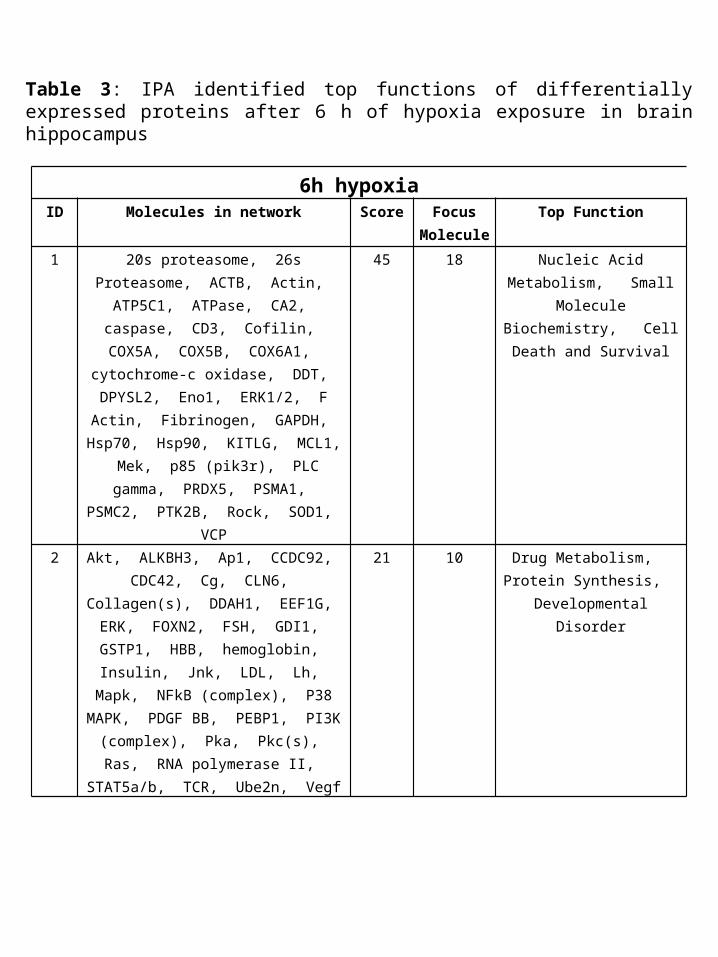
6h hypoxiaID Molecules in network Score Focus
Molecule
Top Function
1 20s proteasome, 26s Proteasome, ACTB, Actin, ATP5C1, ATPase, CA2, caspase, CD3, Cofilin,
COX5A, COX5B, COX6A1, cytochrome-c oxidase, DDT,
DPYSL2, Eno1, ERK1/2, F Actin, Fibrinogen, GAPDH, Hsp70,
Hsp90, KITLG, MCL1, Mek, p85 (pik3r), PLC gamma, PRDX5,
PSMA1, PSMC2, PTK2B, Rock, SOD1, VCP
45 18 Nucleic Acid Metabolism, Small
Molecule Biochemistry, Cell Death and Survival
2 Akt, ALKBH3, Ap1, CCDC92, CDC42, Cg, CLN6, Collagen(s), DDAH1, EEF1G, ERK, FOXN2,
FSH, GDI1, GSTP1, HBB, hemoglobin, Insulin, Jnk, LDL, Lh,
Mapk, NFkB (complex), P38 MAPK, PDGF BB, PEBP1, PI3K
(complex), Pka, Pkc(s), Ras, RNA polymerase II, STAT5a/b, TCR,
Ube2n, Vegf
21 10 Drug Metabolism, Protein Synthesis,
Developmental Disorder
Table 3: IPA identified top functions of differentially expressed proteins after 6 h of hypoxia exposure in brain hippocampus

Figure 5: Analysis of hypoxia (6 h) regulated pathways of network “Nucleic Acid Metabolism, Small Molecule Biochemistry, Cell Death and Survival”. Differentially expressed proteins from analysis of 6 hour hypoxic brain hippocampus sample were analysed by Ingenuity Pathway Analysis (IPA). Differentially regulated proteins are shown in red and green, depicting up- and down-regulation after hypoxic exposure.
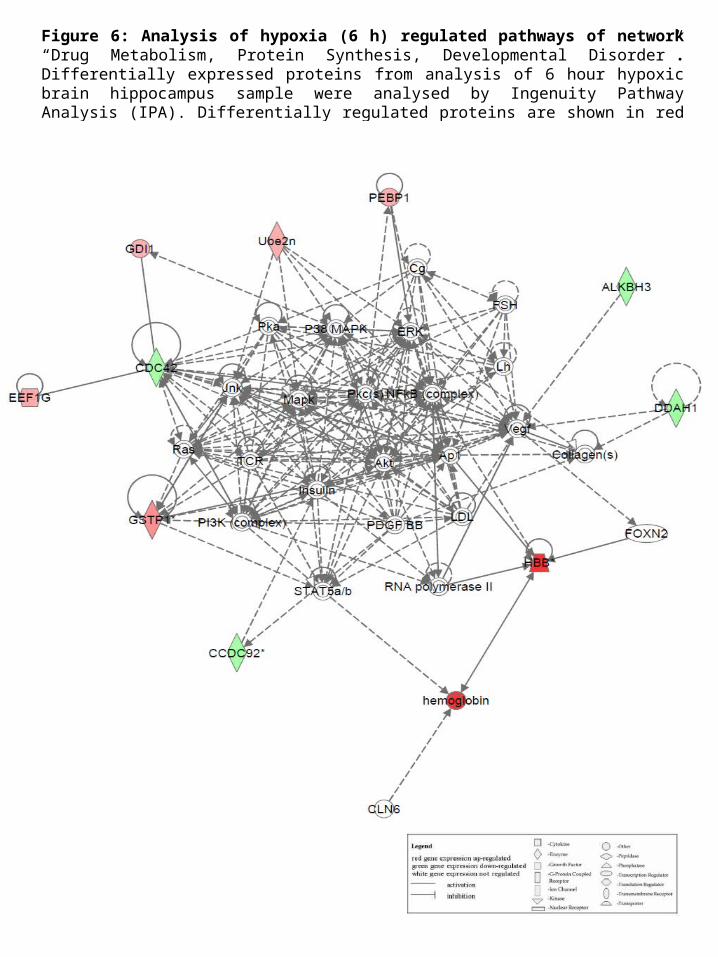
Figure 6: Analysis of hypoxia (6 h) regulated pathways of network “Drug Metabolism, Protein Synthesis, Developmental Disorder”. Differentially expressed proteins from analysis of 6 hour hypoxic brain hippocampus sample were analysed by Ingenuity Pathway Analysis (IPA). Differentially regulated proteins are shown in red and green, depicting up- and down-regulation after hypoxic exposure.
6h hypoxia+NAPID Molecules in network Score Focus
Molecule
Top Function
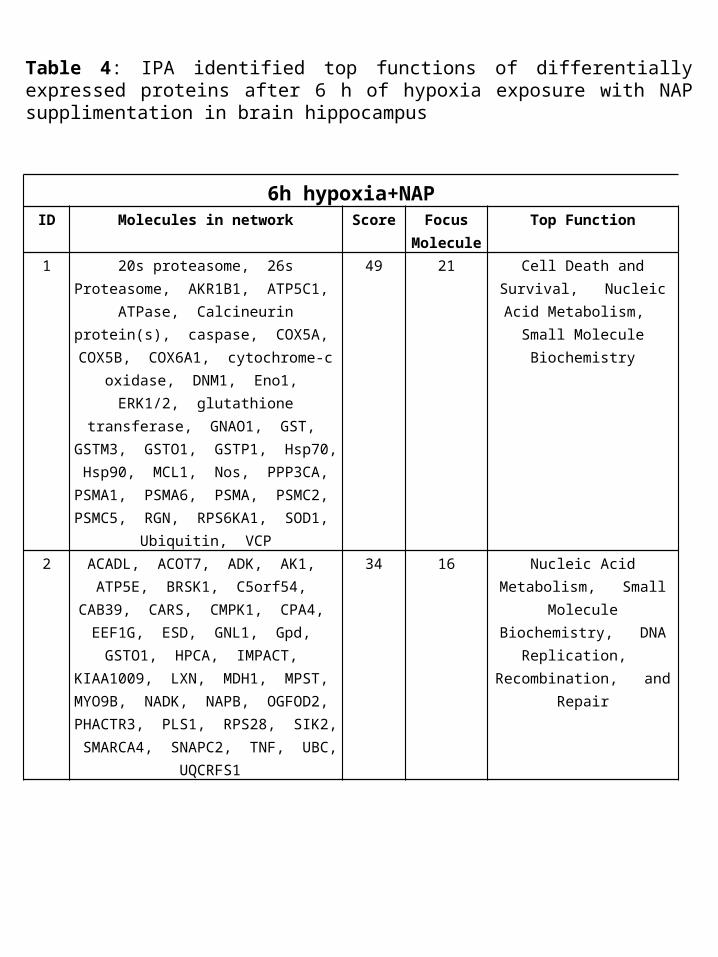
1 20s proteasome, 26s Proteasome, AKR1B1, ATP5C1, ATPase,
Calcineurin protein(s), caspase, COX5A, COX5B, COX6A1,
cytochrome-c oxidase, DNM1, Eno1, ERK1/2, glutathione transferase, GNAO1, GST,
GSTM3, GSTO1, GSTP1, Hsp70, Hsp90, MCL1, Nos, PPP3CA,
PSMA1, PSMA6, PSMA, PSMC2, PSMC5, RGN, RPS6KA1, SOD1,
Ubiquitin, VCP
49 21 Cell Death and Survival, Nucleic Acid
Metabolism, Small Molecule Biochemistry
2 ACADL, ACOT7, ADK, AK1, ATP5E, BRSK1, C5orf54, CAB39,
CARS, CMPK1, CPA4, EEF1G, ESD, GNL1, Gpd, GSTO1, HPCA, IMPACT, KIAA1009, LXN, MDH1,
MPST, MYO9B, NADK, NAPB, OGFOD2, PHACTR3, PLS1, RPS28, SIK2, SMARCA4, SNAPC2, TNF,
UBC, UQCRFS1
34 16 Nucleic Acid Metabolism, Small
Molecule Biochemistry, DNA Replication,
Recombination, and Repair
Table 4: IPA identified top functions of differentially expressed proteins after 6 h of hypoxia exposure with NAP supplimentation in brain hippocampus
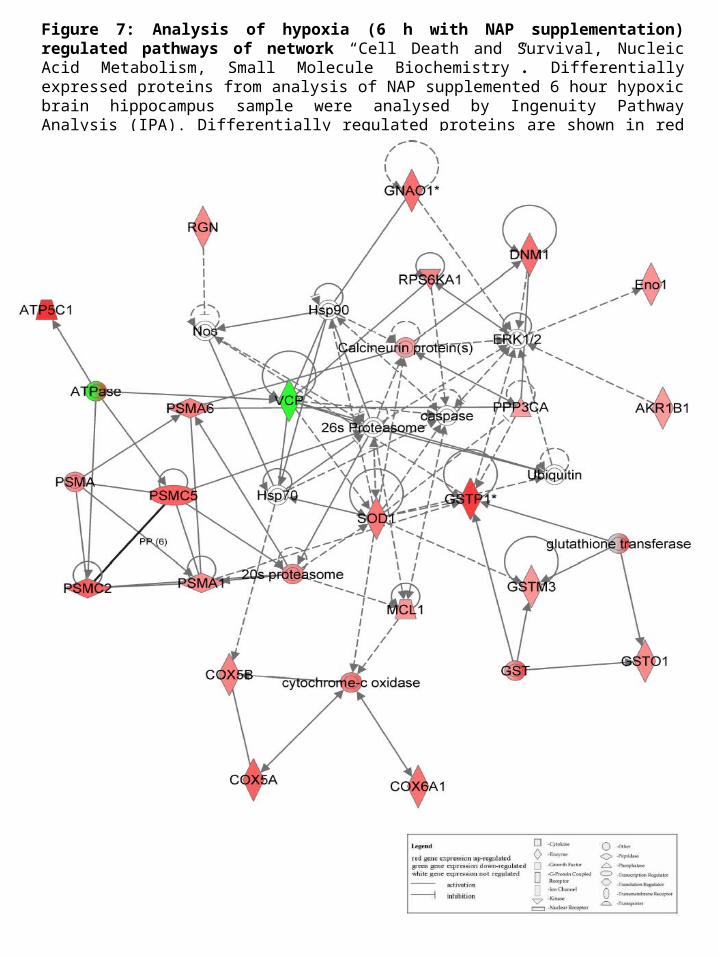
Figure 7: Analysis of hypoxia (6 h with NAP supplementation) regulated pathways of network “Cell Death and Survival, Nucleic Acid Metabolism, Small Molecule Biochemistry”. Differentially expressed proteins from analysis of NAP supplemented 6 hour hypoxic brain hippocampus sample were analysed by Ingenuity Pathway Analysis (IPA). Differentially regulated proteins are shown in red and green, depicting up- and down-regulation after hypoxic exposure.

Figure 8: Analysis of hypoxia (6 h with NAP supplementation) regulated pathways of network “Nucleic Acid Metabolism, Small Molecule Biochemistry, DNA Replication, Recombination, and Repair”. Differentially expressed proteins from analysis of NAP supplemented 6 hour hypoxic brain hippocampus sample were analysed by Ingenuity Pathway Analysis (IPA). Differentially regulated proteins are shown in red and green, depicting up- and down-regulation after hypoxic exposure.

12h hypoxiaID Molecules in network Score Focus
Molecule
Top Function
1 20s proteasome, 26s Proteasome, ATP5C1, ATPase, CA2, Calcineurin
protein(s), caspase, DNM1, Dynamin, Eno1, ERK1/2, GAPDH,
glutathione transferase, Gsta4, GSTM3, GSTO1, hemoglobin, Hsp70, Hsp90, HSPB1, MCL1, NADPH oxidase, NME1, PARK7,
PGAM1, PPP3CA, PRDX2, PRDX5, PSMA1, PSMA, PSMC2, PSMC5,
SOD1, Ubiquitin, VCP
49 21 Free Radical Scavenging, Molecular Transport, Nucleic Acid
Metabolism
2 1100001G20Rik, ACADL, ADK, AIM1L, AK1, C5orf54, CAB39, Ck2, CMPK1, CPA4, ECHDC1,
EEF1G, ESD, FADS3, FAM129A, GPD1, Gpd, IMPACT, KATNB1,
KIAA1009, KRT23, LXN, MDH1, NDUFA10, OGFOD2, PAFAH1B1,
PCMT1, Pgk, PHACTR3, SNAPC2, TBP, TMEM87A, TNF, Tubulin,
UBC
29 14 Nucleic Acid Metabolism, Small
Molecule Biochemistry, DNA Replication,
Recombination, and Repair
Table 5: IPA identified top functions of differentially expressed proteins after 12 h of hypoxia exposure in brain hippocampus
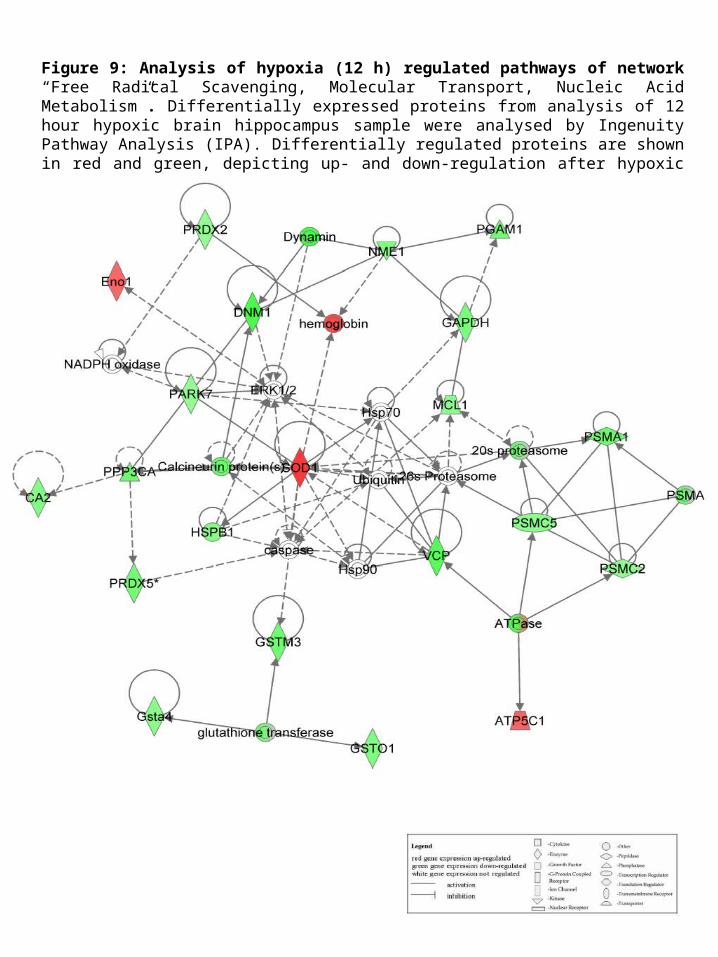
Figure 9: Analysis of hypoxia (12 h) regulated pathways of network “Free Radical Scavenging, Molecular Transport, Nucleic Acid Metabolism”. Differentially expressed proteins from analysis of 12 hour hypoxic brain hippocampus sample were analysed by Ingenuity Pathway Analysis (IPA). Differentially regulated proteins are shown in red and green, depicting up- and down-regulation after hypoxic exposure.

Figure 10: Analysis of hypoxia (12 h) regulated pathways of network “Nucleic Acid Metabolism, Small Molecule Biochemistry, DNA Replication, Recombination, and Repair”. Differentially expressed proteins from analysis of 12 hour hypoxic brain hippocampus sample were analysed by Ingenuity Pathway Analysis (IPA). Differentially regulated proteins are shown in red and green, depicting up- and down-regulation after hypoxic exposure.
12h hypoxia+NAPID Molecules in network Score Focus
Molecule
Top Function
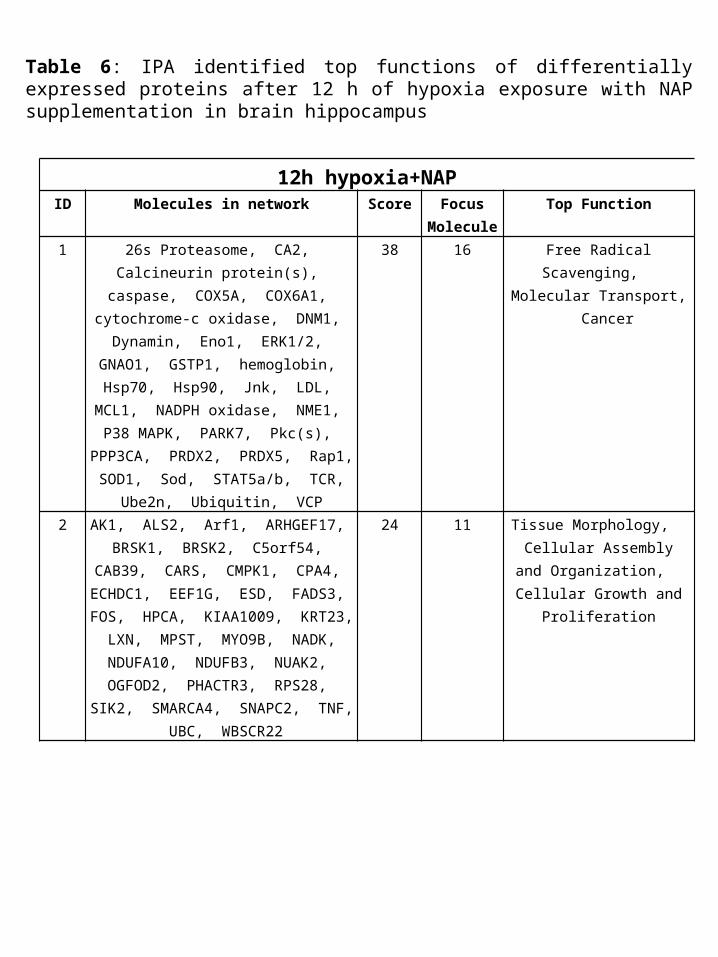
1 26s Proteasome, CA2, Calcineurin protein(s), caspase, COX5A,
COX6A1, cytochrome-c oxidase, DNM1, Dynamin, Eno1, ERK1/2,
GNAO1, GSTP1, hemoglobin, Hsp70, Hsp90, Jnk, LDL, MCL1,
NADPH oxidase, NME1, P38 MAPK, PARK7, Pkc(s), PPP3CA, PRDX2,
PRDX5, Rap1, SOD1, Sod, STAT5a/b, TCR, Ube2n, Ubiquitin,
VCP
38 16 Free Radical Scavenging, Molecular
Transport, Cancer
2 AK1, ALS2, Arf1, ARHGEF17, BRSK1, BRSK2, C5orf54, CAB39, CARS, CMPK1, CPA4, ECHDC1,
EEF1G, ESD, FADS3, FOS, HPCA, KIAA1009, KRT23, LXN, MPST,
MYO9B, NADK, NDUFA10, NDUFB3, NUAK2, OGFOD2,
PHACTR3, RPS28, SIK2, SMARCA4, SNAPC2, TNF, UBC,
WBSCR22
24 11 Tissue Morphology, Cellular Assembly and Organization, Cellular
Growth and Proliferation
Table 6: IPA identified top functions of differentially expressed proteins after 12 h of hypoxia exposure with NAP supplementation in brain hippocampus

Figure 11: Analysis of hypoxia (12 h with NAP supplementation) regulated pathways of network “Free Radical Scavenging, Molecular Transport, Cancer”. Differentially expressed proteins from analysis of NAP supplemented 12 hour hypoxic brain hippocampus sample were analysed by Ingenuity Pathway Analysis (IPA). Differentially regulated proteins are shown in red and green, depicting up- and down-regulation after hypoxic exposure.

Figure 12: Analysis of hypoxia (12 h with NAP supplementation) regulated pathways of network “Tissue Morphology, Cellular Assembly and Organization, Cellular Growth and Proliferation”. Differentially expressed proteins from analysis of NAP supplemented 12 hour hypoxic brain hippocampus sample were analysed by Ingenuity Pathway Analysis (IPA). Differentially regulated proteins are shown in red and green, depicting up- and down-regulation after hypoxic exposure.