Embed Size (px)
Citation preview
Statistical Modeling: Applications
and Recent Advances
Tze Leung Lai
Stanford University
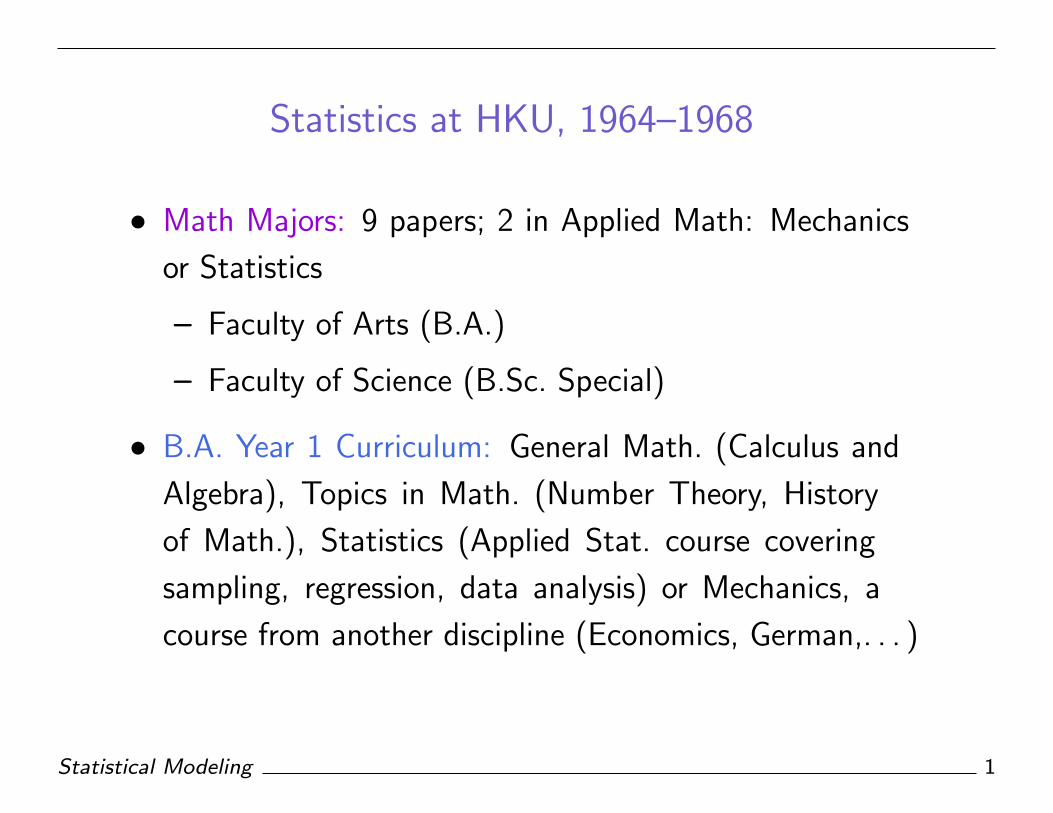
Statistics at HKU, 1964–1968
• Math Majors: 9 papers; 2 in Applied Math: Mechanics
or Statistics
– Faculty of Arts (B.A.)
– Faculty of Science (B.Sc. Special)
• B.A. Year 1 Curriculum: General Math. (Calculus and
Algebra), Topics in Math. (Number Theory, History
of Math.), Statistics (Applied Stat. course covering
sampling, regression, data analysis) or Mechanics, a
course from another discipline (Economics, German,. . . )
Statistical Modeling 1

• Summer project in 1965: An Econ classmate who took
1st year Stat. course organized a team to design and
conduct a sample survey on telephone use and charges.
– No statistical software or computer hardware
– Resource and time constraints put severe limits on sample
size (substantial variance)
– High non-response rates (potential bias)
– Aware of geographical sampling but ignorant of
geostatistics
– Disconnect between subject-matter knowledge (and how
the survey results were supposed to be used) and survey
design and analysis
Statistical Modeling 2
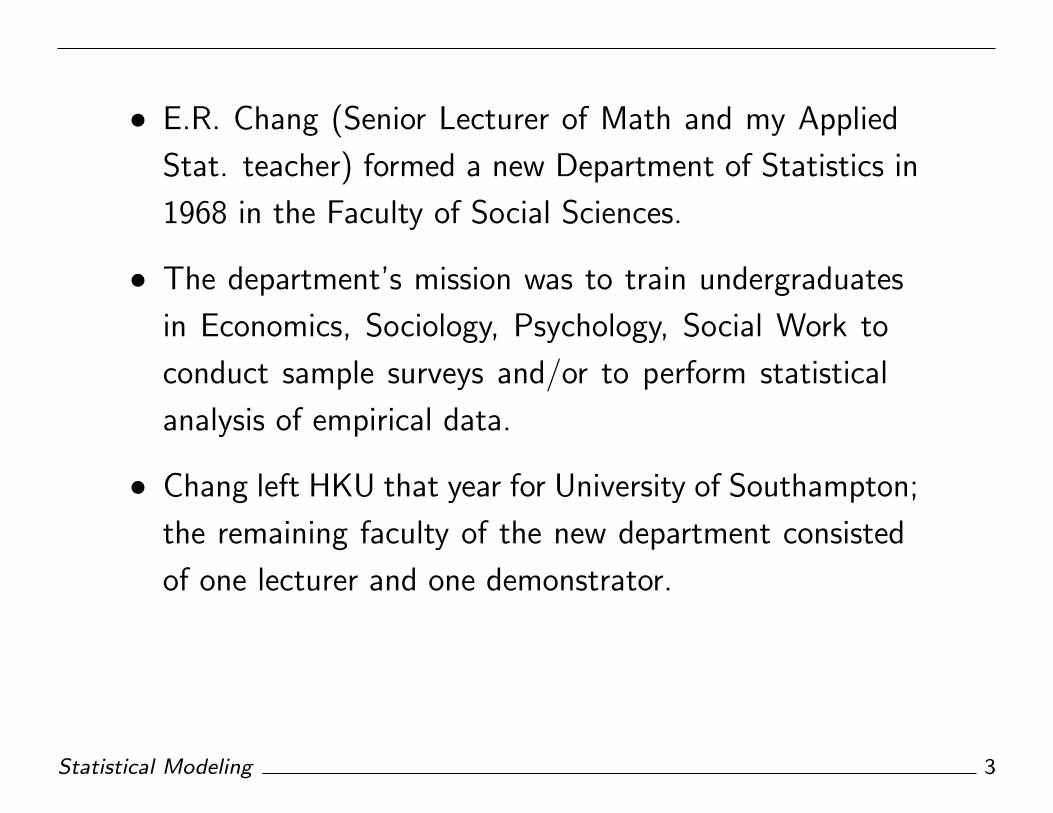
• E.R. Chang (Senior Lecturer of Math and my Applied
Stat. teacher) formed a new Department of Statistics in
1968 in the Faculty of Social Sciences.
• The department’s mission was to train undergraduates
in Economics, Sociology, Psychology, Social Work to
conduct sample surveys and/or to perform statistical
analysis of empirical data.
• Chang left HKU that year for University of Southampton;
the remaining faculty of the new department consisted
of one lecturer and one demonstrator.
Statistical Modeling 3
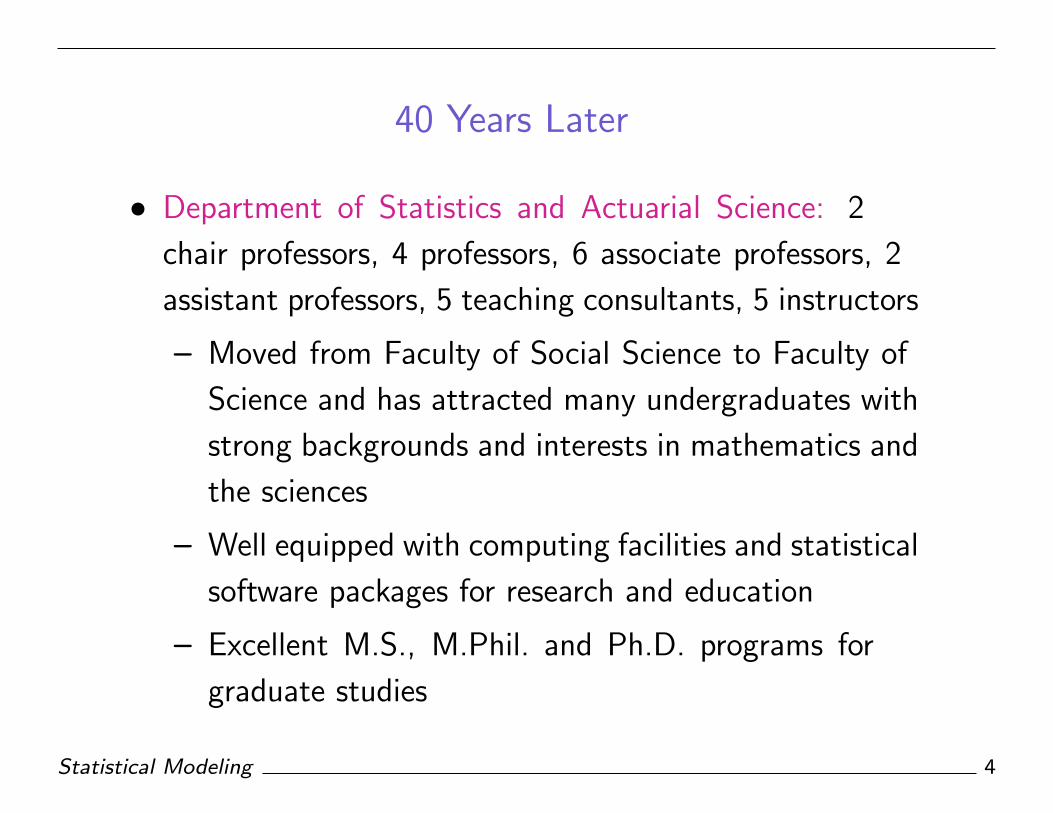
40 Years Later
• Department of Statistics and Actuarial Science: 2
chair professors, 4 professors, 6 associate professors, 2
assistant professors, 5 teaching consultants, 5 instructors
– Moved from Faculty of Social Science to Faculty of
Science and has attracted many undergraduates with
strong backgrounds and interests in mathematics and
the sciences
– Well equipped with computing facilities and statistical
software packages for research and education
– Excellent M.S., M.Phil. and Ph.D. programs for
graduate studies
Statistical Modeling 4
– Scope has extended to include actuarial science, risk
management and quantitative finance
– Strong alumni network and outreach to industry and
government
• Hal Varian, chief economist at Google: “I keep saying
that the sexy job in the next 10 years will be statisticians.
And I’m not kidding.”
• The New York Times (August 6, 2009): “For Today’s
Graduate, Just One Word: Statistics”
– “The rising stature of statisticians, who can earn
$125,000 at top companies in their first year after
getting a doctorate, is a recent explosion of digital
Statistical Modeling 5
data. In field after field, computing and the Web
are creating new realms of data to explore — sensor
signals, surveillance tapes, social network chatter,
public records and more. And the digital data surge
only promises to accelerate, rising five-fold by 2012,
according to a projection by IDC, a research firm.”
– “Even the recently ended Netflix contest, which
offered $1 million to anyone who could significantly
improve the company’s movie recommendation
system, was a battle waged with the weapons of
modern statistics.”
Statistical Modeling 6
– “I.B.M., seeing an opportunity in data-hunting ser-
vices, created a Business Analytics and Optimization
Services group in April. The unit will tap the expertise
of the more than 200 mathematicians, statisticians
and other data analysts in its research labs — but
the number is not enough. I.B.M. plans to retrain or
hire 4,000 more analysts across the company.”
– “If the data explosion magnifies longstanding issues
in statistics, it also opens up new frontiers.”
Statistical Modeling 7
Data Mining and Statistical Learning
• Data mining: Extract important patterns from data
– Challenges in data storage, organization and compu-
tational problems (Computer Science)
– Challenges in extracting patterns (AI/Machine learn-
ing, Statistics)
• Statistical learning: Uses statistical models to learn
patterns and trends from data
– Supervised learning: Goal is to predict the value of
an outcome measure based on a number of input
variables, as in regression, classification, model
selection and averaging
Statistical Modeling 8
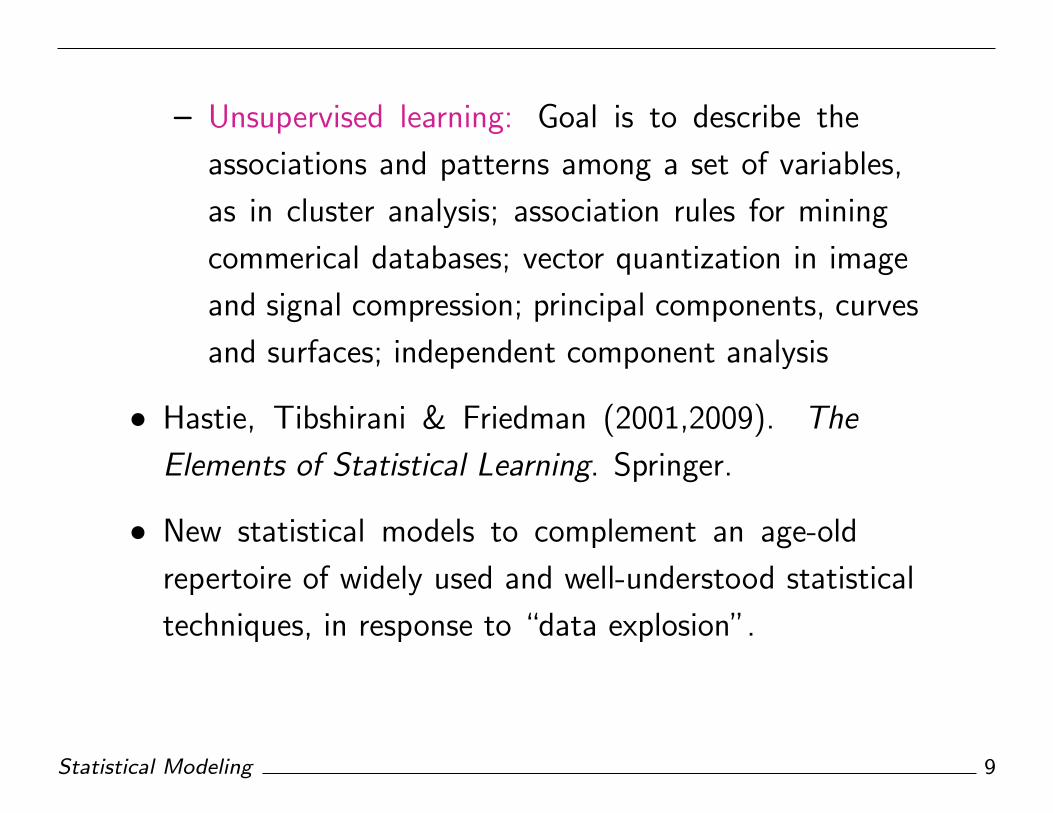
– Unsupervised learning: Goal is to describe the
associations and patterns among a set of variables,
as in cluster analysis; association rules for mining
commerical databases; vector quantization in image
and signal compression; principal components, curves
and surfaces; independent component analysis
• Hastie, Tibshirani & Friedman (2001,2009). The
Elements of Statistical Learning. Springer.
• New statistical models to complement an age-old
repertoire of widely used and well-understood statistical
techniques, in response to “data explosion”.
Statistical Modeling 9

Example: High-Dimensional Sparse Regression Models
• As an illustration, consider the linear regression model
yt = α + β1xt1 + · · · + βpxtp + εt (t = 1, . . . ,n)
in which εt represent random, unobserved disturbances
with E(εt) = 0.
• Estimation of the regression parameters α, β1, . . . , βp
is an age-old topic now often taught in introductory
statistics courses.
• It became a hot topic again in the last decade, in
response to data explosion that results in p (# of input
variables) considerably larger than n (sample size).
Statistical Modeling 10
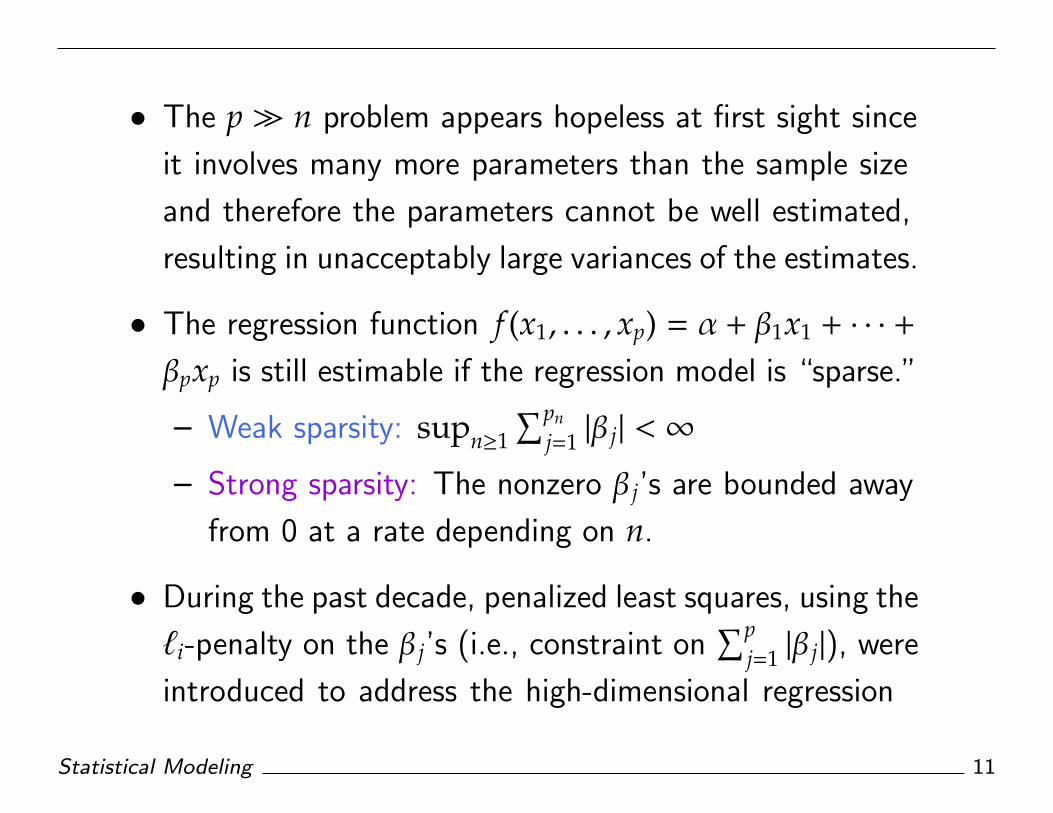
• The p� n problem appears hopeless at first sight since
it involves many more parameters than the sample size
and therefore the parameters cannot be well estimated,
resulting in unacceptably large variances of the estimates.
• The regression function f (x1, . . . , xp) = α + β1x1 + · · · +
βpxp is still estimable if the regression model is “sparse.”
– Weak sparsity: supn≥1
∑pn
j=1 |β j| < ∞
– Strong sparsity: The nonzero β j’s are bounded away
from 0 at a rate depending on n.
• During the past decade, penalized least squares, using the
`i-penalty on the β j’s (i.e., constraint on∑p
j=1 |β j|), were
introduced to address the high-dimensional regression
Statistical Modeling 11
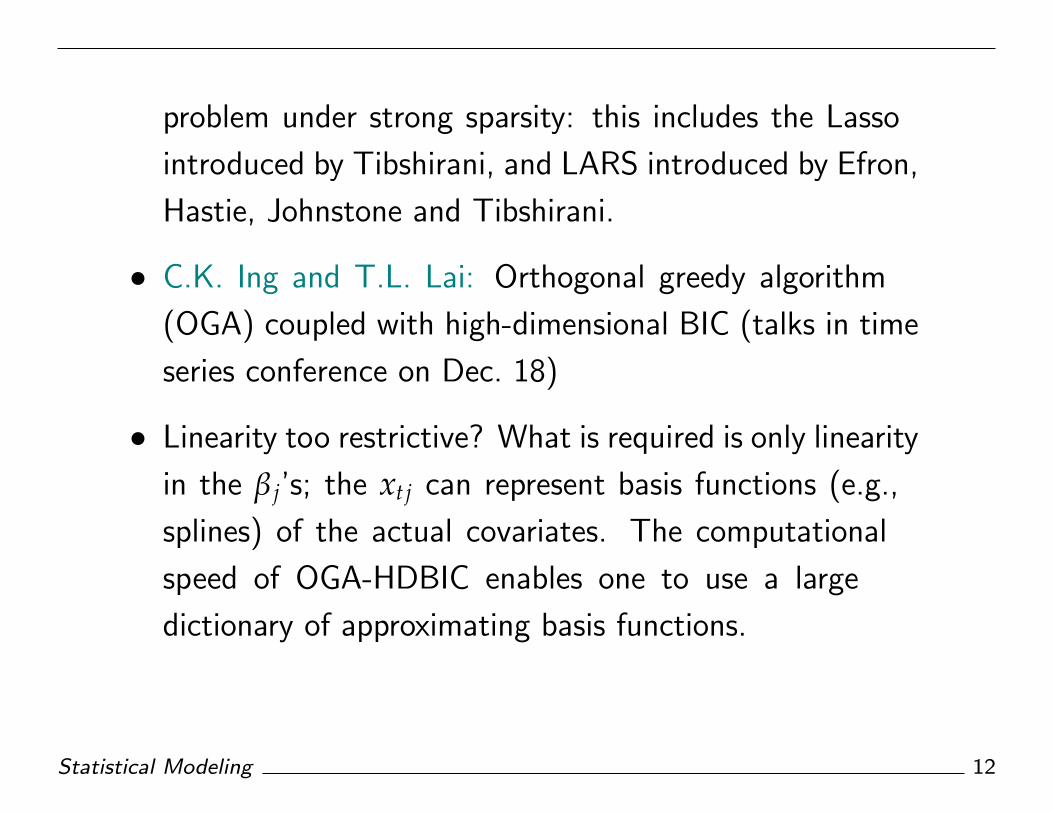
problem under strong sparsity: this includes the Lasso
introduced by Tibshirani, and LARS introduced by Efron,
Hastie, Johnstone and Tibshirani.
• C.K. Ing and T.L. Lai: Orthogonal greedy algorithm
(OGA) coupled with high-dimensional BIC (talks in time
series conference on Dec. 18)
• Linearity too restrictive? What is required is only linearity
in the β j’s; the xt j can represent basis functions (e.g.,
splines) of the actual covariates. The computational
speed of OGA-HDBIC enables one to use a large
dictionary of approximating basis functions.
Statistical Modeling 12
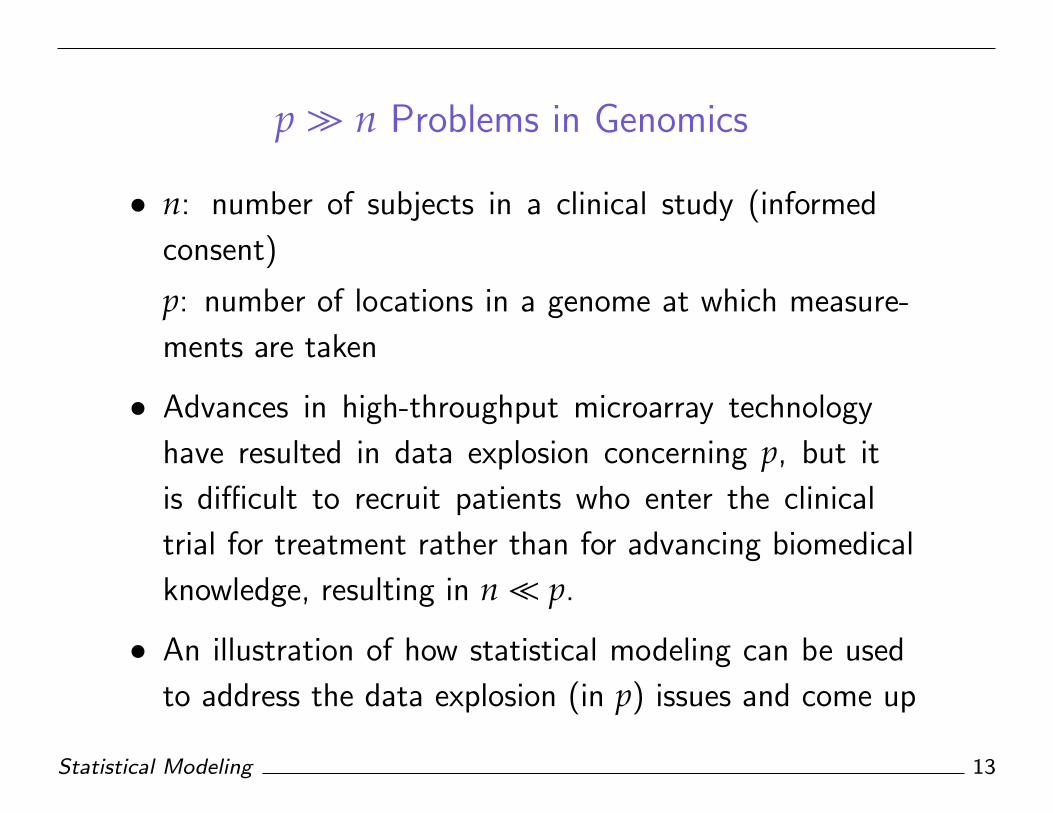
p� n Problems in Genomics
• n: number of subjects in a clinical study (informed
consent)
p: number of locations in a genome at which measure-
ments are taken
• Advances in high-throughput microarray technology
have resulted in data explosion concerning p, but it
is difficult to recruit patients who enter the clinical
trial for treatment rather than for advancing biomedical
knowledge, resulting in n� p.
• An illustration of how statistical modeling can be used
to address the data explosion (in p) issues and come up
Statistical Modeling 13
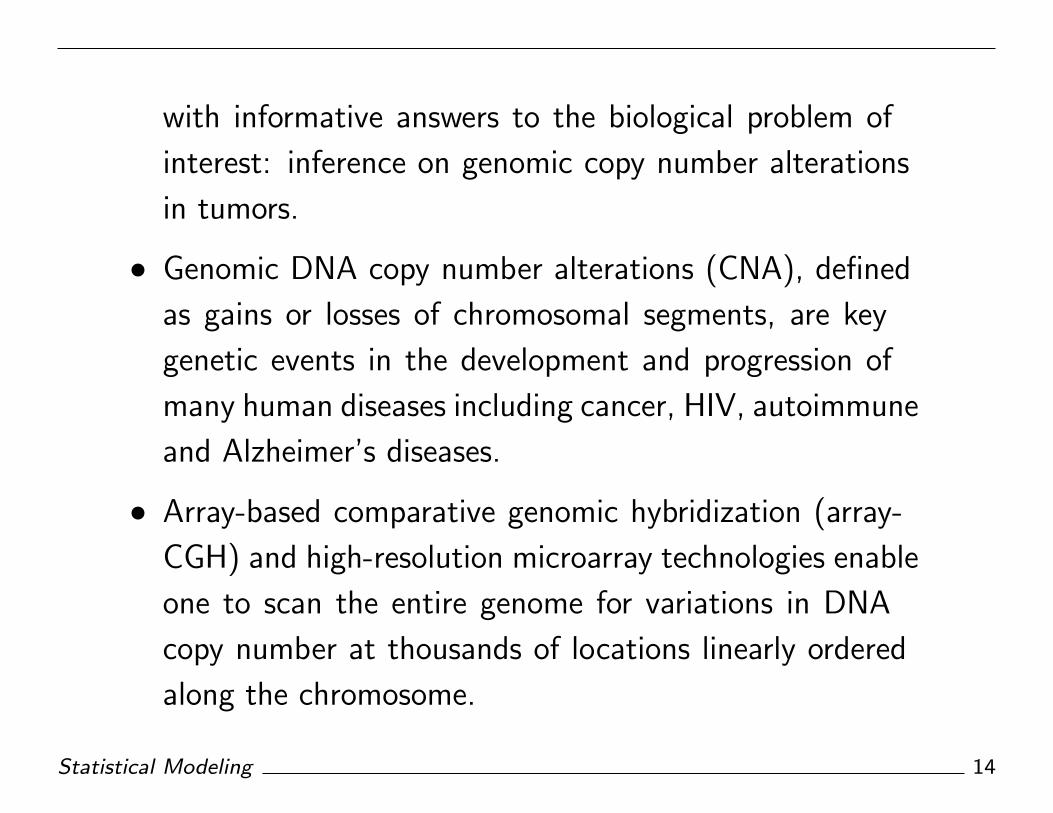
with informative answers to the biological problem of
interest: inference on genomic copy number alterations
in tumors.
• Genomic DNA copy number alterations (CNA), defined
as gains or losses of chromosomal segments, are key
genetic events in the development and progression of
many human diseases including cancer, HIV, autoimmune
and Alzheimer’s diseases.
• Array-based comparative genomic hybridization (array-
CGH) and high-resolution microarray technologies enable
one to scan the entire genome for variations in DNA
copy number at thousands of locations linearly ordered
along the chromosome.
Statistical Modeling 14

What is DNA Copy Number?
Statistical Modeling 15

Inherited Variations in DNA Copy Number
CNV in natural population may be risk factors for diseases.
(220 samples, 1 million locations on 23 chromosomes)
Statistical Modeling 16
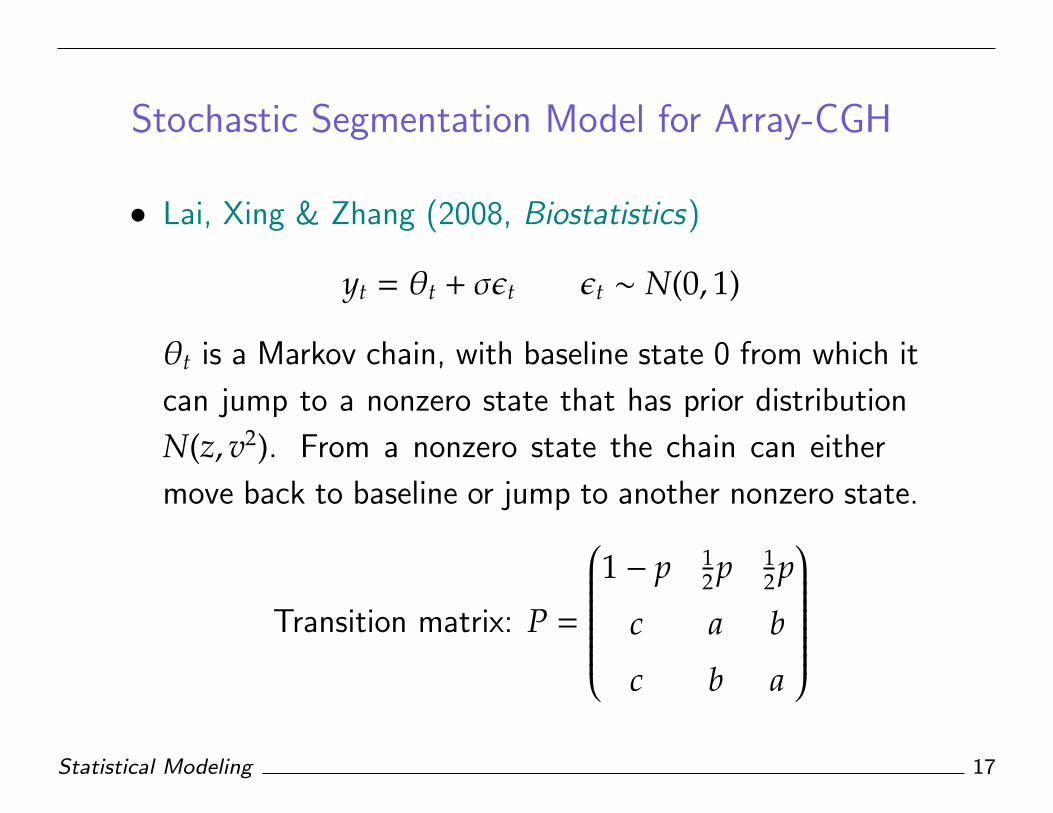
Stochastic Segmentation Model for Array-CGH
• Lai, Xing & Zhang (2008, Biostatistics)
yt = θt + σεt εt ∼ N(0, 1)
θt is a Markov chain, with baseline state 0 from which it
can jump to a nonzero state that has prior distribution
N(z, v2). From a nonzero state the chain can either
move back to baseline or jump to another nonzero state.
Transition matrix: P =
1 − p 1
2p 12p
c a b
c b a
Statistical Modeling 17
• This is a hidden Markov model (HMM) with hidden
state θt yielding explicit recursive formulas for the HMM
filters and smoothers.
• Fast BCMIX approximation to filters and smoothers (Lai
& Xing, 2009).
Statistical Modeling 18
Generalized Stochastic Segmentation Models
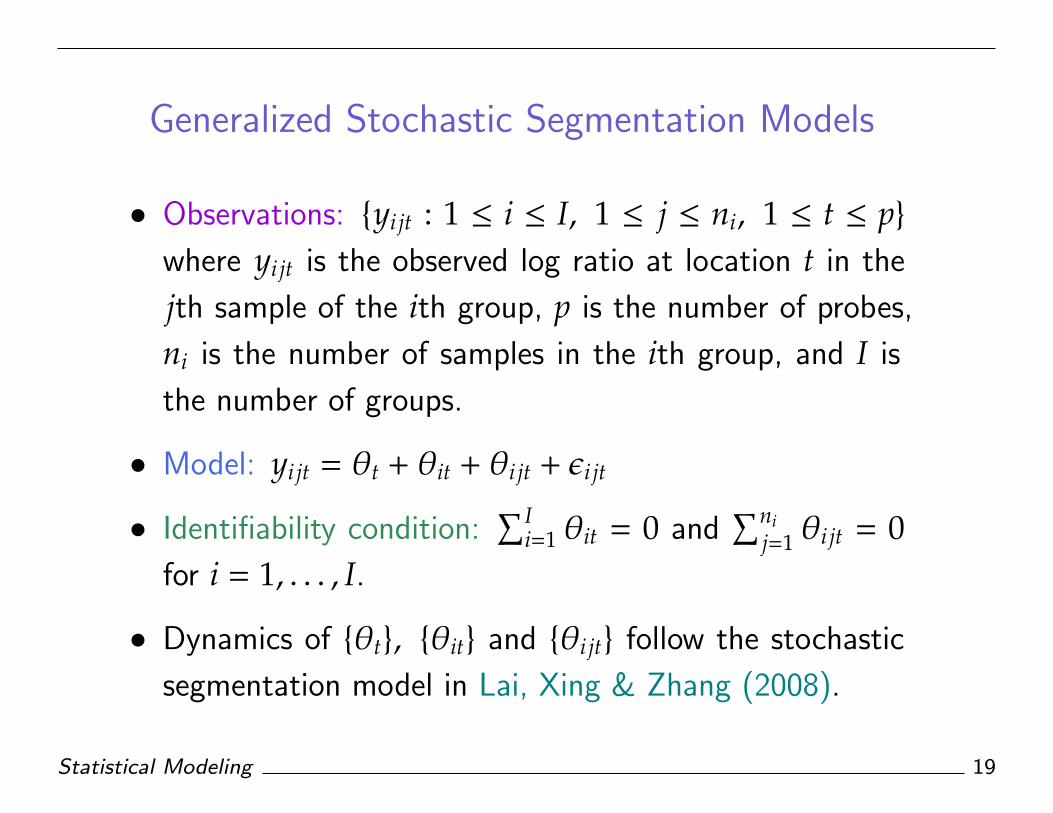
• Observations: {yi jt : 1 ≤ i ≤ I, 1 ≤ j ≤ ni, 1 ≤ t ≤ p}where yi jt is the observed log ratio at location t in the
jth sample of the ith group, p is the number of probes,
ni is the number of samples in the ith group, and I is
the number of groups.
• Model: yi jt = θt + θit + θi jt + εi jt
• Identifiability condition:∑I
i=1 θit = 0 and∑ni
j=1 θi jt = 0for i = 1, . . . , I.
• Dynamics of {θt}, {θit} and {θi jt} follow the stochastic
segmentation model in Lai, Xing & Zhang (2008).
Statistical Modeling 19

Estimated overall and group-specific differences from overall mean with
95% confidence bands for Nakao et al. (2004) data (red curve: esti-
mated signals; blue: 95% confidence band; green: level 0).
Statistical Modeling 20
From Bench to Bedside: Statistical Methods andModels in Clinical and Translational Research
• The clinical goal of genomic studies (such as array-CGH)
is to use genomic information to develop treatments for
diseases.
• “From bench to bedside,” a maxim of translational
medical research, reflects the sequential nature of the
experiments involved.
• “Bench” refers to laboratory experiments to study new
biochemical principles and discover novel treatments.
Statistical Modeling 21

• The experiments with promising results are followed by
pre-clinical animal studies.
• After understanding the effect of the treatment on
animals (e.g., rodents), the next stage of drug develop-
ment consists of clinical trials involving human subjects,
starting with Phase I studies to determine a safe dose
or dosage regimen and/or to collect information on the
pharmacokinetics (PK) and pharmacodynamics (PD) of
the drug.
– Population PK/PD in clinical pharmacology uses nonlinear
mixed effects models (NONMEM) in statistics.
– Lai, Shih & Wong (2006, PK/PD J.)
Statistical Modeling 22
• Phase II trials are precursors of Phase III trials. Their
goal is to demonstrate the effectiveness of the drug
for its approval by the regulatory agency (FDA) and to
provide adequate evidence for its labeling.
– The evidence of effectiveness is often required to be based
on two pivotal Phase III trials.
– Phase III trials also collect safety information from the
relatively large samples of patients accrued to the trial.
• Safety of the drug is evaluated from data obtained
from all three phases of clinical trials prior to marketing
approval of the drug, and continues to be evaluated
through post-marketing Phase IV trials.
Statistical Modeling 23
• Despite the sequential nature of Phase I–III trials, trials
are often planned separately, treating each trial as an
independent study whose design depends on results from
studies in previous phases.
• The need for innovative study designs to better integrate
the phases is now widely recognized, as are statistical
methodologies for (a) group sequential and adaptive
designs of clinical trials and (b) analysis of data from
these trials.
• A mission of CISD (Center for Innovative Study Designs)
at Stanford is to develop these statistical methodologies
in collaboration with clinical researchers and to provide
consulting and software for their implementation.
Statistical Modeling 24
• There has been considerable progress in the past 5
years towards this goal and the innovative study designs
and underlying statistical theories and models are
summarized in the forthcoming book from Springer,
Sequential Experimentation in Clinical Trials: Design
and Analysis, J. Bartroff, T.L. Lai & M.C. Shih (2010).
• Besides the biomedical background and the ethical and
economic issues in planning pharmaceutical trials, the
book also covers statistical methods and models in se-
quential analysis, experimental design, survival analysis,
and likelihood, Bayesian and resampling approaches to
statistical inference.
Statistical Modeling 25

Filtering and Control of Dynamic Systems
• Other natural sciences besides biology that make use of
statistical modeling and in turn have led to new classes
of statistical models and methods include:
– Physics (statistical mechanics: Ising model, perco-
lation theory, phase transitions, spin glass models,
chaotic systems);
– Chemistry (kinetics, ligand binding, nano-chemistry,
self-avoiding random walks, Metropolis’ Monte Carlo
scheme/MCMC);
– Earth sciences (meteorology, climate change, earth-
quake prediction, geostatistics, spatial statistics)
Statistical Modeling 26
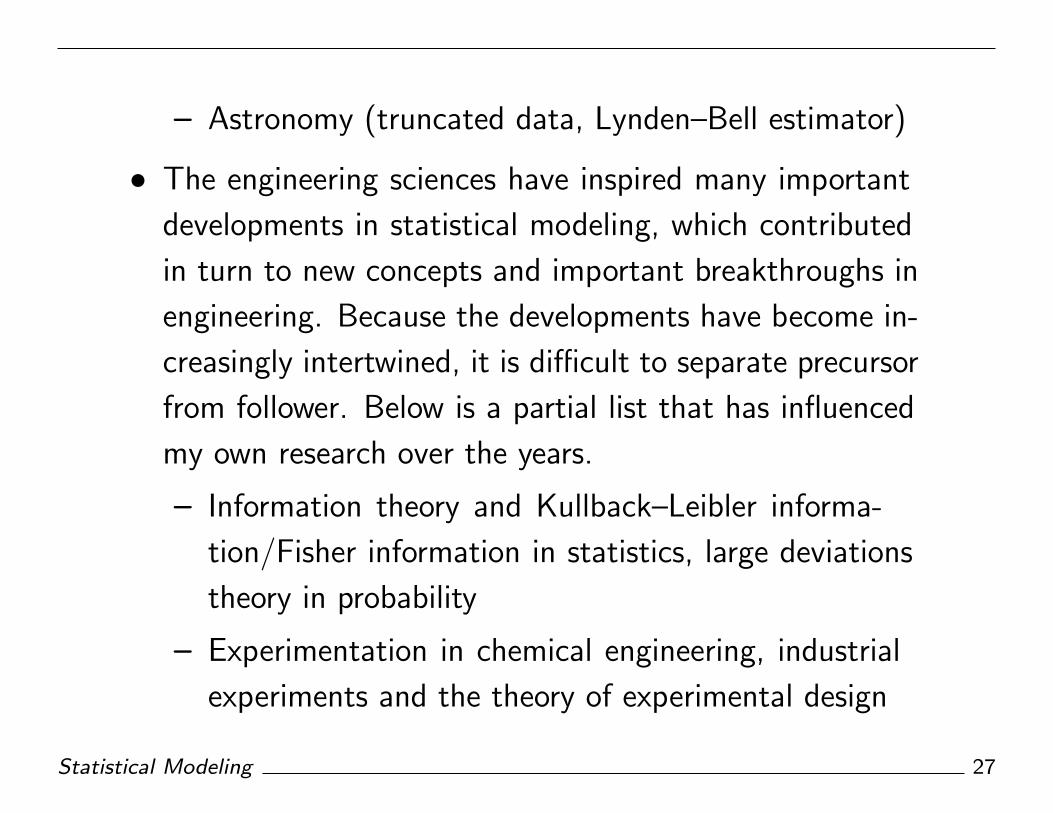
– Astronomy (truncated data, Lynden–Bell estimator)
• The engineering sciences have inspired many important
developments in statistical modeling, which contributed
in turn to new concepts and important breakthroughs in
engineering. Because the developments have become in-
creasingly intertwined, it is difficult to separate precursor
from follower. Below is a partial list that has influenced
my own research over the years.
– Information theory and Kullback–Leibler informa-
tion/Fisher information in statistics, large deviations
theory in probability
– Experimentation in chemical engineering, industrial
experiments and the theory of experimental design
Statistical Modeling 27
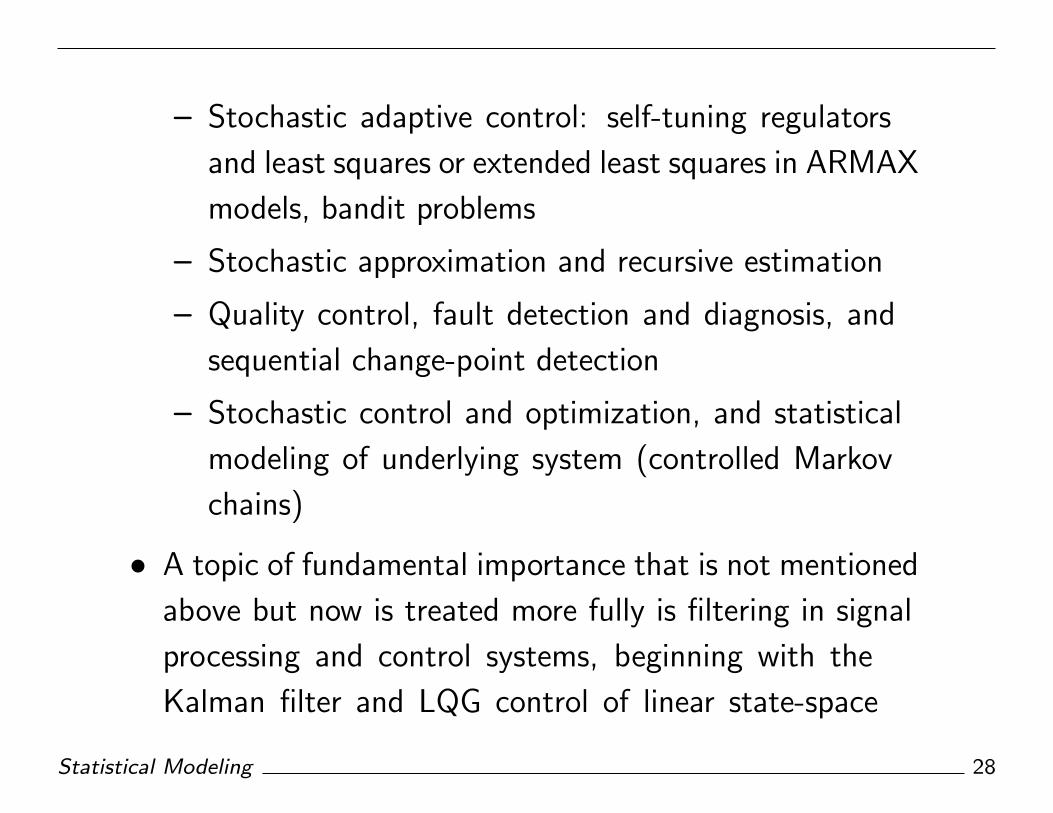
– Stochastic adaptive control: self-tuning regulators
and least squares or extended least squares in ARMAX
models, bandit problems
– Stochastic approximation and recursive estimation
– Quality control, fault detection and diagnosis, and
sequential change-point detection
– Stochastic control and optimization, and statistical
modeling of underlying system (controlled Markov
chains)
• A topic of fundamental importance that is not mentioned
above but now is treated more fully is filtering in signal
processing and control systems, beginning with the
Kalman filter and LQG control of linear state-space
Statistical Modeling 28
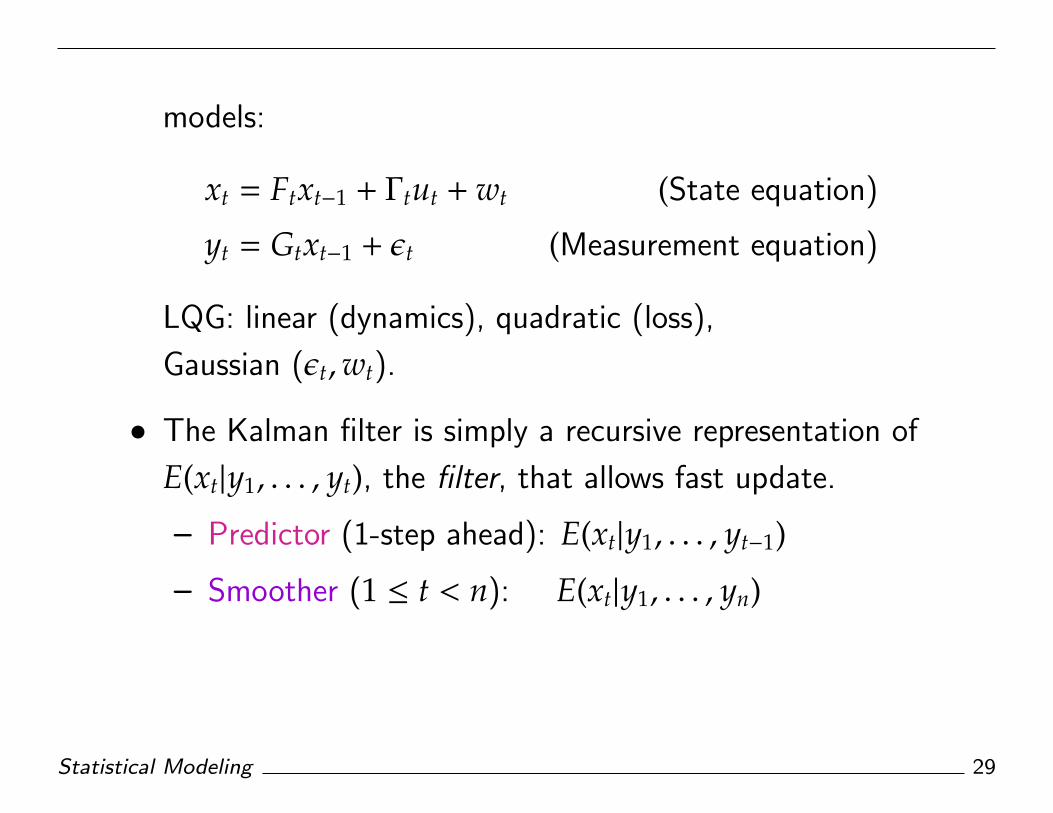
models:
xt = Ftxt−1 + Γtut + wt (State equation)
yt = Gtxt−1 + εt (Measurement equation)
LQG: linear (dynamics), quadratic (loss),
Gaussian (εt,wt).
• The Kalman filter is simply a recursive representation of
E(xt|y1, . . . , yt), the filter, that allows fast update.
– Predictor (1-step ahead): E(xt|y1, . . . , yt−1)
– Smoother (1 ≤ t < n): E(xt|y1, . . . , yn)
Statistical Modeling 29
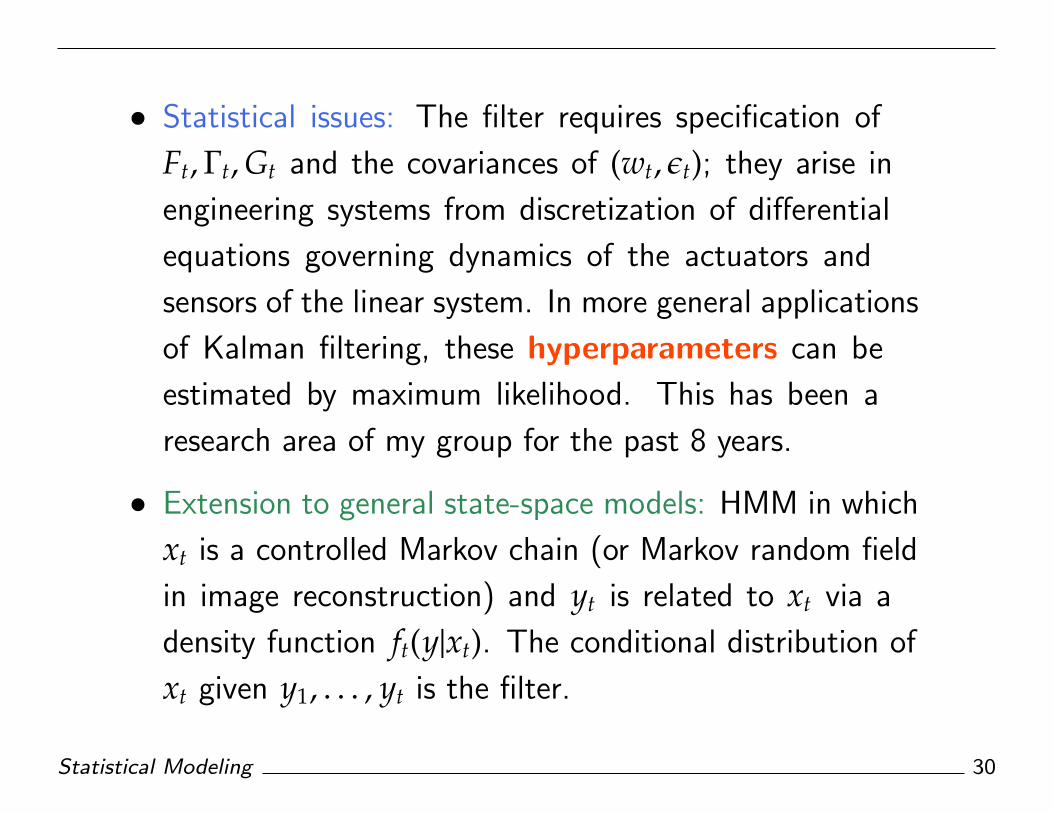
• Statistical issues: The filter requires specification of
Ft,Γt,Gt and the covariances of (wt, εt); they arise in
engineering systems from discretization of differential
equations governing dynamics of the actuators and
sensors of the linear system. In more general applications
of Kalman filtering, these hyperparameters can be
estimated by maximum likelihood. This has been a
research area of my group for the past 8 years.
• Extension to general state-space models: HMM in which
xt is a controlled Markov chain (or Markov random field
in image reconstruction) and yt is related to xt via a
density function ft(y|xt). The conditional distribution of
xt given y1, . . . , yt is the filter.
Statistical Modeling 30

• Important breakthroughs in nonlinear filtering during the
past decade came from the engineering and statistics
communities, including sequential importance sampling
with resampling (particle filters), asymptotic stability
of the filters, and efficient hyperparameter estimation.
These breakthroughs have in turn led to advances in
image reconstruction, robotics and wireless communica-
tion.
Statistical Modeling 31

p� n Revisited: Portfolio Theory
• A fundamental problem in financial economics is portfolio
theory, namely, now to form a portfolio of investments to
optimize (in some sense) the portfolio return. Markowitz
(1952, J. Finance) provided a solution to this problem
by choosing portfolio weights that minimize the variance
of the return for a future period subject to the constraint
that the mean return attains a given target value µ.
Letting µ change over all possible target values yields
the so-called efficient frontier.
• Markowitz’s mean-variance portfolio optimization theory
assumes the means and covariances of the underlying
Statistical Modeling 32
asset returns are known. In practice, they are unknown
and have to be estimated from historical data.
• Plugging the estimates into the efficient frontier that
assumes known parameters has led to portfolios that
may perform poorly and have counter-intuitive asset
allocation weights. This has been referred to as the
Markowitz optimization enigma.
• One of the statistical issues noted in recent literature is
the p � n problem: there is a large number p of assets
(stocks) to choose from in forming the portfolio but one
has to use a moving window of historical data because
of possible structural change over time.
Statistical Modeling 33
• Chapters 3 and 4 of Lai and Xing’s book Statistical
Models and Methods for Financial Markets (2008,
Springer) review different approaches to address these
difficulties and suggest a new approach that resolves the
root cause of the enigma.
• We have recently completed the work to implement
this approach and have studied its performance on
simulated and empirical data. Not only is the new
approach shown to provide substantial improvements
over previous methods, but it also allows flexible modeling
to incorporate dynamic features in the training sample
of historical data and in forecasting the levels and
volatilities of future returns.
Statistical Modeling 34
Statistical Modeling in Finance and Concluding Remarks
• Besides portfolio theory, our book covers other funda-
mental topics of quantitative finance and focuses on
statistical models and methods. These topics include
option pricing, interest rate derivatives, high-frequency
trading and transactions data, algorithmic trading, sta-
tistical arbitrage and risk management. It advocates a
substantive/empirical approach that combines subject-
matter theory (domain knowledge) with statistical
(empirical) modeling.
Statistical Modeling 35
• The book was finished prior to the meltdown of the
financial market starting with Bear Stearns in March.
On the other hand, the omen was there and certain
sections were written in anticipation of potential trouble.
• We are writing our second book that brings in statistical
models and methods for sequential surveillance and
early warning systems in the aftermath of the financial
crisis: Lai and Xing (2011), Active Risk Management:
Financial Models and Statistical Methods, Chapman &
Hall/CRC.
Statistical Modeling 36
• Statistical modeling has evolved greatly from 40 years
ago when I was first exposed to the subject. Integrating
it into technological and scientific advances will further
broaden its usefulness and vibrancy.
Statistical Modeling 37