Embed Size (px)
Citation preview
Standard Title Page - Report on State Project Report No.
Report Date
No. Pages
Type Report: Final
Project No.: 73849
VTRC 05-R31 June 2005 36 Period Covered: August 2003-April 1, 2005
Contract No.
Title: Use of Soil Stabilizers on Highway Shoulders
Key Words: shoulders, soil stabilizers, soil additives, aggregates, shoulder reclaimer, pavement edge drop-off
Author: Daniel S. Roosevelt, P.E.
Performing Organization Name and Address: Virginia Transportation Research Council 530 Edgemont Road Charlottesville, VA 22903
Sponsoring Agencies’ Name and Address Virginia Department of Transportation 1401 E. Broad Street Richmond, VA 23219
Supplementary Notes
Abstract This study evaluated soil additives as stabilizers for aggregate and topsoil shoulders. Its purpose was to determine (1) the effect soil stabilizers have on the strength and stability of soil shoulders, and (2) the costs and benefits of using stabilizers versus paving the shoulder or maintaining the shoulder as originally composed. The study used test and control sections to assess two stabilization products, Soiltac and Centrophase AD, used with one type of shoulder material (crusher run stone). The experimental sections were installed at one location along a primary highway in Virginia.
The investigator concluded that soil stabilizers mixed with crusher run stone do not increase the stiffness or bearing strength of the shoulder material or prolong the period of optimum strength. Data were insufficient to determine if soil stabilizers improve the resistance of the surface to erosion by water or traffic, but a cost-benefit comparison indicated that the use of the stabilizers is not a cost-effective substitute for proper design or preventive maintenance practices.
FINAL REPORT
USE OF SOIL STABILIZERS ON HIGHWAY SHOULDERS
Daniel S. Roosevelt, P.E. Research Scientist
Virginia Transportation Research Council (A Cooperative Organization Sponsored Jointly by the
Virginia Department of Transportation and the University of Virginia)
Charlottesville, Virginia
June 2005
VTRC 05-R31
ii
DISCLAIMER
The contents of this report reflect the views of the author, who is responsible for the facts and the accuracy of the data presented herein. The contents do not necessarily reflect the official views or policies of the Virginia Department of Transportation, the Commonwealth Transportation Board, or the Federal Highway Administration. This report does not constitute a standard, specification, or regulation.
Copyright 2005 by the Commonwealth of Virginia.
iii
ABSTRACT
This study evaluated soil additives as stabilizers for aggregate and topsoil shoulders. Its purpose was to determine (1) the effect soil stabilizers have on the strength and stability of soil shoulders, and (2) the costs and benefits of using stabilizers versus paving the shoulder or maintaining the shoulder as originally composed. The study used test and control sections to assess two stabilization products, Soiltac and Centrophase AD, used with one type of shoulder material (crusher run stone). The experimental sections were installed at one location along a primary highway in Virginia.
The investigator concluded that soil stabilizers mixed with crusher run stone do not
increase the stiffness or bearing strength of the shoulder material or prolong the period of optimum strength. Data were insufficient to determine if soil stabilizers improve the resistance of the surface to erosion by water or traffic, but a cost-benefit comparison indicated that the use of the stabilizers is not a cost-effective substitute for proper design or preventive maintenance practices.
FINAL REPORT
USE OF SOIL STABILIZERS ON HIGHWAY SHOULDERS
Daniel S. Roosevelt, P.E. Research Scientist
INTRODUCTION
In 2004, the Virginia General Assembly (HB5001, Item 487B) directed the following: (T)he Department of Transportation, through the Virginia Transportation Research Council, shall allocate such amounts as may be required to study the use of soil stabilizers in highway shoulders at one or more selected locations. In conducting its evaluation, the Council shall include a cost/benefit analysis, with the objective of finding a method of substantially reducing the occurrence of pavement/shoulder drop-off at a reasonable cost. Findings of the evaluation shall be reported to the Chairmen of the House Appropriations and Senate Finance Committees no later than January 1, 2005.
The period between the passage of HB5001 and the reporting date specified in the bill did not allow for a full evaluation. An interim report was made to the General Assembly in advance of the January 1, 2005, date.
Low shoulders can occur for a number of reasons, but the three most common are (1) traffic action, (2) erosion caused by concentrated flow of water, and (3) resurfacing that raises the elevation of the pavement. The first two are considered maintenance related in that the low shoulder condition usually develops over time. The third is construction related as the condition occurs because of a planned activity. In the first two cases, the ability of the shoulder to resist the deterioration that results in pavement/shoulder drop-off is affected by its durability and load-carrying capacity (strength). The third situation is a scheduling issue and is not the concern of this study. The source of the problem referenced in the legislation concerns the strength and stability of soils. The adage that a pavement is only as good as its foundation applies to unpaved shoulders as well. These characteristics of soils, from micaous clays to crushed stone, vary widely and are further strongly influenced by the amount of moisture present. The research question, then, is: Can soil additives improve the bearing strength and surface stability of soils shoulders and can they do so cost-effectively?
PURPOSE AND SCOPE
This project evaluated soil additives as stabilizers for aggregate shoulders. The purpose
of the study was to determine (1) the effect soil stabilizers have on the strength and stability of

2
shoulders, and (2) the costs and benefits of using stabilizers versus paving the shoulder or maintaining the shoulder as originally composed.
This project comprised a field study; no laboratory analysis of stabilizers was involved.
The study looked at two soil stabilizers, Soiltac and Centrophase AD, used with one type of shoulder material (crusher run stone). The experimental sections were installed at one location along a primary highway in Virginia.
METHODOLOGY
Experimental Design
The Virginia Transportation Research Council (VTRC) has previously studied stabilization techniques on unpaved roads (Bushman et al., 2004). The study evaluated a number of soil stabilization additives along a single secondary system gravel road using a test and control process. The results indicated that to be most effective, the additives tested should be deeply mixed with the aggregate and compacted. This process is known as full-depth reclamation (FDR). No evaluation of individual stabilizers was included in the report; however, assessment of the stabilizers is ongoing. Preliminary results on product performance were obtained from the authors and were used to choose products for evaluation in this study.
This study used test and control sections to evaluate the stabilization products and
process. The test sections were 500 ft in length and ran along one side of the road within a test site. A control section, consisting of similar material but without the stabilizers, was included as a nearby section.
Five tasks were carried out to achieve the objectives of this study: 1. literature review 2. site selection 3. product selection 4. construction of test section 5. performance evaluation.
Literature Review
A literature search was conducted for information and studies concerning treating shoulders using soil stabilizers. The focus was (1) life of the treatment and (2) cost-benefit information on various shoulder stabilization strategies. The search included an Internet search, using Google, and the web-based library search engines TRANSPORT, TRANWeb, Conference Papers, Index Papers First, and WorldCat.
3
Site Selection
The sites for the test and control sections needed to be locations with a history of low shoulders. In 2003, the Virginia Department of Transportation’s (VDOT) Asset Management Division evaluated more than 9,000 sites as part of a random condition assessment (RCA). Individual sample sites were 0.1 mi in length. The evaluation rated the condition of assets at each site. For most assets, the assessment process uses a pass/fail test to determine if the asset is acceptably maintained. The RCA uses 1.5 in as the pass/fail criterion for determining low shoulders.
Sample sites where the shoulder was equal to or more than 1.5 in lower than the pavement comprised 22.6% of the unpaved shoulder samples. Although numerous RCA sample sites met this criterion, a site with a low shoulder was chosen in the Richmond District to take advantage of a VDOT hired equipment contract for the Wirtgen Road Reclaimer. This machine can meter liquids into in-place earth and road base materials as it scarifies and mixes the materials. More information on the machine and the procedure is provided in “Construction of Test Section.”
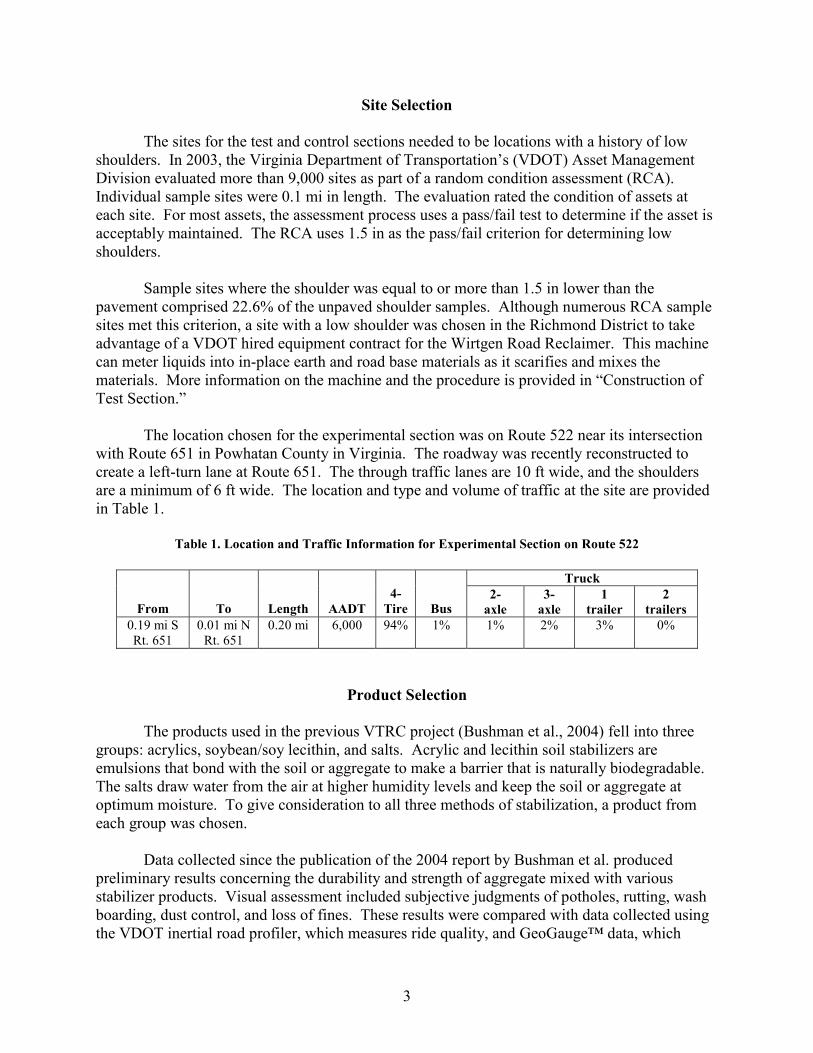
The location chosen for the experimental section was on Route 522 near its intersection with Route 651 in Powhatan County in Virginia. The roadway was recently reconstructed to create a left-turn lane at Route 651. The through traffic lanes are 10 ft wide, and the shoulders are a minimum of 6 ft wide. The location and type and volume of traffic at the site are provided in Table 1.
Table 1. Location and Traffic Information for Experimental Section on Route 522
Truck
From
To
Length
AADT
4-
Tire
Bus 2-
axle 3-
axle 1
trailer 2
trailers 0.19 mi S Rt. 651
0.01 mi N Rt. 651
0.20 mi 6,000 94% 1% 1% 2% 3% 0%
Product Selection
The products used in the previous VTRC project (Bushman et al., 2004) fell into three groups: acrylics, soybean/soy lecithin, and salts. Acrylic and lecithin soil stabilizers are emulsions that bond with the soil or aggregate to make a barrier that is naturally biodegradable. The salts draw water from the air at higher humidity levels and keep the soil or aggregate at optimum moisture. To give consideration to all three methods of stabilization, a product from each group was chosen.
Data collected since the publication of the 2004 report by Bushman et al. produced preliminary results concerning the durability and strength of aggregate mixed with various stabilizer products. Visual assessment included subjective judgments of potholes, rutting, wash boarding, dust control, and loss of fines. These results were compared with data collected using the VDOT inertial road profiler, which measures ride quality, and GeoGauge™ data, which
4
reflect structural layer stiffness. Based on the preliminary results, Soiltac, Centrophase AD, and magnesium chloride were chosen to represent the acrylic, lecithin, and salt groups, respectively.
Construction of Test Section
Method of Stabilization
Test sections were constructed using the procedure outlined in Bushman et al. (2004). The procedure, used up to this time for roadbed reclaiming, deeply mixes stabilizers into the shoulder material by way of FDR. FDR is a pavement rehabilitation technique in which the surface material and a predetermined portion of the underlying materials are uniformly crushed, pulverized, or blended as a form of in-place recycling. Additional stabilization of the shoulder material can be achieved by mixing additives into the process. Liquid stabilizers can be blended into the soil/aggregate material through the reclaiming machine’s integrated additive injection system during manipulation. FDR was chosen for this project because of its relatively high production rate, the completeness with which the additives are mixed into the shoulder material, and the ability of the reclaimer equipment to monitor the quantity of stabilizer added to the material. Shoulder manipulation was accomplished with a Wirtgen WR 2500 Road Reclaimer and Soil Stabilizer, which incorporates a 690-horsepower, V-12, turbo-charged diesel engine to power a 96-in-wide by 20-in-deep cutting rotor.
The procedure was modified to meet the special conditions of this study. Although the Wirtgen normally mixes a 96-in-wide track, the test sections were set at 36 in wide. This required that the teeth on the rotor be removed from a 5-ft width, leaving only a 3-ft width for cutting. Normally the teeth protect the rotor from damage by loosening the roadway material before the rotor comes in contact with the material. To protect the rotor from damage, the depth of cut for the remaining teeth was set at 4 in. In addition, the direction of travel of the Wirtgen was opposite to the direction of travel of the adjacent traffic lane. This allowed the operator to use the edge of the pavement as a guide for the operation and keep the rotor from contact with the travel lane pavement. Sequence of Work
Prior to FDR and placement of the soil stabilizers, shoulder preparation was required. The existing shoulders were grass covered. Using the shoulders in their natural state, the stabilization process would mix the grass in with the soil and would not allow adequate compaction of the material. The grass was removed 10 to 14 days prior to the start of the reclaiming operation. The grass removal left the shoulders approximately 4 in low at the pavement edge. The shoulders were brought back up to the elevation of the pavement using VDOT specification No. 26 stone and rolled. In keeping with standard maintenance practice, no moisture or compaction testing was undertaken during the operation. The shoulders, after this operation, were visibly firm adjacent to the edge of pavement but softer nearer the ditch line. From that point, the general sequence of activities for stabilization was as follows:
5
1. At the designated staging area, the liquid stabilization product was diluted with water in accordance with the recommendations of the vendor.
2. The stabilization additive was blended into one 3-ft-wide section of shoulder to a
depth of 4 in with the reclaimer.
3. The stabilized area was re-graded with a motor grader to provide proper drainage and shape to the shoulder.
4. The full width of shoulder was compacted with a 13-ton vibratory roller compactor
until the shoulder was visibly firm. No moisture or density testing was undertaken.
5. Liquid stabilization additive was applied topically the entire width of the shoulder in accordance with the vendor’s recommendation.
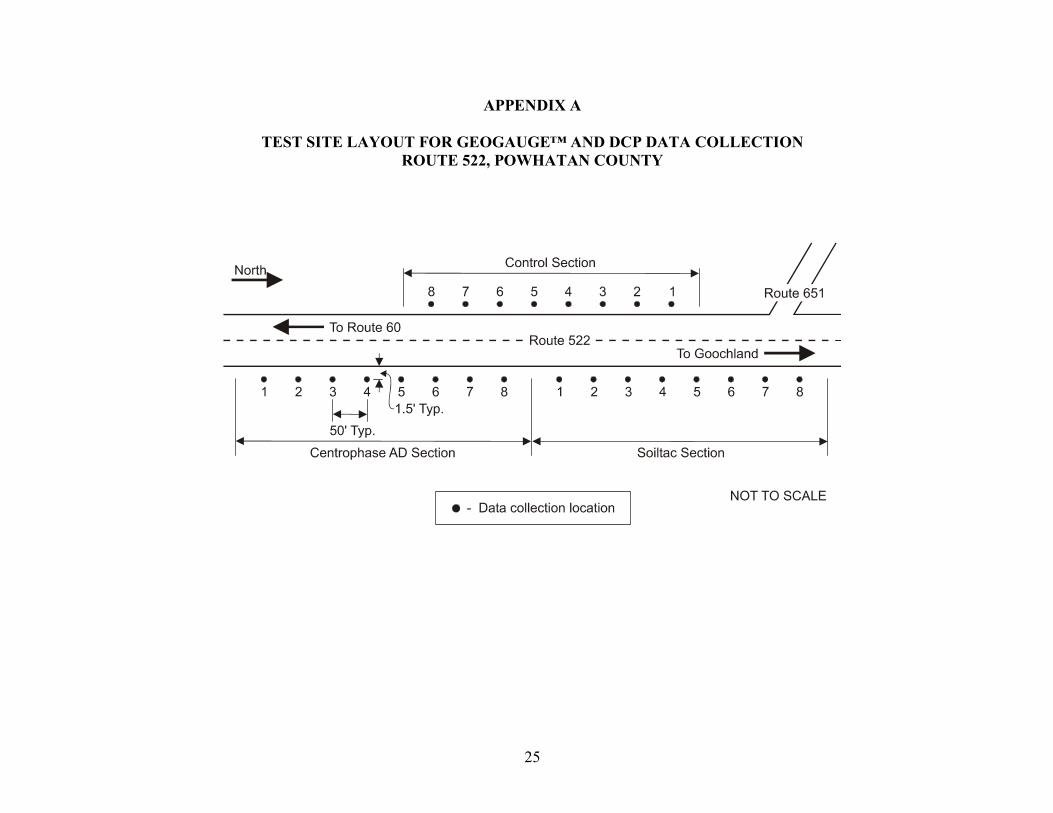
Description of Treatments The soil stabilizers were placed along Route 522 in the locations shown in the sketch in Appendix A. The soil stabilizers used were as follows:
Soiltac. The first test section was stabilized with Soiltac (vinyl acetate copolymer emulsion) on 9/14/2004. The application rate was 0.74 gal/yd2 throughout the 4-in depth. The Soiltac-to-water dilution ratio for stabilization was 1:1.5. No topical solution was used.
Centrophase AD. The second test section was stabilized with Centrophase AD (soy/lecithin emulsion) on 9/14/2004. The application rate was 0.5 gal/yd2 throughout the 4-in depth. The Centrophase AD-to-water dilution ratio for stabilization was 1:2.75. The same dilute emulsion was sprayed topically at a rate of 0.1 gal/yd2.
Magnesium chloride. Because of problems arising during installation of the test sections,
discussed later, magnesium chloride was not applied. The plan was to mix 1 part magnesium chloride concentrate and 3.8 parts water. The brine was to be applied at a rate of 0.5 gal/yd2 throughout the 4-in depth. A topical application of the diluted magnesium chloride was to follow manipulation at a rate of 0.1 gal/yd2.
Performance Evaluation Data Collection
To assess the strength and durability and estimate the maintenance cycle of each product and control section, data were collected using the following equipment and methods:
�� GeoGauge™ �� Dual-Mass Dynamic Cone Penetrometer (DCP) �� visual inspection using RCA rating guidelines.
6
Data were collected on nine dates:
Data Type 9/14 9/21 10/6 10/26 11/3 11/29 12/14 2/8 3/31 GeoGauge™ X X Void X X X X DCP X X X X X Visual Inspection X X X X X X X X X
The GeoGauge™ was improperly calibrated for data collection on November 3, and these data were not used in the study. GeoGauge™
The GeoGauge™ applies a constant load vibrating force to the soil’s surface and measures the resulting displacement (stress). It imparts very small displacements to the soil at 25 steady state frequencies. Stiffness, defined as force over deflection, follows directly from the impedance. The stiffness is determined at each frequency, and the average is displayed. At these low frequencies, the impedance at the surface is stiffness controlled and is proportional to the shear modulus of the soil. If a Poisson's ratio is assumed and the physical dimensions of the GeoGauge™ are known, shear and Young’s modulus can be derived. In all cases, the data derived reflect conditions for only a shallow depth of material, up to 6 in. For the purposes of this study, only stiffness data were used.
GeoGauge™ data were collected approximately every 50 ft along the length of the test
and control sections. In each test section, a set of samples was taken in the treated material that which is from 0 to 3 ft from the edge of pavement. In the control section, a set of samples was taken in the material that was from 0 to 3 ft from the edge of pavement. The sampling plan is shown in Appendix A.
Dual-Mass Dynamic Cone Penetrometer
The DCP is a two-section rod, with the lower section containing an anvil, a replaceable pointed tip, and depth markings every millimeter. The upper section contains a 17.6-lb drop hammer with a 22.6-in drop distance, an end plug for connection to the lower section, and a top grab handle. The test begins with the operator “sealing” the cone tip by dropping the hammer until the widest part of the cone is just below the testing surface. This initial penetration is recorded as “Blow 0.” The operator then lifts and drops the hammer one or more times depending on the strength of the soil at the test location. Following each sequence of hammer drops, a penetration reading is taken. This process continues until the desired depth of testing is reached. Data from a DCP test are processed to produce a penetration index (PI), which is simply the distance the cone penetrates with each drop of the hammer. PI is expressed in terms of inches per blow. The PI can be plotted on a layer strength diagram or directly correlated with a number of common pavement design parameters. For this study, the PI was correlated with the California Bearing Ratio (CBR). CBR is a measure of shearing resistance of the soil. The instrument used for this test uses a direct correlation between penetration in millimeters and CBR value based on the formula:
CBR = 292/DCP1.12
7
The formula is based on a recommendation by the U.S. Corps of Engineers (Webster et al., 1994). In this study, the PI and CBR were not used as direct measures of the “strength of the material” but rather for comparison of the materials in the test and control sections.
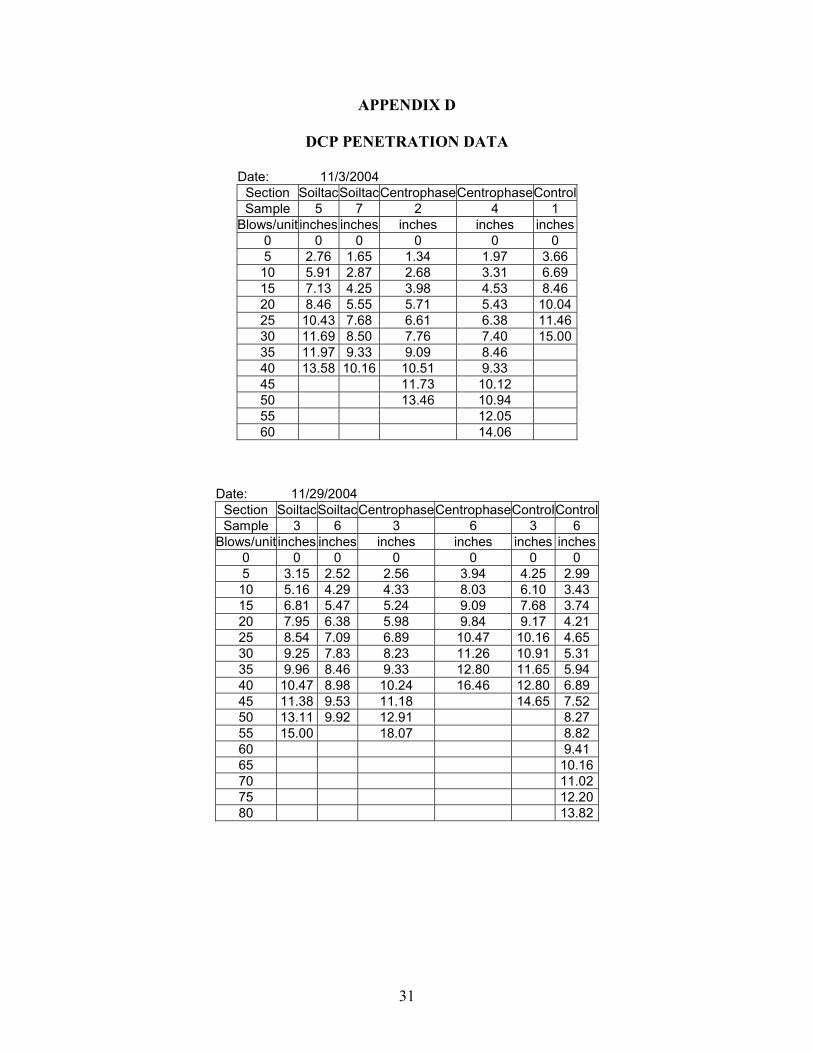
DCP data were collected at two locations within each test and control section. Sampling locations were near the GeoGauge™ data collection locations, usually sample sites 3 and 6 in each section, to allow comparison of the GeoGauge™ and DCP data (see the sampling plan in Appendix A). Because of the presence of underground utilities, the collection of DCP data at individual sites was suspended when a depth of 15 in was reached.
The RCA rating procedure inspects five conditions for unpaved shoulders: 1. Elevation difference >1.5 in (none, high, low, both) by percent length (0, <25, 25-50,
>50) 2. Shoulder reverse slope (yes) by percent of length (0, <25, 25-50, >50) 3. Loose aggregate >2 in deep (yes) by percent of length (0, <25, 25-50, >50) 4. Pavement corrugation >1 in (yes) by percent of length (0, <25, 25-50, >50) 5. Shoulder wedge, which is not applicable (n/a) in this case.
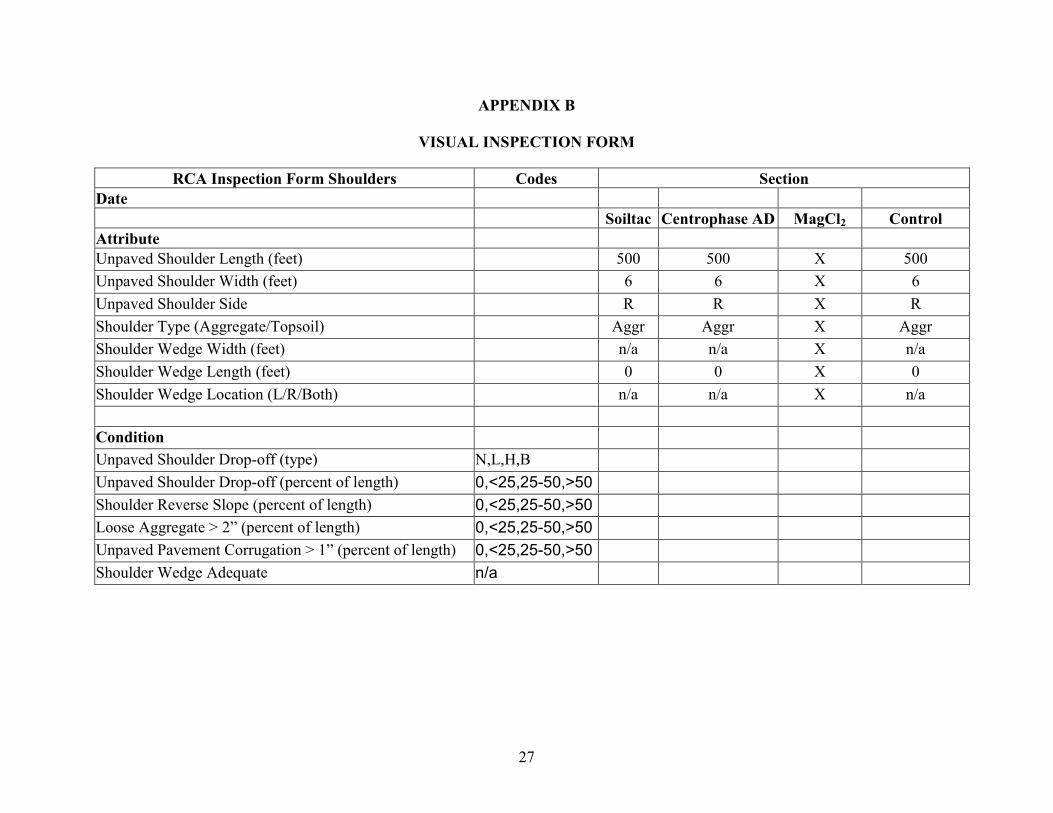
An RCA evaluation was made of each test and control section each time DCP and/or GeoGauge™ data were collected. The inspection form is provided in Appendix B. Data Evaluation The null hypothesis (H0) was that the addition of stabilizers to the shoulder material did not affect the strength of the material as determined by measurement of its stiffness. To test this hypothesis, two statistical methods were used. First, a two-tailed t-test with unequal variance was used to compare the test and control stiffness data for each date on which GeoGauge™ data were collected. Second, the Wilcoxon Sign Ranking Test was used to compare the performance of the two test sections versus the control section over time. The Wilcoxon Sign Ranking Test allows the pooling of readings from different dates without considering the differing environmental conditions between dates. The test uses the mean stiffness reading from each date.
8
RESULTS
Literature Review Stabilizer Studies
To make recreational areas more accessible to persons with disabilities, the U.S. Forest Service tested a number of stabilization products on trails in national forests. They were looking for ways to make areas more universally accessible (e.g., to wheelchairs) while maintaining a natural appearance that was not as distracting as concrete, asphalt, boardwalks, and other obviously manmade pathways. Bergman (2000) documents the project findings.
The trails in the project were aggregate, and the products tested included pine tree resin, enzyme, sulfuric acid, latex polymer, ground seed hulls, clay, and fly ash. Calculated application rates were used, but the construction was undertaken by volunteers or hourly crews and the process was not rigorously controlled. The evaluation of the processes and products comprised visual inspections over time and an assessment by a wheelchair user. The study findings were:
�� A properly designed trail is essential. Applying a product directly to the in-place
native material and compacting the trail will result in low spots that hold water or are subject to erosion. Native material should be removed and replaced with compacted base material.
�� The pine tree resin emulsion product was the most expensive and the most difficult to
apply, but it provided the best surface for universal accessibility.
�� The latex polymer product was considered the second best surface.
�� The trail sections constructed with the enzyme product and the sulfuric acid product did not noticeably stabilize the aggregate materials; the same was true when the products were mixed in with clay.
�� Fly ash did not perform any better than did the control sections.
�� The ground seed hulls stabilized marginally better than did the control sections.
Cost/Benefit Analysis of Various Shoulder Stabilization Strategies
A study undertaken for the Iowa DOT (Souleyrette, 2001) examined current design criteria for shoulders employed in Iowa and surrounding states, compared benefits and costs of alternative surface types and widths, and made recommendations based on this analysis for consideration in future design policies for primary highway in Iowa. The investigator found that many safety and maintenance benefits would result from enhancing Iowa’s paved shoulder and rumble strip design practices for freeways, expressways, and Super 2 highway corridors (routes that do not have enough traffic for four-lane highway design but that need enhanced design features). The benefits of paved shoulders include reduction in particular types of crashes,
9
higher capacity potentials, reduced maintenance, enhanced opportunities for other users such as bicyclists, and possibly increased longevity of pavements. Alternative paved shoulder policies and programming strategies were also offered, with detailed assessments of the benefits, costs, and budget impacts.
Considering only construction and maintenance costs, the Iowa study presented comparisons of costs for different widths of asphalt-paved and aggregate shoulders. The comparison for widths of 3 ft follows. Costs for excavation, subbase, traffic control, and miscellaneous are not included.
Initial construction
�� Paved shoulder, 3-ft width: 3,520 yd2/mi at $15.19/yd2 = $53,469/mi (asphalt paved) �� Aggregate shoulder, 3-ft width: 3,520 yd2/mi at $3.80/yd2 = $13,376/mi
Overlay costs for shoulder restoration (Iowa DOT 2000 bid prices) �� Three-inch asphalt-paved overlay: $5.69/yd2 �� Three-inch granular material: $1.43/yd2
Maintenance functions
�� Paved shoulders about $76/lane-mile (include repair with bituminous material,
sealing edge ruts, filling shoulder joints, and other paved shoulder repairs) �� Aggregate shoulders about $259/lane-mile (include repair with aggregate and
blading). The maintenance cost savings for paved vs. granular shoulders totaled approximately $366/mi/yr for a two-lane road. Over a 20-year life, these savings would total approximately $7,320/mi.
VTRC has studied the cost-effectiveness of paved shoulders (Cottrell, 1990). A survey conducted as part of the study found that 32 of 35 responding states use paved shoulders on two-lane roads to some degree, with minimum widths of 2 ft specified in 21 of those states. Benefits of paved shoulders determined from these survey results indicated increased lateral support to the pavement, reduced maintenance costs, operational improvements, and safety considerations as the major elements. That study concluded that paving the first 2 ft of shoulder from the pavement edge on new construction would:
�� increase the average initial cost by 8.3% to 16.7% �� increase the average service life by 14.3% �� reduce the average accident frequency by 2.6%.
The study concluded that 2-ft paved shoulders are economically justified on (1) all new four-lane roads and (2) new two-lane roads and existing four-lane roads that exceed particular ADT threshold values. Those thresholds ranged from 1,852 to 10,580 ADT in one direction and were
10
dependent on terrain classification, number of lanes, and whether the road was divided or undivided. Based, in part, on the findings of this study, VDOT adopted a policy to pave all shoulders on new construction projects when the anticipated traffic volume exceeds 2000 vehicles per day.
Performance Evaluation GeoGauge™
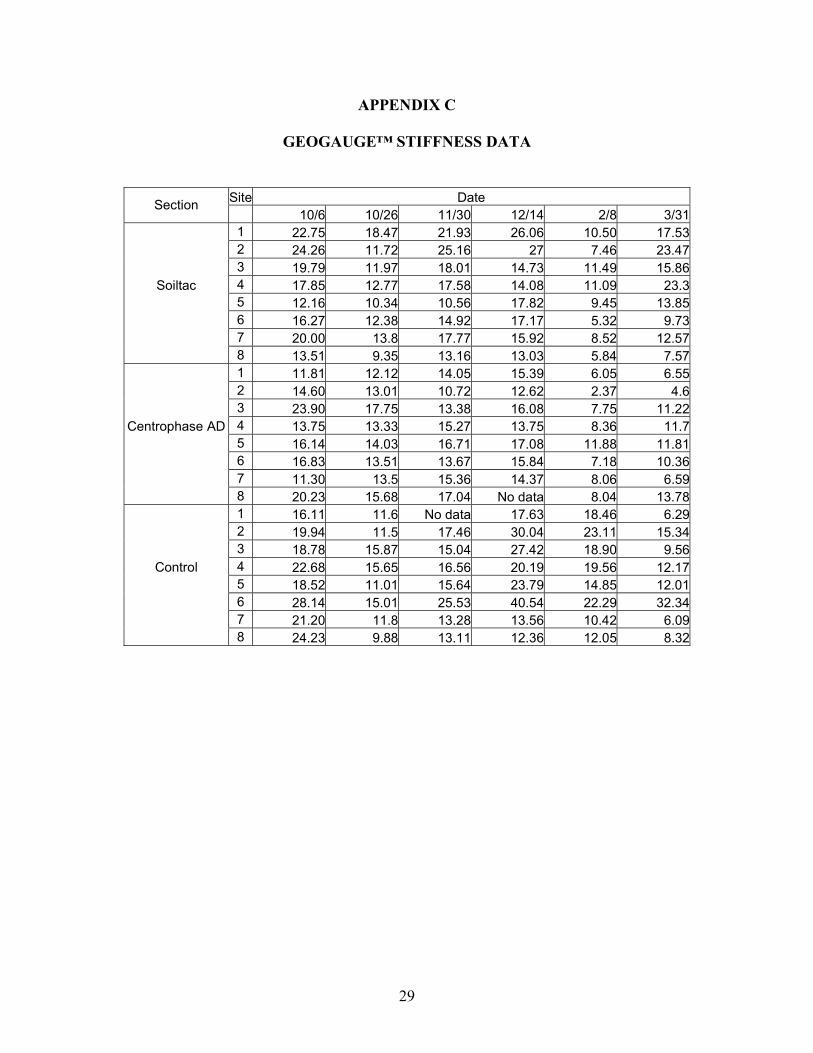
The GeoGauge™ stiffness data collected for each sample site are shown in Appendix C. The data represent samples taken within the test and control sections on six dates. The mean stiffness reading, standard deviation, and 95% confidence interval for the mean of each section are shown in Table 2.
Table 2. GeoGauge™ Statistical Data for Each Data Collection Date (MN/m)
Section Parameter 10/6 10/26 11/30 12/14 2/8 3/31 Mean Stiffness 18.32 12.60 17.39 18.23 8.71 15.49 SD 4.23 2.75 4.66 5.36 2.34 5.81
Soiltac Treated
Confidence 2.93 1.90 3.23 3.72 1.62 4.02 Mean Stiffness 16.07 14.12 14.53 15.02 7.46 9.58 SD 4.27 1.78 2.04 1.53 2.65 3.24
Centrophase AD Treated
Confidence 2.96 1.23 1.41 1.13 1.84 2.24 Mean Stiffness 21.20 12.79 16.66 23.19 17.46 12.77 SD 3.78 2.34 4.22 9.38 4.60 8.51
Control
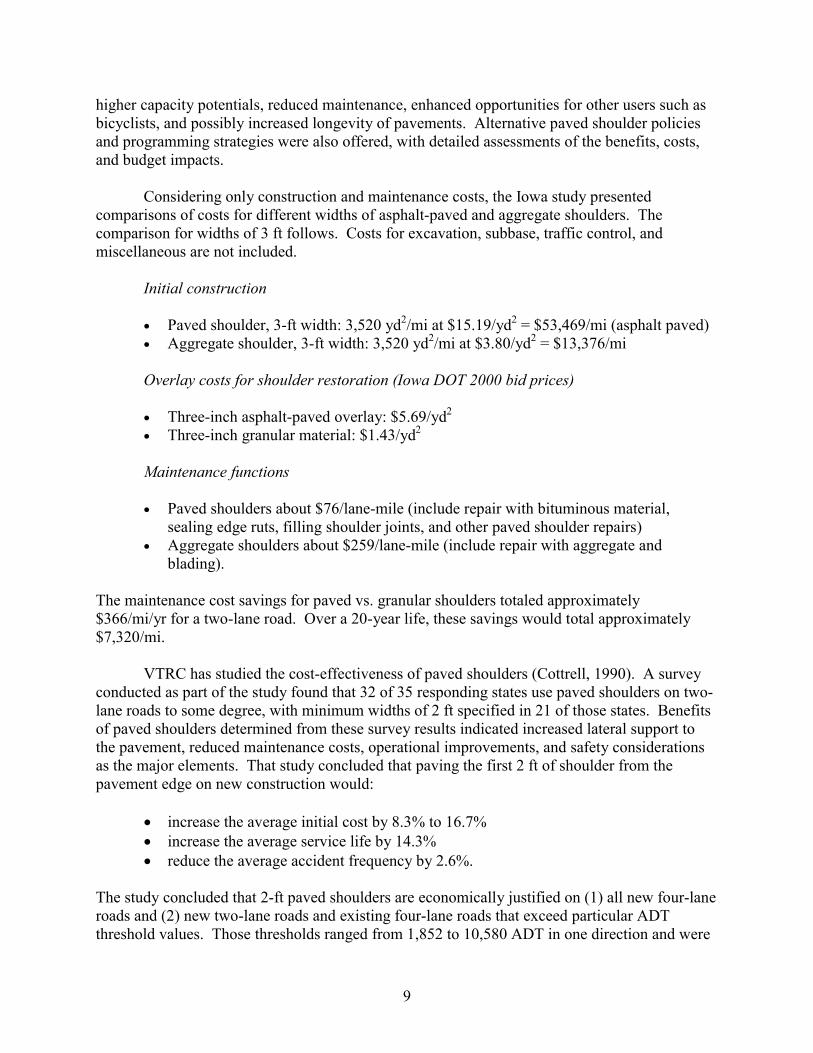
Confidence 2.62 1.62 3.13 6.50 3.19 5.90 DCP The DCP penetration data are shown in Appendix D. For convenient comparison with GeoGauge™ and visual inspection data, the DCP initial penetration data for each sample site are shown in Figure 1. To place these data in perspective, a CBR 10 material under controlled density and moisture conditions should produce DCP readings of approximately 0.8 in for every five blows.
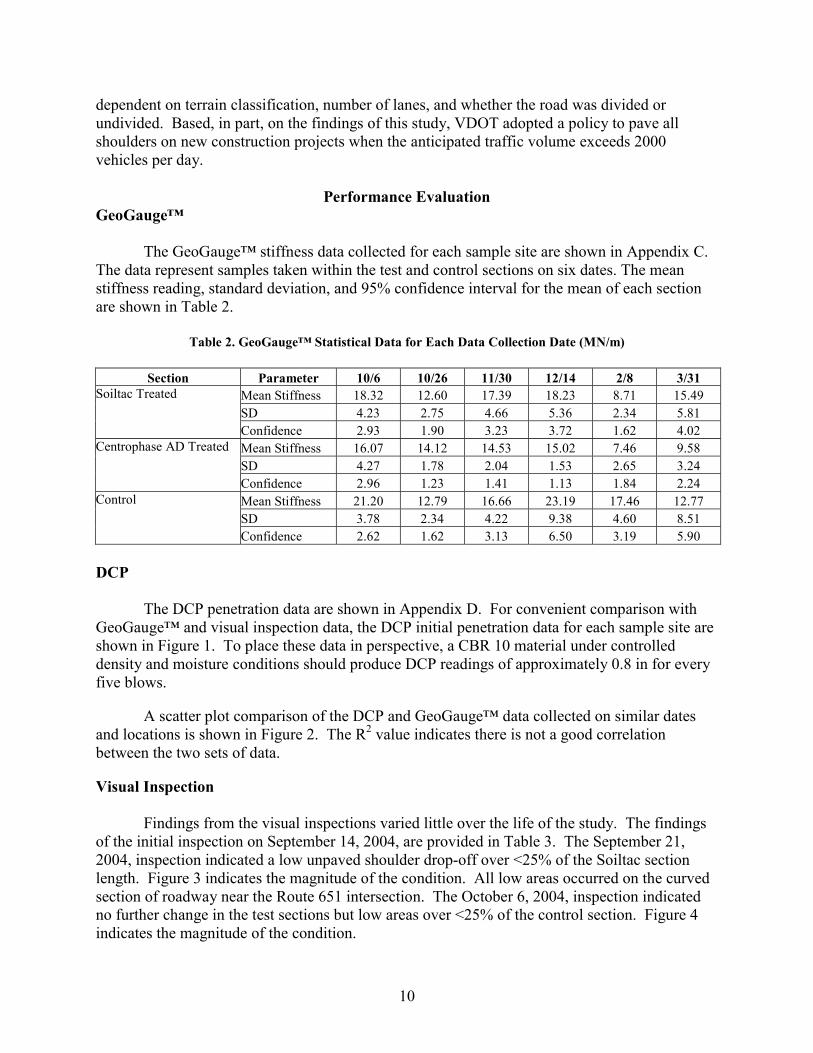
A scatter plot comparison of the DCP and GeoGauge™ data collected on similar dates
and locations is shown in Figure 2. The R2 value indicates there is not a good correlation between the two sets of data.
Visual Inspection
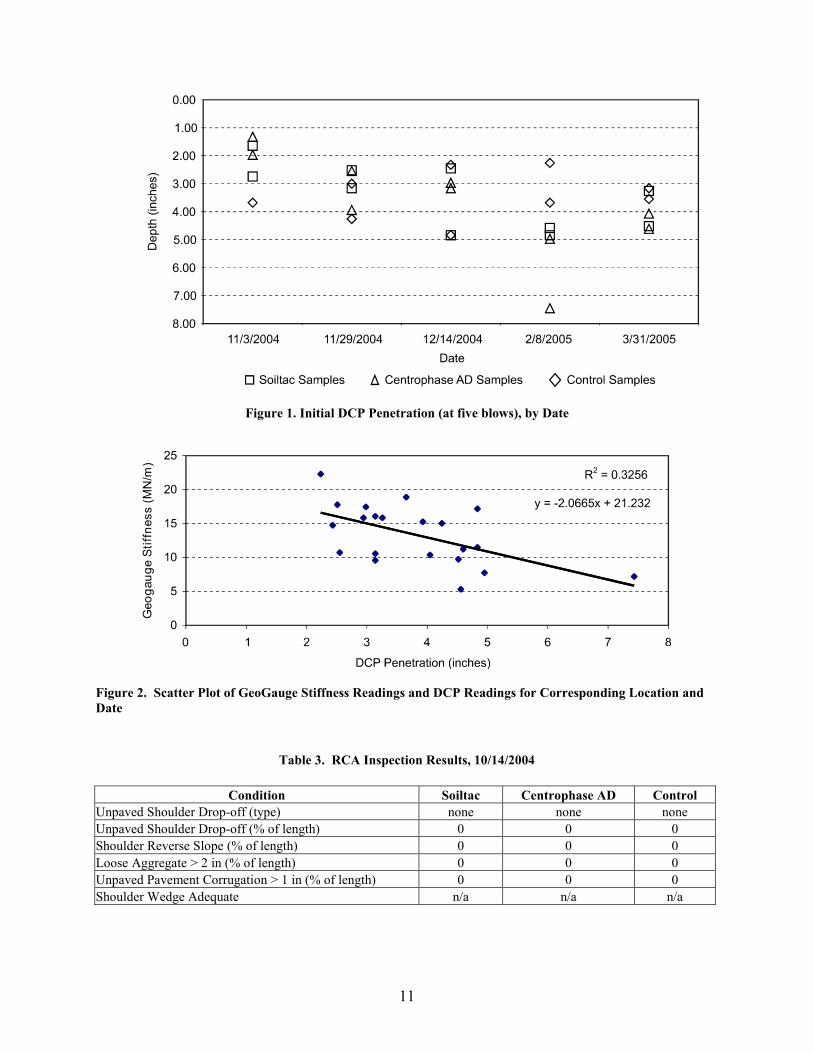
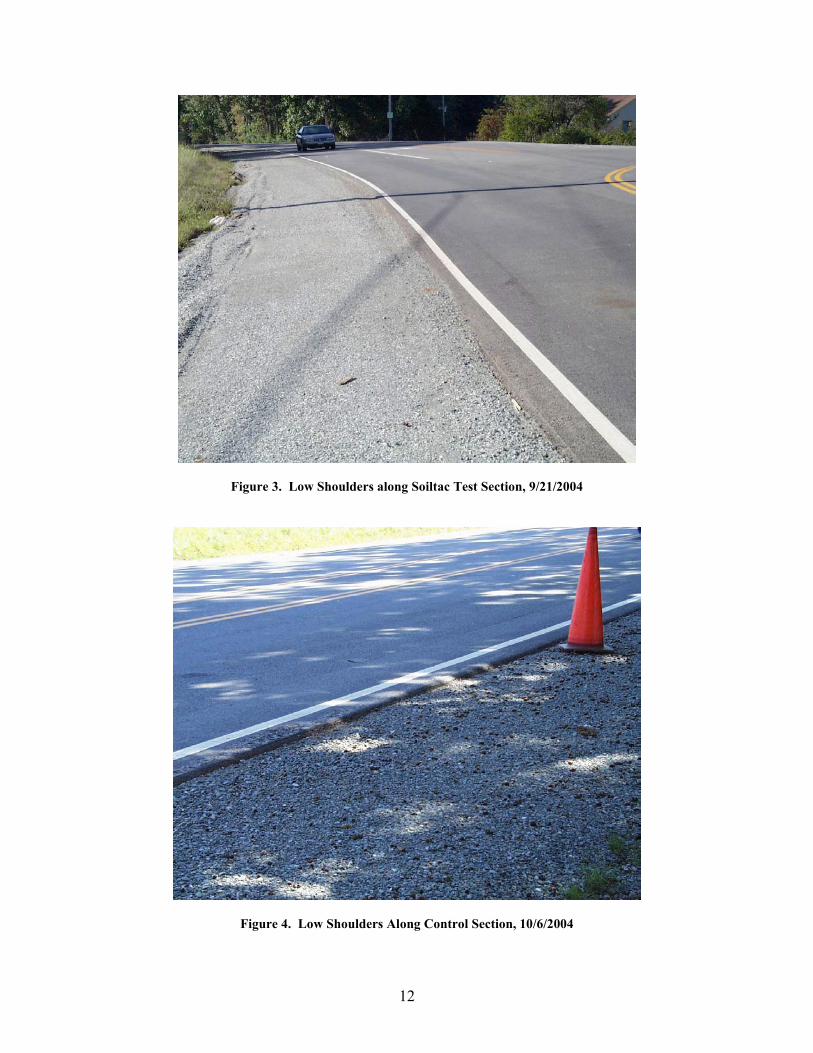
Findings from the visual inspections varied little over the life of the study. The findings of the initial inspection on September 14, 2004, are provided in Table 3. The September 21, 2004, inspection indicated a low unpaved shoulder drop-off over <25% of the Soiltac section length. Figure 3 indicates the magnitude of the condition. All low areas occurred on the curved section of roadway near the Route 651 intersection. The October 6, 2004, inspection indicated no further change in the test sections but low areas over <25% of the control section. Figure 4 indicates the magnitude of the condition.
11
Figure 1. Initial DCP Penetration (at five blows), by Date
Figure 2. Scatter Plot of GeoGauge Stiffness Readings and DCP Readings for Corresponding Location and Date
Table 3. RCA Inspection Results, 10/14/2004
Condition Soiltac Centrophase AD Control
Unpaved Shoulder Drop-off (type) none none none Unpaved Shoulder Drop-off (% of length) 0 0 0 Shoulder Reverse Slope (% of length) 0 0 0 Loose Aggregate > 2 in (% of length) 0 0 0 Unpaved Pavement Corrugation > 1 in (% of length) 0 0 0 Shoulder Wedge Adequate n/a n/a n/a
12
Figure 3. Low Shoulders along Soiltac Test Section, 9/21/2004
Figure 4. Low Shoulders Along Control Section, 10/6/2004
13
Section ratings remained unchanged for the October 26, 2004, inspection. Notes taken at the time indicate that the surface stone on the control section appears loose and considerable stone can be moved with the foot. The Soiltac section had loose stone in spots but less than did the control section. The surface in the Centrophase AD section appeared tight with little loose stone. The reports of November 3, November 29, and December 14 mirror the October 26 report.
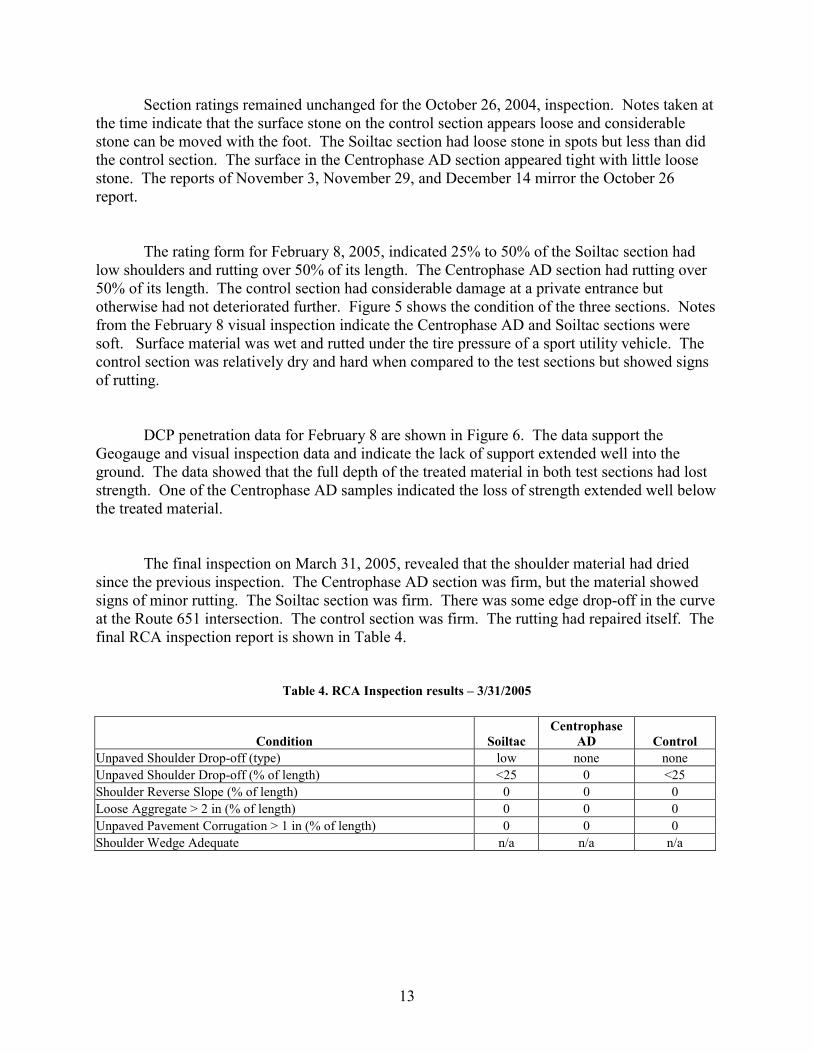
The rating form for February 8, 2005, indicated 25% to 50% of the Soiltac section had
low shoulders and rutting over 50% of its length. The Centrophase AD section had rutting over 50% of its length. The control section had considerable damage at a private entrance but otherwise had not deteriorated further. Figure 5 shows the condition of the three sections. Notes from the February 8 visual inspection indicate the Centrophase AD and Soiltac sections were soft. Surface material was wet and rutted under the tire pressure of a sport utility vehicle. The control section was relatively dry and hard when compared to the test sections but showed signs of rutting.
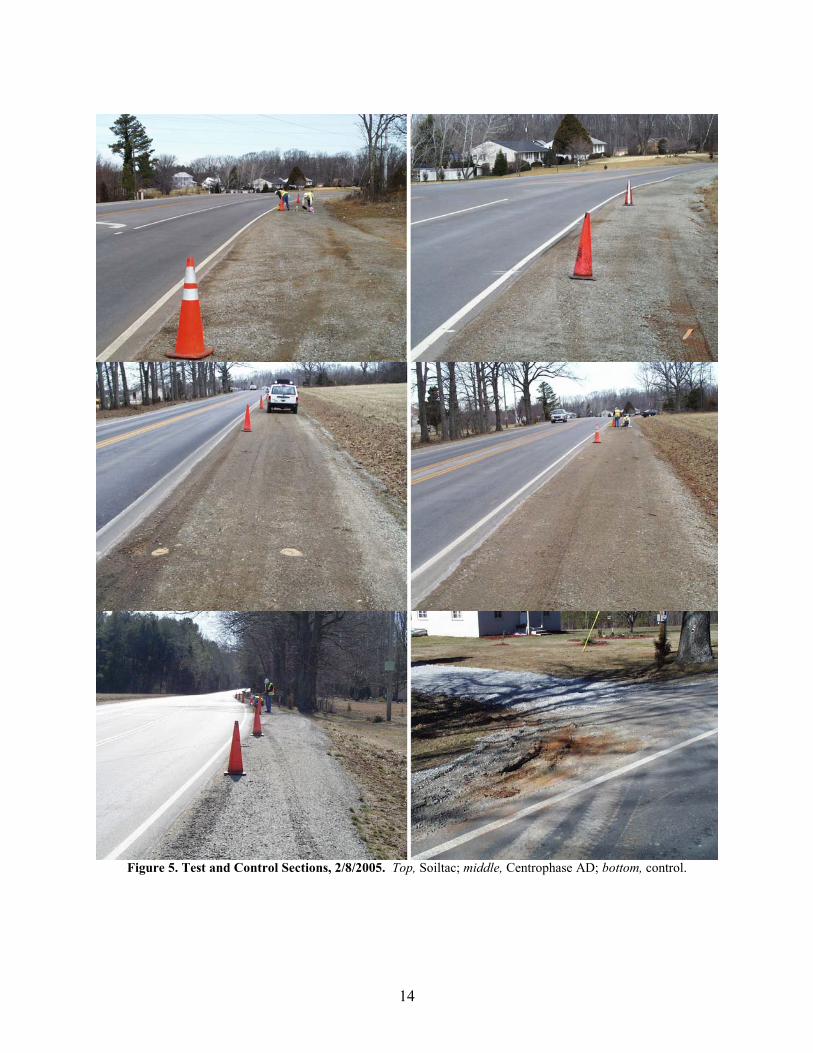
DCP penetration data for February 8 are shown in Figure 6. The data support the
Geogauge and visual inspection data and indicate the lack of support extended well into the ground. The data showed that the full depth of the treated material in both test sections had lost strength. One of the Centrophase AD samples indicated the loss of strength extended well below the treated material.
The final inspection on March 31, 2005, revealed that the shoulder material had dried
since the previous inspection. The Centrophase AD section was firm, but the material showed signs of minor rutting. The Soiltac section was firm. There was some edge drop-off in the curve at the Route 651 intersection. The control section was firm. The rutting had repaired itself. The final RCA inspection report is shown in Table 4.
Table 4. RCA Inspection results – 3/31/2005
Condition Soiltac Centrophase
AD Control Unpaved Shoulder Drop-off (type) low none none Unpaved Shoulder Drop-off (% of length) <25 0 <25 Shoulder Reverse Slope (% of length) 0 0 0 Loose Aggregate > 2 in (% of length) 0 0 0 Unpaved Pavement Corrugation > 1 in (% of length) 0 0 0 Shoulder Wedge Adequate n/a n/a n/a
14
Figure 5. Test and Control Sections, 2/8/2005. Top, Soiltac; middle, Centrophase AD; bottom, control.
15
Figure 6. DCP Penetration Data, 2/8/2005
DISCUSSION
Problems Encountered During the Research
Experimental Section Modification The original research plan called for experimental sections at two sites. The test and control sections at each site were to be on one side of the road. The width of the shoulder at the Route 522 site was determined to be too narrow to accommodate all the test and control sections. Thus, the control section was moved to the opposite side of the road and the test sections were moved to a point where one of the test sections was on a curve. A second experimental site on Route 360 was prepared for treatment. Problems encountered with the installation of the Route 522 experimental section led to the cancellation of the installation of test sections at the second site. This modification affected the influence of traffic and drainage on the site. The experimental site was chosen, in part, because of its history of high exposure to roadway traffic. On the tangent section of the site, distress because of traffic action did not occur. Cross-shoulder traffic at entrances did occur. Some distress in the form of pavement edge drop-off occurred in the Soiltac section located on the curve. Although measured as greater than 1.5 in, the drop-off never exceeded 2 in and occurred primarily during the first month of the test period. Prior to installation of the test and control sections, the drainage appeared to be equally distributed to each side of the road. The Soiltac section on the curve does receive additional
16
water since the curve is superelevated. The road centerline grade is gentle, and the road and shoulder cross slope is such that volume and velocity of runoff is light.
When data were collected on February 8, the two test sections were visibly wet and the control section was relatively dry. Moisture samples taken at the time at an approximately 4-in depth are reported in Table 5. They support the visible evidence for the Soiltac section but not for the Centrophase AD section. A light snow fell on February 3 and 4. Evidence of chemical treatment existed along the edge of pavement adjacent to the Centrophase AD section but not along the control or Soiltac section.
Table 5. Moisture Readings at GeoGauge™ Sample Sites, 2/8/2005
Section Sample Site % Moisture
3 6.0 Soiltac 6 6.8 3 4.7 Centrophase AD 6 3.8 3 6.7 Control 6 4.1
Experimental Section Installation
The size of the Wirtgen Reclaimer and the vibratory roller limited the area that could be used at the experimental site. Although the site had been relocated slightly to a wider shoulder section to accommodate the equipment, their size and weight proved to be a problem. Before the start of construction, the test sections were shortened to keep the equipment out of the ditch line at each end of the test sections.
During installation of the test sections while the pre-existing stone shoulders had been compacted, the action of the Wirtgen on the treated area and the introduction of stabilizer caused the material to flow away from the edge of the pavement. The passing of the work train caused the reclaimed area to lose shape, requiring additional reworking of the area with the motor grader. Rolling the shoulder with the vibratory roller resulted in a low shoulder at the edge of the pavement. Additional material was pulled back to the edge by the motor grader, adding untreated material into the mixture. This compromised the test material by changing the amount of stabilizer per cubic yard of shoulder material in the mixture. In the Centrophase AD section, clay material from the shoulder subgrade was mixed with the No. 26 aggregate, changing the shade of the mixed material.
After two test sections were installed, the problems of equipment size and weight, the lack of density of the material, and the need to meet strict mixing requirements and have a set elevation could not be resolved. Rather than continue with the construction of test sections that could not meet the study specifications, the work was stopped and the placement of the additional test sections was cancelled.
The test sections were inspected on three occasions in the month following installation.
Soil samples from each were tested for gradation. The results indicated an increase in fines, but
17
the material still met VDOT’s specification for No. 26 stone. The color and a crust on the surface of the test section indicated that the soil stabilizers had mixed with the shoulder material. No attempt was made to determine the percentage of stabilizer mixed with shoulder material. Influence of Entrances
There is a paved private entrance within the limits of the control section. Entrance traffic includes a school bus. Although no traffic count was made, an estimate is that 7 to 10 outbound vehicle trips per day, most of which oriented to the south, were generated by the property. A GeoGauge™ data point (C-6) was located in close proximity to the entrance, and exiting traffic regularly runs over the location, resulting in rutting and recompaction of the shoulder. No other data point in the control section was subject to the same traffic conditions for a prolonged period.
Data collection was scheduled for times when the shoulders were expected to be
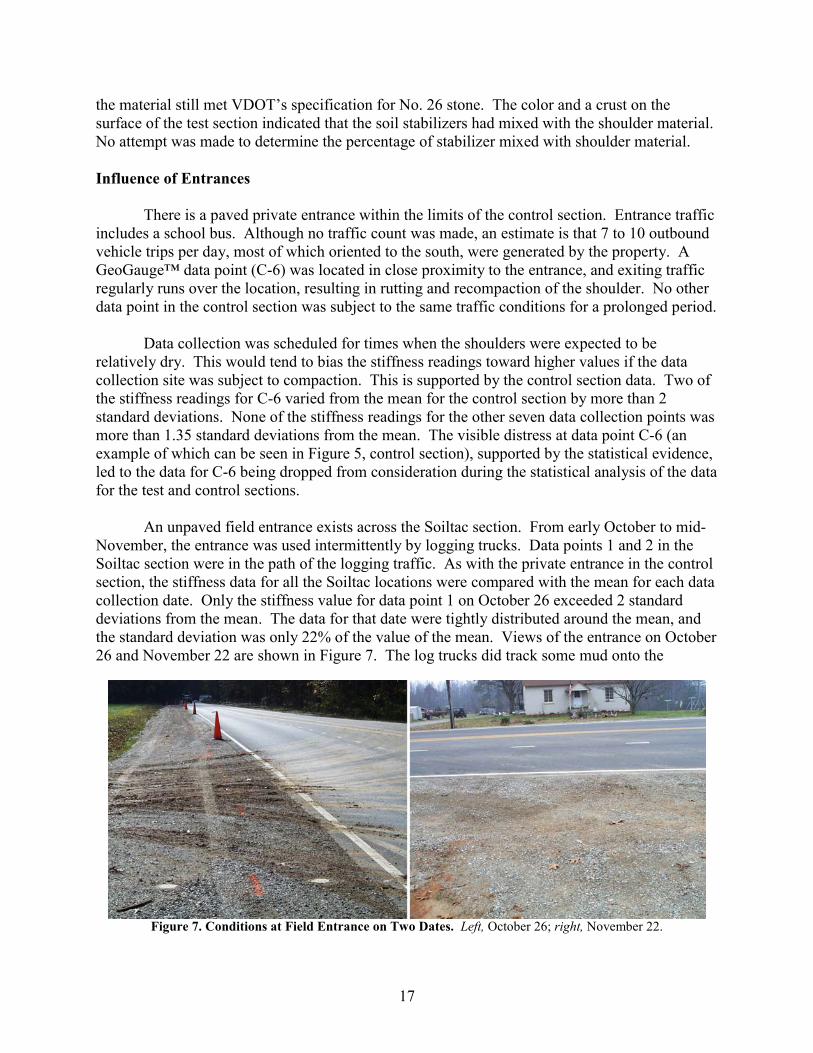
relatively dry. This would tend to bias the stiffness readings toward higher values if the data collection site was subject to compaction. This is supported by the control section data. Two of the stiffness readings for C-6 varied from the mean for the control section by more than 2 standard deviations. None of the stiffness readings for the other seven data collection points was more than 1.35 standard deviations from the mean. The visible distress at data point C-6 (an example of which can be seen in Figure 5, control section), supported by the statistical evidence, led to the data for C-6 being dropped from consideration during the statistical analysis of the data for the test and control sections. An unpaved field entrance exists across the Soiltac section. From early October to mid- November, the entrance was used intermittently by logging trucks. Data points 1 and 2 in the Soiltac section were in the path of the logging traffic. As with the private entrance in the control section, the stiffness data for all the Soiltac locations were compared with the mean for each data collection date. Only the stiffness value for data point 1 on October 26 exceeded 2 standard deviations from the mean. The data for that date were tightly distributed around the mean, and the standard deviation was only 22% of the value of the mean. Views of the entrance on October 26 and November 22 are shown in Figure 7. The log trucks did track some mud onto the
Figure 7. Conditions at Field Entrance on Two Dates. Left, October 26; right, November 22.
18
shoulder on that date, but no distress as defined by the RCA manual was noted on either date. Based on these facts, all stiffness data collected for the Soiltac section were retained in the analysis that follows.
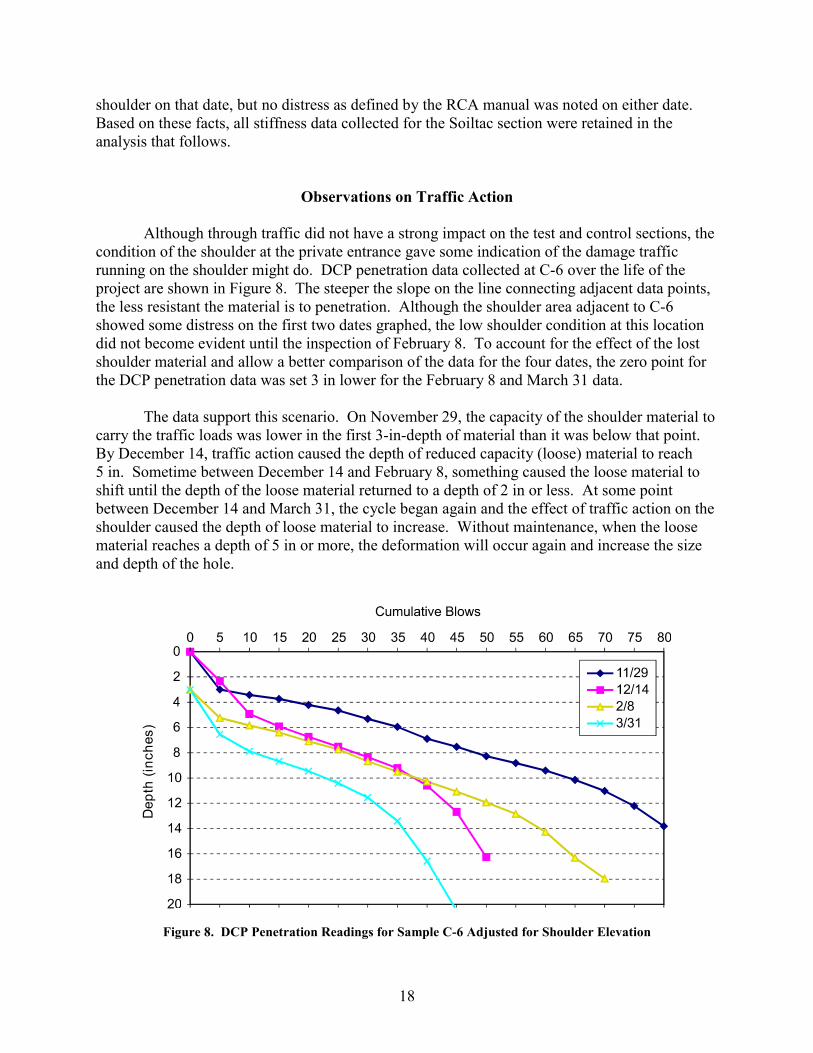
Observations on Traffic Action Although through traffic did not have a strong impact on the test and control sections, the condition of the shoulder at the private entrance gave some indication of the damage traffic running on the shoulder might do. DCP penetration data collected at C-6 over the life of the project are shown in Figure 8. The steeper the slope on the line connecting adjacent data points, the less resistant the material is to penetration. Although the shoulder area adjacent to C-6 showed some distress on the first two dates graphed, the low shoulder condition at this location did not become evident until the inspection of February 8. To account for the effect of the lost shoulder material and allow a better comparison of the data for the four dates, the zero point for the DCP penetration data was set 3 in lower for the February 8 and March 31 data. The data support this scenario. On November 29, the capacity of the shoulder material to carry the traffic loads was lower in the first 3-in-depth of material than it was below that point. By December 14, traffic action caused the depth of reduced capacity (loose) material to reach 5 in. Sometime between December 14 and February 8, something caused the loose material to shift until the depth of the loose material returned to a depth of 2 in or less. At some point between December 14 and March 31, the cycle began again and the effect of traffic action on the shoulder caused the depth of loose material to increase. Without maintenance, when the loose material reaches a depth of 5 in or more, the deformation will occur again and increase the size and depth of the hole.
Figure 8. DCP Penetration Readings for Sample C-6 Adjusted for Shoulder Elevation
19
Although this is but a single example of shoulder material under traffic, some observations can be made.
�� The shoulder surface material was placed and compacted on September 1, and
destabilization of the shoulder because of light, but recurring, traffic occurred between December 14 and February 8, suggesting a maintenance cycle under these conditions of 3 to 5 months.
�� Comparison of the December 14 DCP data for C-6 (Figure 8) and the February 8
DCP data for the two test sections (Figure 6) indicates the test sections had loose material with higher penetration numbers to a depth equal to or greater than that of the material at C-6. Deformation had not occurred at the test section DCP data points, but these points lacked the recurring traffic that C-6 experienced.
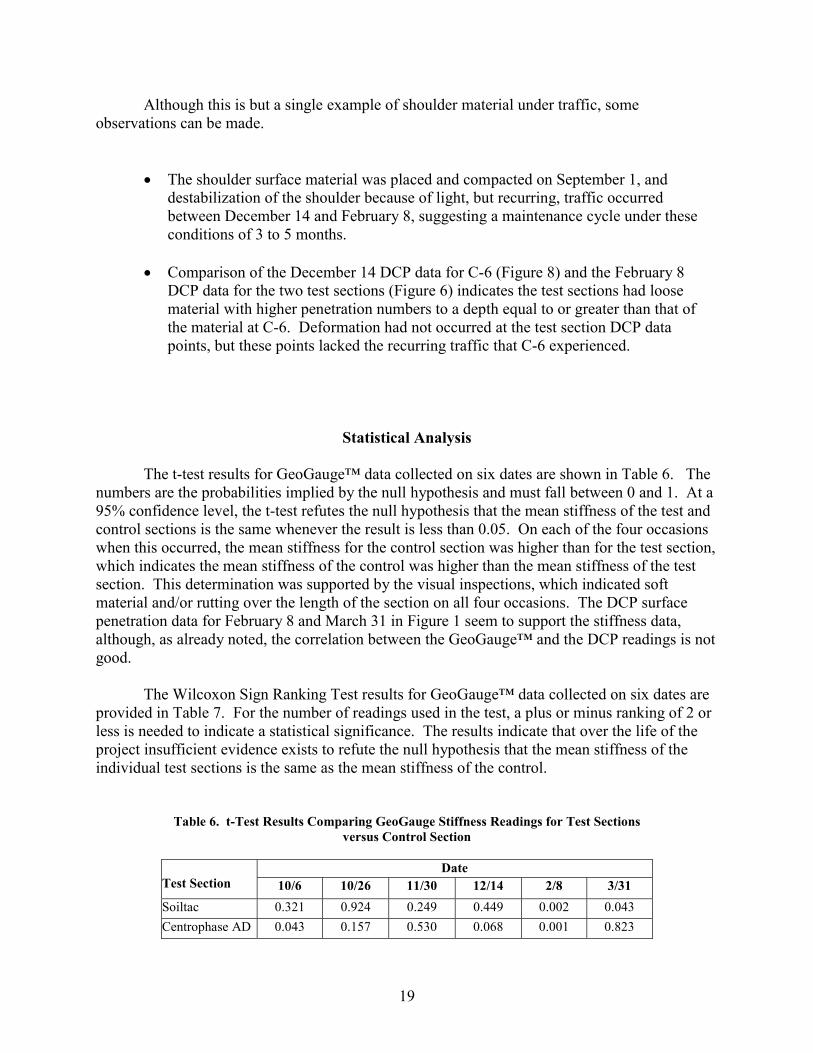
Statistical Analysis The t-test results for GeoGauge™ data collected on six dates are shown in Table 6. The numbers are the probabilities implied by the null hypothesis and must fall between 0 and 1. At a 95% confidence level, the t-test refutes the null hypothesis that the mean stiffness of the test and control sections is the same whenever the result is less than 0.05. On each of the four occasions when this occurred, the mean stiffness for the control section was higher than for the test section, which indicates the mean stiffness of the control was higher than the mean stiffness of the test section. This determination was supported by the visual inspections, which indicated soft material and/or rutting over the length of the section on all four occasions. The DCP surface penetration data for February 8 and March 31 in Figure 1 seem to support the stiffness data, although, as already noted, the correlation between the GeoGauge™ and the DCP readings is not good.
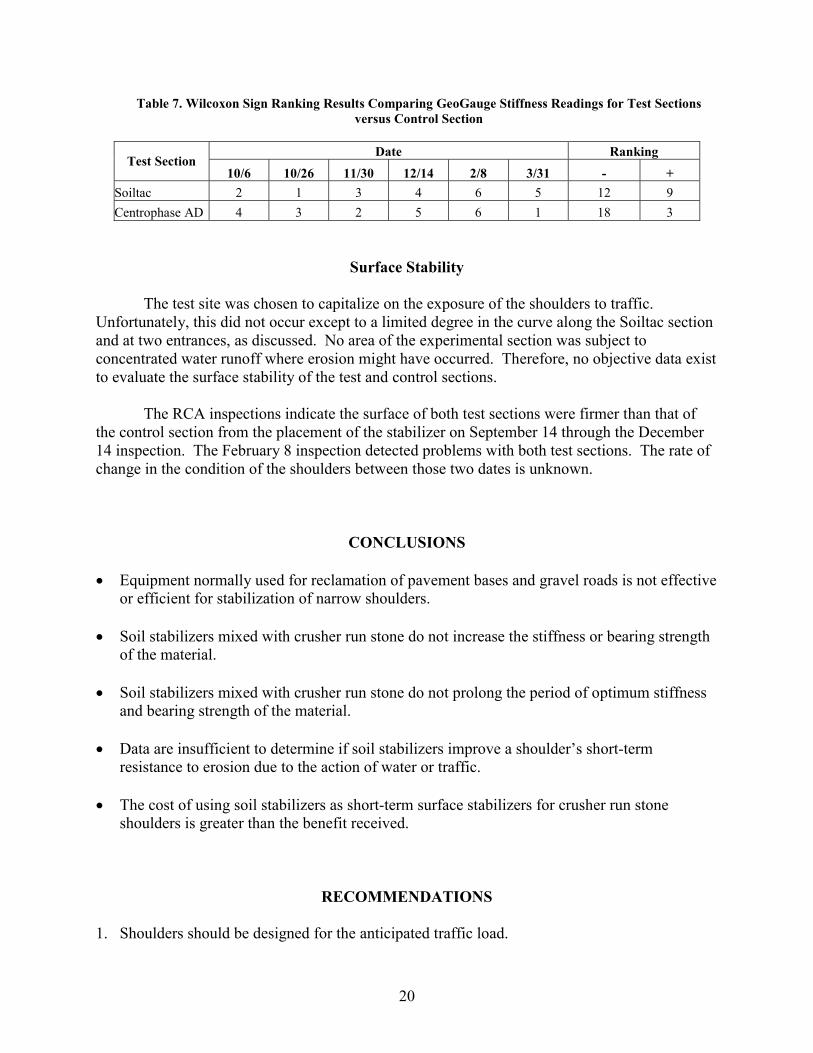
The Wilcoxon Sign Ranking Test results for GeoGauge™ data collected on six dates are provided in Table 7. For the number of readings used in the test, a plus or minus ranking of 2 or less is needed to indicate a statistical significance. The results indicate that over the life of the project insufficient evidence exists to refute the null hypothesis that the mean stiffness of the individual test sections is the same as the mean stiffness of the control.
Table 6. t-Test Results Comparing GeoGauge Stiffness Readings for Test Sections versus Control Section
Date
Test Section 10/6 10/26 11/30 12/14 2/8 3/31 Soiltac 0.321 0.924 0.249 0.449 0.002 0.043 Centrophase AD 0.043 0.157 0.530 0.068 0.001 0.823
20
Table 7. Wilcoxon Sign Ranking Results Comparing GeoGauge Stiffness Readings for Test Sections versus Control Section
Date Ranking
Test Section 10/6 10/26 11/30 12/14 2/8 3/31 - +
Soiltac 2 1 3 4 6 5 12 9 Centrophase AD 4 3 2 5 6 1 18 3
Surface Stability
The test site was chosen to capitalize on the exposure of the shoulders to traffic. Unfortunately, this did not occur except to a limited degree in the curve along the Soiltac section and at two entrances, as discussed. No area of the experimental section was subject to concentrated water runoff where erosion might have occurred. Therefore, no objective data exist to evaluate the surface stability of the test and control sections. The RCA inspections indicate the surface of both test sections were firmer than that of the control section from the placement of the stabilizer on September 14 through the December 14 inspection. The February 8 inspection detected problems with both test sections. The rate of change in the condition of the shoulders between those two dates is unknown.
CONCLUSIONS �� Equipment normally used for reclamation of pavement bases and gravel roads is not effective
or efficient for stabilization of narrow shoulders. �� Soil stabilizers mixed with crusher run stone do not increase the stiffness or bearing strength
of the material. �� Soil stabilizers mixed with crusher run stone do not prolong the period of optimum stiffness
and bearing strength of the material. �� Data are insufficient to determine if soil stabilizers improve a shoulder’s short-term
resistance to erosion due to the action of water or traffic. �� The cost of using soil stabilizers as short-term surface stabilizers for crusher run stone
shoulders is greater than the benefit received.
RECOMMENDATIONS
1. Shoulders should be designed for the anticipated traffic load.
21
2. Soil stabilizers should not be used with crusher run stone with the intent of improving or prolonging the bearing strength of shoulder material.
3. Consider additional study of soil stabilizers as a short-term solution to shoulder erosion.
COSTS AND BENEFITS ASSESSMENT
The data do not support the null hypothesis that the bearing strength and service life of the test and control are different. The same quantity of base material must be present to support anticipated traffic whether a stabilizer is added or not. Since the costs for the stabilizer and the mixing process are in addition to the cost of the material needed for proper structural design, the cost-benefit ratio of the process must be less than 1 and need not be calculated. The value of soil additives as a surface stabilizer was not clearly determined by this study. Visual observation revealed a possible improvement in the surface stability for a period of 3 to 5 months after application. Assuming a topical treatment of the shoulder could be used in lieu of traditional shoulder maintenance, a cost-benefit comparison was made. A third option of paving the shoulder and maintaining it with recommended preventive maintenance activities was also developed. Costs for the three options were developed and were based on the resources needed to maintain a shoulder 1 mile long and 3 feet wide for 1 year. To develop the cost estimates, the following labor, equipment, and material costs were used: Equipment operator salary (with additive) $21.00/hour Motor grader $21.84/hour Dump truck $12.66/hour Front end loader $16.23/hour Tractor broom $14.23/hour Plant mix surfacing, in place $50.00/ton Slurry seal surfacing, in place $1.00/square yard Aggregate material, FOB $10.00/ton Soil stabilizer $7.00/gallon
Traditional Maintenance
An unpublished survey of VDOT maintenance managers concerning shoulder
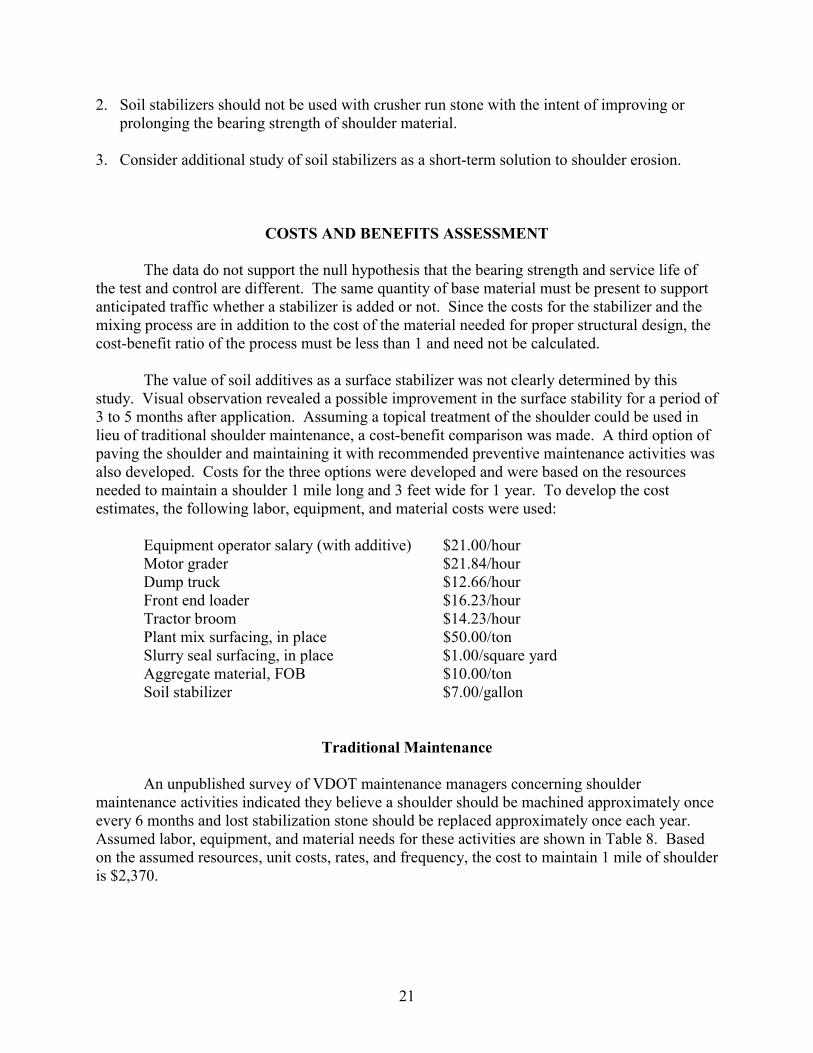
maintenance activities indicated they believe a shoulder should be machined approximately once every 6 months and lost stabilization stone should be replaced approximately once each year. Assumed labor, equipment, and material needs for these activities are shown in Table 8. Based on the assumed resources, unit costs, rates, and frequency, the cost to maintain 1 mile of shoulder is $2,370.
22
Table 8. Labor, Equipment, and Material Needs for Traditional Shoulder Maintenance Activity
Activity Labor Equipment Material Rate Frequency Machining (pulling shoulder)
4 operators 2 motor graders 1 tractor broom
None 4 MH/mile Once/year
Add stone and machine
7 operators 1 motor grader 3 dump trucks 1 tractor broom 1 front end loader
60 tons aggregate material
0.8 MH/ton Once/year
Topically Applied Stabilizers
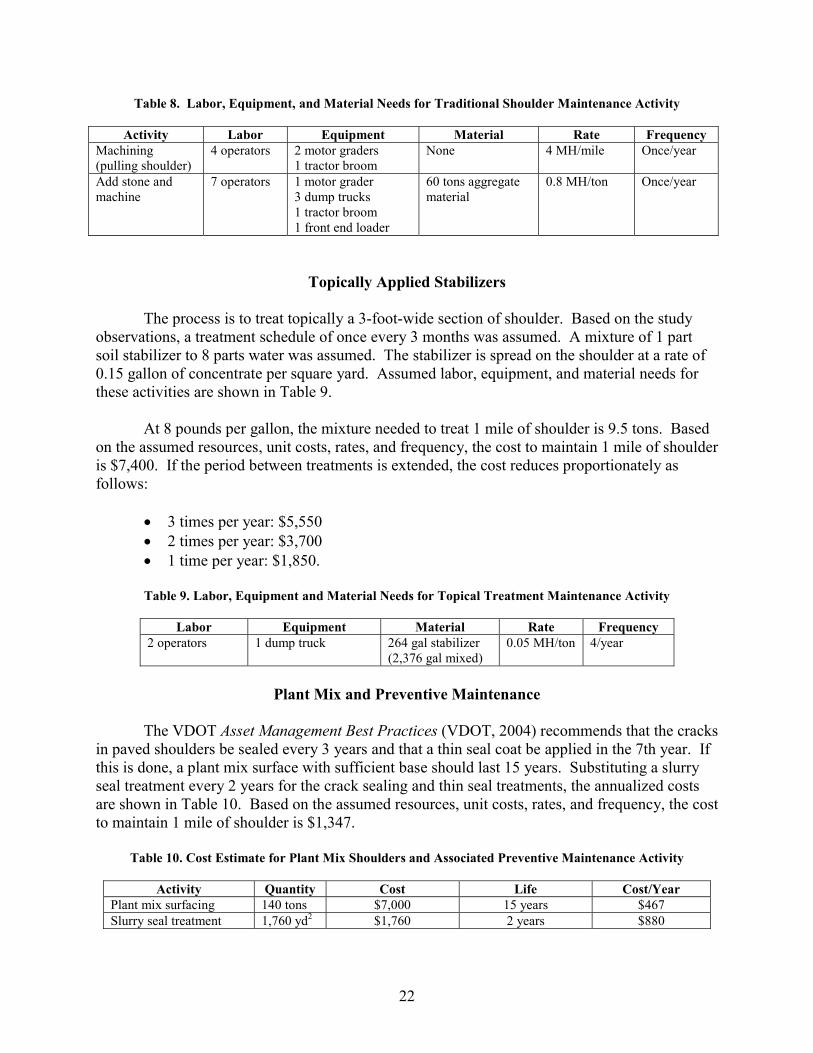
The process is to treat topically a 3-foot-wide section of shoulder. Based on the study observations, a treatment schedule of once every 3 months was assumed. A mixture of 1 part soil stabilizer to 8 parts water was assumed. The stabilizer is spread on the shoulder at a rate of 0.15 gallon of concentrate per square yard. Assumed labor, equipment, and material needs for these activities are shown in Table 9.
At 8 pounds per gallon, the mixture needed to treat 1 mile of shoulder is 9.5 tons. Based
on the assumed resources, unit costs, rates, and frequency, the cost to maintain 1 mile of shoulder is $7,400. If the period between treatments is extended, the cost reduces proportionately as follows:
�� 3 times per year: $5,550 �� 2 times per year: $3,700 �� 1 time per year: $1,850.
Table 9. Labor, Equipment and Material Needs for Topical Treatment Maintenance Activity
Labor Equipment Material Rate Frequency
2 operators 1 dump truck 264 gal stabilizer (2,376 gal mixed)
0.05 MH/ton 4/year
Plant Mix and Preventive Maintenance
The VDOT Asset Management Best Practices (VDOT, 2004) recommends that the cracks
in paved shoulders be sealed every 3 years and that a thin seal coat be applied in the 7th year. If this is done, a plant mix surface with sufficient base should last 15 years. Substituting a slurry seal treatment every 2 years for the crack sealing and thin seal treatments, the annualized costs are shown in Table 10. Based on the assumed resources, unit costs, rates, and frequency, the cost to maintain 1 mile of shoulder is $1,347.
Table 10. Cost Estimate for Plant Mix Shoulders and Associated Preventive Maintenance Activity
Activity Quantity Cost Life Cost/Year
Plant mix surfacing 140 tons $7,000 15 years $467 Slurry seal treatment 1,760 yd2 $1,760 2 years $880
23
Cost-Benefit Comparison
The cost-benefit ratio of topically applied stabilizers versus the traditional maintenance method is less than 1. The time between treatments with the stabilizer must be extended to 10 months before the ratio exceeds 1. This exceeds the manufacturer’s recommendation for all biodegradable soil stabilizers.
The cost-benefit ratio of the use of plant-mix shoulders versus traditional maintenance does exceed 1, which indicates using plant mix and preventive maintenance are more cost-effective than maintaining the shoulders in an unpaved state. This analysis assumes the paved and unpaved shoulders have the similar base stabilization, which would normally be some depth of crusher run stone. If the unpaved shoulder is of some other material, such as soil or sod, and meets the level-of-service requirements, the cost of crusher run stone under the plant mix would be an additional paved shoulder cost. In that case, the cost-benefit ratio may favor the unpaved shoulder.
This study found that where shoulders are stabilized with crusher run stone, the benefits of biodegradable soil stabilizers do not exceed the costs. There is no additional cost or anticipated benefit from the implementation of the recommendations of this study.
ACKNOWLEDGMENTS
The author gratefully acknowledges the valuable assistance provided by the following members of VDOT’s Chesterfield Residency staff: Raymond L Mayo, Transportation Operations Manager II; Earl H. Tyler, Transportation Operations Manager II; and Marvin A. Sirry, Assistant Resident Engineer for Maintenance. Special thanks are extended to the VDOT Area Headquarters employees at Powhatan and Bethia who expertly provided construction support and reliably provided traffic control through safe and secure work zones without incident. Slurry Pavers of Richmond, Virginia, placed the test sections. Their patience and cooperation under difficult construction conditions are appreciated. Assistance with the statistical analysis was received from James S. Gillespie. His patience and persistence are appreciated.
REFERENCES
Bergmann, R. 2000. Soil Stabilizers on Universally Accessible Trails. Technical Report 0023-
1202-SDTDC. U.S. Department of Agriculture, Forest Service, San Dimas, CA. Bushman, W.H., Freeman, T.E., and Hoppe, E.J. 2004. Stabilization Techniques for Unpaved
Roads. VTRC 04-R18. Virginia Transportation Research Council, Charlottesville. Cottrell, B.H., Jr. 1993. Cost Analysis of Paved Shoulders. In Transportation Research Record
1395. Transportation Research Board, Washington, DC.
24
Glennon, J.C. October 2004. Pavement Edge Drop Offs. http://www.johncglennon.com/papers.cfm?PaperID=26. Accessed November 4, 2004.
Olson, P.L., Zimmer, R.A., and Pezoldt, V. 1986. Pavement Edge Drop. UMTRI Report No.
86-33. University of Michigan Transportation Research Institute, Ann Arbor. Souleyrette, R. 2001. Paved Shoulders on Primary Highways in Iowa: An Analysis of Shoulder
Surfacing Criteria, Costs, and Benefits. University of Iowa, Iowa City. Virginia Department of Transportation, Asset Management Division. 2004. Asset Management
Best Practices. Richmond. Webster, S.L., Brown, R.W., and Porter, J.R. 1994. Force Projection Site Evaluation using the
Electronic Core Protection and Dynamic Cone Penetrometer (DCP). Technical Report GL-94-Air Force Civil Engineering Support Agency. U.S. Air Force, Tyndall Air Force Base, FL.
25
APPENDIX A
TEST SITE LAYOUT FOR GEOGAUGE™ AND DCP DATA COLLECTION ROUTE 522, POWHATAN COUNTY

26
27
APPENDIX B
VISUAL INSPECTION FORM
RCA Inspection Form Shoulders Codes Section Date Soiltac Centrophase AD MagCl2 Control Attribute Unpaved Shoulder Length (feet) 500 500 X 500 Unpaved Shoulder Width (feet) 6 6 X 6 Unpaved Shoulder Side R R X R Shoulder Type (Aggregate/Topsoil) Aggr Aggr X Aggr Shoulder Wedge Width (feet) n/a n/a X n/a Shoulder Wedge Length (feet) 0 0 X 0 Shoulder Wedge Location (L/R/Both) n/a n/a X n/a Condition Unpaved Shoulder Drop-off (type) N,L,H,B Unpaved Shoulder Drop-off (percent of length) 0,<25,25-50,>50 Shoulder Reverse Slope (percent of length) 0,<25,25-50,>50 Loose Aggregate > 2” (percent of length) 0,<25,25-50,>50 Unpaved Pavement Corrugation > 1” (percent of length) 0,<25,25-50,>50 Shoulder Wedge Adequate n/a

28
29
APPENDIX C
GEOGAUGE™ STIFFNESS DATA
Site Date Section 10/6 10/26 11/30 12/14 2/8 3/31
1 22.75 18.47 21.93 26.06 10.50 17.532 24.26 11.72 25.16 27 7.46 23.473 19.79 11.97 18.01 14.73 11.49 15.864 17.85 12.77 17.58 14.08 11.09 23.35 12.16 10.34 10.56 17.82 9.45 13.856 16.27 12.38 14.92 17.17 5.32 9.737 20.00 13.8 17.77 15.92 8.52 12.57
Soiltac
8 13.51 9.35 13.16 13.03 5.84 7.571 11.81 12.12 14.05 15.39 6.05 6.552 14.60 13.01 10.72 12.62 2.37 4.63 23.90 17.75 13.38 16.08 7.75 11.224 13.75 13.33 15.27 13.75 8.36 11.75 16.14 14.03 16.71 17.08 11.88 11.816 16.83 13.51 13.67 15.84 7.18 10.367 11.30 13.5 15.36 14.37 8.06 6.59
Centrophase AD
8 20.23 15.68 17.04 No data 8.04 13.781 16.11 11.6 No data 17.63 18.46 6.292 19.94 11.5 17.46 30.04 23.11 15.343 18.78 15.87 15.04 27.42 18.90 9.564 22.68 15.65 16.56 20.19 19.56 12.175 18.52 11.01 15.64 23.79 14.85 12.016 28.14 15.01 25.53 40.54 22.29 32.347 21.20 11.8 13.28 13.56 10.42 6.09
Control
8 24.23 9.88 13.11 12.36 12.05 8.32

30
31
APPENDIX D
DCP PENETRATION DATA
Date: 11/3/2004 Section SoiltacSoiltacCentrophaseCentrophaseControl Sample 5 7 2 4 1
Blows/unit inches inches inches inches inches 0 0 0 0 0 0 5 2.76 1.65 1.34 1.97 3.66 10 5.91 2.87 2.68 3.31 6.69 15 7.13 4.25 3.98 4.53 8.46 20 8.46 5.55 5.71 5.43 10.04 25 10.43 7.68 6.61 6.38 11.46 30 11.69 8.50 7.76 7.40 15.00 35 11.97 9.33 9.09 8.46 40 13.58 10.16 10.51 9.33 45 11.73 10.12 50 13.46 10.94 55 12.05 60 14.06
Date: 11/29/2004 Section Soiltac SoiltacCentrophaseCentrophaseControlControl Sample 3 6 3 6 3 6
Blows/unit inches inches inches inches inches inches 0 0 0 0 0 0 0 5 3.15 2.52 2.56 3.94 4.25 2.99 10 5.16 4.29 4.33 8.03 6.10 3.43 15 6.81 5.47 5.24 9.09 7.68 3.74 20 7.95 6.38 5.98 9.84 9.17 4.21 25 8.54 7.09 6.89 10.47 10.16 4.65 30 9.25 7.83 8.23 11.26 10.91 5.31 35 9.96 8.46 9.33 12.80 11.65 5.94 40 10.47 8.98 10.24 16.46 12.80 6.89 45 11.38 9.53 11.18 14.65 7.52 50 13.11 9.92 12.91 8.27 55 15.00 18.07 8.82 60 9.41 65 10.16 70 11.02 75 12.20 80 13.82
32
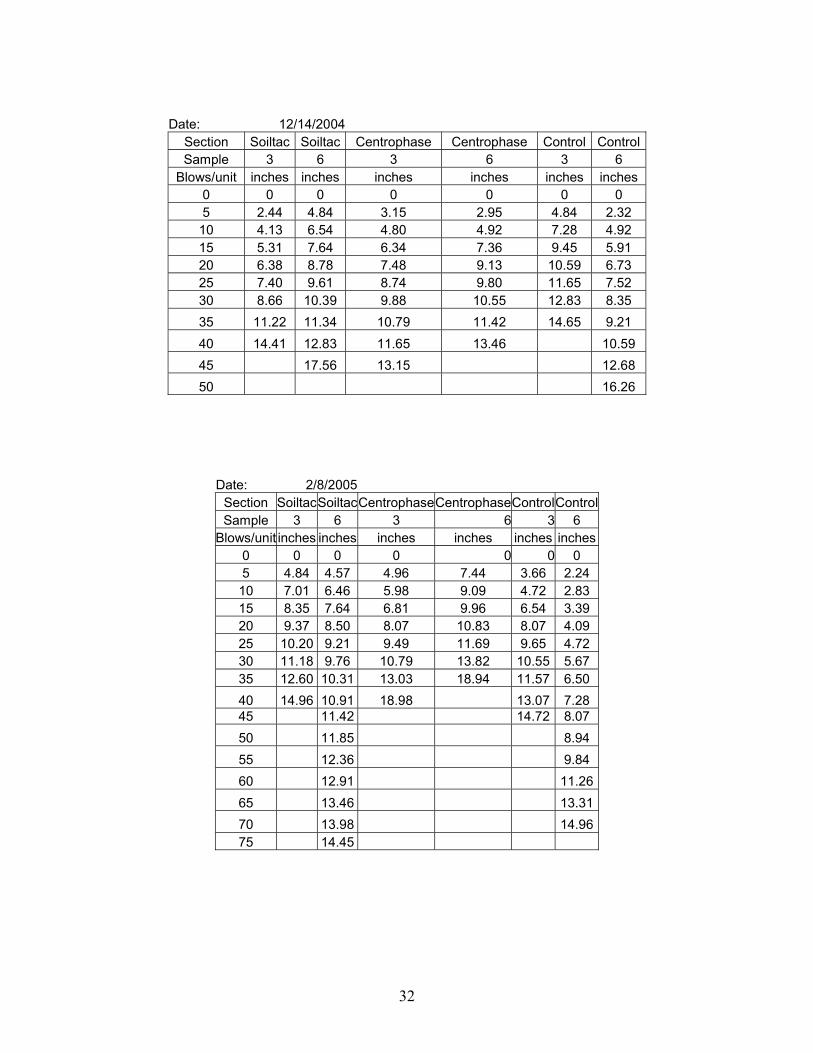
Date: 12/14/2004
Section Soiltac Soiltac Centrophase Centrophase Control Control Sample 3 6 3 6 3 6
Blows/unit inches inches inches inches inches inches 0 0 0 0 0 0 0 5 2.44 4.84 3.15 2.95 4.84 2.32 10 4.13 6.54 4.80 4.92 7.28 4.92 15 5.31 7.64 6.34 7.36 9.45 5.91 20 6.38 8.78 7.48 9.13 10.59 6.73 25 7.40 9.61 8.74 9.80 11.65 7.52 30 8.66 10.39 9.88 10.55 12.83 8.35 35 11.22 11.34 10.79 11.42 14.65 9.21 40 14.41 12.83 11.65 13.46 10.59 45 17.56 13.15 12.68 50 16.26
Date: 2/8/2005 Section Soiltac SoiltacCentrophaseCentrophaseControlControl Sample 3 6 3 6 3 6
Blows/unit inches inches inches inches inches inches 0 0 0 0 0 0 0 5 4.84 4.57 4.96 7.44 3.66 2.24 10 7.01 6.46 5.98 9.09 4.72 2.83 15 8.35 7.64 6.81 9.96 6.54 3.39 20 9.37 8.50 8.07 10.83 8.07 4.09 25 10.20 9.21 9.49 11.69 9.65 4.72 30 11.18 9.76 10.79 13.82 10.55 5.67 35 12.60 10.31 13.03 18.94 11.57 6.50 40 14.96 10.91 18.98 13.07 7.28 45 11.42 14.72 8.07 50 11.85 8.94 55 12.36 9.84 60 12.91 11.26 65 13.46 13.31 70 13.98 14.96 75 14.45
33
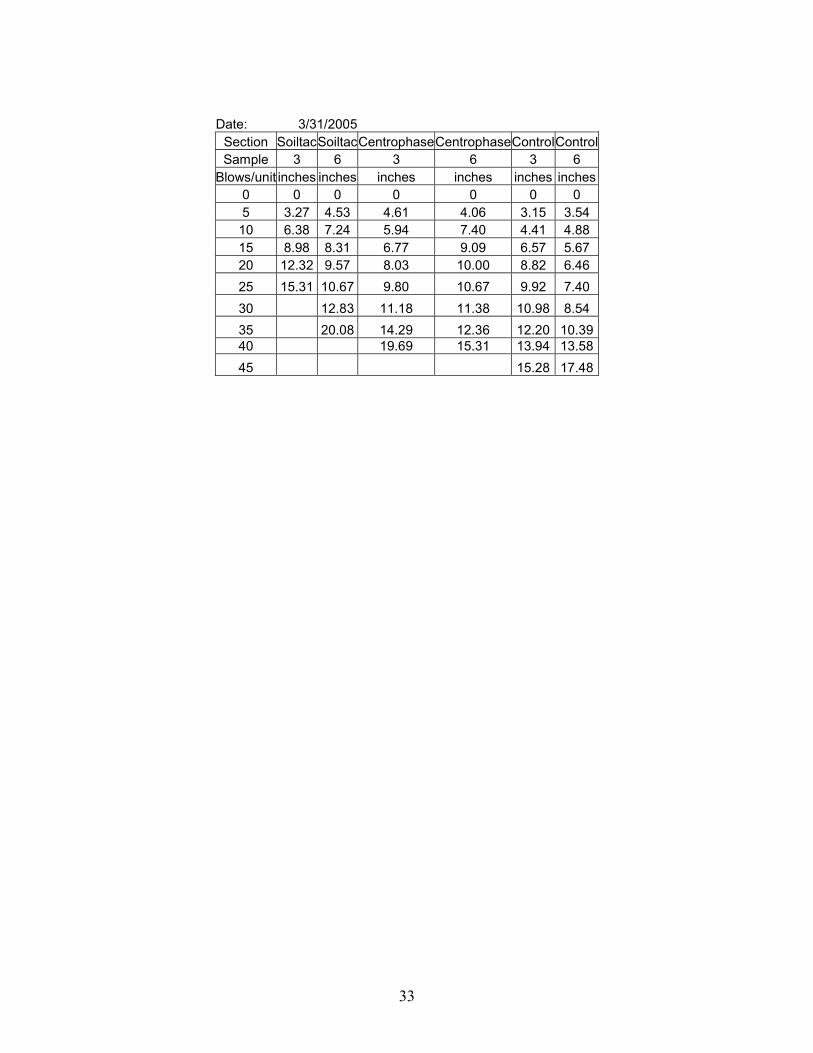
Date: 3/31/2005
Section Soiltac SoiltacCentrophaseCentrophaseControlControl Sample 3 6 3 6 3 6
Blows/unit inches inches inches inches inches inches 0 0 0 0 0 0 0 5 3.27 4.53 4.61 4.06 3.15 3.54 10 6.38 7.24 5.94 7.40 4.41 4.88 15 8.98 8.31 6.77 9.09 6.57 5.67 20 12.32 9.57 8.03 10.00 8.82 6.46 25 15.31 10.67 9.80 10.67 9.92 7.40 30 12.83 11.18 11.38 10.98 8.54 35 20.08 14.29 12.36 12.20 10.39 40 19.69 15.31 13.94 13.58 45 15.28 17.48