Embed Size (px)
Citation preview
Form R-39b (1/1/87)Standard Title Page -- Report on State Project
Report No. IReport: Date No. Pages Type Report: !project ~o. :Interim
t
87!
VTRC 90-l{2 July 1989 Period Covered: IContract ~o. :
ITitle and SubtitleInterim Report: Traffic and Geometric CharacteristicsAffecting the Involvement of Large Trucks in Accidents
I(ey WordsLarge TrucksAccident RatesAccident Involvement Causes
Author(s)Nicholas J~ GarberSarath C. Joshua
Performing Organization Name and Address
Virginia Transportation Research CouncilBox 3817, University StationCharlottesville, Virginia 22903-0817
Sponsoring Agencies' Names and AddressesVa. Dept. of Transportation University of Virginia1221 E. Broad Street CharlottesvilleRichmond, Virginia 23219 Virginia 22903
Supplementary Notes Project funded by:Virginia Department of Motor VehiclesTransportation Safety Administration
Abstract Recent trends indicate that vehicle miles traveled for large trucks is increasing ata higher rate than for other vehicles. The resulting competition between large trucksand other vehicles for highway space can be expected to result in more multivehiclecollisions involving large trucks. The likelihood of these collisions causing severeinjuries to vehicle occupants will also increase with the trend towards the use ofsmaller automobiles and heavier and larger trucks. In order to develop countermeasuresthat will alleviate this problem, it is first necessary to identify the characteristicsof large-truck accidents and the role of traffic and geometric variables in suchaccidents.
The major factors associated with large-truck accidents including the effect ofhighway facility type and highway geometry are investigated. Changes in large-truckaccidents for periods before and after 1982 are evaluated by a comparison of pre- andpost-1982 accident involvement rates. Factors that might have affected large-trucktravel and accident rates include the Surface Transportation Assistance Act of 1982(STAA), the improvement of the nation's economy, and deregulation of the truckingindustry.
The results indicate that fatal crashes involving large trucks have been increasingin contrast to all other vehicles, for which the fatality rates are constant for the sameperiod. Driver-related factors are associated with 75 percent of all accidents involvingtrucks, and driver error is associated with SO percent of all fatal truck accidents. Asignificant correlation is also observed between driver error and highway alignment inaccidents involving trucks. The risk of a fatality in a multivehicle accident involvinga truck and another vehicle is found LO be highest on two-way undivided facilities. Ondivided, limited access facilities, this risk is reduced by 50 percent. An unexpectedincrease in tractor trailer accident involvement rates for non-STAA primary routes isobserved and is attributed to incompatibilities between large-truck characteristics andthe non-STAA highway environment.
This interim report presents the results of the first part of a study, which alsoinvolves the development of models relating accident occurrence with goemetric andtraffic characteristics. The development of these models is now in progress. Thesemodels and the information given in this interim report will facilitate the formulationof countermeasures that will reduce accidents involvin~ large trucks in Virginia.

- 598
INTERIM REPORT
TRAFFIC AND GEOMETRIC CHARACTERISTICS AFFECTINGTHE INVOLVEMENT OF LARGE TRUCKS IN ACCIDENTS
by
Nicholas J. GarberFaculty Research Engineer
and
Sarath C. JoshuaResearch Scientist Assistant
(The opInIons, findings, and conclusions expressed in thisreport are those of the authors and not necessarily those of
the sponsoring agencies.)
Virginia Transportation Research Council(A Cooperative Organization Sponsored Jointly by the
Virginia Department of Transportation andthe University of Virginia)
Charlottesville, Virginia
July 1989VTRC 90-R2
599
600
SAFEr; RESE1\RCH ADVISORY COMMITTEE
P. S. MCCREREY, Chairman, Director, Planning & Program Development,Department of Motor Vehicles
R. J. BREITENBACH, Director, Transportation Safety Training Center,Virginia Commonwealth University
v. M. BURGESS, Trans~ortation Safety Administrator, Department of MotorVehicles
P. D. FERRARA, Director, Bureau of Forensic Science, Division ofConsolidated Laboratories
J. T. HANNA, Deputy Commissioner, Department of Motor Vehicles
c. P. HEITZLER, JR., Program Manager, Department of InformationTechnology
D. R. HENCK, Executive Director, Commission on VASAP
T. A. JENNINGS, Safety/Technology Transfer Coordinator, FHWA
B. G. JOHNSON, Supervisor, Driver £ducation, Department of Education
P. J. LANTEIGNE, Operacions ~ Tactics Bureau, Virginia BeachPolice Department
B. D. LEAP, Driver Services Administrator, Department of MoterVehicles
C. W. LYNN, Reseach Scientist, VTRC
R. P. MINER, Commander, Traffic Division, Fairfax County PoliceDepartment
E. NEWTON, Commander, Albemarle County Police Department
J. T. PHIPPS, Director, Roanoke Valley Alcohol Safety Action Project
C. M. ROBINSON, Director, Bureau of Field Operations, VirginiaDepartment of State Police
c. H. SIMPSON, JR., Division Manager, Planning and Evaluation,Department of Motor Vehicles
F. F. SMALL, Assistant State Traffic Engineer, VDOT
J. A. SPENCER, Assistant Attorney General, Office of the AttorneyGeneral
E. W. TIMMONS, Director of Public Affairs, Tidewater AAA of Virginia,~orfolk, Virginia
ii
ACKNOYLEDGMENTS
601
The authors are grateful to the Virginia Department of MotorVehicles for sponsoring this project and to the personnel of the TrafficEngineering Division of the Virginia Department of Transportation,especially to Fred F. Small, Garland C. Campbell, and James B. Robinsonwho provided the data base on accidents and who assisted with thecollection of traffic data on interstates and other highways.
The authors are especially grateful to Lewis Woodson of theResearch Council. Without his assistance all the data required for thestudy could not have been collected.
The research is being performed under the general guidance andadvice of the Research Task Force on Traffic and GeometricCharacteristics Affecting The Involvement of Large Trucks In Accidentsconsisting of:
Mr. J. Lynwood Butner, ChairmanMr. P. Dale BennettLt. Bernie E. Chisholm, Jr.Mr. David R. GehrMr. Thomas R. HylandMr. David o. McAllisterMr. James Y. SevertMr. Clinton H. Simpson, Jr.Mr. Anthony J. SoluryMr. Roy E. TerryMr. E. Wallace TimmonsCaptain David L. TollettMr. Glenn F. WilliamsMr. Sam Yaksich, Jr.
Virginia Department of TransportationVirginia Trucking AssociationVirginia Department of State PoliceVirginia Department of TransportationVirginia Transportation Safety BoardVirginia Department of Motor VehiclesFormer President, Nationwide HomesVirginia Department of Motor VehiclesFederal Highway AdministrationOvernight Transportation CompanyTidewater AAAVirginia Department of State PoliceVirginia Department of TransportationAAA Foundation for Traffic Safety
iii

~ 602
TABLE OF CONTENTS
PAGE
SAFETY RESEARCH ADVISORY COMMITTEE................................. ii
ACKNOYLEDGMENTS. • • • • • • • • • . . • • • • • • • • .. • • . • • • • • • • • • • . . • • • • • • • • . • • . . • . • iii
TABLE OF CONTENTS.................................................. v
LIST OF TABLES..................................................... vi i
ABSTRACT. . . . . . . . . . . . . . . . . . . . . . . . . . . . . . . . . . . . . . . . . . . . . . . . . . . . . . . . . . . xi
INTRODUCTION. • • • • • • • • . . . . . . . . • . • • . • . • . • • • • • . • . • • • • . • . • • . . • • • • • . • . . . 1
PURPOSE AND OBJECTIVES............................................. 2
METHODOLOGY AND RESEARCH APPROACH.................................. 3
Li t era ture Review. . . . . . . . . . . . . . . . . . . . . . . . . . . . . . . . . . . . . . . . . . . . 3Compilation of Historical Accident Data...................... 3Analysis of the Compiled Accident Data....................... 4
ANALYSIS AND RESULTS............................................... 5
Li terature Review........................................... 5Characteristics of Large-Truck Accidents.................... 11Major Factors Associated with Large-Truck Crashes........... 12Types of Collision in Accidents Involving Large Trucks...... 18The Effect of Road Geometry on Accidents Involving
Large Trucks.............................................. 19Pre- and Post-1982 Large-Truck Travel and Accidents......... 20
SUMMARY OF FINDINGS................................................ 25
Factors Associated with Large-Truck Accidents............... 25Pre-and Post-1982 Changes................................... 26
CONCLUSIONS. • . . • • . • . . • • . . • . • . • . • • • • . • . • . • • • • • • • . . • • • • • • • • • . • • . . • . . . 28
YORK IN PROGRESS................................................... 28
REFERENCES. . . . . . . . . . . . . . . . . . . . . . . . . . . . . . . . . . . . . . . . . . . . . . . . . . . . . . . . . 30
APPENDIX. . . . . . . . . . . . . . . . . . . . . . . . . . . . . . . . . . . . . . . . . . . . . . . . . . . . . . . . . . . 33
v
603

603
LIST OF TABLES
1. Maximum Size and Axle Weights of Large Trucks
2. Percentage Distribution of 1984 Crashes by Day of Week
3. Percentage Distribution of 1984 Crashes by Month
4. Accidents Involving Large Trucks by Percentage of Associated Factors
5. Accidents Involving Large Trucks (1984-1986) by Percentage of AssociatedFactors for Different Truck Types
6. Large-Truck Fatal Accidents by Percentages of Associated Factors
7. Accidents Involving Large Trucks (1984-1986) by Type of Truck andPercentage of Associated Factors
8. Large-Truck Fatal Accidents by Percentage of Major Factors Associatedwith Drivers
9. Large-Truck Fatal Crashes by Percentage of Major Driver Factors forDifferent Truck Types
10. Large-Truck Fatal Crashes by Percentage of Location Alignment
11. Large-Truck Fatal Crashes (1984-1986) by Percentage of LocationAlignment for Different Truck Types
12. Distribution of 1984 Large-Truck Fatal Crashes Associated with DriverError by the Location Alignment
13. Large-Truck Fatal Crashes Associated with Driver Error by Percentageof Alignment and Type of Truck
14. Distribution of 1984 Crashes by Number of Vehicles Involved
15. Percentage Distribution of Vehicle Mix in Two-Vehicle Crashes InvolvingLarge Trucks
16. Comparison of Actual to Expected Proportions of Vehicle Mix inTwo-Vehicle Crashes
17. Distribution of 1984 Fatal Crashes by Number of Vehicles Involved
18. Single and Multivehicle Fatal Crashes
vii
606
LIST OF TABLES (CONTINUED)
19. Comparison of Actual to Expected Proportions of Vehicle Mix inTwo-Vehicle Fatal Crashes
20. The Effect of Type of Facility on Severity of All AccidentsInvolving Large Trucks for the Period 1984 through 1986
21. The Effect of Vehicle Type on Severity of All Accidents InvolvingLarge Trucks on Two-Yay Undivided Facilities
22. All Accidents Involving Large Trucks on Divided Facilities with Noor Partial Control of Access - The Effect of Vehicle Type on Severity
23. All Accidents Involving Large Trucks on Divided Facilities with FullControl of Access - The Effect of Vehicle Type on Severity
24. The Effect of Vehicle Type on Severity of All Large-Truck/Other VehicleAccidents on Two-Yay Undivided Facilities
25. All Large-Truck/Other Vehicle Accidents on Divided Facilities with Noor Partial Control of Access - The Effect of Truck Type on Severity
26. All Large-Truck/Other Vehicle Accidents on Divided Facilities with FullControl of Access - The Effect of Vehicle Type on Severity
27. All Single-Vehicle Large-Truck Accidents on Two-Yay Undivided Facilities- The Effect of Truck Type on Severity
28. All Single-Vehicle Large-Truck Accidents on Divided Facilities with Noor Partial Control of Access- The Effect of Truck Type on Severity
29. All Single-Vehicle Large-Truck Accidents on Divided Facilities with FullControl of Access - The Effect of Truck Type on Severity
30. All Large-Truck/Large-Truck Accidents on Two-Vay Undivided Facilities The Effect of Truck Type on Severity
31. All Large-Truck/Large-Truck Accidents on Divided Facilities with No orPartial Control of Access - The Effect of Truck Type on Severity
32. All Large-Truck/Large-Truck Accidents on Divided Facilities with FullControl of Access - The Effect of Truck Type on Severity
33. Types of Collision for Two-Vehicle Accidents Involving Large-Trucks
34. Effect of Road Geometry on Single-Vehicle Large-Truck Accidents from1984 through 1986
viii
~ 60'7
LIST OF TABLES (CONTINUED)
35. Effect of Road Geometry on Large-Truck/Other Vehicle Accidents from1984 through 1986
36. Average Daily (24 HR) Vehicle Miles of Travel on the Interstate,Arterial, and Primary Routes
37. Total Accidents Per 100 Million Vehicle Miles of Travel on Interstateand Primary Highways
38. Fatal Accidents Rates Per 100 Million Vehicle Miles of Travel onInterstate and Primary Highways
39. Fatal Accident Rates on Interstate Highways
40. Fatal Accident Rates on Primary Highways
41. Injury and Fatal Accident Involvement Rates on Interstate Routes
42. Injury and Fatal Accident Involvement Rates on Primary STAA Routes
43. Injury and Fatal Accident Involv~.ilent Rates on Primary Non-STAA Routes
44. ANOVA Results for Hypothesis I
45. Probability Values for Hypothesis I
46. Mean Involvement Rates (Injury & Fatal)
47. Fatal Involvement Ratio on Interstate Routes
48. Fatal Involvement Ratios on Primary STAA Routes
49. Fatal Involvement Ratios on Primary Non-STAA Routes
50. ANOVA Results for Hypothesis II
51. Probability Values for Hypothesis II
52. Mean Fatal Involvement Ratios
53. Annual Fatal-Injury Accident Involvement Rates
54. Relative Involvement of Tractor Trailers in Fatal-Injury AccidentsBefore and After 1982
ix

'~ 608
ABSTRACT
609
Recent trends indicate that vehicle miles traveled for large trucksis increasing at a higher rate than for other vehicles. The resultingcompetition between large trucks and other vehicles for highway space canbe expected to result in more multivehicle collisions involving largetrucks. The likelihood of these collisions causing severe injuries tovehicle occupants will also increase with the trend towards the use ofsmaller automobiles and heavier and larger trucks. In order to developcountermeasures that will alleviate this problem, it is first necessaryto identify the characteristics of large-truck accidents and the role oftraffic and geometric variables in such accidents.
The major factors associated with large-truck accidents includingthe effect of highway facility type and highway geometry areinvestigated. Changes in large-truck accidents for periods before andafter 1982 are evaluated by a comparison of pre- and post-1982 accidentinvolvement rates. Factors that might have affected large-truck traveland accident rates include the Surface Transportation Act of 1982 (STAA) ,the improvement of the nation's economy, and deregulation of the truckingindustry.
The resul's indicate that fatal crashes involving large trucks havebeen increasing in contrast to all other vehicles, for which the fatalityrates are constant for the same period. Driver-related factors areassociated with 75 percent of all accidents involving trucks, and drivererror is associated with 50 percent of all fatal truck accidents. Asignificant correlation is also observed between driver error and highwayalignment in accidents involving trucks. The risk of a fatality in amultivehicle accident involving a truck and another vehicle is found tobe highest on two-way undivided facilities. On divided, limited accessfacilities, this risk is reduced by 50 percent. An unexpected increasein tractor trailer accident involvement rates for non-STAA primary routesis observed and is attributed to incompatibilities between large-truckcharacteristics and the non-STAA highway environment.
This interim report presents the results of the first part of astudy, which also involves the development of models relating accidentoccurrence with goemetric and traffic characteristics. The developmentof these models is now in progress. These models and the informationgiven in this interim report will facilitate the formulation ofcountermeasures that will reduce accidents involving large trucks inVirginia.
xi

~ 610
611
INTERIM REPORT
TRAFFIC AND GEOMETRIC CHARACTERISTICS AFFECTINGTHE INVOLVEMENT OF LARGE TRUCKS IN ACCIDENTS
by
Nicholas J. GarberFaculty Research Engineer
and
Sarath C. JoshuaResearch Scientist Assistant
INTRODUCTION
Large trucks, which are defined here as trucks having six or morewheels in contact with the road and having a gross vehicle weight greaterthan 10,000 lb, have now become a significant proportion of the vehiclefleet on the nation's highways. In Virginia, for example, the proportionof large trucks on some highways is as high as 50 percent. The vehiclemiles of travel (VMT) of these large trucks on Virginia highways hascontinued to increase over the years, and in 1983, for the first time, therate of increase of large truck VMT surpassed that for passenger cars.Between 1979 and 1982, for example, the average annual rate of increase inthe VMT of large trucks was less than 1 percent per annum, whereas that forpassenger cars, vans, and pickups was about 2.6 percent. Between 1983 and1985, however, the VMT of large trucks in Virginia increased at an averagerate of 8.4 percent per annum, whereas that for passenger cars, vans, andpickups was about 6.3 percent per annum.
In addition to the increase in VMT of large trucks, both the maximumallowable size and axle weights have been increasing over the years. TheSurface Transportation Assistance Act (STAA) of 1982 requires states toallow trucks of 80,000-lb gross weights and l02-in widths and preventsstates from establishing limits on overall tractor trailer lengths(Appendix, Table 1). These provisions apply to all interstate highways andother roads in the federal and primary systems that are so designated bythe secretary of transportation. These roads are now commonly referred toas "STAA designated and access system of highways."
612
Fatal accidents per 100 million VMT for all large trucks in Virginiaincreased from 3.81 to 5.88 between 1982 and 1984 (an increase of about 54percent); that for tractor trailers increased from 2.81 to 5.36 (anincrease of about 90 percent); whereas that for other vehicles (passengercars, vans, and pickups) remained approximately constant at less than a0.30 percent increase.
In order to arrest this trend of increasing fatal accident rates forlarge trucks, it is necessary to identify the crash characteristics and thefactors that are associated with these crashes so that appropriate countermeasures can be implemented. A study is now being conducted in which oneof the objectives is to identify appropriate countermeasures for highwaygeometries to reduce large-truck crashes. The first part of this effort isto carry out a detailed analysis of the historical data on large-truckaccidents in order to determine specific characteristics of theseaccidents. This interim report documents the results of this effort.
PURPOSE AND OBJECTIVES
The purpose of this portion of the study was to identify thecharacteristics oi large-truck accidents in Virginia.
The specific objectives were
o to determine the distribution of large-truck accidents byweekday
o to identify the major causes of large-truck accidents
o to determine whether large-truck accidents are overrepresentedin multivehicle accidents
o to determine the effect of the type of highway on large-truckaccidents
o to determine the effect of road geometry on large-truckaccidents
o to identify significant changes with time in large truckaccident characteristics in Virginia.
2
613
METHODOLOGY AND RESEARCH APPROACH
The methodology for carrying out this portion of the study involvedthe following tasks:
o a review of the literature
o a compilation of historical accident data
o an analysis of the compiled accident data.
Literature Review
A review of the literature was carried out to identify resultsobtained from recent studies similar to this project. Facilities of theUniversity of Virginia, the Virginia Transportation Research Council, andthe Transportation Research Information Service were used to identify andselect appropriate publications for review. Information was sought on thecharacteristics of large-truck accidents, particularly in relation toassociated causal factors and the types and severity of accidents.
Compilation of Historical Accident Data
The basic data on accidents in Virginia were obtained from the policeaccident report forms, which are completed by the police officer investigating every accident involving a fatality, injury, and/or property damageof $500 or more. The recorded information for each year is coded andstored in a computer file; these are referred to as "crash files." TheVirginia Department of Transportation also collects and records in acomputer file travel characteristics of different categories of vehicles.Unfortunately, however, for the period 1980 through 1982, the vehicle typecodes permitted only the extraction of tractor trailer data, since twintrailers were then not permitted on Virginia highways. It was thereforenot possible to obtain accident data for twin trailers as distinct fromthat for tractor trailers for these years. This distinction was, however,available from 1983 onward. As a result, in some parts of the analysis,all tractor trailers were considered one vehicle category. Data on VMTwere available for single-unit trucks and tractor trailers. Thesingle-unit trucks were categorized as 2-axle 4 tires, 2-axle 6 tires, and3-axle 6 to 10 tires.
All of the data used in this analysis were extracted from the crashfiles, Average Daily Traffic (ADT) reports, and accident summary reportsfor 1980 through 1986.
3
614
The term twin trailer is used in this report to describe a combinationof a tractor truck and two trailers or a tractor truck, semi-trailer, and atrailer coupled together.
Analysis of the Compiled Accident Data
The cross-correlation technique was used to develop matrices relatingaccident characteristics and associated factors, and the results obtainedwere used to prepare some of the charts presented herein. Student's t testand the binomial theory were also used when it was necessary to test forsignificant differences or overrepresentation. In order to facilitatecomparison, some analysis was also carried out on crashes of passengercars, vans, and pickups.
The analysis was carried out in two parts. In the first, the trendsin large-truck travel and the accident rates of large trucks on allinterstate and state primary routes were examined. This analysis yielded amacroview of the performance of the entire primary and interstate highwaysystem in the state of Virginia in terms of the impact of the increasingusage of this system by large trucks. Accident rates were determined forthe interstate and primary routes both together and separately. Theserates are given in terms of accidents per 100 million VMT and are differentfrom the accident involvement rates used in the latter half of theanalysis.
Changes in traffic characteristics between the pre- and post-1982periods are evaluated in the latter half of the analysis, which thereforefocused on a microview of different highway and traffic environmentsrepresented by three different categories of highways. Data were compiledon selected interstate, designated primary, and undesignated primaryroutes. The selected routes represented the bulk of the large-truckmileage within each highway category. For example, the selectedinterstate routes accounted for 90 percent of the total interstate mileagein Virginia and carried 96 percent of the total truck VMT on all interstateroutes. The selected STAA primary routes accounted for 75 percent of thetotal STAA primary mileage in Virginia and carried 66 percent of totaltruck VMT on all STAA primary routes. The selected non-STAA primary routesaccounted for 17 percent of total non-STAA primary mileages and carried 30percent of the total truck VMT on non-STAA primary routes. The selectedroutes were:
o interstates: I-64, 1-66, 1-77, 1-81, 1-85, 1-95, and 1-495
o designated primaries: 19, 23, 29, 58, 220, 360, and 460
o undesignated primaries: 1, 10, 11, 15, 17, 50, and 60
4
61 ~J
In this part of the analysis, accident involvement rates for tractortrailers and other vehicles were compared. Assuming equal responsibilityfor an accident in the case of two-vehicle accidents, both vehicles werecounted in the process of obtaining the involvement rates for each vehicletype. These rates are given in terms of involvements per 100 million VMT.Only injury and fatal accidents were considered in obtaining theseinvolvement rates. The reason for the exclusion of property damageaccidents was to avoid the possible introduction of a bias into thereported accidents because of changing repair costs and the role ofsubjectivity in these estimated costs.
Fatal-accident involvement between the two vehicle categories wasalso compared in terms of involvement ratios. These involvement ratios aredefined as the number of fatal involvements per 100 fatal and injuryinvolvements. These ratios serve as an indicator of accident severity.
Analysis of variance was used to determine significant changes byinvestigating the following null hypotheses:
o There is no difference between injury and fatal-accidentinvolvement rates for pre- and post-1982 periods.
a There is no difference between fatal-accident involvementrates for pre- and post-1982 periods.
A comparison was also carried out between the involvement rates oftractor trailers and other vehicles over the period under investi-gation. The relative involvement of tractor trailers compared to all othervehicles is defined in this study as the ratio of their respectiveinvolvement rates.
ANALYSIS AND RESULTS
The following sections summarize the results of the analysis conductedfor this portion of the study.
Literature Review
The following factors have been identified in previous studies ascontributing to truck accidents.
o driver-related factors:
--age, experience, training
5
--drug use
61G
--medical condition
--fatigue
--alcohol use
o vehicle-related factors:
--vehicle design and weight
--crash-worthiness
--driver qualifications
--driver safety
--motivation programs
-~large-truck dynamics and crash avoidance
o highway/environment related factors:
--roadway type
--interchanges/intersections
--grades
--curves
Driver-Related Factors
--stopping sight distance
--roadside hazards
--speed differentials
--lighting and weather.
Driver error has been recognized as a major link in the causal chainin accidents involving large trucks. Shinar analyzed 161 in-depth accidentinvestigations that involved large trucks and found that 8 of 10 causescited most frequently were related to driver error [1]. In a separatestudy in Washington on data based on police reports, inattention andnegligence were identified as the most frequent causes involved in largetruck accidents with another vehicle [2]. The truck driver was the causalfactor in 62 percent of the accidents compared to 31 percent for the otherdriver. Defective truck equipment was cited in 6 percent of the accidents.
The following paragraphs briefly summarize the results from numerousstudies carried out to investigate the influence of driver-related factorson truck crashes.
o Age, experience, and training: A number of studies have yieldeddata and statistics on the distribution of large-truck accidents by age ofthe driver. The results of all the analyses in this area show a cleartrend of high accident rates for the younger age group, low for the middleage group, and somewhat high again for older age group [3, 4]. A survey byWyckoff indicates that drivers under the age of 25 appeared to take greaterrisks and a greater number of them than other drivers [5]. There is little
6
information available on the influence of formal driver training onlarge-truck crashes. However, available data have revealed that manydrivers involved in accidents have not had any formal driver education [6].This situation has also been worsened by the influx of many inexperienceddrivers into the trucking industry as a result of deregulation.
o Medical condition: Accident researchers and concerned organizationshave identified medical conditions that impair a driver's ability torespond to a complex driving situation as a significant contributing factorin motor vehicle accidents. Yaller estimated that 15 percent of allaccidents could be attributed to medical conditions [7]. There is a lackof data relating truck crashes and relevant driver medical conditions.
o Fatigue: According to a study conducted by the American AutomobileAssociation "fatigue is the probable primary cause of 41 percent" of largetruck crashes [8]. Smist and Ranney concluded that drivers of articulatedvehicles were more often reported as fatigued or sleepy [9].
o Alcohol use: The scope and nature of the drinking and drivingproblem among truck drivers is not well understood. Conclusions fromstudies thus far must also consider expected under-reporting of alcoholinvolvement. Among accidents in which the driver was fatally injured,alcohol involvement ranged from 36 percent [10] to 24 percent [11]. Also,drivers of straight trucks were slightly more likely to have been cited asdrinking prior to an accident than drivers of articulated vehicles [8].
o Drug use: There have been very few studies focused on theinvolvement of drug use in large-truck accidents. One study by Terhuneand Fall indicated that about 1 percent of truck drivers are drug users[12]. Vyckoff stated that based on his interview data, the use ofmarijuana appears to be at levels similar to those in overall population[5] .
o Driver qualification: The Federal Government, the states, and themotor carrier industry jointly administer the qualification of drivers tooperate large trucks. From the point of view of accident causation, whatis more relevant is the process of identification and disqualification ofproblem commercial drivers as a preventive measure. This is complicated bythe fact that a significant number of problem drivers hold mUltipledriver's licenses from different states [13]. This problem may be resolvedto a large extent by the new licensing program to be implemented on January1, 1989, under which every commercial vehicle driver will have only asingle license.
o Driver-safety motivation programs: These programs aim at theprevention of large-truck crashes. There is a direct relationship betweenfuel-economical driving techniques and safe-driving techniques. Galligandescribes a program in which carriers gained an increase of 29 percent infuel efficiency and a 50 percent reduction in accident rates [14].
7
617
618
Vehicle-Related Factors
Vehicle design and maintenance are recognized as direct or indirectcauses of accidents. The extent to which these factors interrelate withdriver factors and highway or environmental factors to cause an accident isoften difficult to establish.
The vehicle-related factors identified thus far in studies on thesubject of large-truck crashes and other related topics are summarized inthe following:
o Vehicle design and weight: By vehicle design characteristics,reference is made to truck length, width, number of towed units, cargobody type, and gross vehicle weight. Many studies have investigated theirinfluence on off-tracking, splash and spray, aerodynamics, backing, speedon grades, braking and stability. One particular study by the Yestern Highway Institute claimed that braking and stability can deteriorate as trucklength, weight, and the number of towed trailers increases [15]. Somestudies have found that the accident involvement rates of double trailersare greater than those for single trailers [3]. Fatal accident rates havealso been found to be greater for doubles [16]. There have not been manystudies that have examined the relationship between vehicle weight andaccident occurrence. Perhaps tl1is is due to the particular difficulty inobtaining accurate weight data. A study by Yinfrey found that the heaviestweight group had the highest fatality rate but the lowest accident rate[17].
o Crashworthiness: The crashworthiness of a large truck is definedhere in relation to the types of protection provided for the occupants ofboth the truck and the occupants of other vehicles. The objective ofstudies done on this have mainly been to reduce the fatalities and injuriesresulting from such crashes. Some of the results noted in the literatureare summarized here.
--Truck occupants: The most frequent type of accident leading to atruck occupant fatality is truck rollover. Rollover accounts for 50percent of all single-unit truck fatalities as compared to 26 percent forpassenger cars [6]. The relative levels of protection afforded by thedifferent types of tractor cabs also have been studied. Truck driverfatalities for cab-over-engine tractors was found to be more than doublethat for cab-behind-engine trucks [16].
--Occupants of other vehicles: In all fatal accidents involving atruck and another vehicle, the probability of the fatality being anoccupant of the other vehicle has been found to be 69 percent according tothe Fatal Accident Reporting System data for 1979 through 1980 [18]. Most(90 percent) of the fatal car-in to-truck rear end collisions involvedunderride [19].
8
o Vehicular dynamics and crash avoidance: Some accidents occur whena driver exceeds the safe dynamic performance bounds of his vehicle. Asthe task of driving the vehicle becomes more complex (as in the case ofcombination trucks), special skills are required to handle the vehicle toavoid a collision. Some of the relevant factors that have been studied inthis area are summarized in the following:
--Brake system: One of the common factors contributing to largetruck crashes in which passenger cars were involved was the disparity inthe braking capabilities of the two types of vehicles [20].
--Brake system maintenance: The importance of brake systemmaintenance has been clearly emphasized by the results of manystudies of truck accidents. The Bureau of Motor Carrier Safety (BMCS)found brake systems to be the vehicle defect cited most often. Brakescontribute to 31 percent of all accidents resulting from mechanical defects[21].
--Handling and stability: Dynamic instability in a vehicle can becaused by either simple braking or by steering maneuvers that causeunstable lateral motion or rollover. Ervin et al., analyzing 1976 through1978 BMCS data, found a close relationship between the rollover thresholdan~ the number of accidents involving rollover [22].
--Aerodynamic disturbances and splash/spray effects: Results oftruck experiments by Weir et ale [23] indicated that a passenger carpassing a truck was displaced laterally by the truck's wake from 0.5 to 3.3ft depending upon lane widths, relative and absolute speeds, initialvehicle clearance, and crosswind conditions. Large trucks operating onmost roads during wet weather create splash and spray. Spray-fouled rearview mirrors on trucks can increase the possibility of lane changeaccidents. There has been no study that investigated the contribution ofthis factor to truck accidents.
--Truck-generated stress: The combined effect of long-termsimultaneous exposure to heat, noise, and vibration has been suggested tolead to possible negative physiological or psychological effects that inturn lead to stress-induced fatigue. A study by Mackie et ale indicatedthat truck-cab heat decreased alertness and increased fatigue [24].
--Vehicle conspicuity: Minahan and O'Day have cited this factor asthe main cause of accidents involving an impact into the sides or rear of alarge truck [19]. Green et ale reported the benefits of retroreflectivetreatments applied on trucks [25]. Lum found that flashers on trucksduring both daylight and night hours are effective in reducing the risk ofaccidents [26].
9
619
620
Highway, Traffic, and Environmental Factors
Accident experience in Virginia for the years 1980 through 1985 hasshown that tractor trailer accident involvement rates are lowest oninterstates [27]. The same is true for all other vehicles. This clearlyindicates the effect of superior highway and traffic conditions on reducingaccidents, all else being equal.
This literature review has indicated that there has been littleresearch investigating the effect of highway and geometric factors on truckaccidents. The following paragraphs summarize some of the relevantfindings on the role of each factor.
o Roadway type: Classifying roadways into freeways or nonfreewaysand urban or rural, an accident rate comparison by Vallette et ale foundthat the rates for large trucks were highest on urban nonfreeways andlowest on rural freeways [3]. A study by Cirillo et ale found that accesscontrol and other freeway design features had a positive impact on truckaccident rates [28].
o Interchanges: The study by Vallete et ale found that 16 percent ofthe truck accidents on freeways occurred in the vicinity of an interchange[3]. A similar finding has been l~ported by Cirillo, who also found thatthe accident rates at off-ramps in most cases were higher than the rate aton-ramps [28].
o Intersections: The study by Vallette et ale found that of thelarge-truck accidents at intersections, 65 percent occurred on urbanfreeways and 23 percent on rural freeways. Other studies have alsoindicated that all types of trucks are more involved in accidents atjunctions than other vehicles [3].
o Grades: Large trucks encounter special risks on grades. On theupgrades, they are subject to being struck in the rear by faster vehicles,and on downgrades, they are susceptible to runaway accidents or strikingslower vehicles. Scott and O'Day endorsed this as the most likely order ofaccident occurrences on grades [4].
o Curves and superelevation: Accidents involving large trucks oncurves have been found to range from a low of 7 percent on urban freewaysto a high of 34 percent on rural freeways [3]. An analysis of the fatalaccident reporting system (FARS) data for combination trucks in which thedriver was killed showed that 4S percent of single-vehicle accidentsoccurred on curved sections of roadway compared to 16 percent for multiplevehicle accidents.
Despite the critical role of superelevation in maintaining vehiclestability, few studies have addressed this issue. Using data from
10
single-vehicle crash sites and comparison sites, an investigationby Zador et ala has shown that inadequate banking on curves presents asignificant risk to trucks [29].
o Stopping sight distance: Stopping sight distance is the distancetraveled by a vehicle from the instant its driver sights an object thatrequires a stop to the instant when the vehicle has been brought to a stopby the application of brakes. It has generally been assumed that thelonger sight distance afforded by higher eye height compensated for thelonger stopping distances required by trucks. An investigation of thisassumption concluded that although there is some compensating effectbecause of the higher eye height of the truck driver, the length of passingzones standardized for passenger cars are inadequate for trucks [30].
o Roadside hazards: According to FARS data from 1980 through 1985,approximately a third of fatal accidents were reported as collisions withfixed objects. Considerable effort has gone into the development ofbreakaway roadside features and protection devices to reduce this toll,particularly for passenger cars since they represent the majority ofvehicles. Many of these protection devices, such as impact attenuators,guardrails, bridge rails, and median barriers that have been designed forautomobiles have been found to be inadequate to contain heavier vehicles[31,32,33].
o Speed differentials: The greater the variation in speed of anyvehicle from the average speed of all traffic, the greater its chances ofbeing involved in an accident [34]. A beneficial effect of the nationalspeed limit of 55 mph at the time it was imposed was a reduction in thespeed differential that existed between cars and trucks [35, 36].
o Lighting and weather: Although data are available on accidents,there has been a lack of relevant exposure data needed for an investigationinto the role played by lighting and weather. A study by Jovanis and Changincluded the hours of snow exposure as an independent variable in anaccident causation model [37].
Characteristics of Large-Truck Accidents
The results obtained from the different analyses carried out duringthis portion of the study are summarized in the following subsections. Thedetails of the specific analytical methodology used are also described whenthis is necessary to clarify the computation carried out.
11
621
Effect of Day of the Week
The t test at a 5 percent significance level was performed on each setof data to determine whether accident frequency during weekdays (Mondaythrough Friday) is significantly different from that for weekends (Saturdayand Sunday). This was done by proposing the null hypothesis that theaverage percentage of crashes during the week equals the average percentageduring the weekend. The analysis shows that although it can be concludedthat there is a significant difference between the frequencies of largetruck crashes during weekdays and weekends, this conclusion cannot be madefor other vehicle crashes (Appendix, Table 2). In fact, it can be seenthat although Friday accounts for the highest percentage of crashes forboth large-trucks and other vehicles, the number of large truck crashesdeclines significantly during the weekend. The total percentage oflarge-truck crashes occurring during the weekend is less than that for anyother day of the week. This may be due to the reduced truck VMT on thesetwo days. These results suggest that countermeasures such as increasedpolice enforcement for reducing crashes due mainly to driver causes (e.g.,speeding) may be effective during any day of the week for other vehiclesbut will be much more effective for large trucks if implemented during theweek rather than on weekends.
Effect of Month
The percentage distribution of large-truck and other vehicle crasheswas also obtained to determine whether the frequency of truck crashesvaries seasonaly (Appendix, Table 3). There is little difference betweenthe distributions for large trucks and that for other vehicles. Theminimum frequency occurred in February both for large trucks and othervehicles. However, the maximum frequency for large trucks occurred inAugust, whereas that for other vehicles occurred in November and December.
Major Factors Associated with Large-Truck Crashes
The major factors associated with large-truck crashes can becategorized as follows:
o driver related
o vehicle related
o highway/environmental related.
Although age, experience, fatigue, alcohol, and drug use have in thepast been treated as driver-related factors, in this study, the data
12
623
available will allow a breakdown of driver-related factors into fatigue(handicapped driver), speeding, error, and alcohol and/or drugs. Examplesof driver error are improper passing, driving left of centerline while notovertaking, failing to return to right-of-way, improper turns, andfollowing too closely.
Vehicle defects have traditionally included brake system, tires,aerodynamic disturbances, and truck-generated stress--such as heat, noise,and vibration. The data available in Virginia, however, give ninesubcategories, which include defects in lights, brakes, and steering,puncture or blow-out, worn or slick tires, and engine trouble. In thisstudy, however, a detailed breakdown of vehicle defects was not carried outsince the main objectives did not include the identification of countermeasures relating to vehicle defects.
Environmental causes usually include lighting, weather, and pavementcondition (wet or dry). Highway causes usually relate to the geometriccharacteristics such as grades and curves. In this study, five subgroupswere used for geometric characteristics: (1) straight and level, (2) curveand level, (3) grade and straight, (4) grade and curve, (5) and others(which include crest curve and sag curve).
The major factors are first presented for all large-truck crashes andthen separately for straight trucks, tractor trailers, and double trailersin terms of the three major groups--driver, vehicle, and environment--and afourth group that includes all other factors. In each year, driverrelated factors accounted for about 75 percent of the crashes. Vehiclerelated factors accounted for 6 to 9 percent of crashes, whereas otherfactors accounted for 14 to about 19 percent (Appendix, Table 4). Itshould be noted again that it is likely that the percentage for vehiclerelated factors may be higher than indicated in this table because of theway the accident reports are normally completed by the police. It isclear, however, that vehicle-related factors are much lower than driverrelated factors. It is interesting to note, however, that although thepercentage of crashes for which driver-related factors was identified isvery high, it decreased between 1984 and 1985. Further analysis of thedata also showed that the actual number of crashes for which adriver-related factor was identified increased by only 17 percent between1984 and 1986, while the number of crashes for which factors other thandriver, vehicle, and environment were identified increased by about 47percent. This shows that the rate of increase in the number ofdriver-related crashes is significantly lower than that for all othercrashes. The identification of countermeasures that will significantlyreduce other crashes will therefore help in the reduction of total crashes.
The distribution of accidents by the major associated factors from 1984through 1986 is similar for the different categories of trucks.Driver-related factors, for example, are the predominant associated factors
13
624
in that they account for 75, 75, and 74 percent of crashes for straighttrucks, tractor trailers, and twin trailers respectively (Appendix, Table5).
Since it is essential to develop countermeasures that will not onlyreduce large-truck crashes but will also significantly reduce fatallarge-truck crashes, an analysis of the fatal large-truck crashes was alsocarried out to determine the predominant associated factors. Driverrelated factors have been the major cause of all large-truck fatalaccidents from 1984 through 1986 accounting for 86 to 92 percent of suchaccidents (Appendix, Table 6). Driver-related factors were also recordedas being associated with 84 percent of the fatal crashes for single-unittrucks, 92 percent for tractor trailers, and 100 percent for twin trailers(Appendix, Table 7). It should be noted however that only one fatalaccident was reported involving a twin trailer from 1984 through 1986. Ofthe specific driver factors involved, driver error has the highest frequency, followed by speeding, drinking, and driver handicap (which includesfatigue and sleeping) (Appendix, Tables 8 and 9). A counter-measure thatwill significantly reduce large-truck driver error will significantlyreduce fatal crashes. It is, however, not easy to identify the specificerrors made by drivers. However, since highway geometry was notconsidered as a factor in fatal crashes, it was necessary to investigatethe correlation between driver error and road alignment. It is likely thatdriver error is related to the alignment characteristics of the road inthat a driver is more likely to make a maneuvering error on a curvy sectionthan a straight and level section of road. The influence of roadalignment on fatal crashes was therefore investigated. It should be noted,however, that for this part of the analysis, data on alignmentcharacteristics were obtained from the police accident report forms. Inthe development of the models relating geometric and accidentcharacteristics, actual field data were collected, which will be describedin the appropriate section.
Thirty-two to forty-eight percent of all fatal truck accidents atdifferent alignments occur on straight and level sections of road(Appendix, Table 10). In 1984, for example, about 60 percent of all fataltruck accidents occurred on sections of roads on which there is either ahorizontal curve or a vertical curve and/or a grade (Appendix, Table 10).Although twin trailer data indicate that all fatal accidents occurred onstraight and level road sections, this is based on a total of one accidentand is therefore not an accurate representation of the effect of geometry.Both straight trucks and tractor trailers experienced 59 to 66 percent ofall fatal accidents on road sections with horizontal and/or vertical curves(Appendix, Table 11).
The alignment distribution for the locations of 1984 fatal largetruck crashes for which driver error was identified, and for the differentcategories of trucks separately shows that nearly all of these crashes
14
62 -~~
occurred at curves, which again suggests that highway alignment may be ofimportance (Appendix, Tables 12 and 13).
The results therefore indicate that alignment may influence fatallarge-truck crashes and that an identification of the alignment characteristics that are predominant in fatal large-truck crashes would beuseful in determining engineering countermeasures that would be effectivein reducing these crashes.
Number of Vehicles Involved in Crashes
Table 14 gives the distribution of total 1984 crashes by the number ofvehicles involved in each crash for both large trucks and other vehicles onall highways. It is important to note that although about 35 percent ofother vehicle crashes involve one vehicle, only about 22 percent of largetruck crashes involve one vehicle. The highest percentage (69) of largetruck crashes involve two vehicles, whereas about 59 percent of othervehicle crashes involve two vehicles. Also, 9 percent of large-truckcrashes involve three or more vehicles, whereas about 6 percent of othervehicle crashes involve three or more vehicles. The results indicate thatit is much more likely for a large-truck crash to involve more than onevehicle than a crash involving other vehicles (Appendix, Table 14).
Further analysis of the data for the interstate and primary highways(Appendix, Table 15) indicates that when a large truck is involved in atwo-vehicle crash, there is a 94 percent chance that the other vehicleinvolved is not a truck. One may be tempted to conclude that this overrepresentation should be expected because of the large percentage of othervehicles in the vehicle fleet on the highways.
In order to determine whether this phenomenon is due to the overrepresentation of other vehicles in the vehicle fleet, the binomialtheorem was used to compare the actual and expected proportions of othervehicle/other vehicle, large-truck/other vehicle, and large truck/largetruck crashes based on the exposure represented by VMT of each vehicletype. Only two-vehicle crashes were considered since they were thelargest percentage of the multivehicle crashes.
Let the proportion of other vehicle exposure p
and the proportion of large-truck exposure = q
Then the expected proportions of crashes are:
other vehicle/other vehicle crashes = p2
2large-truck/large-truck crashes = q
15
large-truck/other vehicle
= 2pq (since p+q = 1)
2 21 - (p + q )
1984 Annual VMT on Virginia Interstate and Primary Highways
other vehicle 21.73 x 10⁹
large trucks 2.63 x 10⁹
Thus: p 21.73 0.8924.36
q 2.63 ° 1124.36= ·
The number of two-vehicle crashes in 1984 on the interstate andprimary highways for which both vehicles were identified was:
other vehicle/other vehicle 19,951
large-truck/large-truck 333
large-truck/other vehicle 5,015
The results show that while the proportion of other vehicle/other vehiclecrashes is slightly lower than expected, those for large-truck/large-truckand large-truck/other vehicle are slightly higher (Appendix, Table 16).
Number of Vehicles Involved in Fatal Crashes
Although the highest percentage of other vehicle fatal crashesinvolved only one vehicle, the highest percentage (60.1) of large-truck fatal crashes involved two vehicles (Appendix, Table 17). Also,about 15 percent of the fatal large-truck crashes involved three or morevehicles, whereas only about 3 percent of the other vehicle fatal crashesinvolved three or more vehicles (Appendix, Table 17). The percentage ofsingle-vehicle crashes that are fatal is 1.6 for large trucks and 1.3 forother vehicles, but the percentage of multivehicle fatal crashes involvinglarge trucks is 13.3, while that for other vehicles is only 0.3 (Appendix,Table 18). This clearly indicates that whereas the frequency of fatalcrashes when a single vehicle is involved is about the same for largetrucks and other vehicles, it is about 40 times more likely that a fatalitywill occur when a large truck is involved in a multivehicle crash than whenonly other vehicles are involved.
16
Under the assumption that all crashes are random events, the binomialtheorem was used to compare actual and expected fatal crashes involving twovehicles on the interstate and primary systems. This analysis was based onVMT for large trucks and other vehicles using the following data. Thenumber of two-vehicle fatal crashes in 1984 on the interstate and primaryhighways for which both vehicles were identified:
other vehicle/other vehicle 196
large-truck/large-truck 2
large-truck/other vehicle 113
Other vehicle/other vehicle and large-truck/large-truck fatal crashesare underrepresented, while large-truck/other vehicle fatal crashes aresignificantly overrepresented (by as much as 85 percent) (Appendix, Table19). These results suggest that countermeasures that will reduce thenumber of multivehicle crashes involving large-trucks will have a significant impact on fatal crashes involving large trucks. Since the data showthat most multivehicle crashes involving large trucks also involve othervehicles, the separation of large trucks from other vehicles on the highwaymay be an effective way of reducing multivehicle crashes involving largetrucks. It must be emphasized however, that such a countermeasure shoul~
not be implemented until its full impact has been identified.
Effect of the Type of Highway Facility on the Severity of AccidentsInvolving Large Trucks
For the purpose of this analysis, data for the years 1984 through1986 were considered. Three types of highway categories were considered;two-way undivided facilities, divided facilities with partial or no controlof access, and divided facilities with full control of access. The firstand second categories consist entirely of the primary system, and the thirdcategory consists of the interstate system and some primary system mileagein Virginia. A comparison of the severity of all accidents involving largetrucks on the different types of facilities and by the types of truck gavethe following results. Injury accidents accounted for 35 to 38 percent andproperty damage accidents accounted for 59 to 63 percent of all accidentsinvolving large trucks on all types of facilities (Appendix, Table 20).However, statistics for fatal accidents indicate a clear difference betweenthe types of facilities. For facilities with full control of access fatalaccidents account for 1.4 percent, for divided facilities with partial orno control of access, 2.0 percent, and 3.0 percent for two-way undividedfacilities (Appendix, Table 20). All accidents involving large trucks wereconsidered to belong to one of three categories: (1) large-truck/othervehicle accidents, (2) single vehicle large-truck accidents, (3) largetruck/large truck accidents.
17
628
Large Truck/Other Vehicle Accidents
A closer examination of the accidents on each type of facility and theaccident type indicate that a majority of fatal and injury accidents involving large trucks consist of accidents involving large trucks and other vehicles on all of the facilities (Appendix, Tables 21-23). The risk of injury or property damage in any accident involving large trucks and othervehicles seems to be approximately the same for all truck types on anyfacilty (Appendix, Tables 24-26). However, the risk of fatality seems tobe worst on the two-way undivided facilities for tractor semitrailers(Appendix, Table 24). Yhen the truck is a straight truck, this risk isalmost equal for all divided facilities but is twice as much on undividedfacilities. Yhen the truck is a tractor semitrailer, the risk is loweredby about 80 percent as we go from undivided two-way facilities to facilities with full control of access (Appendix, Tables 24-26). No such conclusions regarding the fatality risk can be arrived at for the twin trailerssince there was only one fatal accident involving twin trailers during thisperiod.
Single Vehicle/Large-Truck Accidents
A comparison of the percentages of fatal single-vehicle t~J~k
accidents on different types of highways indicate that tractor semitrailers have the worst record on all facilities (Appendix, Tables 27-29).A somewhat surprising result is that the highest percentage of suchinvolvements occurred on divided facilities with partial or no control ofaccess (Appendix, Table 28). This may be attributed to the fact that asignificant amount of large-truck mileage in Virginia takes place on suchfacilities and at higher operating speeds than on the two-way undividedfacilities. Also, these roads are not as safe as interstate facilities andare more susceptible to run-off-the-road accidents.
Large-Truck/Large-Truck Accidents
An examination of all large-truck/large-truck accidents indicate thataccidents involving two tractor-trailers tend to be more severe than accidents involving other combinations of large trucks on all types of highways(Appendix, Tables 30-32). It should be noted, however, that only a smallnumber of accidents involving a double-trailer and a tractor trailer wererecorded, and no accident involving two double trailers was recorded.
Types of Collision in Accidents Involving Large-Trucks
The distribution of various combinations of two-vehicle accidents
18
involving large-trucks by the type of collision shown in Table 33 in theAppendix indicates that in all accidents involving two large trucks, theleading type of collision is rear-end followed by same-direction-sideswipe.For accidents involving a large-truck and any other vehicle, the leadingtype of collision is same-direction-sideswipe except in the case ofstraight trucks, for which it is rear-end collisions.
The high incidence of rear-end collisions between large trucks may beattributed to an inadequacy in the braking capability of large trucks.However, when both vehicles involved are trucks, the braking distancescould be expected to be similar, resulting in lower numbers of rear-endaccidents between large trucks. The fact that crash data indicateotherwise may be because of large disparities in braking capabilities orbraking demand among trucks. Such disparities could arise because ofdifferences in truck configuration and gross vehicle weight.
In collisions between large trucks and other vehicles, the highincidence of same-direction-sideswipe collisions indicate that a largepercentage of such accidents take place in vehicle maneuvers that involvelane changing, passing, or lane straddling.
The Effect of Road Geometry on Accidents Involving Large-Trucks
It is common knowledge that the demands on any vehicle or driver aregreater on roadway sections that have curves or grades. This demand on thedriving task is known to be greater in the case of large trucks, because oftheir weight and size. In order to investigate the effect of road geometryon accidents, we compared the incidence of accidents on two types ofroadway sections: (1) curves and grades and (2) all other geometries.
Single-Vehicle Large-Truck Accidents
Tractor trailers seem to have the highest probability of involvementin single-vehicle large-truck accidents (Appendix, Table 34). Althoughtwin trailers show a 1 percent involvement in such accidents, this is basedon a small number of accidents involving twin trailers, hence this may notindicate the true risk for twin trailers.
All types of trucks experience more single-vehicle accidents on curvesand grades than at all other locations (Appendix, Table 34). Twin trailersseem to experience the highest risk on such roadway sections followed bytractor trailers and straight trucks. However, the proportion of fatalaccidents is lowest for twin trailers and highest for tractor trailers.
19
6:30
Large Truck/Other Vehicle Accidents
The results for large truck/other vehicle accidents indicate thatstraight trucks are involved in most of these accidents (53.2 percent)followed by tractor trailers (46.5 percent) and twin trailers (0.3 percent)(Appendix, Table 35). Twin trailers seem to have the highest proportion(51.0 percent) of accidents with other vehicles on roadway sections withcurves or grades. All of the fatal accidents involving twin trailersoccurred on straight roadway sections. However, this is based on a singleaccident. Tractor trailer accidents have the next highest risk with 42percent of all such accidents occurring on curves and grades. The proportion of fatal accidents on curves is 1.5 times that on all other roadalignments. Straight trucks are least involved on curve/grade roadsections with 36.0 percent of all accidents. However, their proportion offatal accidents on such road sections is twice what it is on all other roadalignments.
Pre- and Post-1982 Large-Truck Travel and Accidents
This section describes the results of an investigation carried out toassess changes in pre- and post-1982 large-truck travel and accidentinvolvement in Virginia. These periods are 1980 through 1982 and 1983through 1985. This division was selected because the larger and longervehicles allowed by the Surface Transportation Assistance Act (STAA) of1982 first appeared on Virginia Highways in 1983. First, a macroview ofthe performance of the interstate and primary highway system in Virginiawas obtained by comparing travel miles and accident rates for the period1980 through 1985. The performance of three different highway and trafficenvironments using the selected routes listed earlier was obtained througha comparison of their respective accident rates before and after 1982. Thethree highway environments--interstates, STAA designated primaries, andundesignated primaries--were represented by the routes that carry thehighest truck mileage within each category.
STAA of 1982
STAA of 1982 provided for the expansion of the federal role in theregulation of the size and weight of large trucks. STAA required states toraise any limits that were more restrictive than federal ones, and federallimits were extended to roads other than interstates.
Table 1 (in the Appendix) shows the size and weight prOVISIons of theSTAA compared with those stipulated in the Federal-Aid Highway Act of1956. The maximum allowable axle load is 20,000 lb for tractor trailersand 34,000 lb for tandem trailers. The overall gross weight of trucks withfive or more axles is 80,000 lb. All states are prohibited from imposing
20
lower weight limits than those shown in Table 1. In addition to theincrease in axle loads, no state can limit the length of the semitrailer ina tractor trailer combination to below 48 ft, nor the length of eachtrailer in a twin-trailer combination to less than 28 ft. The act alsoprohibits all states from limiting overall lengths of tractor semitrailersor combinations with two trailers, and requires all states to raise thelimit on truck width to 102 in. These provisions apply to all interstatehighways and other roads in the federal and primary systems that are sodesignated by the Secretary of Transportation. These roads are now commonlyreferred to as "designated and access highways."
Large Trucks VMT
An increase in the number of tractor trailers and twin trailers hasbeen observed on the nation's highways since 1983. A similar increase hasalso been observed on Virginia highways, where the annual daily VMT fortractor trailers on interstate, arterial, and primary routes increased byabout 27 percent between 1983 and 1986, while the increase for passengercars during the same period was only about 23 percent. During the sameperiod, the annual VMT for all large trucks increased by about 26 percenton similar roads (Appendix, Table 36). One reason commonly given for thesupport of some aspects of the STAA is that the increased use of twintrailer trucks will not have a significant impact on overall highway safetysince increased capacity of twins may cause the overall truck travel todecline. Analysis of the data in Virginia showed, however, that annualmiles of total truck travel has continued to increase at a very high rate,despite increasing twin trailer travel. Tractor trailer VMT significantlyincreased in 1983 and continued to increase through 1986 (Appendix, Table36). Overall, large-truck travel also significantly increased in 1983 andhas continued to increase since. Two- and three-axle trucks also showedsimilar results. These results do not indicate that large-truck traveldecreased as anticipated. In fact, the results indicate that not only isthe travel of tractor trailers increasing in the state, the travel of otherlarge trucks is also increasing significantly. It should be noted,however, that other factors such as the growth in the nation's economy andderegulation of the trucking industry might have contributed to thesignificant increase in large truck VMT.
Large-Truck Accident Rates
An analysis of the accident rates for different types of vehicles willindicate the extent to which STAA vehicles are involved in accidents, andthereby the effect of the STAA on highway safety in Virginia. However,because of the way accident data have been recorded in Virginia, data onlengths and widths of large trucks involved in accidents are unavailablefor the period before 1987. Also, it is not possible to determine the VMTof twin trailers as distinct from that for tractor semitrailers, since up
21
63 0~J
to recently the data for both types of vehicles were recorded as "tractortrailers." Some sections of the analysis presented here, therefore, coverboth types of vehicle under the category tractor trailer. Also, because ofthe lack of adequate data, the direct effect of STAA vehicles on overalllarge-truck accident rates cannot be evaluated at this time.
o Total Accident Rates on Interstate and Primary Routes: Acomparison of the accident rates on interstate and state primary highwaysfor different categories of vehicles was carried out to determine whether asignificant increase in these rates occurred for tractor trailers after1982. These accident rates are based on the total number of accidents per100 million VMT. A comparison between the average accident rates for thepre- and post-1982 periods indicate that the tractor trailer total accidentrates have decreased by 0.17 percent, whereas those for all vehicles havedecreased by 2.80 percent (Appendix, Table 37).
o Fatal Accidents: The average fatal accident rates for the pre- andpost-1982 periods indicate that there has been a decrease of 10.75 percentfor all vehicles, whereas for tractor trailers there has been an increaseof 26.75 percent (Appendix, Table 38).
On the interstates, tractor trailer fatal accident rates haveincreased by almost 3~ percent, whereas the rate for all vehicles has onlyincreased by 5.06 percent (Appendix, Table 39). In the case of stateprimary highways, tractor trailer fatal accident rates have increased by27.3 percent, while those for all vehicles have decreased by 13.33 percent(Appendix, Table 40).
o Comparison of Pre- and Post-1982 Accident Involvement Rates: Inthe following analysis, the hypothesis that the accident involvement ratesfor the pre- and post-1982 periods are the same was tested. These accidentinvolvement rates are based only on injury and fatal accidents. The reasonfor omitting property damage accidents is the possible bias introduced intothe data when such accidents are included without making adjustment forthe effect of increasing property damage estimates and changes in propertydamages reporting thresholds.
The involvement rates used in this analysis are the annual (injury +fatal) involvement total per 100 million VMT. Therefore, for the pre- andpost-1982 periods, equal samples of 21 observations from the selected sevenroutes were obtained. Each observation consisted of an accident involvement rate for tractor trailers and one for all other vehicles. Theseinvolvement rates are shown in Tables 41, 42, 43 in the Appendix.
The results of ANOVA for the pre- and post-1982 periods carried outfor three categories of highways and two categories of accidents, are shownin Table 44 in the Appendix. In the usual testing procedure, the null
22
hypothesis is tested at a suitable level of significance in order to rejector accept it. Following this procedure, for the 5 percent significancelevel, the null hypothesis cannot be rejected for all the highway andvehicle combinations since the F values are all less than the criticalvalue of 4.08. However, in order to investigate the dissimilarity betweeninvolvement rates, Type I error probabilities for rejecting the nullhypothesis were obtained from the corresponding F values and are shown inTable 45 in the Appendix. For example, if a Type I error probability forrejecting the null hypothesis is very high, there is hardly any differencebetween the pre- and post-1982 involvement rates. However, if thisprobability is low, that indicates some difference between the pre- andpost-1982 involvement rates, although this difference may not be largeenough to be significant at the 5 percent confidence level. Therefore,these error probabilities serve as an indicator of the dissimilaritybetween the pre- and post-1982 involvement rates compared in thehypothesis. They can also be interpreted as the probability of obtainingthe observed accident rates if the hypothesis is true. Although theseprobability values are indicative of the significance of the dissimilaritybetween the pre- and post-1982 accident involvement rates, they do notdirectly indicate whether the difference is an increase or a decrease(Appendix, Table 45). These indications are, however, given in Table 46.
In the case of tractor trailers, the involvement rates have increasedmostly on undesignated primaries, followed by designated primaries andinterstates (Appendix, Table 46). The probability value of 0.256 fornon-STAA primaries in Table 45 indicates the lowest probability of errorfor rejecting the null hypothesis that pre- and post-1982 truck involvementrates are the same. Similarly, the highest probability of 0.824 isindicated for interstates, implying the least change in involvement rates.In the case of accident involvement rates of other vehicles, interstateshave experienced a decrease, the STAA primary routes and non-STAA routes aslight increase. The involvement rates of other vehicles for non-STAAprimary routes show the least change, which is reflected by a probabilityvalue of 0.843.
o Involvement in Fatal Accidents: In order to determine whetherthere had been any significant change in accident severity, theinvolvement of tractor trailers and all other vehicles in fatal accidentswere analyzed. The fatal involvement ratio is defined as the percentage offatal involvements in all injury and fatal involvements.
Tables 47, 48, and 49 in the Appendix show the fatal involvementratios for the selected routes. The fatal involvement ratio is consideredto be a measure of the involvement in severe crashes. The analysis wascarried out by comparing the pre- and post-1982 ratios for tractortrailers and other vehicles. The results of ANOVA on these ratios are
23
633
634
presented in Table 50 in the Appendix, with the corresponding probabilityvalues in Table 51. The mean involvement ratios are given in Table 52.
These results indicate that the interstate routes have experienced theleast change in fatality involvement ratios, which is also a decrease fortractor trailers and a slight increase for other vehicles. On both STAAand non-STAA primary routes, there has been a significant drop in fatalinvolvement ratios for other vehicles which is indicated by the lowprobability values supporting the null hypothesis. However, on these sameroutes, tractor trailers have experienced an increase in fatal involvementratios with the highest such rates occurring on non-STAA routes.
Comparison of Tractor Trailer and Other Vehicle Involvement Rates forInjury and Fatal Accidents
Trends in the involvement rates (number of involvements per 100million VMT) for the two categories of vehicles considered were examined.Since these rates are based on the annual VMT, which is a measure ofexposure, a comparison of rates between the vehicle categories will yieldan indication of the relative accident risk.
The selected routes for each category of highway type represent thebulk of the highway miles bearing large-truck traffic. Therefore, by thiscomparison, an effort is made to identify any significant differencesbetween tractor trailers and other vehicles particular to a highwayenvironment with a relatively high presence of truck traffic.
The involvement rates for tractor trailers on interstates wererelatively unchanged from 1981 through 1983, with an increase in 1984(Appendix, Table 53). Rates for tractor trailers on all highway categoriesindicate a decrease in 1985. The involvement rates for tractor trailers onprimary routes indicate a decreasing trend from 1980 through 1982, which isa low year for each of the highway systems analyzed (Appendix, Table 53).The involvement rates for other vehicles also indicate a similar decreasefrom 1980 through 1982 and an increase from 1983 through 1985 (Appendix,Table 53). In light of this, it is difficult to attribute the increase intractor trailer involvement rates since 1982 to STAA per see
The relative accident involvement of tractor trailers in comparison toother vehicles was estimated by the ratio of tractor trailer involvementrates to other vehicle involvement rates. Considering the change in relative involvement between pre- and post-1982 periods, an increase acrossall categories of highways was observed (Appendix, Table 54). STAA primaryroutes have experienced the lowest increase (4.38 percent); non-STAAprimary routes have experienced the highest (11.43 percent); and Interstate routes have experienced an increase of 10.24 percent (Appendix, Table54).
24
From these results, it seems that the relative accident involvementrisk for tractor trailers has increased the least on STAA-primary routesand the most on non-STAA primary routes.
SUMMARY OF FINDINGS
The major findings from this portion of the study aresummarized below.
Factors Associated with Large-Truck Accidents
Since 1983, annual VMT for large trucks in Virginia has beenincreasing at a rate higher than that for all other vehicles. Fatalcrashes for all large trucks increased from 3.81 to 5.88 per 100 millionVMT and for tractor trailers from 2.81 to 5.36 per 100 million VHT between1982 and 1984, whereas that for other vehicles remains practically constantbelow 0.30 per 100 million VMT.
Although the frequency of crashes of vehicles other than large trucksis not significantly different on any day of the week, the frequency oflarge-truck crashes is affected by the lower truck VMT on weekends.Countermeasures that are designed to reduce large-truck crashes primarilydue to driver-related causes (e.g., police enforcement to reduce speeding)will therefore be more effective when implemented during the week than onweekends.
No significant difference was observed in the monthly percentagedistribution of large-truck crashes. Large-truck crashes tend to involvemore than a single vehicle, and when a large truck is involved in atwo-vehicle crash, there is a 94 percent chance that the second vehicle isnot a large truck.
Based on the VMT of each type of vehicle, large truck/other vehiclecrashes are overrepresented when compared with the expected frequency fortwo-vehicle crashes. Large-truck/other vehicle fatal crashes are alsooverrepresented by as much as 85 percent when compared with the expectedfrequency for two-vehicle fatal crashes.
Driver-related factors seem to be the primary associated factors fortruck crashes: they are associated with an average of about 90 percent ofall fatal crashes involving large trucks. Driver error is associated with
25
635
636
over 50 percent of fatal accidents involving large trucks; whereas, speeding is associated with 21 percent, and alcohol with 15 percent. Also,crashes involving large trucks, particularly fatal crashes for which drivererror is listed as a factor, occur predominantly on stretches of highwayswith vertical or horizontal curves and/or grades. This strongly suggeststhat drivers are more likely to make maneuvering errors on a curvy sectionthan on a straight level section of the road.
The risk of either injury or property damage in any large-truck/othervehicle accident is approximately the same for all types of trucks on anysingle type of highway facility.
The risk' of a fatality in any large-truck/other vehicle accident ishighest for such accidents involving a tractor trailer. This risk ishighest when the type of facility on which the accident occurs is a two-wayundivided highway, and the risk is reduced by 50 percent on divided highways with partial or no control of access. It is further reduced to 25percent of the maximum (that on undivided facilities) if the facility isdivided with full control of access.
In single-vehicle large-truck accidents, tractor trailers have thehighest proportion of fatal accidents, on all types of highway facilities.The highest percentage of single-vehicle fatal accidents involving tractortrailers take place on two-way divided facilities with partial or nocontrol of access.
Most truck/other vehicle accidents are same-direction sideswipecollisions except when a straight truck is involved: whereas, mostlarge-truck/large-truck accidents and straight truck/other vehicleaccidents are rear-end collisions.
Most single-vehicle large-truck accidents take place on roadwaysections with curves and/or grades, with the worst such record for twintrailers. However, the proportion of fatal accidents is highest fortractor trailers.
Twin trailers have the highest percentage of accidents with othervehicles on roadway sections with curves and/or grades, followed bytractor trailers and straight trucks. However, the proportion of fatalaccidents is again highest for tractor trailers.
Pre- and Post-1982 Changes
Although tractor trailer travel has increased significantly since theenactment of STAA, as reflected by annual VMT, the total truck VMT has alsocontinued to increase, contrary to projections made during hearings in
26
63'7
Congress before the enactment. This however may be due to the significantgrowth in the nation's economy and/or deregulation of the truckingindustry.
From 1980 through 1985, tractor trailer accident rates on all interstate and primary routes increased by about 1 percent in comparison to a0.03 percent increase for other vehicles. Although there is no clearevidence of any impact on accident rates by the passage of STAA, the ratesof fatal accidents involving tractor trailers increased immediately afterthe enactment of STAA.
The injury/fatal-accident mean involvement rates for tractor-trailersand other vehicles prior to and after 1982 indicate that:
o Tractor trailer involvement in accidents has increased across alltypes of highways since 1982, with the highest increase on non-STAA primaryroutes. The next highest increase was on STAA primary routes and thesmallest increase was on interstate routes.
o For all vehicles other than tractor trailers, the mean involvement rate has decreased on the interstates and increased on the STAAprimary routes and on non-STAA primary routes.
o On the interstate routes, tractor trailers have experienced higheraccident involvements than all other vehicles since 1982. On all primaryroutes, on the other hand, all other vehicles exhibit higher involvementrates than tractor trailers.
The mean fatal accident ratios for tractor trailers and other vehiclesprior to and after 1982 indicate:
o A decrease in the proportion of fatal accidents since 1982 forvehicles other than tractor trailers on all primary routes.
o An increase in the proportion of fatal accidents for tractortrailers on STAA and non-STAA primary routes with the non-STAA primaryroutes showing the largest increase.
Between the pre- and post-1982 periods, the relative accident involvement of tractor trailers (when compared with all other vehicles) has increased across all highway categories. The highest such increase has takenplace on non-STAA primary routes (11.43 percent) followed by interstateroutes (10.24 percent) and STAA primary routes (4.38 percent). Thesetrends in relative involvement indicate significant increases on interstateand undesignated primary routes.
27
638
CONCLUSIONS
1. The identification of highway alignment as a predominant factorinfluencing the occurrence of crashes resulting from driver error suggeststhe need for a study that will identify those geometric characteristicsthat contribute to these crashes. The results of such a study could beused to develop engineering countermeasures that will be effective inreducing this type of crash.
2. The increase in tractor trailer involvement in accidents may bedue to a multitude of factors including deregulation of the truckingindustry and the passage of the STAA. However, the role of STAA inincreased tractor trailer involvement rates is likely to be secondary toother factors such as the type of highway environment and its conducivenessto accommodating large trucks.
3. Although non-STAA routes experienced the highest increase inaccident rates after the passage of the STAA, the fact that these routeswere not affected by this legislation indicates this increase may be dueto reasons other than the STAA.
4. The significant increases in tractor trailer accident involvementrates and relative involvement on non-STAA priludl'y routes may be theresult of an incompatibility between the geometric characteristics of thesehighways and tractor trailer dynamic characteristics coupled with thegeneral trend of increasing truck travel across all types of highways.
5. Safety on Virginia highways may be significantly improved iflarge- truck traffic is separated from all other truck traffic. This mayhowever create other traffic problems if implemented on existingfacilities. A detailed study should be carried out to determine thefeasibility of implementing such a plan.
YORK IN PROGRESS
Having gained a thorough understanding of the nature of the problemof truck accident occurrence through the analysis of accident data asreported in this interim report, work is now proceeding with the finalphase of this project. During this phase, relationships between thetraffic and geometric characteristics of the roadways and large-truckaccidents will be established. This requires the collection of data ontraffic and geometric variables at large-truck accident sites. In order tosimplify and expedite the collection of geometric measures such as gradesand radius of curvature, a new technique using an electronic ball bankindicator was developed. In addition to the geometric data, speed samplesof large trucks and other vehicles have been obtained at these sites. On
28
639
the primary routes with ADT fewer than 10,000, data have been collected ata total of 20 sites. On the interstate routes and primaries with high ADT,data have been collected at 40 sites.
The analysis of all the data collected is now in progress. Modelswill be developed relating accident occurrence with traffic and geometriccharacteristics. It is envisaged that these models and the backgroundinformation gathered thus far, will enable the formulation of recommendations for the control and reduction of large-truck accidents inVirginia.
29

~ 640
REFERENCES
1. Shinar, D. "Truck Drivers: Licensing and Monitoring. An Analysiswith Recommendations. Appendix Volume D-1: An Analysis of the Causes ofLarge Truck Accidents, and Volume D-2: An Evaluation of Heavy VehicleDriver Visual Requirements," Final Report, Highway Safety Research Center,Chapell Hill, North Carolina, December 1979.
2. Washington State Utilities and Transportation Commission. "Summary andAnalysis: Heavy Truck-Hazardous Material Accidents," Olympia, Washington,1980.
3. Vallete, G.R., McGee, H.Y., Sanders, J.H., and Enger, D.J. "The Effectsof Truck Size and Veight on Accident Experience and Traffic Operations,Volume III: Accident Experience of Large Trucks", FHYA /RD-80/l37 FHYA,Washington D.C., July 1981.
4. Scott, R.E., and O'Day, J., "Statistical Analysis of Truck AccidentInvolvements," DOT-HS-800-627 NHTSA, Washington D.C., December 1971.
5. Wyckoff, D.O., Truck Drivers in America, Lexington Books, Lexington,Massachusetts, 1979.
6. Partyka, S.C., "Heavy Truck Report to Congress Working Group Papers,Number 1 through 8" National Center for Statistics and Analysis, NHTSA,Washington, D.C., June 1979.
7. Waller J.A., "Medical Impairments to Driving," Thomas, Springfield,Illinois, 1973.
8. American Automobile Association, Foundation for Traffic Safety, "AReport on the Determination and Evaluation of the Role of Fatigue in HeavyTruck Accidents," Falls Church, VA, 1985.
9. Smist, T.E. and Ranney, T.A., "Heavy Truck Accident Causation," CalspanField Services, Inc., August 1981.
10. Baker S.P., "Alcohol in Fatal Tractor Trailer Crashes," Proceedings,19th Conference of the American Association of Automotive Medicine, 1975.
11. Simpson, H.M., Warren, R.A., and Page-Valin, L., "Medical Conditionsand Risk of Collision; A Feasibility Study," Traffic Injury ResearchFoundation of Canada, Ottawa, Canada, June 1977.
12. Terhune, K.Y. and Fell, J.C., The Role of Alcohol, Marijuana, and OtherDrugs in the Accidents of Injured Drivers," NHTSA, October 1981.
31
6 ' C)~±~
13. National Transportation Safety Board (NTSB). "Safety EffectivenessEvaluation of Detection and Control of Unsafe Interstate CommercialDrivers," TJashington, D.C., February 1980.
14. Galligan, J., "The Hunt for Better MPG," Commercial Car Journal,Volume 138, Number 9, September 1981.
15. Western Highway Institute. "Motor Vehicle Size and Yeight Standards,Yestern Objectives," A Study for the TRED Foundation, San Bruno,California, July 1980.
16. Campbell, K.L., and Carsten, 0., "Fleet Accident Evaluation of FMVSS121," Highway Safety Research Institute, Ann Arbor, Michigan, March 1981.
17. Winfrey, R. et al., "Economics of the Maximum Limits of Motor VehicleDimensions and Yeights, Volumes 1 and 2," FHYA, TJashington, D.C.,September 1968.
18. Eicher, J.P.; Robertson, H.D.; and Toth, G.R., "Large Truck AccidentCausation," NHTSA Technical Report, NHTSA, July 1982.
19. Minahan, D.J. and O'Day, J., "Car-Truck Fatal Accidents in Michiganand Texas," Highway Safety ResearL..~ Institute, Ann Arbor, Michigan, October1977.
20. Radlinski, R.W., "NHTSA Air Brake Research Program, 1979-1981," NHTSA,Washington, D.C., March 1982.
21. Bureau of Motor Carrier Safety. "1976 - 1978 Analysis of Motor CarrierAccidents Involving Vehicle Defects or Mechanical Failure," FHYA,Washington, D.C., November 1979.
22. Ervin, R.D., "Unintended Responses of Heavy Trucks to Braking orSteering Inputs," The HSRI Research Review, VoIIO, No.5, March - April1980.
23. Weir D.H.; Ringland, R.F.; Heffley, R.K.; and Ashkenas, I.L., "AnExperimental and Analytical Investigation of the Effect of Truck-InducedAerodynamic Disturbances on Passenger Car Control and Performance,Executive Summary Report and Technical Report," FHVA, TJashington, D.C.,October 1971.
24. Mackie, R.R.; O'Hanlon, J.F.; and McCauley, M., "A Study of Heat,Noise, and Vibration in Relation to Driver Performance and PhysiologicalStatus," NHTSA, Y'ashington, D.C., December 1974.
32
25. Green, P.; Kubacki, M.; Olson, P.L.; and Sivak, M., "Accidents andthe Nighttime Conspicuity of Trucks," Highway Safety Research Institute,Ann Arbor, Michigan, January 1980 .
26. Lum H.S., "Evaluation of Techniques for Yarning of Slow-MovingVehicles Ahead: Executive Summary," FHYA, Yashington, D.C., July 1979.
27. Joshua S.C., and Garber, N.J., "Large Truck Accident Involvement inVirginia," Unpublished Report, Virginia Transportation Research Council,Charlottesville, Virginia, May 1988.
28. Cirillo J.A. et al., "Interstate System Accident Research Study - 1,"FHYA, Yashington, D.C., October 1970.
29. Zador, Paul L., Stein, Howard, Hall, Jerome, and Yright, Paul."Relationship Between Vertical and Horizontal Roadway Alignments and theIncidence of Fatal Rollover Crashes in New Mexico and Georgia", Yashington,D.C., Insurance Institute for Highway Safety, 1985.
30. Gordon D.A., "Highway Sight Distance Requirements: Truck Applications,"Final Report, Office of Research, FHYA, Yashington, D.C., February 1979.
31. VanZweden, J. and Bryden, J.E., "In-Service Performance of ~ighway
Barriers," New York State Department of Transportation, Research Report 51,July 1979.
32. Post, E.R.; Hirsch, T.J.; and Nixon, J.F., "Truck Tests on TexasConcrete Median Barrier," Highway Research Record *460, 1973.
33. Texas Transportation Institute (TTl). "Test and Evaluation of HighPerformance Median Barriers," College Station, Texas, February 1982.
34. Soloman, D., "Accidents on Main Rural Highways Related to Speed,Driver, and Vehicle," Bureau of Public Roads, Department of Commerce,Yashington, D.C., July 1964.
35. Zaremba, L.A. and Ginsburg, M.J., "The 55 MPH Limits and Front-to-RearCollisions Involving Autos and Large Trucks," Accident Analysis andPrevention, Volume 9, 1977.
36. Radwan, A.E.S. and Sinha, K.C., "Effect of the National Speed Limiton the Severity of Heavy Truck Accidents," Traffic Ouarterly,Vol.32, No.2,April 1978.
37. Jovanis, P.P., and Chang, H.L., "Modeling the Relationship of Accidentsto Miles Traveled," Transportation Research Record 1068 TRB, Yashington,D.C., 1986.
33
64:1

- 644

Appendix
35

'v 646
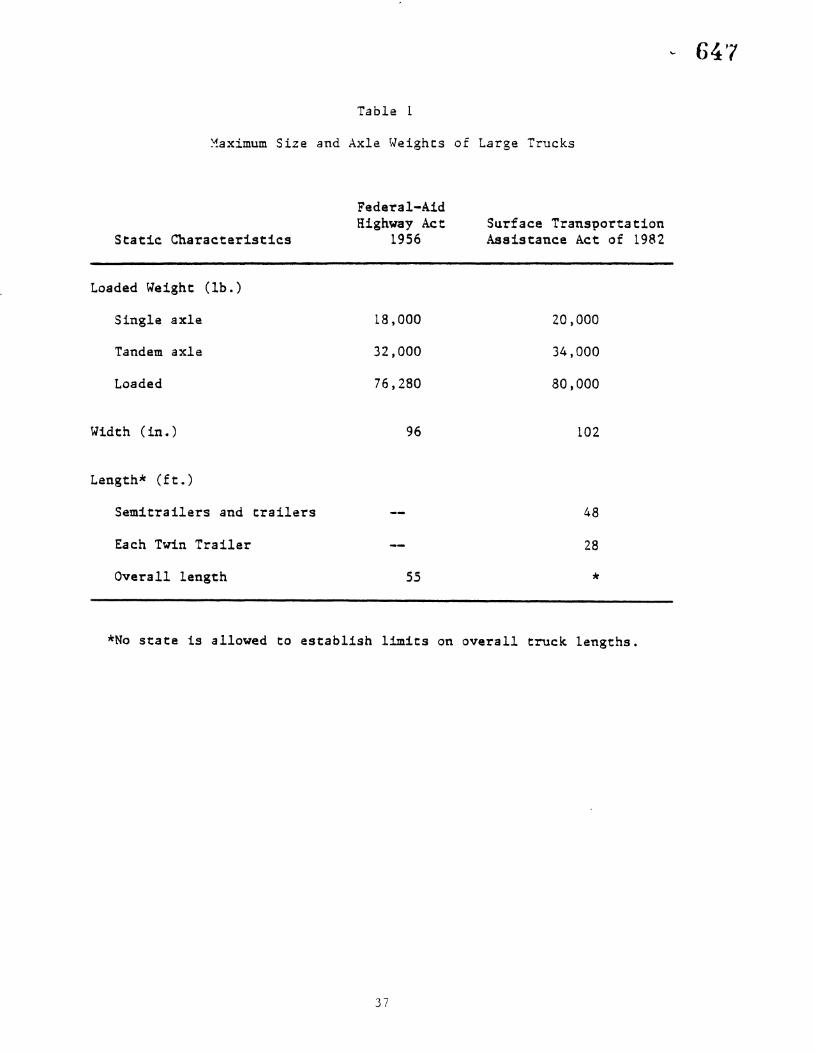
Table 1
~aximum Size and Axle Weights of Large Trucks
Fede-ral-A1dHighway Act Surface Transpor~ation
Static Characteristics 1956 Assistance Act of 1982
Loaded Weight (lb.)
Single axle 18,000 20,000
Tandem axle 32,000 34,000
Loaded 76,280 80,000
Width (in.) 96 102
Length* (ft.)
Semitrailers and trailers 48
Each Twin Trailer 28
Overall leng'th 55 *
*No state is allowed to establish limits on overall truck lengths.
37
64'7
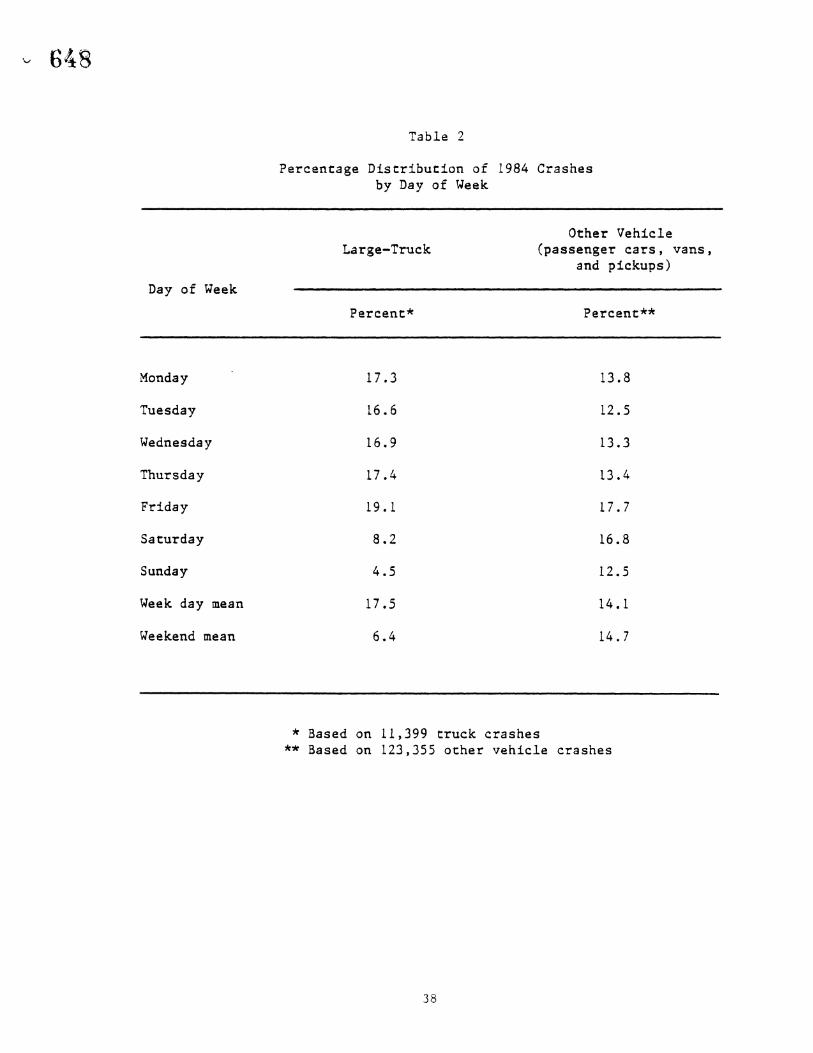
6~8
Table 2
Percentage Distribution of 1984 Crashesby Day of Week
Day of Week
Large-Truck
Percent*
Other Vehicle(passenge~ cars, vans,
and pickups)
Percent**
Monday 17.3 13.8
Tuesday 16.6 12.5
Wednesday 16.9 13.3
Thursday 17.4 13.4
Friday 19.1 17.7
Saturday 8.2 16.8
Sunday 4.5 12.5
Week day mean 17.5 14.1
Weekend mean 6.4 14.7
* Based on 11,399 truck crashes** Based on 123,355 other vehicle crashes
38
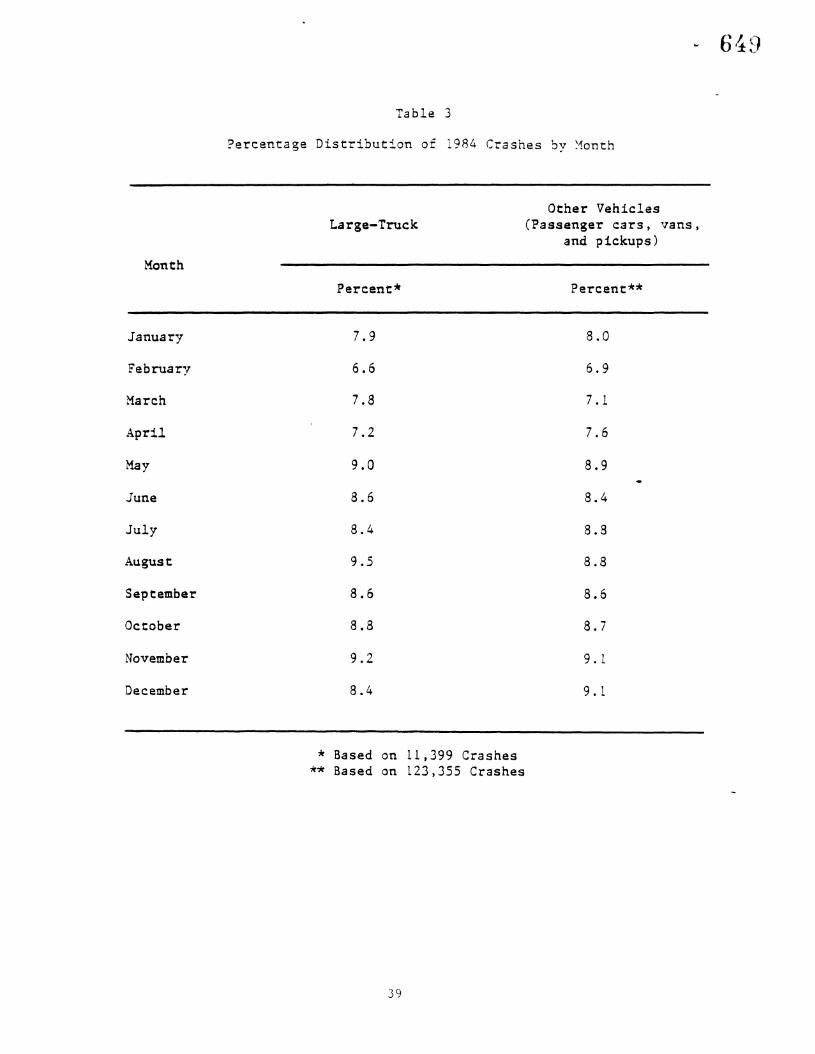
Table 3
Percentage Distribution of 1984 Crashes hy ~onth
Other VehiclesLarge-Truck (Passenger cars, vans,
and pickups)
Month
Percent" Percent**
January 7.9 8.0
February 6.6 6.9
March 7.8 7.1
April 7.2 7.6
May 9.0 8.9
June 8.6 8.4
July 8.4 8.8
August 9.5 8.8
September 8.6 8.6
October 8.8 8.7
November 9.2 9 .1
December 8.4 9. 1
* Based on 11,399 Crashes** Based on 123,355 Crashes
39
6 ' f)'f \~
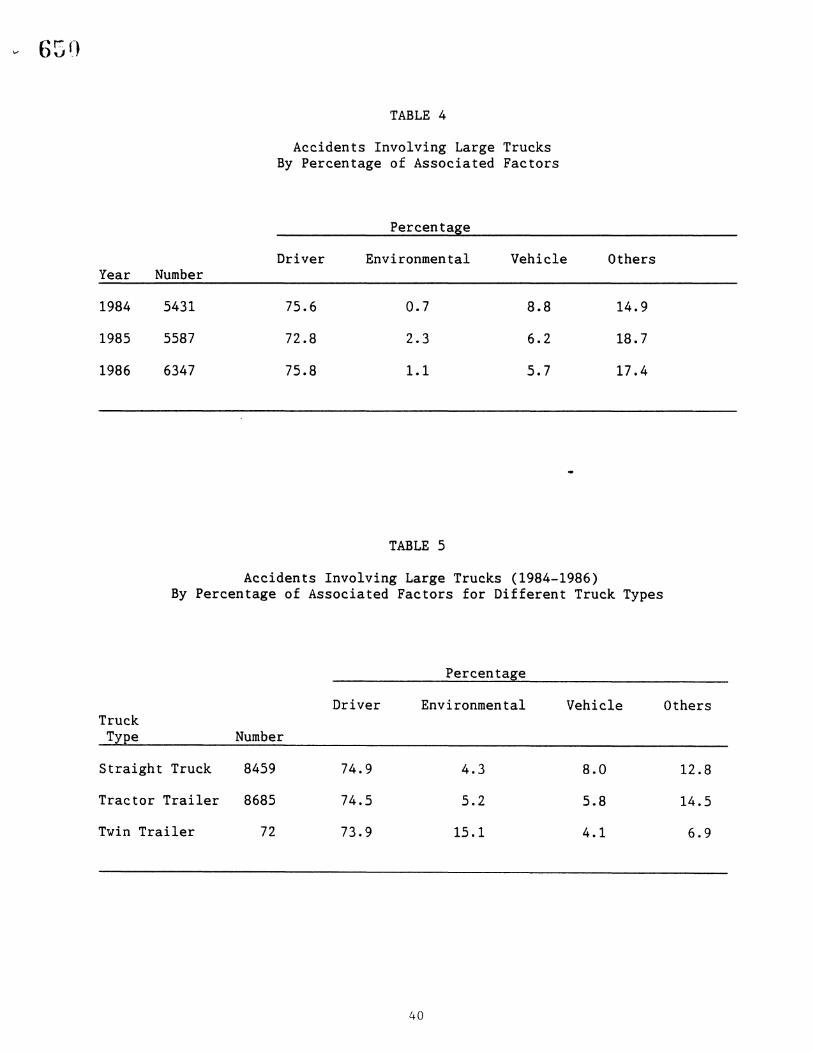
TABLE 4
Accidents Involving Large TrucksBy Percentage of Associated Factors
Percentage
Driver Environmental Vehicle OthersYear Number
1984 5431 75.6 0.7 8.8 14.9
1985 5587 72.8 2.3 6.2 18.7
1986 6347 75.8 1.1 5.7 17.4
TABLE 5
Accidents Involving Large Trucks (1984-1986)By Percentage of Associated Factors for Different Truck Types
Percentage
Driver Environmental Vehicle OthersTruck
Type Number
Straight Truck 8459 74.9 4.3 8.0 12.8
Tractor Trailer 8685 74.5 5.2 5.8 14.5
Twin Trailer 72 73.9 15.1 4.1 6.9
40
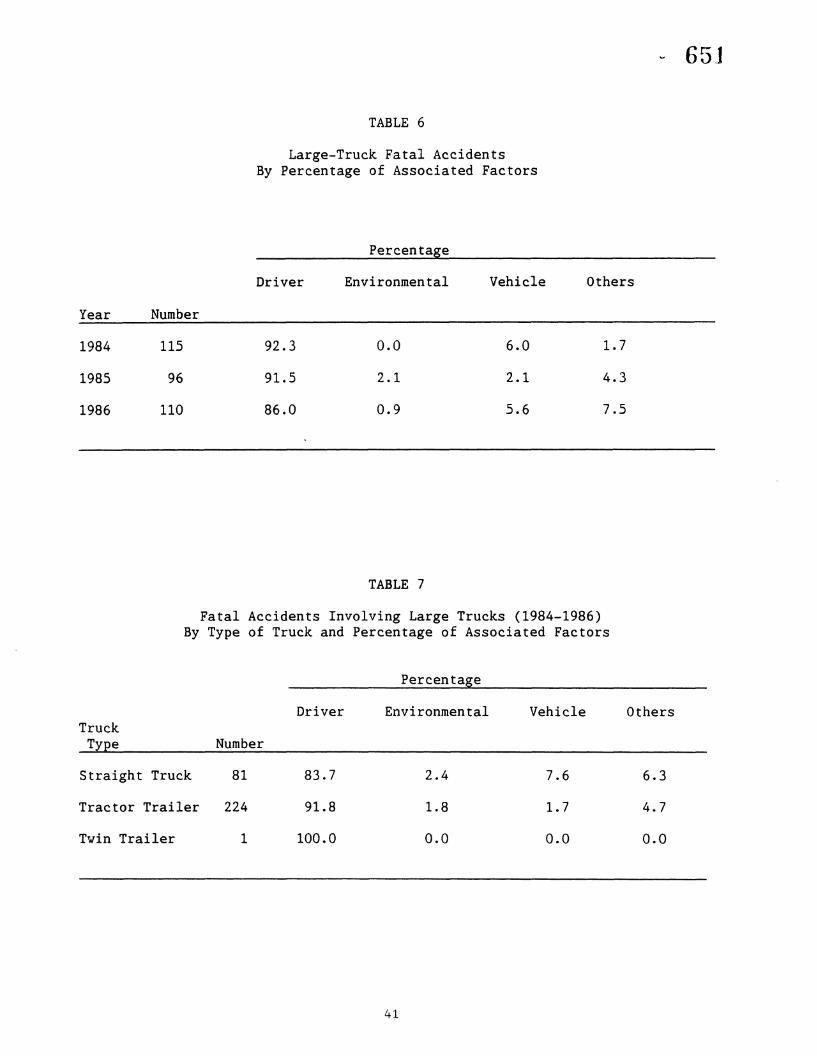
TABLE 6
Large-Truck Fatal AccidentsBy Percentage of Associated Factors
Percentage
Driver Environmental Vehicle Others
Year Number
1984 115 92.3 0.0 6.0 1.7
1985 96 91.5 2.1 2.1 4.3
1986 110 86.0 0.9 5.6 7.5
TABLE 7
Fatal Accidents Involving Large Trucks (1984-1986)By Type of Truck and Percentage of Associated Factors
Percentage
65.1
DriverTruck
Type Number
Straight Truck 81 83.7
Tractor Trailer 224 91.8
Twin Trailer 1 100.0
Environmental
2.4
1.8
0.0
41
Vehicle
7.6
1.7
0.0
Others
6.3
4.7
0.0
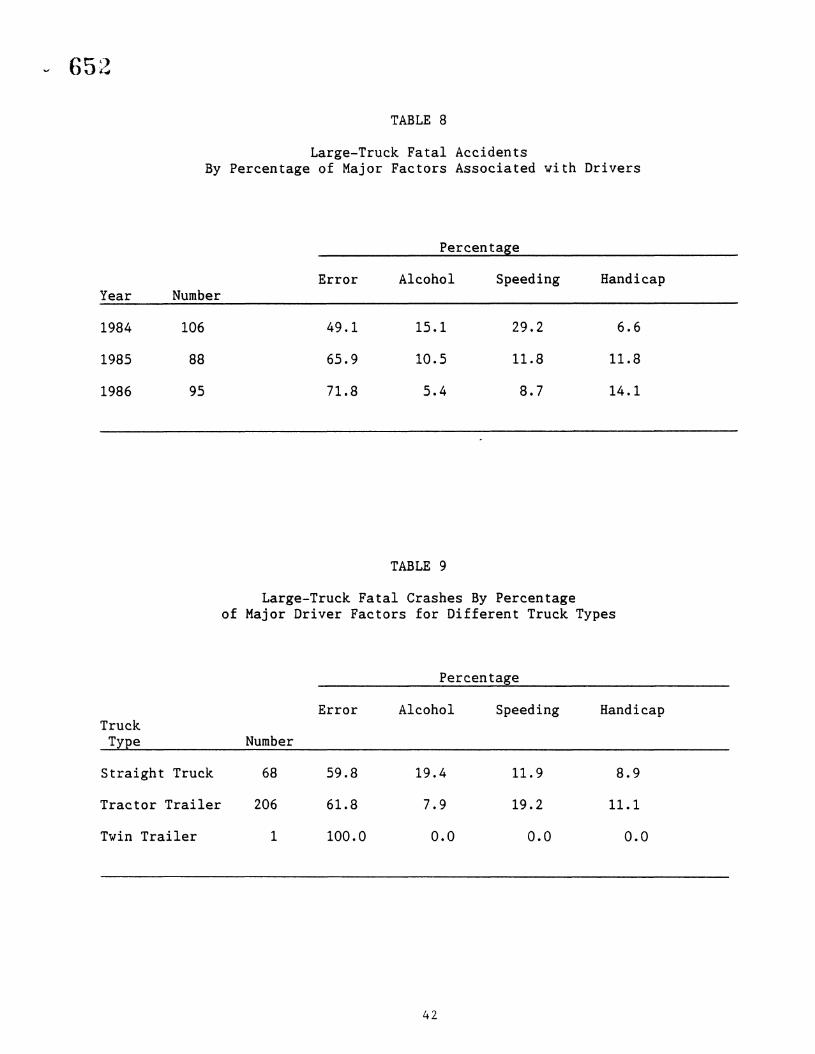
652
TABLE 8
Large-Truck Fatal AccidentsBy Percentage of Major Factors Associated with Drivers
Percentage
Error Alcohol Speeding HandicapYear Number
1984 106 49.1 15.1 29.2 6.6
1985 88 65.9 10.5 11.8 11.8
1986 95 71.8 5.4 8.7 14.1
TABLE 9
Large-Truck Fatal Crashes By Percentageof Major Driver Factors for Different Truck Types
Percentage
Error Alcohol Speeding HandicapTruck
Type Number
Straight Truck 68 59.8 19.4 11.9 8.9
Tractor Trailer 206 61.8 7.9 19.2 11.1
Twin Trailer 1 100.0 0.0 0.0 0.0
42
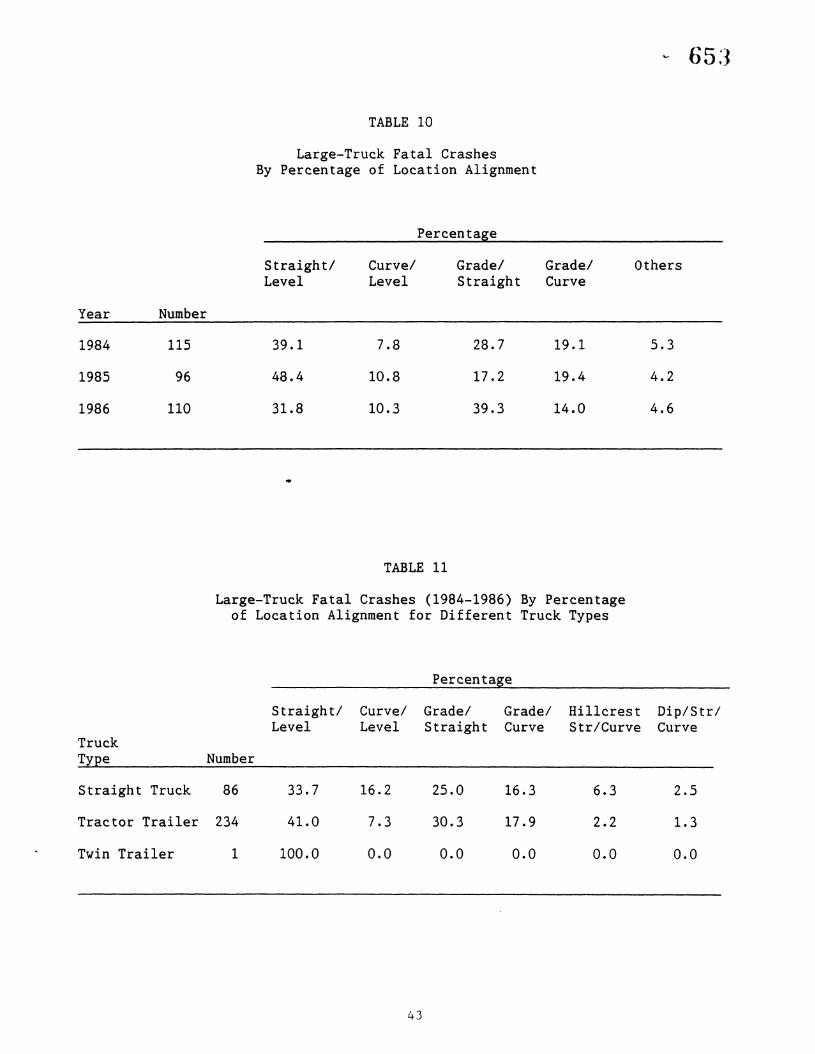
TABLE 10
Large-Truck Fatal CrashesBy Percentage of Location Alignment
Percentage
Straight/ Curve/ Grade/ Grade/ OthersLevel Level Straight Curve
Year Number
1984 115 39.1 7.8 28.7 19.1 5.3
1985 96 48.4 10.8 17.2 19.4 4.2
1986 110 31.8 10.3 39.3 14.0 4.6
TABLE 11
Large-Truck Fatal Crashes (1984-1986) By Percentageof Location Alignment for Different Truck Types
Percentage
Straight/ Curve/ Grade/ Grade/ Hillcrest Dip/Str/Level Level Straight Curve Str/Curve Curve
TruckType Number
Straight Truck 86 33.7 16.2 25.0 16.3 6.3 2.5
Tractor Trailer 234 41.0 7.3 30.3 17.9 2.2 1.3
Twin Trailer 1 100.0 0.0 0.0 0.0 0.0 0.0
43
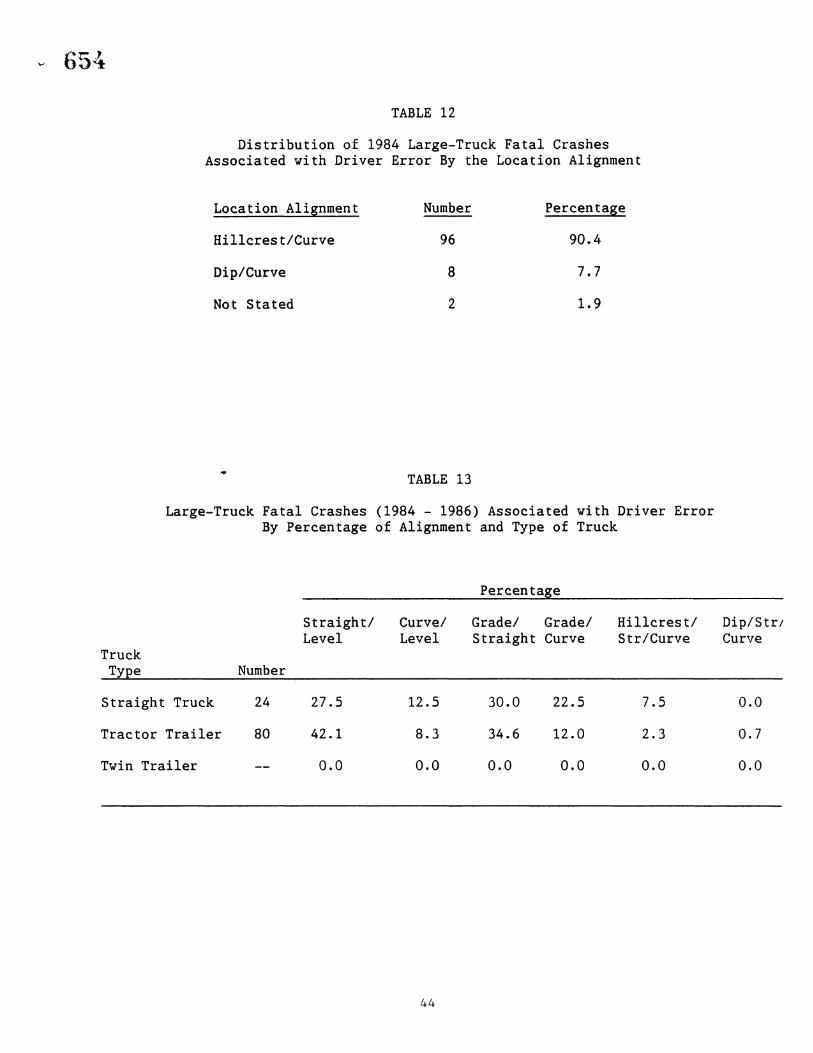
654
TABLE 12
Distribution of 1984 Large-Truck Fatal CrashesAssociated with Driver Error By the Location Alignment
Location Alignment
HillcrestlCurve
Dip/Curve
Not Stated
Number
96
8
2
TABLE 13
Percentage
90.4
7.7
1.9
Large-Truck Fatal Crashes (1984 - 1986) Associated with Driver ErrorBy Percentage of Alignment and Type of Truck
Percentage
Straight/ Curvel Gradel Gradel Hillcrest/ Dip/StrlLevel Level Straight Curve Str/Curve Curve
TruckType Number
Straight Truck 24 27.5 12.5 30.0 22.5 7.5 0.0
Tractor Trailer 80 42.1 8.3 34.6 12.0 2.3 0.7
Twin Trailer 0.0 0.0 0.0 0.0 0.0 0.0
44
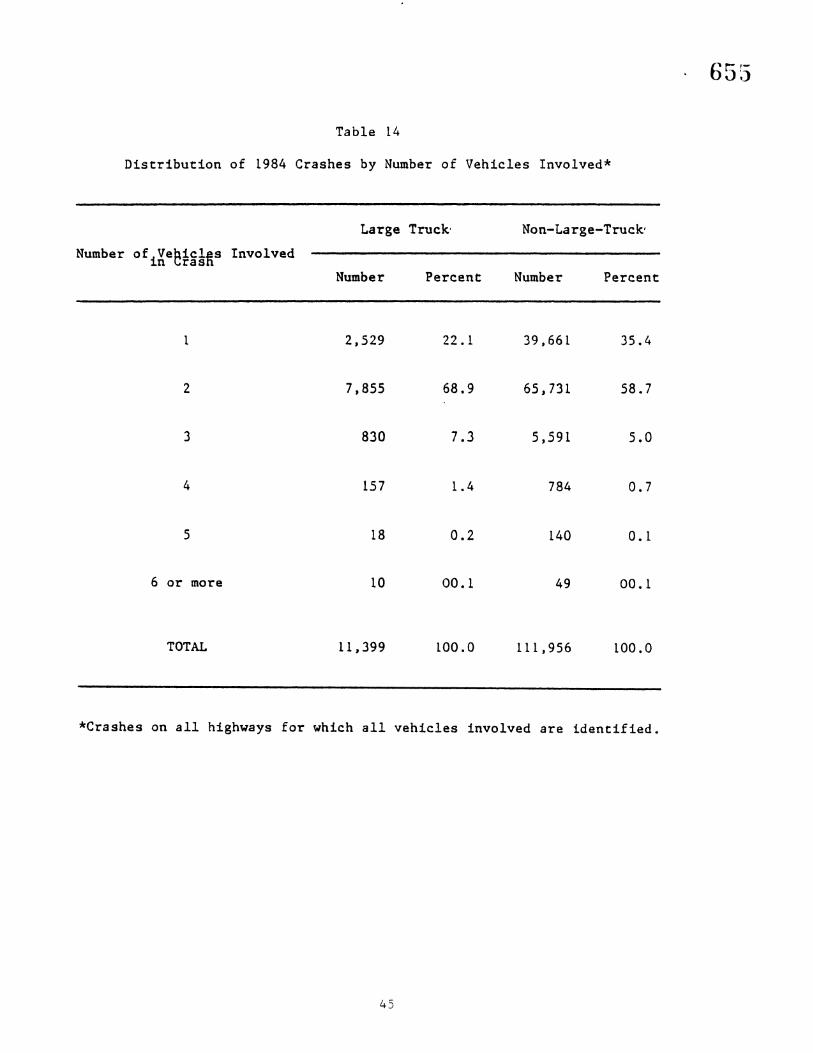
Table 14
Distribution of 1984 Crashes by Number of Vehicles Involved*
65~)
Large Truck, Non-Large-Truck'
Number ofiVehiclas Involvedn CrasnNumber Percent Number Percent
1 2,529 22.1 39,661 35.4
2 7,855 68.9 65,731 58.7
3 830 7.3 5,591 5.0
4 157 1.4 784 0.7
5 18 0.2 140 O. 1
6 or more 10 00.1 49 00.1
TOTAL 11,399 100.0 111,956 100.0
*Crashes on all highways for which all vehicles involved are identified.
45
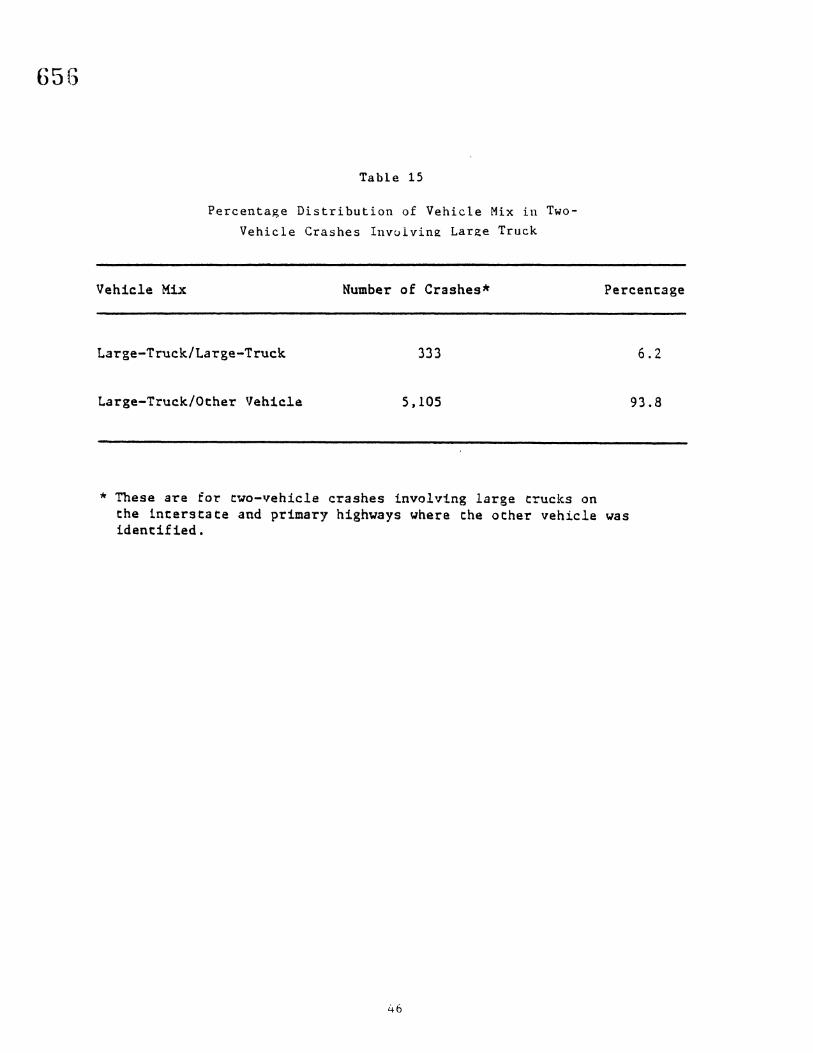
65G
Table 15
Percentage Distribution of Vehicle Mix in Two
Vehicle Crashes Invulvine Larae Truck
Vehicle Mix Number of Crashes* Percentage
Large-Truck/Large-Truck
Large-Truck/Other Vehicle
333
5,105
6.2
93.8
* These are for two-vehicle crashes involving large trucks onthe interstate and primary highways where the other vehicle wasidentified.
46
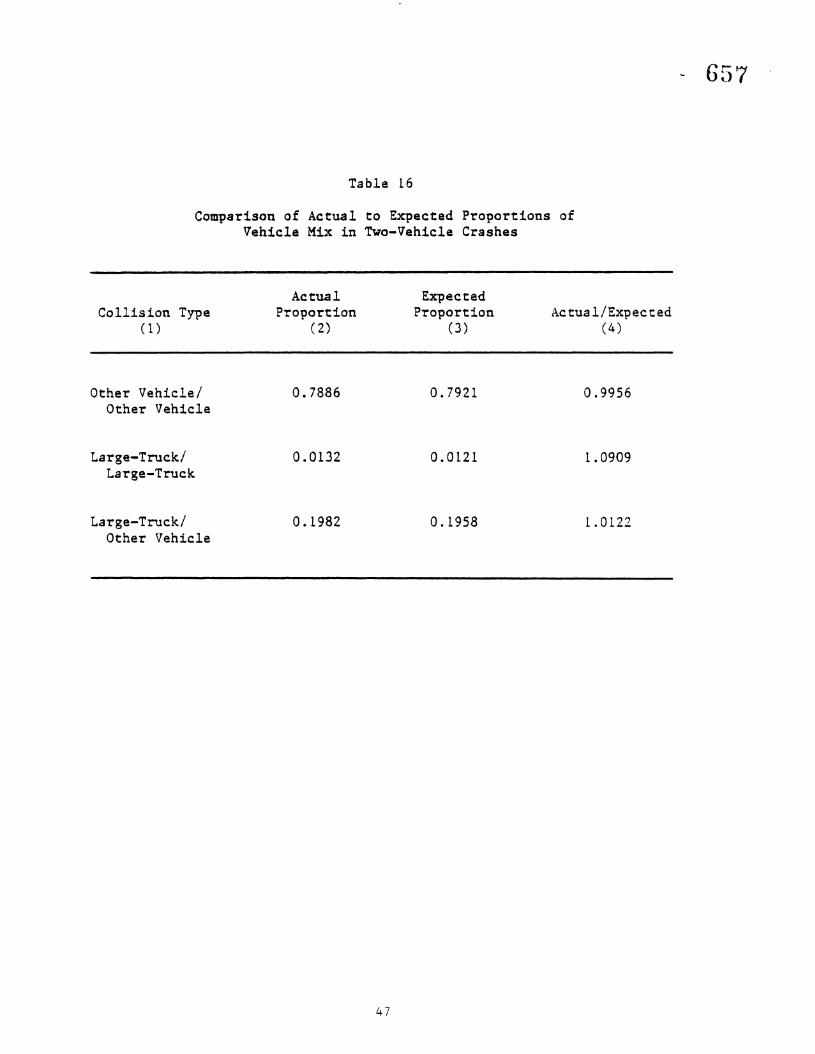
Table 16
Comparison of Actual to Expected Proportions ofVehicle Mix in Two-Vehicle Crashes
657
Collision Type(1)
ActualProportion
( 2)
ExpectedProportion
(3)Actual/Expected
(4)
Other Vehicle/ 0.7886 0.7921 0.9956Other Vehicle
Large-Truckl 0.0132 0.0121 1.0909Large-Truck
Large-Truckl O. 1982 O. 1958 1.0122Other Vehicle
47
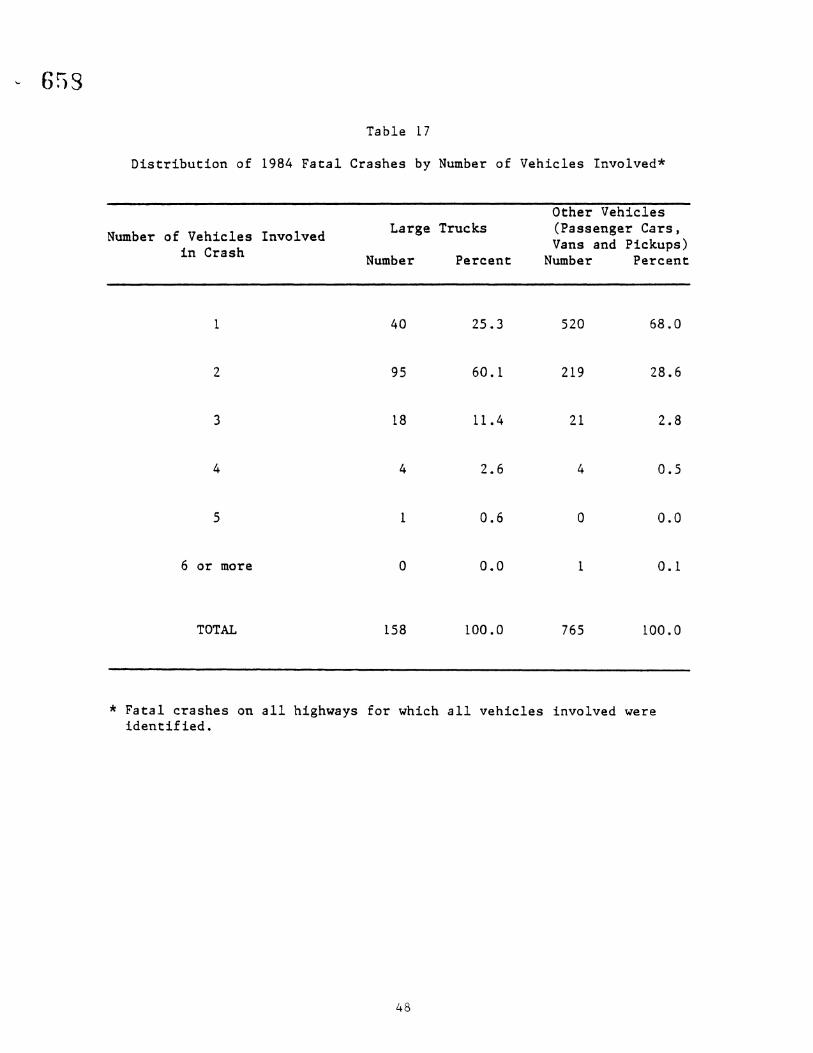
SSg
Table 17
Distribution of 1984 Fatal Crashes by Number of Vehicles Involved*
Large TrucksNumber of Vehicles Involvedin Crash Number Percent
Other Vehicles(Passenger Cars,Vans and Pickups)
Number Percent
1
2
3
4
5
6 or more
TOTAL
40
95
18
4
1
o
158
25.3
60.1
11.4
2.6
0.6
0.0
100.0
520
219
21
4
o
1
765
68.0
28.6
2.8
0.5
0.0
0.1
100.0
* Fatal crashes on all highways for which all vehicles involved wereidentified.
48
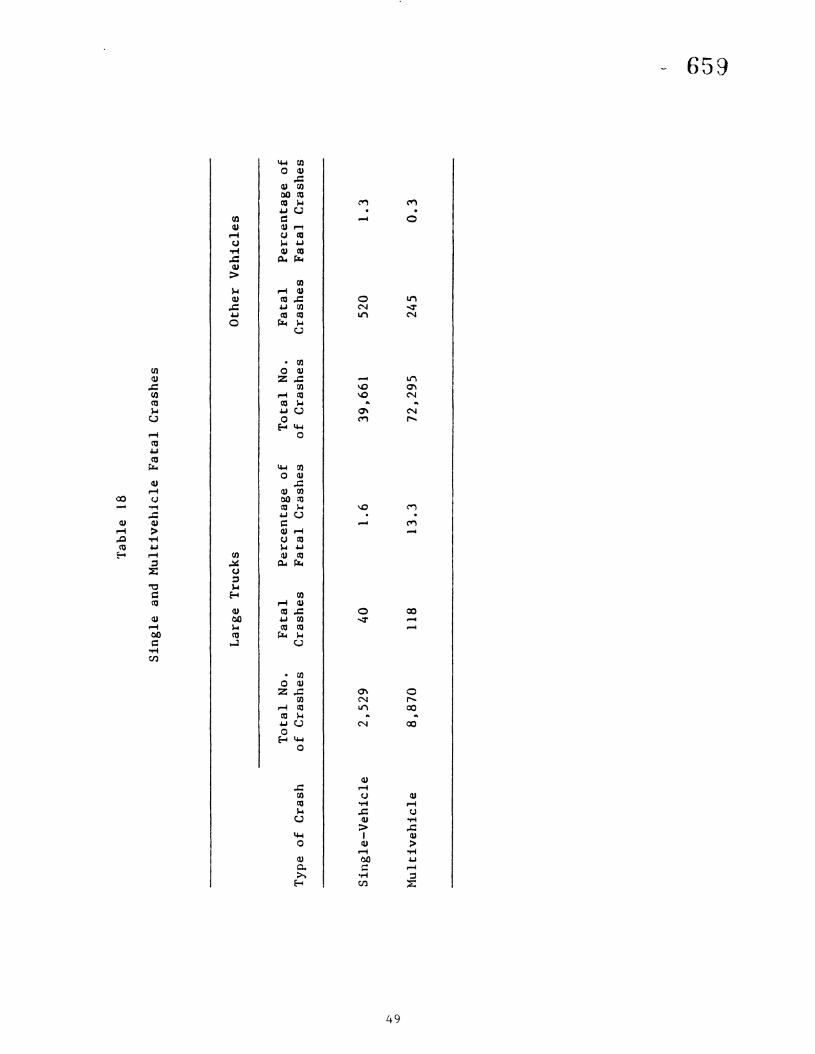
Tab
le18
Sin
gle
and
Mu
ltiv
eh
icle
Fata
lC
rash
es
Lar
ge
Tru
cks
Oth
erV
ehic
les
+'
--0
Ty
pe
of
Cra
sh
Sin
gle
-Veh
icle
Mu
ltiv
eh
icle
To
tal
No.
of
Cra
shes
2,5
29
8,8
70
Fata
lC
rash
es
40 11
8
Per
cen
tag
eo
fF
ata
lC
rash
es
1.6
13
.3
To
tal
No.
of
Cra
shes
39
,66
1
72
,29
5
Fata
lC
rash
es
520
245
Per
cen
tag
eo
fF
ata
lC
rash
es
1.3
0.3
en UI
(..Q
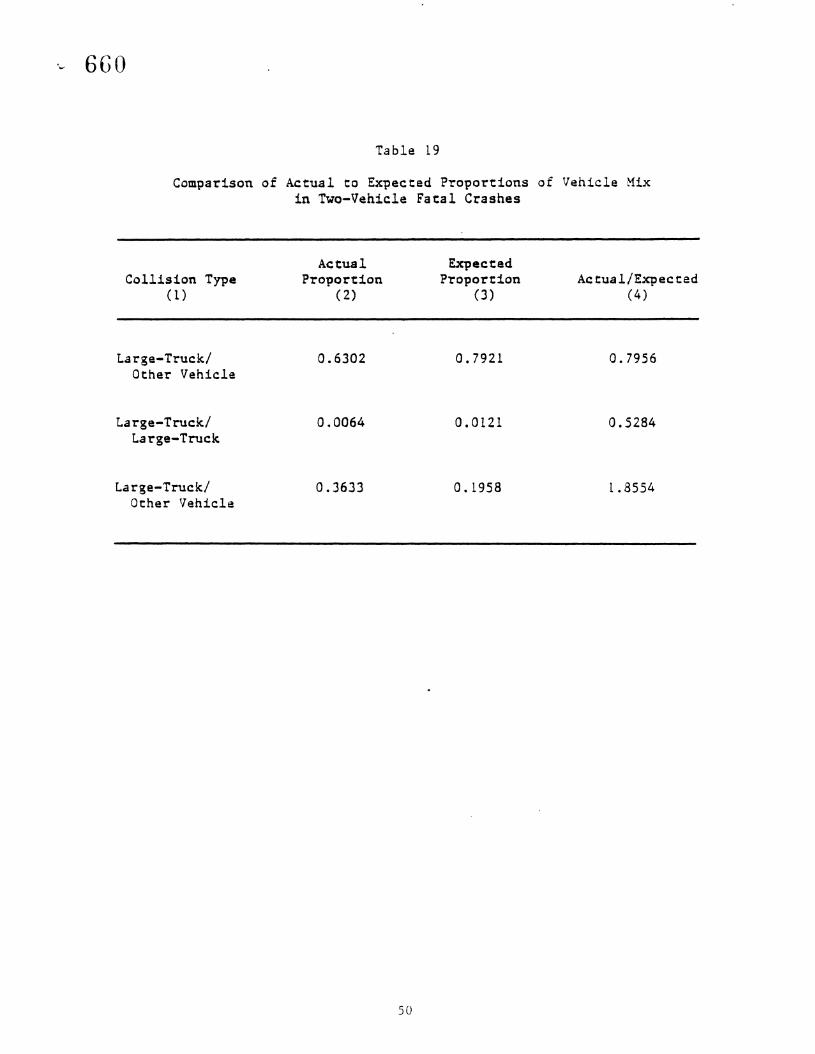
'- 6GO
Table 19
Comparison of Actual co Ex~ected P~opor~ions of Vehicle Mixin Two-Vehicle Fa~al Crashes
Collision Type(1)
ActualPropor't1on
( 2)
ExpectedP-roport1on
(3)Actual!Expected
(4)
Large-Truck! 0.6302 0.7921 0.7956Other Vehicle
Large-Truck! 0.0064 0.0121 0.5284Large-Truck
Large-Truck/ 0.3633 O. 1958 1.8554Other Vehicle
50
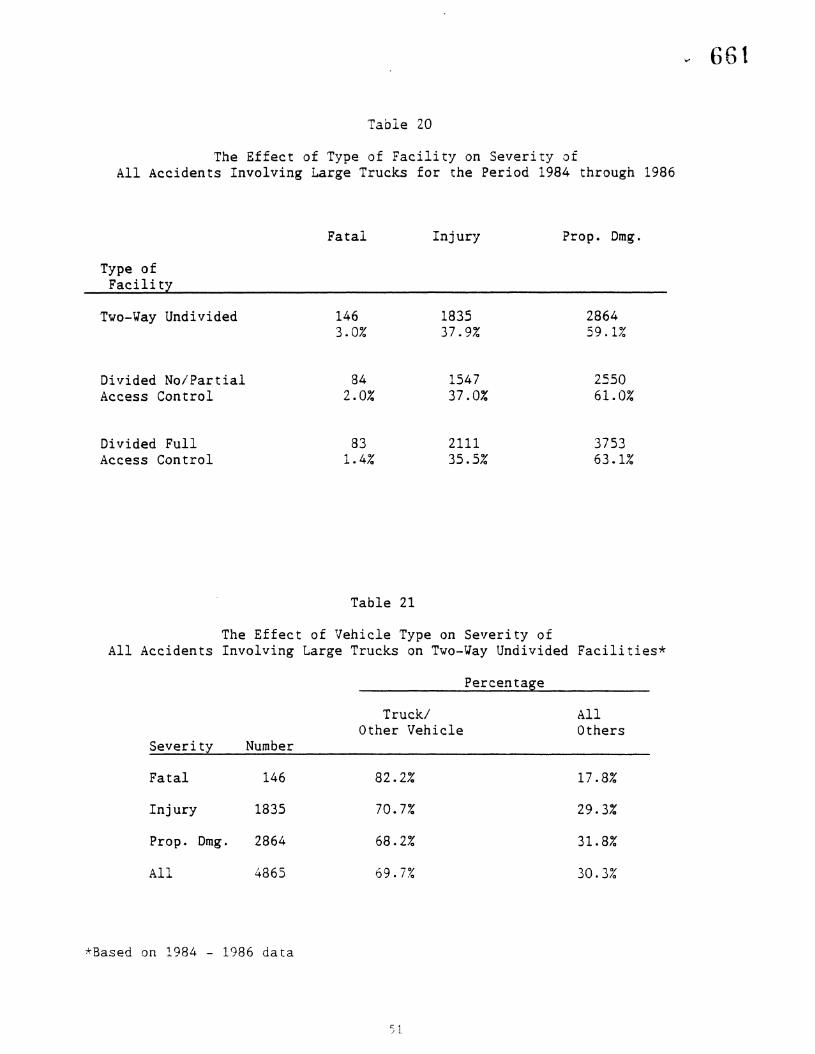
Table 20
The Effect of Type of Facility on Severity ofAll Accidents Involving Large Trucks for the Period 1984 through 1986
Fatal Injury Prop. Dmg.
Type ofFacility
Two-~ay Undivided 146 1835 28643.0% 37.9% 59.1%
Divided No/Partial 84 1547 2550Access Control 2.0% 37.0% 61.0%
Divided Full 83 2111 3753Access Control 1.4% 35.5% 63.1%
Table 21
The Effect of Vehicle Type on Severity ofAll Accidents Involving Large Trucks on Two-~ay Undivided Facilities*
Percentage
661
Truck/Other Vehicle
AllOthers
Severity Number
Fatal 146 82.2% 17.8%
Injury 1835 70.7% 29.3%
Prop. Dmg. 2864 68.2% 31.8%
All 4865 69.7% 30.3%
*Based on 1984 - 1986 data
5 1
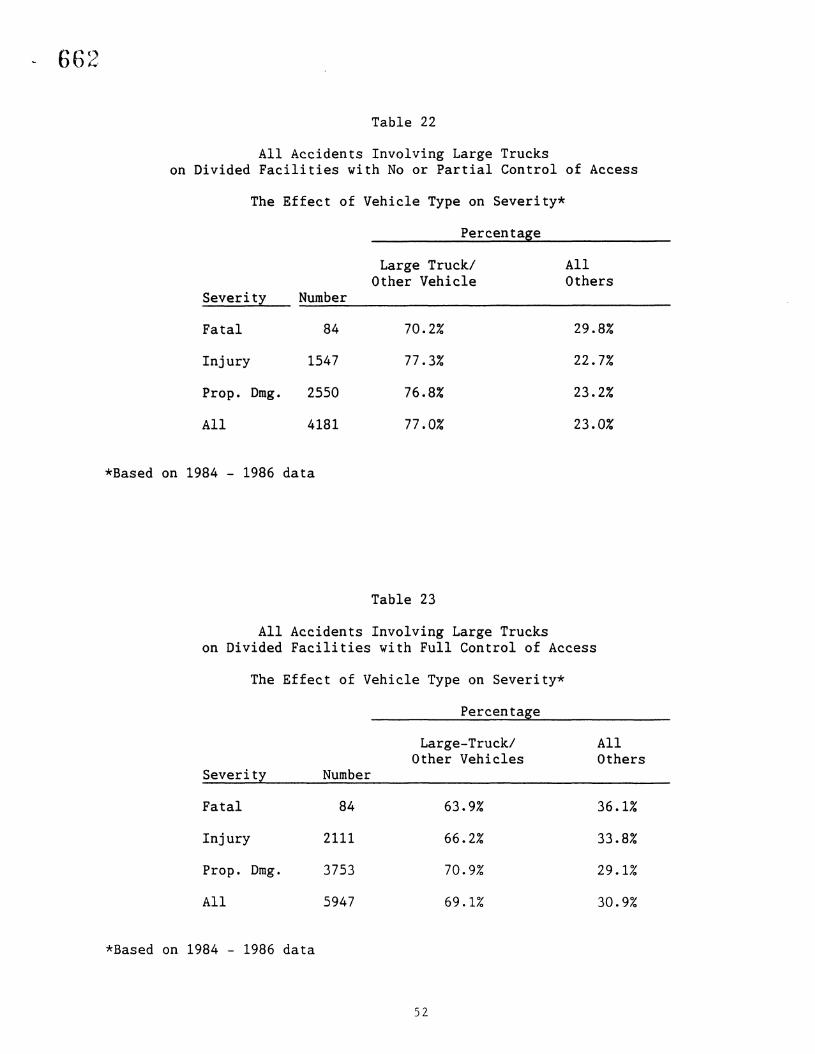
662
Table 22
All Accidents Involving Large Truckson Divided Facilities with No or Partial Control of Access
The Effect of Vehicle Type on Severity*
Percentage
Large Truck/Other Vehicle
AllOthers
Severity Number
Fatal 84 70.2% 29.8%
Injury 1547 77.3% 22.7%
Prop. Dmg. 2550 76.8% 23.2%
All 4181 77.0% 23.0%
*Based on 1984 - 1986 data
Table 23
All Accidents Involving Large Truckson Divided Facilities with Full Control of Access
The Effect of Vehicle Type on Severity*
Percentage
Large-Truck/Other Vehicles
AllOthers
Severity Number
Fatal 84 63.9% 36.1%
Injury 2111 66.2% 33.8%
Prop. Dmg. 3753 70.9% 29.1%
All 5947 69.1% 30.9%
*Based on 1984 - 1986 data
52
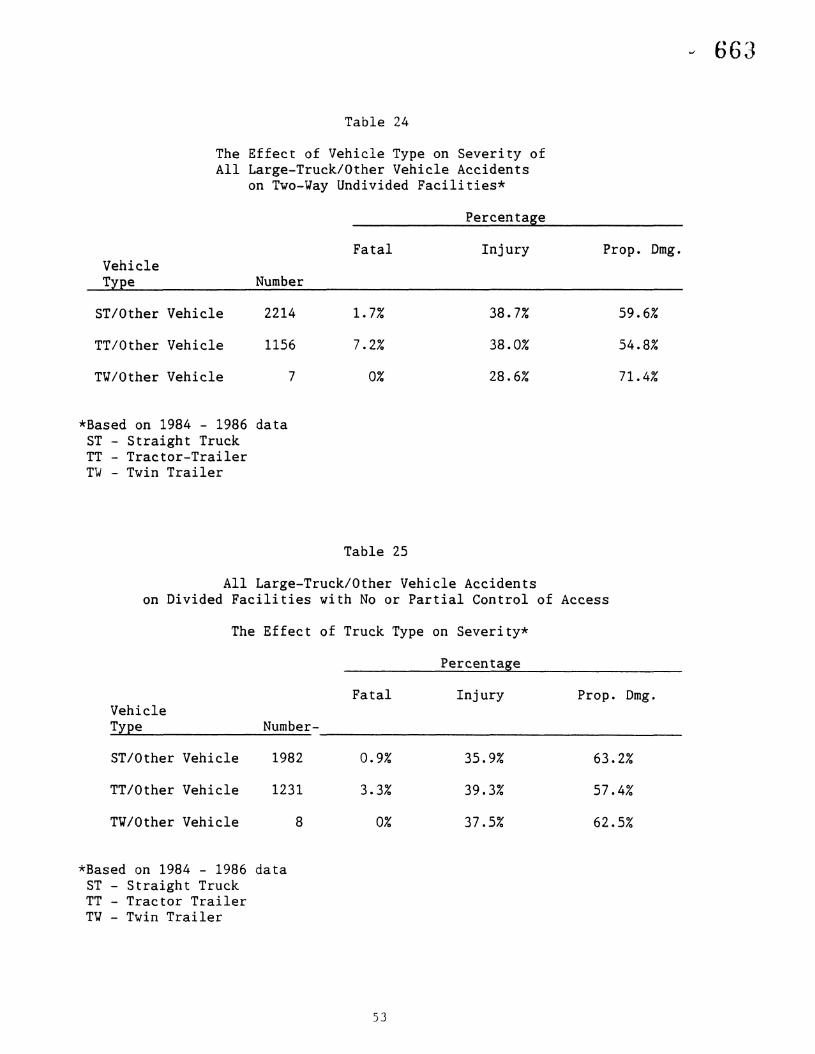
Table 24
The Effect of Vehicle Type on Severity ofAll Large-Truck/Other Vehicle Accidents
on Two-Vay Undivided Facilities*
Percentage
663
VehicleType
ST/Other Vehicle
TT/Other Vehicle
TV/Other Vehicle
Number
2214
1156
7
Fatal
1.7%
7.2%
0%
Injury
38.7%
38.0%
28.6%
Prop. Dmg.
59.6%
54.8%
71.4%
*Based on 1984 - 1986 dataST - Straight TruckTT - Tractor-TrailerT~ - Twin Trailer
Table 25
All Large-Truck/Other Vehicle Accidentson Divided Facilities with No or Partial Control of Access
The Effect of Truck Type on Severity*
Percentage
VehicleType
ST/Other Vehicle
TT/Other Vehicle
TV/Other Vehicle
Number-
1982
1231
8
Fatal
0.9%
3.3%
0%
Injury
35.9%
39.3%
37.5%
Prop. Omg.
63.2%
57.4%
62.5%
*Based on 1984 - 1986 dataST - Straight TruckTT - Tractor TrailerTV - Twin Trailer
53
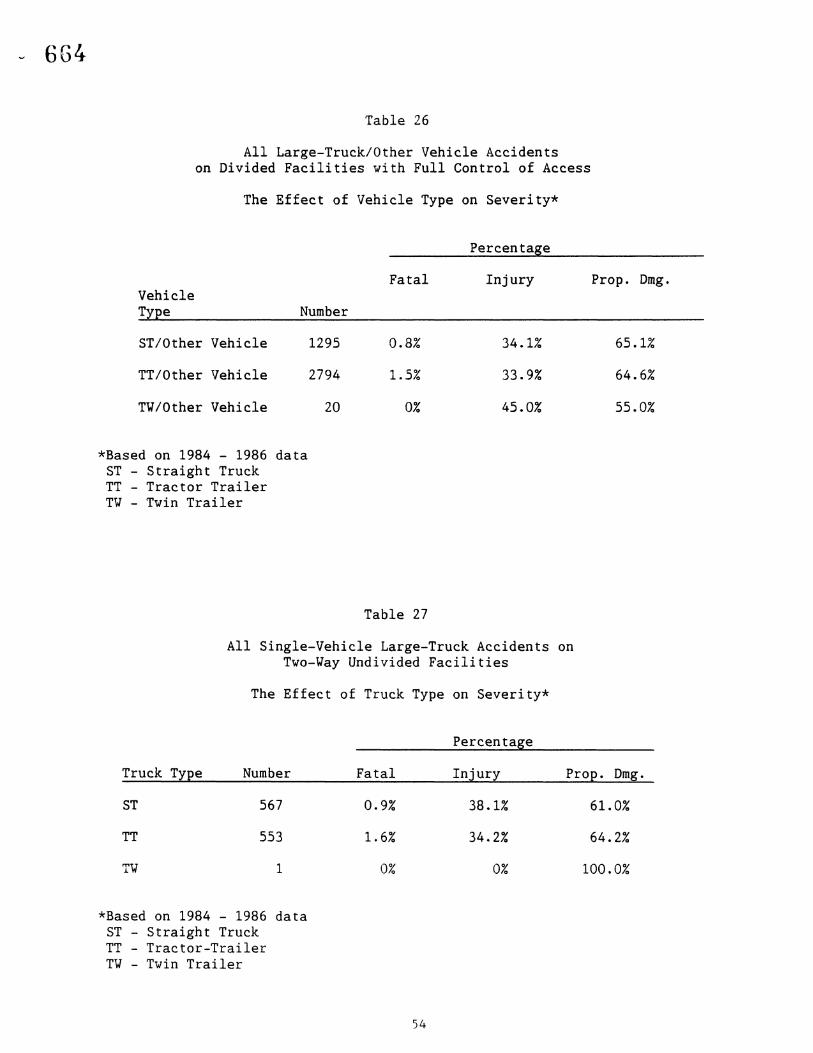
6G4
Table 26
All Large-Truck/Other Vehicle Accidentson Divided Facilities with Full Control of Access
The Effect of Vehicle Type on Severity*
Percentage
VehicleType
ST/Other Vehicle
TT/Other Vehicle
TY/Other Vehicle
Number
1295
2794
20
Fatal
0.8%
1.5%
0%
Injury
34.1%
33.9%
45.0%
Prop. Omg.
65.1%
64.6%
55.0%
*Based on 1984 - 1986 dataST - Straight TruckTT - Tractor TrailerTW - Twin Trailer
Table 27
All Single-Vehicle Large-Truck Accidents onTwo-Yay Undivided Facilities
The Effect of Truck Type on Severity*
Percentage
Truck Type
ST
TT
TW
Number
567
553
1
Fatal
0.9%
1.6%
0%
Injury
38.1%
34.2%
0%
Prop. Dmg.
61.0%
64.2%
100.0%
*Based on 1984 - 1986 data5T - Straight TruckTT - Tractor-TrailerTV - Twin Trailer
54
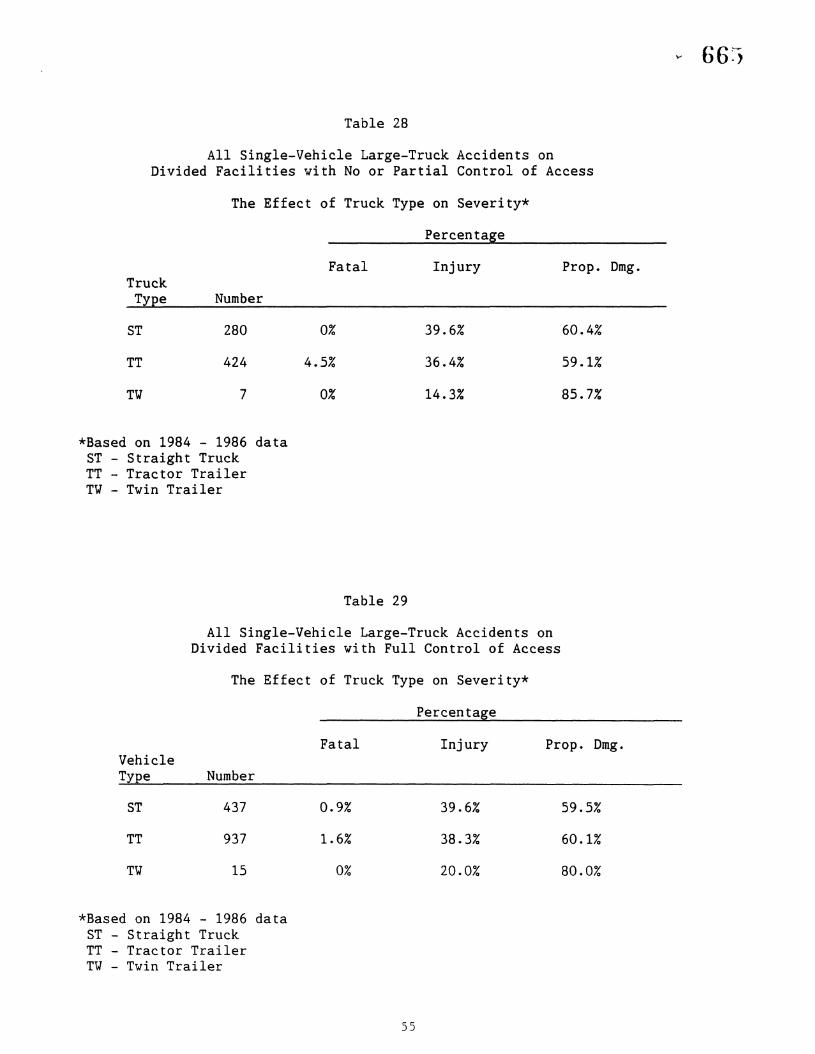
Table 28
All Single-Vehicle Large-Truck Accidents onDivided Facilities with No or Partial Control of Access
The Effect of Truck Type on Severity*
Percentage
66~,
FatalTruck
Type Number
ST 280 0%
TT 424 4.5%
TV 7 0%
Injury
39.6%
36.4%
14.3%
Prop. Dmg.
60.4%
59.1%
85.7%
*Based on 1984 - 1986 dataST - Straight TruckTT - Tractor TrailerTV - Twin Trailer
Table 29
All Single-Vehicle Large-Truck Accidents onDivided Facilities with Full Control of Access
The Effect of Truck Type on Severity*
Percentage
VehicleType
ST
TT
TW
Number
437
937
15
Fatal
0.9%
1.6%
0%
Injury
39.6%
38.3%
20.0%
Prop. Dmg.
59.5%
60.1%
80.0%
*Based on 1984 - 1986 dataST - Straight TruckTT - Tractor TrailerTW - Twin Trailer
55
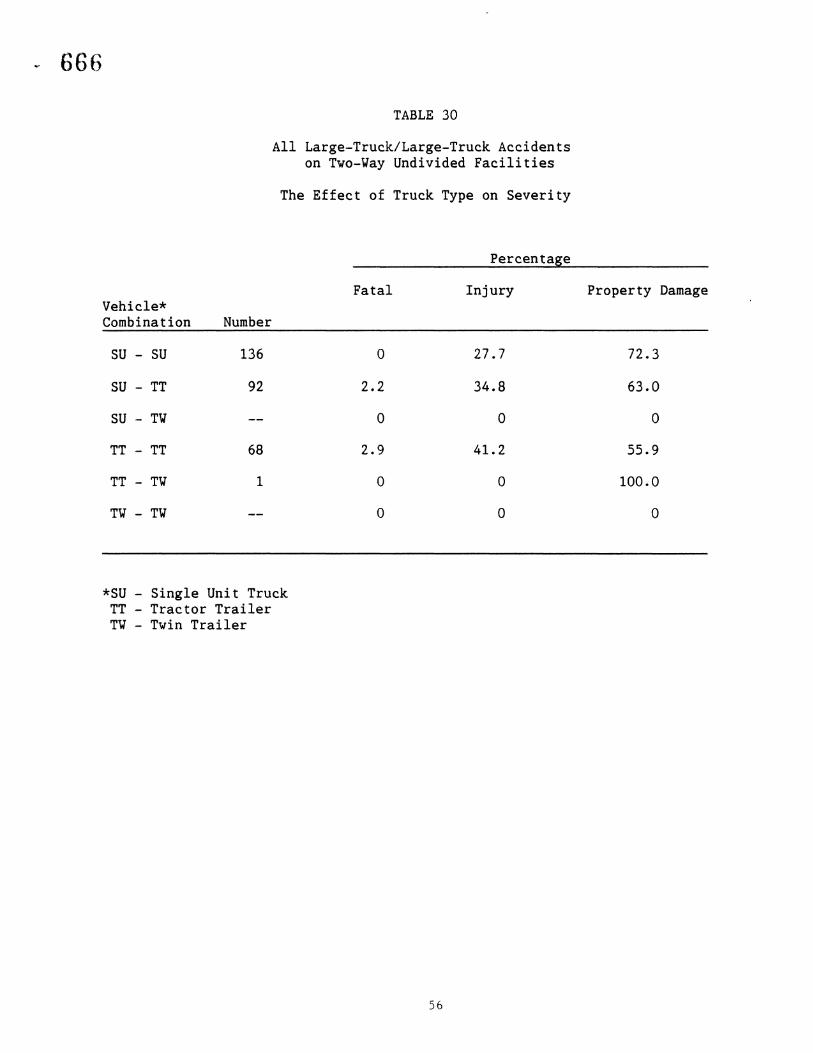
666
TABLE 30
All Large-Truck/Large-Truck Accidentson Two-Vay Undivided Facilities
The Effect of Truck Type on Severity
Percentage
Fatal Injury Property DamageVehicle*Combination Number
SU - SU 136 0 27.7 72.3
SU - TT 92 2.2 34.8 63.0
SU - TV 0 0 0
TT - TT 68 2.9 41.2 55.9
TT - TV 1 0 0 100.0
TV - TV 0 0 0
*SU - Single Unit TruckTT - Tractor TrailerTV - Twin Trailer
56
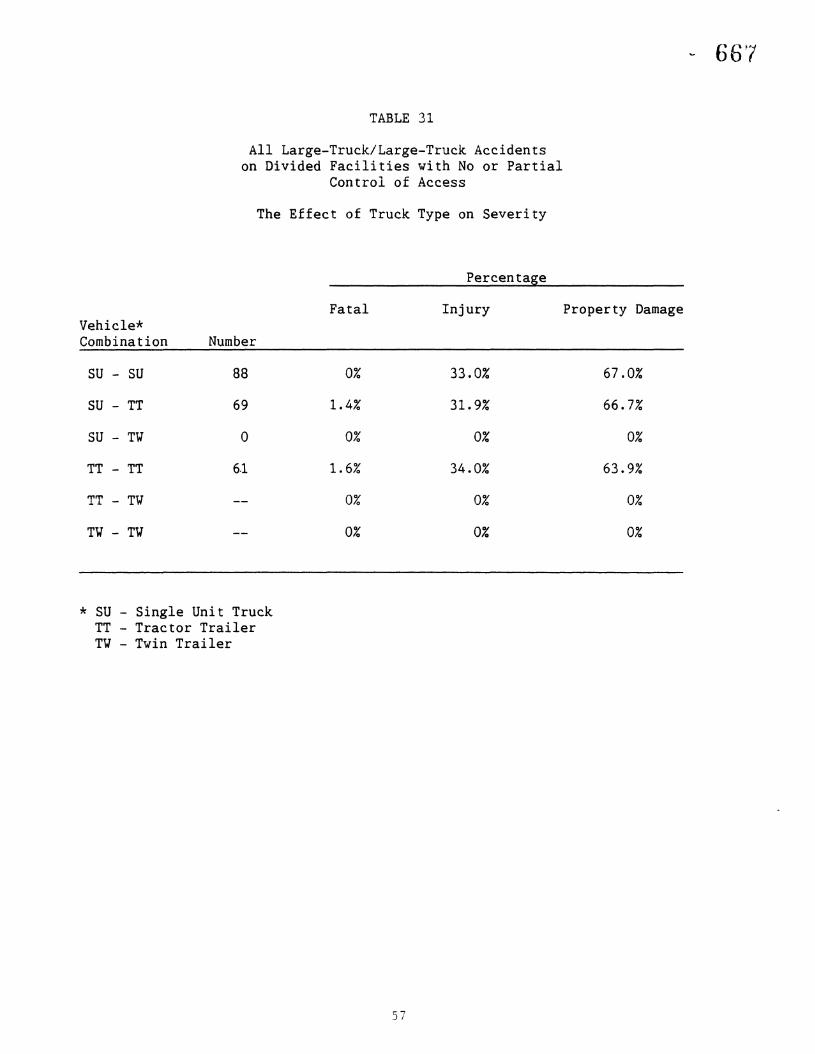
TABLE 31
All Large-Truck/Large-Truck Accidentson Divided Facilities with No or Partial
Control of Access
The Effect of Truck Type on Severity
Percentage
Fatal Injury Property DamageVehicle*Combination Number
SU - SU 88 0% 33.0% 67.0%
SU - TT 69 1.4% 31.9% 66.7%
SU - TV 0 0% 0% 0%
TT - TT 6.1 1.6% 34.0% 63.9%
TT - TV 0% 0% 0%
TY - TY 0% 0% 0%
* SU - Single Unit TruckTT - Tractor TrailerTV - Twin Trailer
57
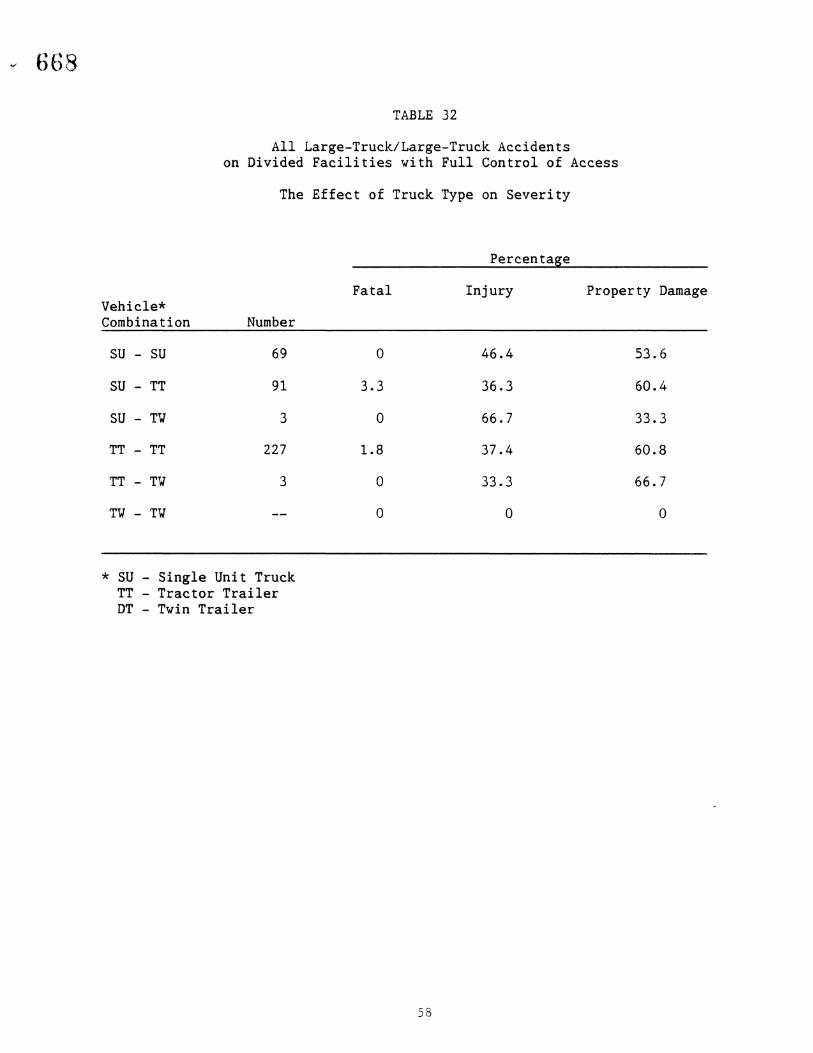
668
TABLE 32
All Large-Truck/Large-Truck Accidentson Divided Facilities with Full Control of Access
The Effect of Truck Type on Severity
Percentage
Fatal Injury Property DamageVehicle*Combination Number
SU - SU 69 0 46.4 53.6
SU - TT 91 3.3 36.3 60.4
SU - TV 3 0 66.7 33.3
TT - TT 227 1.8 37.4 60.8
TT - TV 3 0 33.3 66.7
TY - TV 0 0 0
* SU - Single Unit TruckTT - Tractor TrailerDT - Twin Trailer
58
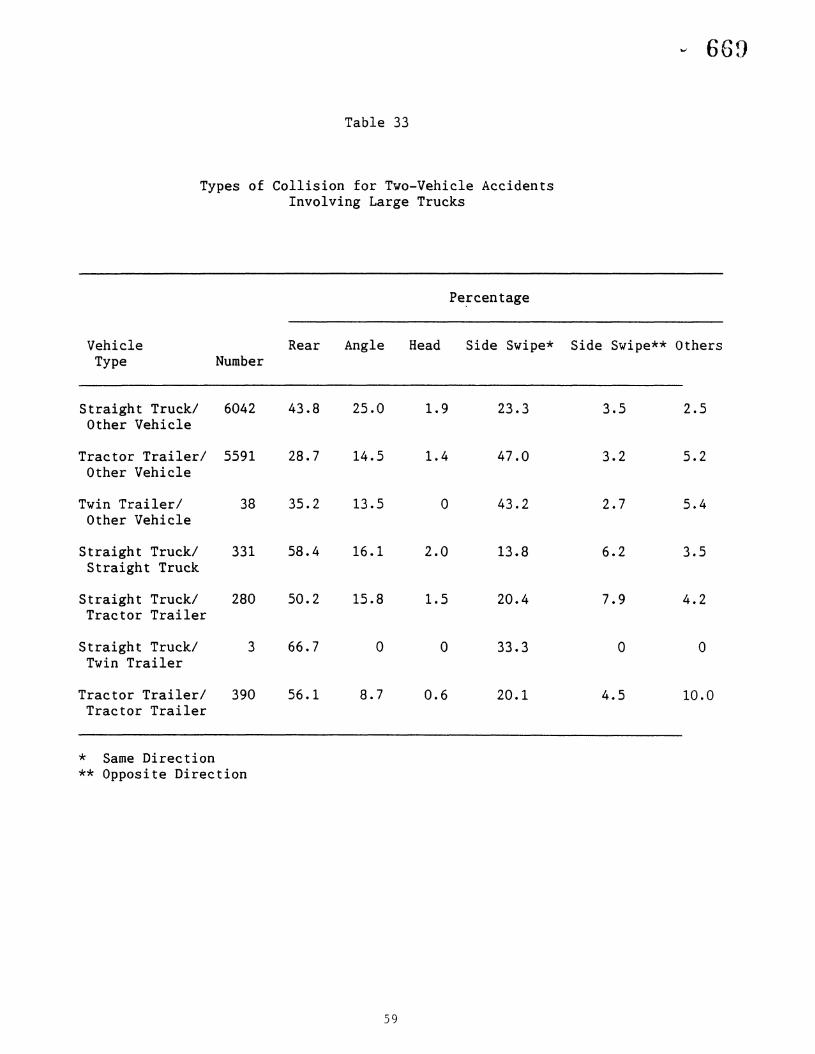
Table 33
Types of Collision for Two-Vehicle AccidentsInvolving Large Trucks
66D
Pe~centage
Vehicle Rear Angle Head Side Swipe* Side Swipe** OthersType Number
Straight Truck/ 6042 43.8 25.0 1.9 23.3 3.5 2.5Other Vehicle
Tractor Trailer/ 5591 28.7 14.5 1.4 47.0 3.2 5.2Other Vehicle
Twin Trailer/ 38 35.2 13.5 0 43.2 2.7 5.4Other Vehicle
Straight Truck/ 331 58.4 16.1 2.0 13.8 6.2 3.5Straight Truck
Straight Truck/ 280 50.2 15.8 1.5 20.4 7.9 4.2Tractor Trailer
Straight Truck/ 3 66.7 0 0 33.3 0 0Twin Trailer
Tractor Trailer/ 390 56.1 8.7 0.6 20.1 4.5 10.0Tractor Trailer
* Same Direction** Opposite Direction
59
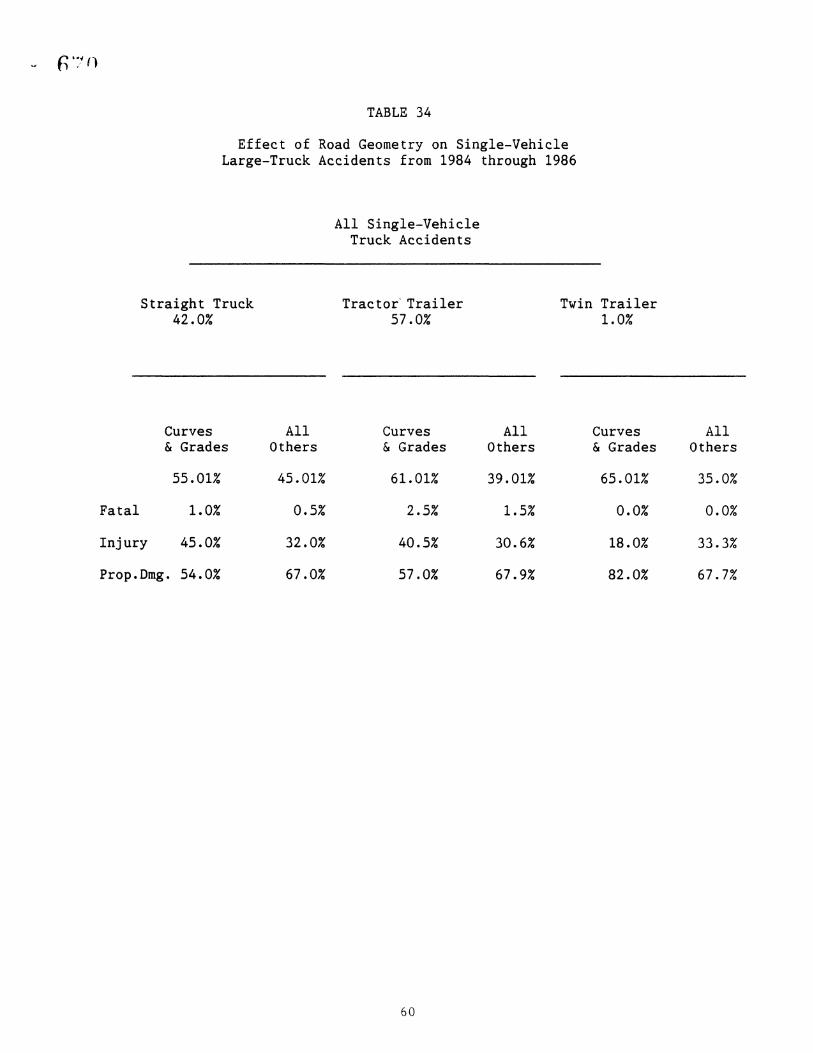
TABLE 34
Effect of Road Geometry on Single-VehicleLarge-Truck Accidents from 1984 through 1986
All Single-VehicleTruck Accidents
Straight Truck42.0%
Tractor' Trailer57.0%
Twin Trailer1.0%
Curves All Curves All Curves All& Grades Others & Grades Others & Grades Others
55.01% 45.01% 61.01% 39.01% 65.01% 35.0%
Fatal 1.0% 0.5% 2.5% 1.5% 0.0% 0.0%
Injury 45.0% 32.0% 40.5% 30.6% 18.0% 33.3%
Prop.Dmg. 54.0% 67.0% 57.0% 67.9% 82.0% 67.7%
60
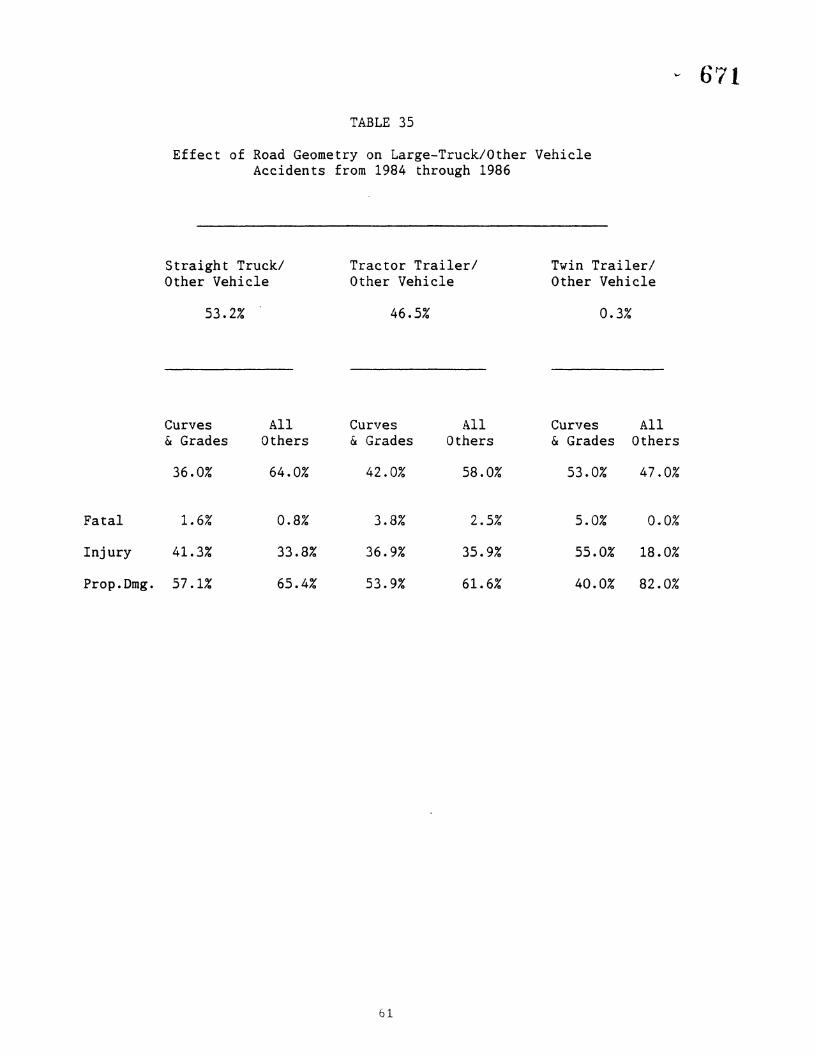
TABLE 35
Effect of Road Geometry on Large-Truck/Other VehicleAccidents from 1984 through 1986
671
Straight Truck/Other Vehicle
53.2%
Tractor Trailer/Other Vehicle
46.5%
Twin Trailer/Other Vehicle
0.3%
Curves All Curves All Curves All& Grades Others & Grades Others & Grades Others
36.0% 64.0% 42.0% 58.0% 53.0% 47.0%
Fatal 1.6% 0.8% 3.8% 2.5% 5.0% 0.0%
Injury 41.3% 33.8% 36.9% 35.9% 55.0% 18.0%
Prop.Dmg. 57.1% 65.4% 53.9% 61.6% 40.0% 82.0%
61
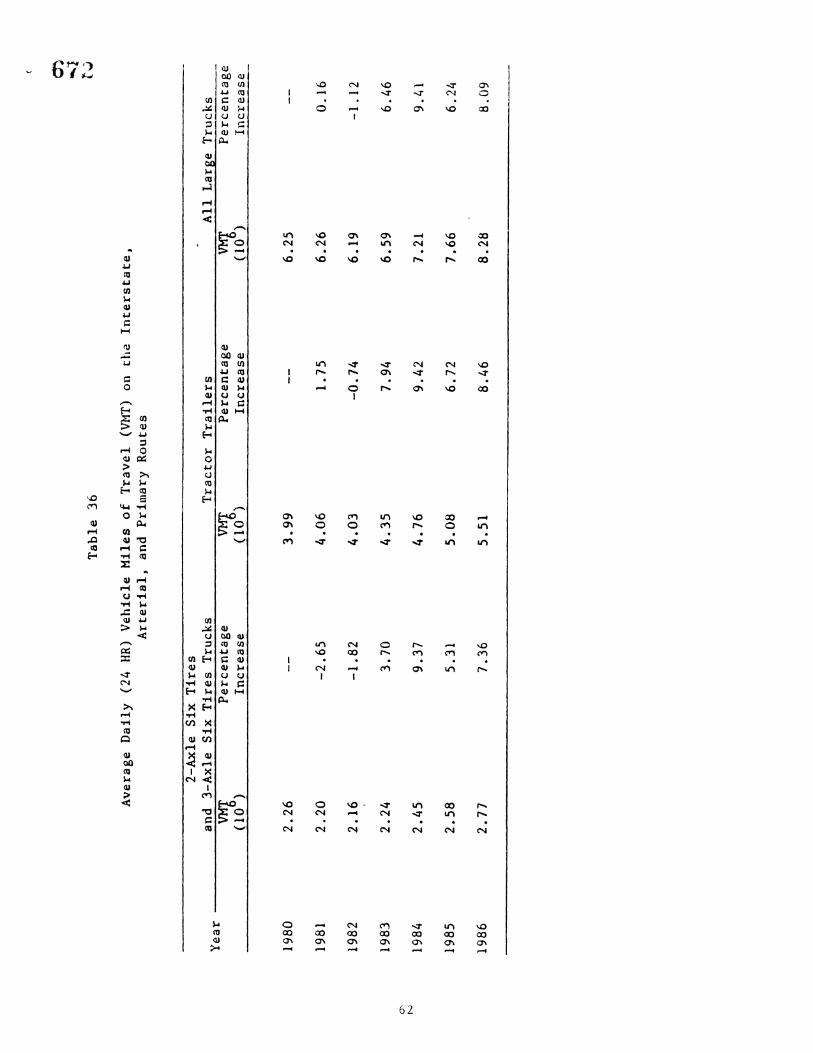
Tab
le36
Ave
rage
Dai
ly(2
4H
R)V
ehic
leM
iles
of
Tra
vel
(VM
T)on
the
Inte
rsta
te,
Art
eri
al,
and
Pri
mar
yR
ou
tes
0;
'1 r~
2-A
xle
Six
Tir
es
Yea
ran
d3
-Ax
leS
ixT
ires
Tru
cks
Tra
cto
rT
rail
ers
All
Lar
geT
ruck
s
(~)
Per
cen
tag
e(~
)P
erce
nta
ge
(~)
Perc
en
tag
eIn
crea
seIn
crea
seIn
crea
se
1980
2.2
6--
3.9
9--
6.2
5
1981
2.2
0-2
.65
4.0
61
.75
6.2
60
.16
1982
2.1
6-1
.82
4.0
3-0
.74
6.1
9-1
.12
1983
2.2
43
.70
4.3
57
.94
6.5
96
.46
0'
N19
842
.45
9.3
74
.76
9.4
27
.21
9.L
.l
1985
2.5
85
.31
5.0
86
.72
7.6
66
.24
1986
2.7
77
.36
5.5
18
.46
8.2
88
.09
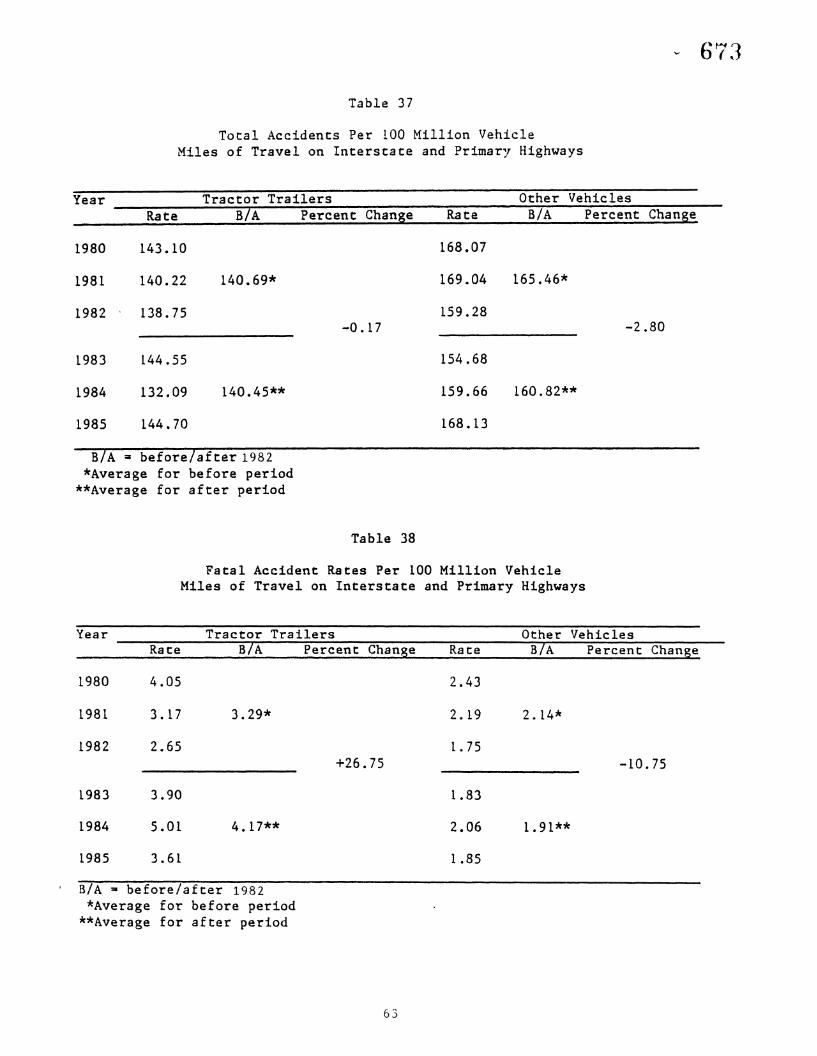
Table 37
Total Accidents Per 100 Million VehicleMiles of Travel on Interstate and Primary Highways
Year Tractor Trailers Other VehiclesRate BfA Percent Change Rate BfA Percent Change
1980 143.10 168.07
1981 140.22 140.69* 169.04 165.46*
1982 138.75 159.28-0.17 -2.80
1983 144.55 154.68
1984 132.09 140.45** 159.66 160.82**
1985 144.70 168.13
BlA :I beforelafter 1982*Average for before period
**Average for after period
Table 38
Fatal Accident Rates Per 100 Million VehicleMiles of Travel on Interstate and Primary Highways
673
Year Tractor TrailersRate B/A Percent Change Rate
1980 4.05 2.43
1981 3.17 3.29* 2.19
1982 2.65 1.75+26.75
1983 3.90 1.83
1984 5.01 4.17** 2.06
1985 3.61 1.85
BfA ~ before/after 1982*Average for before period
**Average for after period
Other VehiclesB/A Percent Change
2.14*
-10.75
1.91**
63
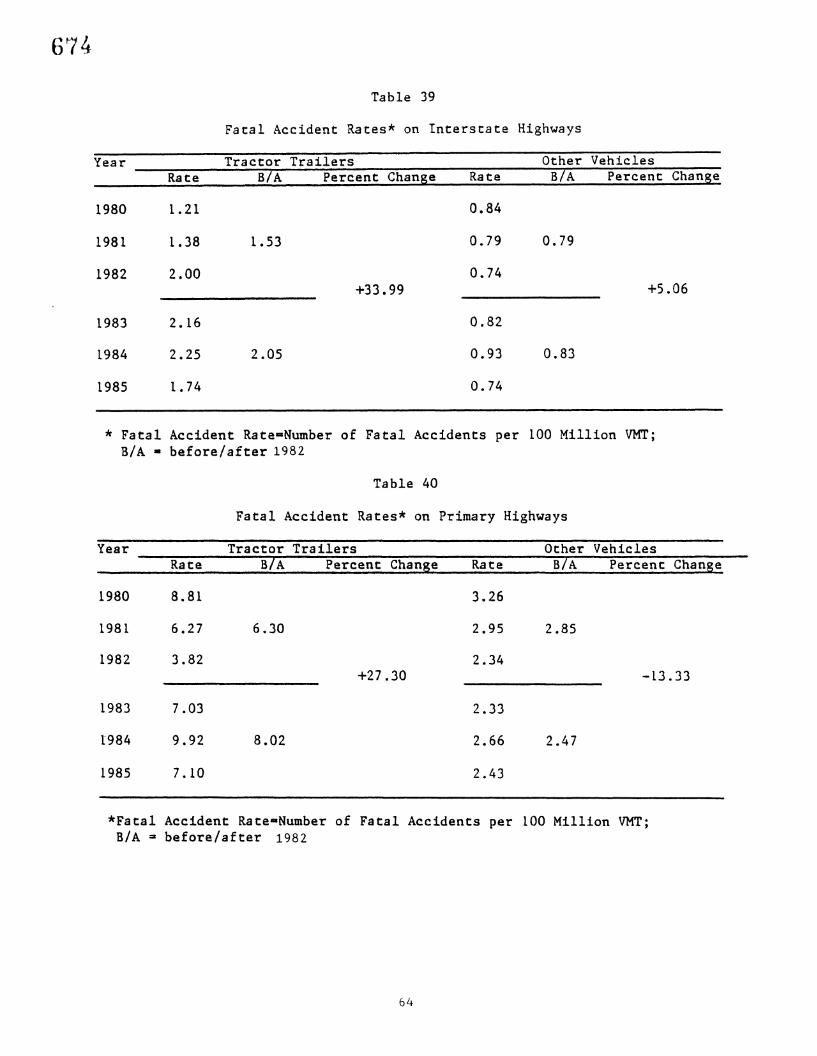
6~74
Table 39
Fatal Accident Rates* on Interstate Highways
Year Tractor Trailers Other VehiclesRate B/A Percent Change Rate B/A Percent Change
1980 1.21 0.84
1981 1.38 1.53 0.79 0.79
1982 2.00 0.74+33.99 +5.06
1983 2.16 0.82
1984 2.25 2.05 0.93 0.83
1985 1.74 0.74
* Fatal Accident Rate=Number of Fatal Accidents per 100 Million VMT;BIA • before/after 1982
Table 40
Fatal Accident Rates* on Primary Highways
YearRate
1980 8.81
1981 6.27
1982 3.82
1983 7.03
1984 9.92
1985 7.10
Tractor TrailersB/A Percent Change
6.30
+27.30
8.02
Rate
3.26
2.95
2.34
2.33
2.66
2.43
Other VehiclesB/A Percent Change
2.85
-13.33
2.47
*Fatal Accident Rate-Number of Fatal Accidents per 100 Million VMT;BfA = before/after 1982
64
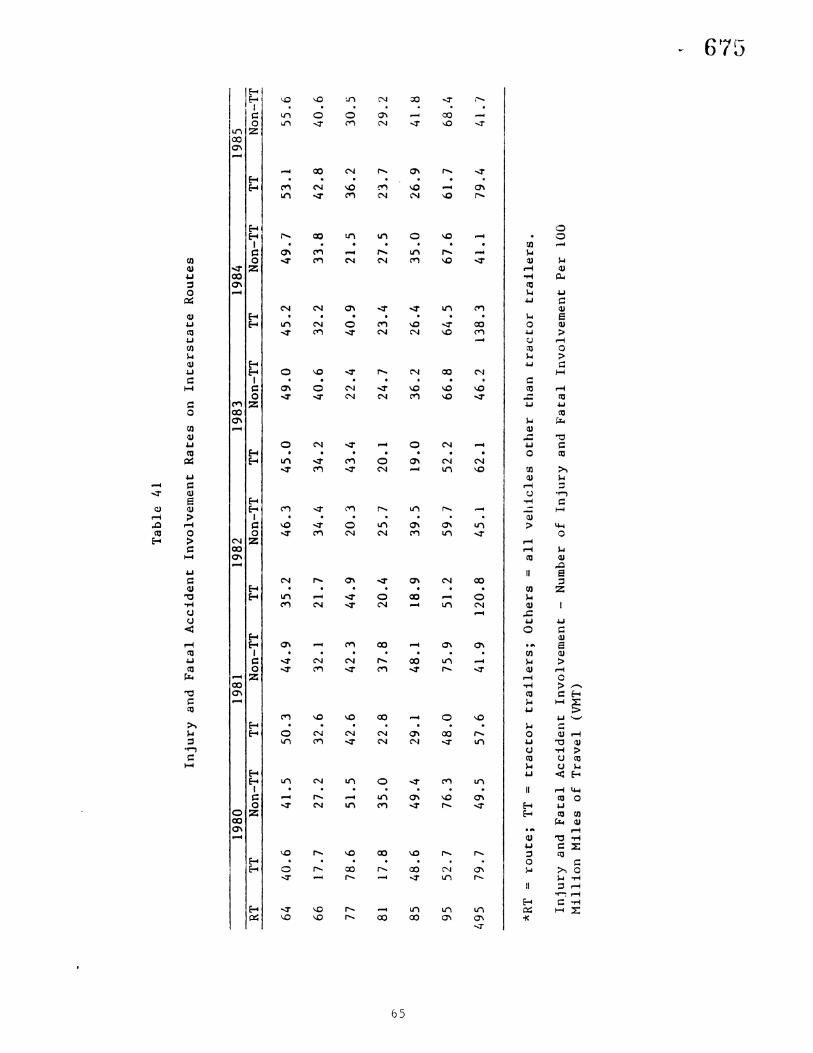
Tab
le41
Inju
ryan
dF
ata
lA
ccid
ent
Inv
olv
emen
tR
ates
onIn
ters
tate
Ro
ute
s
1980
1981
1982
1983
1984
1985
RTTT
Non
-TT
TTN
on-T
TTT
Non
-TT
TTN
on-T
TTT
Non
-TT
TTN
on-T
T
64~O.6
41
.55
0.3
44
.93
5.2
46
.34
5.0
49
.04
5.2
49
.75
3.1
55
.6
661
7.7
27
.23
2.6
32
.12
1.7
34
.43
4.2
40
.63
2.2
33
.84
2.8
40
.6
777
8.6
51
.54
2.6
42
.34
4.9
20
.34
3.4
22
.44
0.9
21
.53
6.2
30
lt5
811
7.8
35
.02
2.8
37
.82
0.4
25
.72
0.1
24
.72
3.4
21
.52
3.7
29
.20"
-U
1
854
8.6
49
.42
9.1
48
.11
8.9
39
.51
9.0
36
.22
6.4
35
.02
6.9
41
.8
955
2.7
76
.34
8.0
75
.95
1.2
59
.75
2.2
66
.86
4.5
67
.66
1.7
68
.4
495
79
.74
9.5
57
.64
1.9
12
0.8
45
.16
2.1
46
.21
38
.34
1.1
79
.44
1.7
*Rr
=ro
ute
;TT
=tr
acto
rtr
ail
ers
;O
thers
=all
vel.
iele
so
ther
than
tracto
rtr
ail
ers
.
Inju
ryan
dF
ata
lA
ccid
ent
Inv
olv
emen
t-
Num
ber
of
Inju
ryan
dF
ata
lIn
vo
lvem
ent
Per
100
Mil
lio
nM
iles
of
Tra
vel
(VM
T)
OJ~ (.
,.
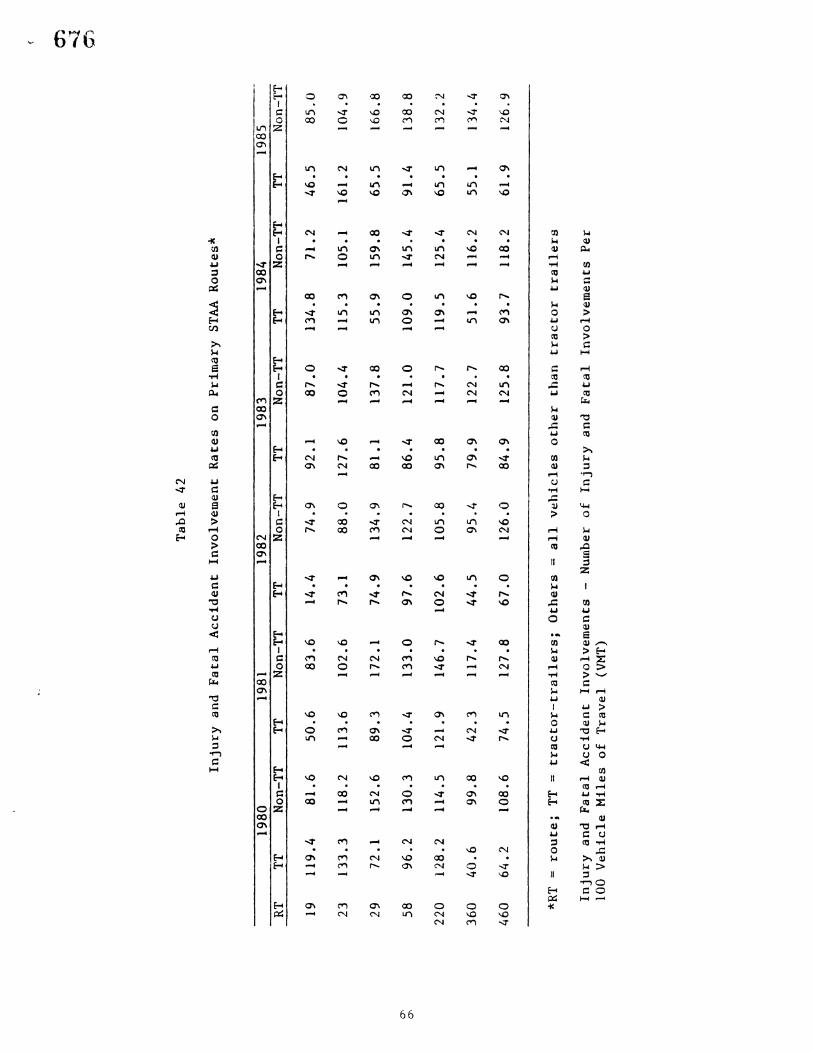
Tab
le42
Inju
ryan
dF
ata
lA
ccid
ent
Inv
olv
emen
tR
ates
onP
rim
ary
STA
AR
ou
tes*
19
80
1981
1982
1983
1984
1985
RTTT
Non
-TT
TTN
on-T
TTT
Non
-TT
TTN
on-T
TTT
Non
-TT
TTN
on-T
T
191
19
.48
1.6
50
.68
3.6
14
.47
4.9
92
.18
7.0
13
4.8
11
.24
6.5
85
.0
231
33
.31
18
.21
13
.61
02
.67
3.1
88
.01
27
.61
04
.41
15
.31
05
.11
61
.21
04
.9
297
2.1
15
2.6
89
.31
72
.17
4.9
13
4.9
81
.11
37
.85
5.9
15
9.8
65
.51
66
.8
0"-
589
6.2
13
0.3
10
4.4
13
3.0
97
.61
22
.78
6.4
12
1.0
10
9.0
14
5.4
91
.4l3
8.8
0"-
220
12
8.2
11
4.5
12
1.9
14
6.7
10
2.6
10
5.8
95
.81
17
.71
19
.51
25
.46
5.5
13
2.2
360
40
.69
9.8
42
.31
17
.44
4.5
95
.47
9.9
12
2.7
51
.61
16
.25
5.1
13
4.4
460
64
.21
08
.67
4.5
12
7.8
67
.01
26
.08
4.9
12
5.8
93
.71
18
.26
1.9
12
6.9
*RT
=ro
ute
jTT
=tr
acto
r-tr
ail
ers
;O
ther
s=
all
veh
icle
so
ther
than
tracto
rtr
ail
ers
Inju
ryan
dF
ata
lA
ccid
ent
Inv
olv
emen
ts-
Num
ber
of
Inju
ryan
dF
ata
lIn
vo
lvem
ents
Per
100
Veh
icle
Mil
eso
fT
rav
el(V
MT)
en ---1
C)
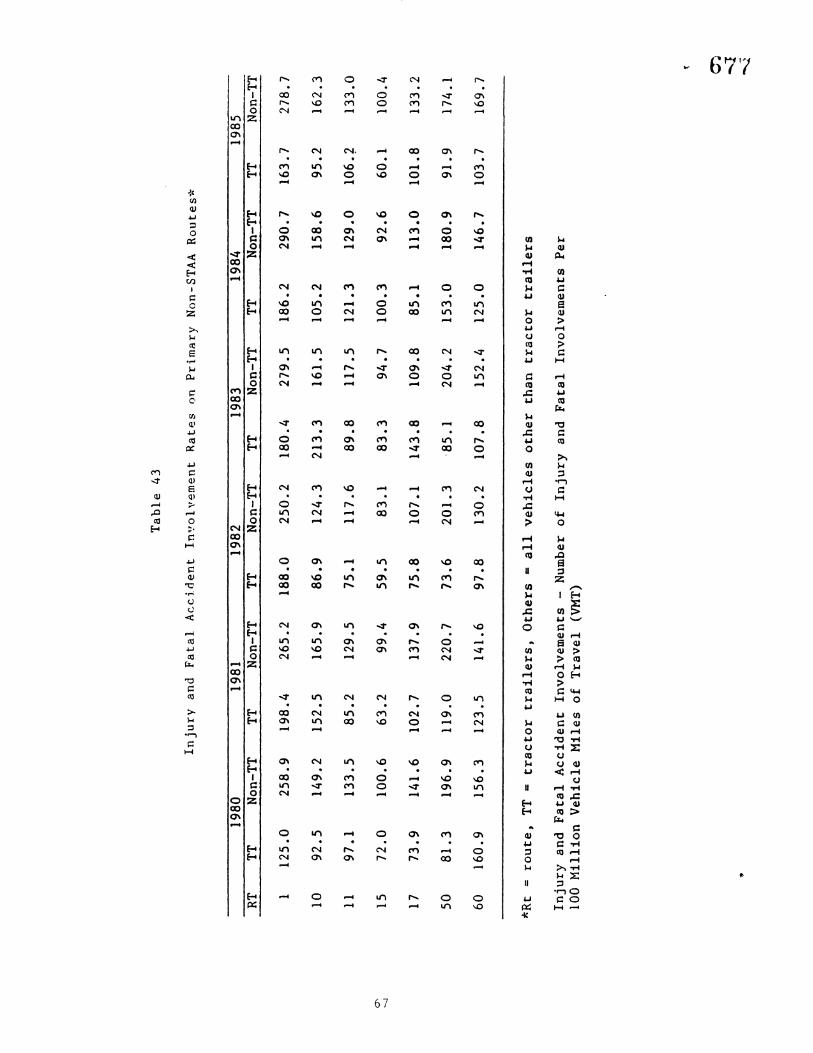
Tab
le4
3
Inju
ryan
dF
ata
lA
ccid
en
tIn
vo
lvem
en
tR
ate
son
Pri
mary
Non
-ST
AA
Ro
ute
s*
1980
1981
1982
1983
19
84
1985
RTTT
Non
-TT
TTN
on-T
TTT
Non
-TT
TTN
on-T
TTT
Non
-TT
TTN
on-T
T
11
25
.02
58
.91
98
.426
5.2
18
8.0
25
0.2
18
0.4
27
9.5
18
6.2
29
0.7
163.
727
8.7
109
2.5
14
9.2
15
2.5
165.
98
6.9
12
4.3
21
3.3
16
1.5
10
5.2
15
8.6
95
.216
2.3
119
7.1
13
3.5
85
.212
9.5
75
.11
17
.68
9.8
11
7.5
12
1.3
12
9.0
106.
71
33
.0
0"-
157
2.0
10
0.6
63
.29
9.4
59
.58
3.1
83
.39
4.7
10
0.3
92
.66
0.1
100.
4-.
J
177
3.9
14
1.6
10
2.7
137.
97
5.8
10
7.1
14
3.8
10
9.8
85
.11
13
.01
01
.813
3.2
508
1.3
19
6.9
11
9.0
220.
77
3.6
20
1.3
'85
.12
04
.21
53
.01
80
.99
1.9
174.
1
601
60
.91
56
.31
23
.514
1.6
97
.81
30
.21
07
.81
52
.41
25
.01
46
.710
3.7
169.
7
*Rt
=ro
ute
,TT
=tr
acto
rtr
ail
ers
,O
ther
s=
all
veh
icle
so
ther
than
tracto
rtr
ail
ers
Inju
ryan
dF
ata
lA
ccid
ent
Inv
olv
emen
ts-
Num
ber
of
Inju
ryan
dF
ata
lIn
vo
lvem
ents
Per
100
Mil
lio
nV
ehic
leM
iles
of
Tra
vel
(VH
T)
•
en ,1 ~
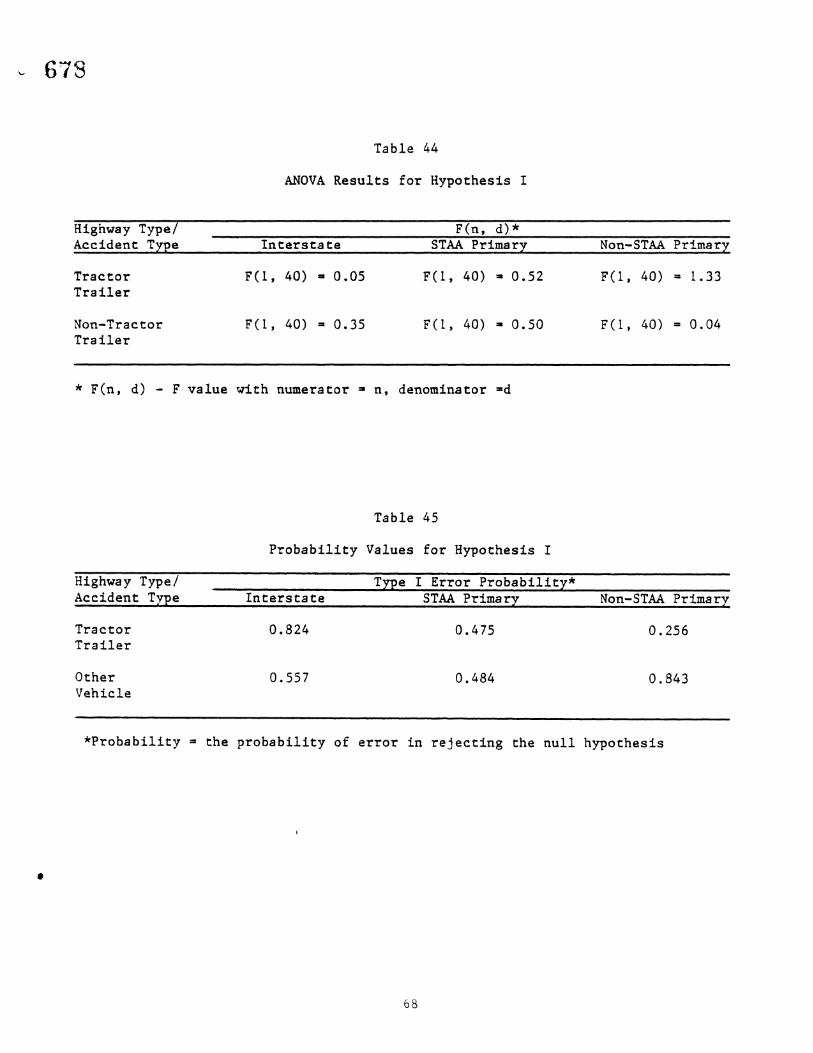
678
Table 44
ANOVA Results for Hypothesis I
Highway Type/Accident TyPe
TractorTrailer
Non-TractorTrailer
Interstate
F(l, 40) :II 0.05
F(l, 40) = 0.35
F(n, d)*STAA Primary
F(l, 40) :a 0.52
F(l, 40) =- 0.50
Non-STAA Primary
F(l, 40) = 1.33
F(l, 40) = 0.04
•
* F(n, d) - F value with numerator ::II n, denominator =d
Table 45
P~obability Values for Hypothesis I
Highway Typel TyPe I Error Probability*Accident Type Interstate STAA Primary Non-STAA Primary
Tractor 0.824 0.475 0.256Trailer
Other 0.557 0.484 0.843Vehicle
*Probability = the probability of error in rejecting the null hypothesis
68
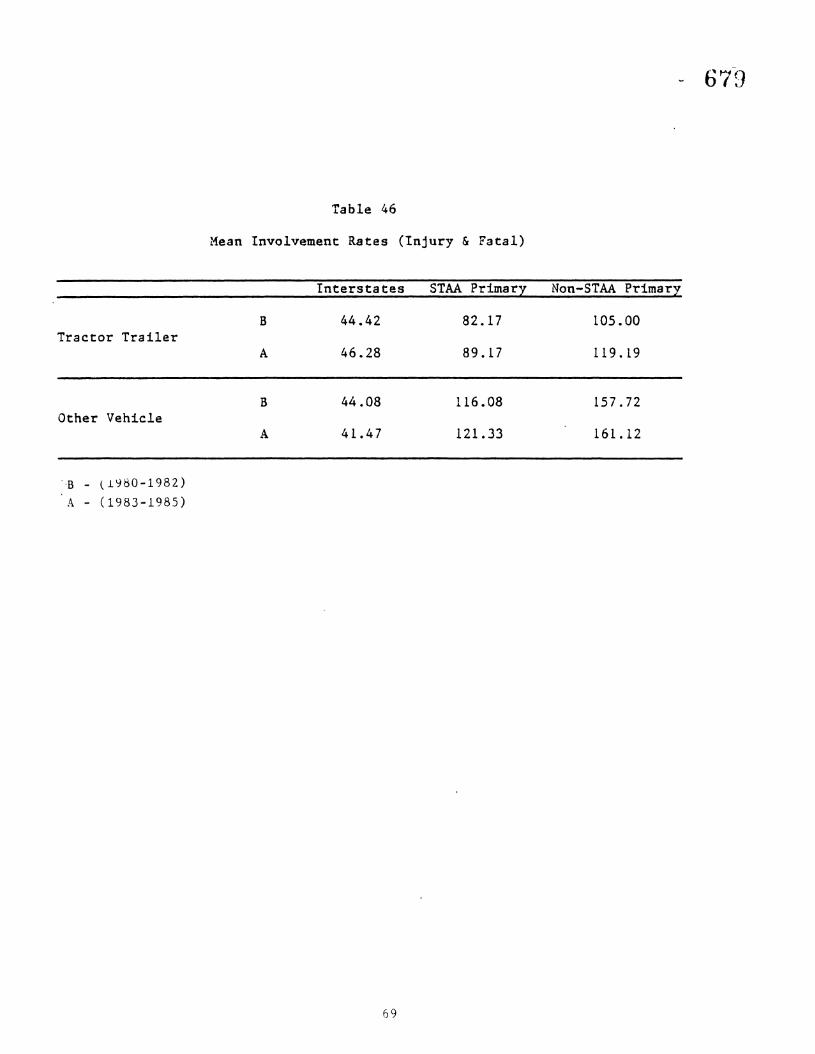
Tractor Trailer
Other Vehicle
-·B - (1~80-1982)
A - (1983-1985)
Table 46
Mean Involvement Rates (Injury & Fatal)
Interstates STAA Primary Non-STAA Primary
B 44.42 82.17 105.00
A 46.28 89.17 119.19
B 44.08 116.08 157.72
A 41.47 121.33 161.12
69
67~J
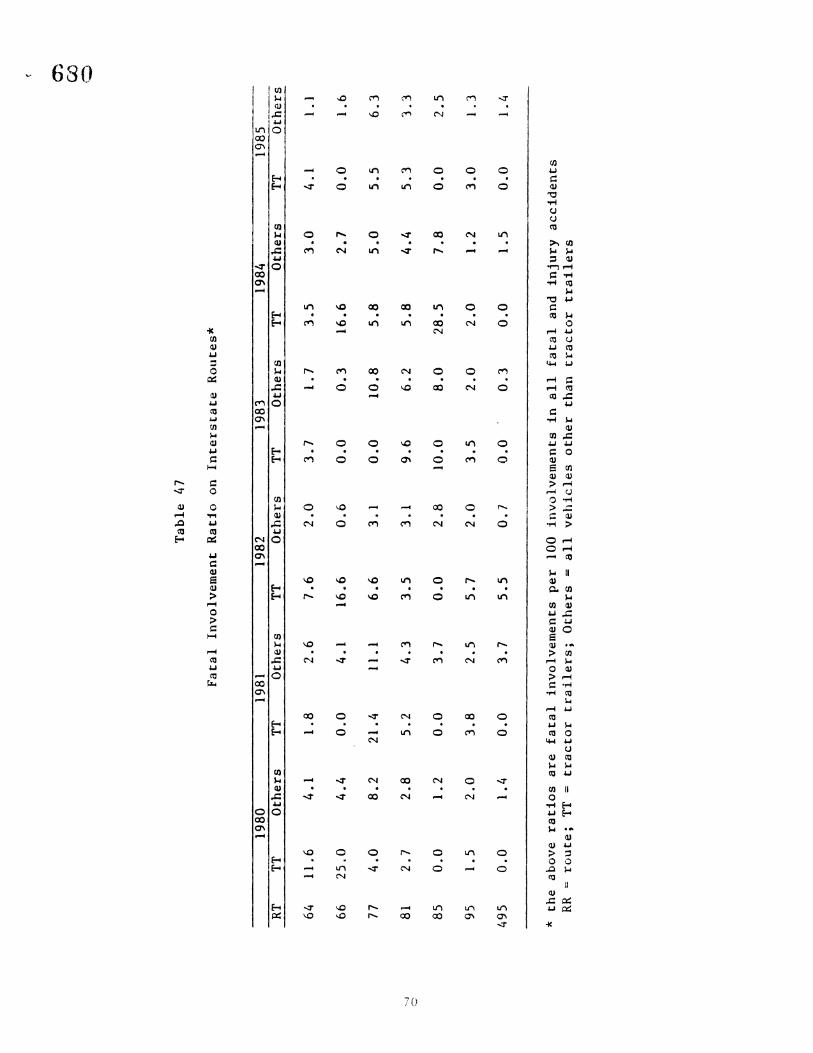
Tab
le47
Fata
lIn
vo
lvem
ent
Rat
:fo
onIn
ters
tate
Ro
ute
s*
1980
1981
1982
1983
1984
1985
RT
TTO
ther
sTT
Oth
ers
TTO
ther
sTT
Oth
ers
TTO
ther
sTT
Oth
ers
6411
.64
.11
.82
.67
.62
.03
.71
.73
.53
.04
.11
•1
662
5.0
4.4
0.0
4.1
16
.60
.60
.00
.31
6.6
2.7
0.0
1.6
774
.08
.22
1.4
11.1
6.6
3.1
0.0
10
.85
.85
.05
.56
.3
---J
812
.72
.85
.24
.33
.53
.19
.66
.25
.84
.45
.31
.3c
850
.01
.20
.03
.70
.02
.81
0.0
8.0
28
.57
.80
.02
.5
951
.52
.03
.82
.55
.72
.03
.52
.02
.01
.23
.01
.3
495
0.0
1.4
0.0
3.7
5.5
0.7
0.0
0.3
0.0
1.5
0.0
1.t
.
*th
eab
ove
rati
os
are
fata
lin
vo
lvem
ents
per
100
inv
olv
emen
tsin
all
fata
lan
din
jury
accid
en
tsRR
=ro
ute
;TT
=tr
acto
rtr
ail
ers
;O
ther
s=
all
veh
icle
so
ther
than
tracto
rtr
ail
ers
OJ
GO o
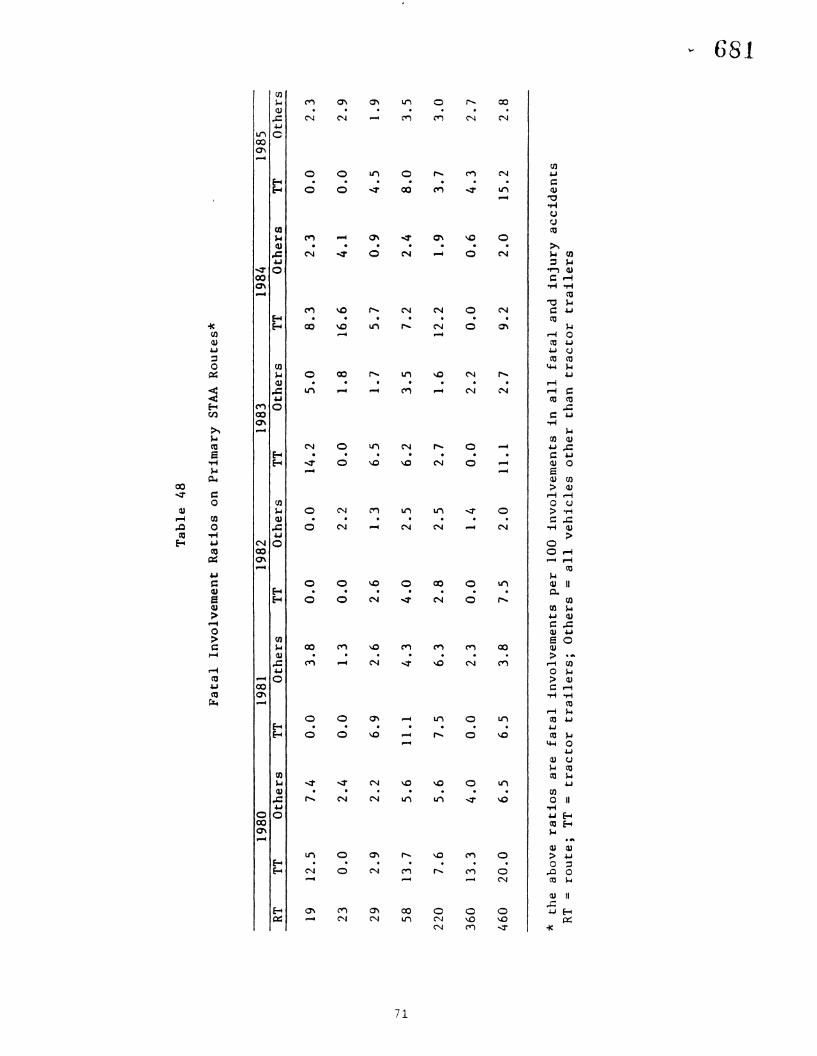
Tab
le48
Fata
lIn
vo
lvem
ent
Rati
os
onP
rim
ary
STA
AR
ou
tes*
1980
1981
1982
1983
1984
1985
RT
TTO
ther
sTT
Oth
ers
TT
Oth
ers
TTO
ther
sTT
Oth
ers
TTO
ther
s
191
2.5
7.4
0.0
3.8
0.0
0.0
14
.25
.08
.32
.30
.02
.3
230
.02
.40
.01
.30
.02
.20
.01
.81
6.6
4.1
0.0
2.9
292
.92
.26
.92
.62
.61
.36
.51
.75
.70
.94
.51
.9
-.J~
58
13
.75
.611
•14
.34
.02
.56
.23
.57
.22
.48
.03
.5
220
7.6
5.6
7.5
6.3
2.8
2.5
2.7
1.6
12
.21
.93
.73
.0
36
01
3.3
4.0
0.0
2.3
0.0
1.4
0.0
2.2
0.0
0.6
4.3
2.7
460
20
.06
.56
.53
.87
.52
.011
.12
.79
.22
.01
5.2
2.8
*th
eab
ove
rati
os
are
fata
lin
vo
lvem
ents
per
100
inv
olv
emen
tsin
all
fata
lan
din
jury
accid
en
tsR
T=
rou
te;
TT=
tracto
rtr
ail
ers
;O
ther
s=
all
veh
icle
so
ther
than
tracto
rtr
ail
ers
OJ
CO~
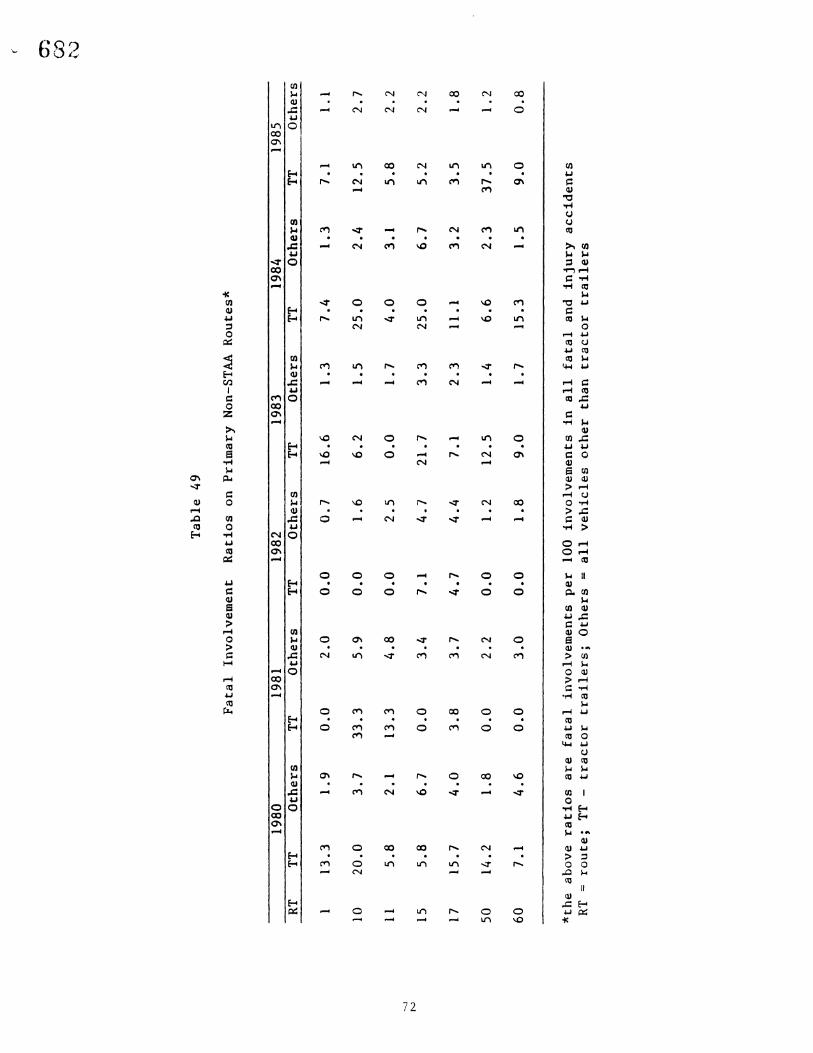
Tab
le49
Fata
lIn
vo
lvem
ent
Rati
os
onP
rim
ary
Non
-ST
AA
Ro
ute
s*
1980
1981
1982
1983
1984
19
85
RT
TTO
ther
sTT
Oth
ers
TTO
ther
sT
TO
ther
sTT
Oth
ers
TTO
ther
s
11
3.3
1.9
0.0
2.0
0.0
0.7
16
.61
.37
.41
.37
.11
.1
10
20
.03
.73
3.3
5.9
0.0
1.6
6.2
1.5
25
.02
.41
2.5
2.7
115
.82
.11
3.3
4.8
0.0
2.5
0.0
1.7
4.0
3.1
5.8
2.2
-..I
N
155
.86
.70
.03
.47
.14
.72
1.7
3.3
25
.06
.75
.22
.2
171
5.7
4.0
3.8
3.7
4.7
4.4
7.1
2.3
11•1
3.2
3.5
1.8
50
14
.21
.80
.02
.20
.01
.21
2.5
1.4
6.6
2.3
37
.51
.2
60
7.1
4.6
0.0
3.0
0.0
1.8
9.0
1.7
15
.31
.59
.00
.8
*th
eab
ove
rati
os
are
fata
lin
vo
lvem
ents
per
100
inv
olv
emen
tsIn
all
fata
lan
din
jury
accid
en
tsR
T=
rou
te;
TT-
tracto
rtr
ail
ers
;O
ther
s=
all
veh
icle
so
ther
than
tracto
rtr
ail
ers
( 0)
G.")
tv
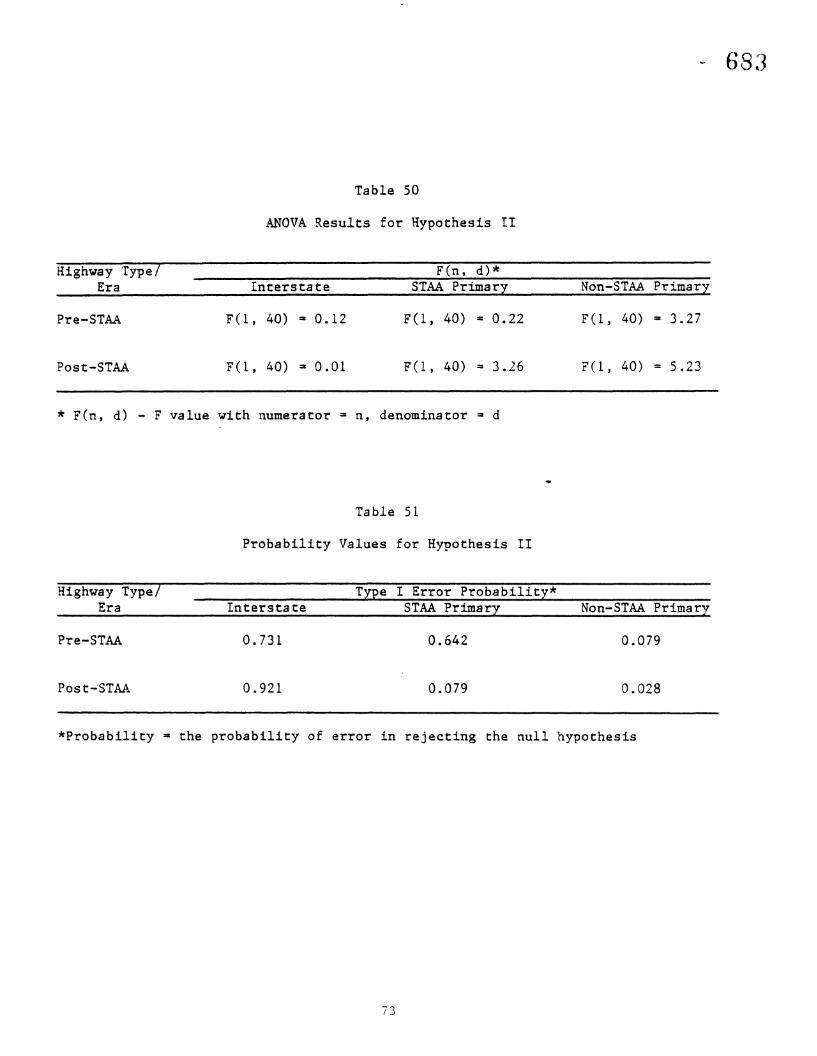
Table 50
ANOVA Results for Hypothesis II
683
Highway Type/Era
Pre-STAA
Interstate
F(l, 40) ~ O. 12
F(n, d)*STAA Primary
F(l, 40) = 0.22
Non-STAA P~imary
F(l, 40) == 3.27
Post-STAA F(l, 40) == 0.01 F(l, 40) == 3.26 F(l, 40) 5.23
* F(n, d) - F value with numerator == n, denominator = d
Table 51
Probability Values for Hypothesis II
Highway Type!Era
Pre-STAA
Post-STAA
Interstate
0.731
0.921
Type I Error Probability*STAA Primary
0.642
0.079
Non-STAA Primary
0.079
0.028
*Probability == the probability of error in rejecting the null hypothesis
73
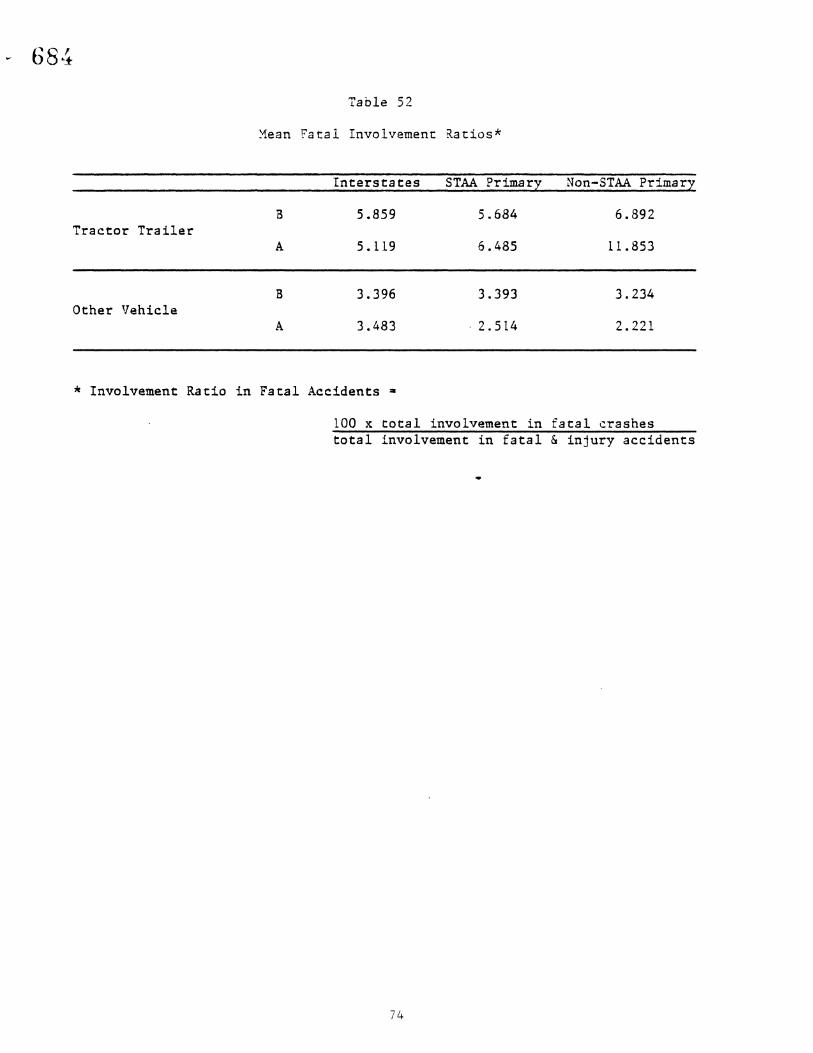
684
Tractor Trailer
Other Vehicle
Table 52
~1ean Fa ta 1 Involvement Ra tios *
Interstates STAA Primary Non-STAA Primary
B 5.859 5.684 6.892
A 5.119 6.485 11.853
B 3.396 3.393 3.234
A 3.483 . 2.514 2.221
* Involvement Ratio in Fatal Accidents a
100 X total involvement in fatal crashestotal involvement in fatal & injury accidents
74
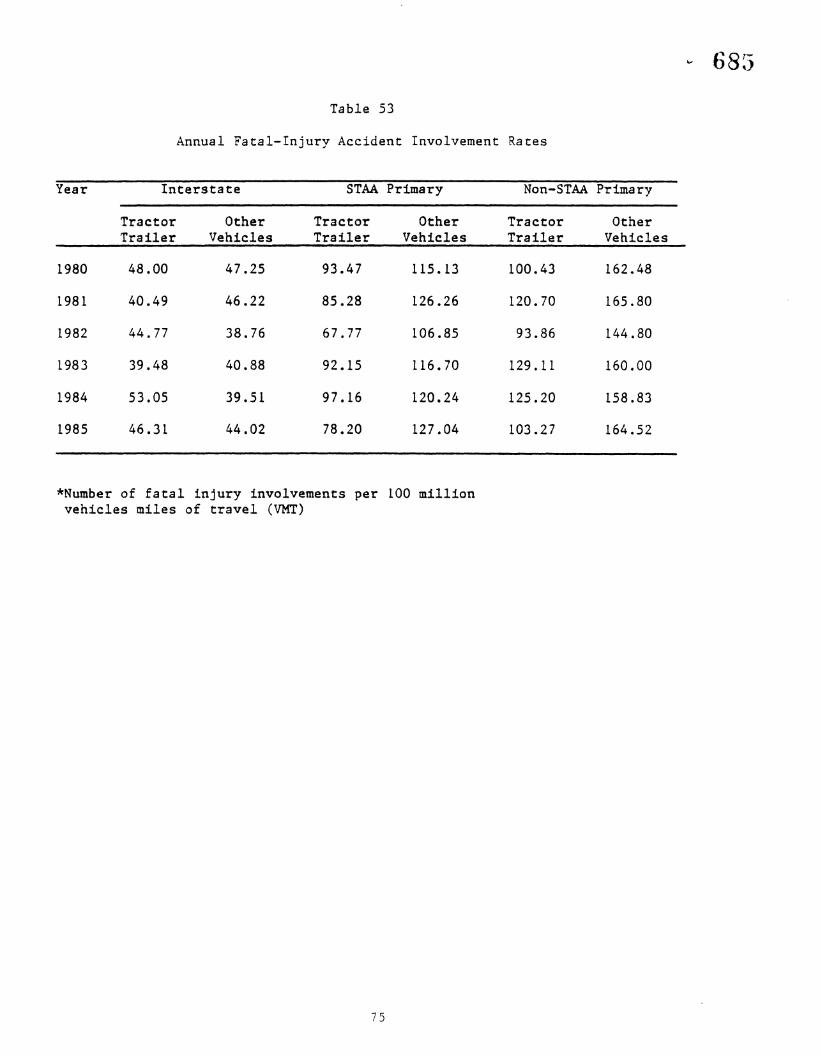
68~~)
Table 53
Annual Fatal-Injury Accident Involvement Rates
Year Interstate STAA Primary Non-STAA Primary
Tractor Other Tractor Other Tractor OtherTrailer Vehicles Trailer Vehicles Trailer Vehicles
1980 48.00 47.25 93.47 115.13 100.43 162.48
1981 40.49 46.22 85.28 126.26 120.70 165.80
1982 44.77 38.76 67.77 106.85 93.86 144.80
1983 39.48 40.88 92.15 116.70 129.11 160.00
1984 53.05 39.51 97.16 120.24 125.20 158.83
1985 46.31 44.02 78.20 127.04 103.27 164.52
*Number of fatal injury involvements per 100 millionvehicles miles of travel (VMT)
75
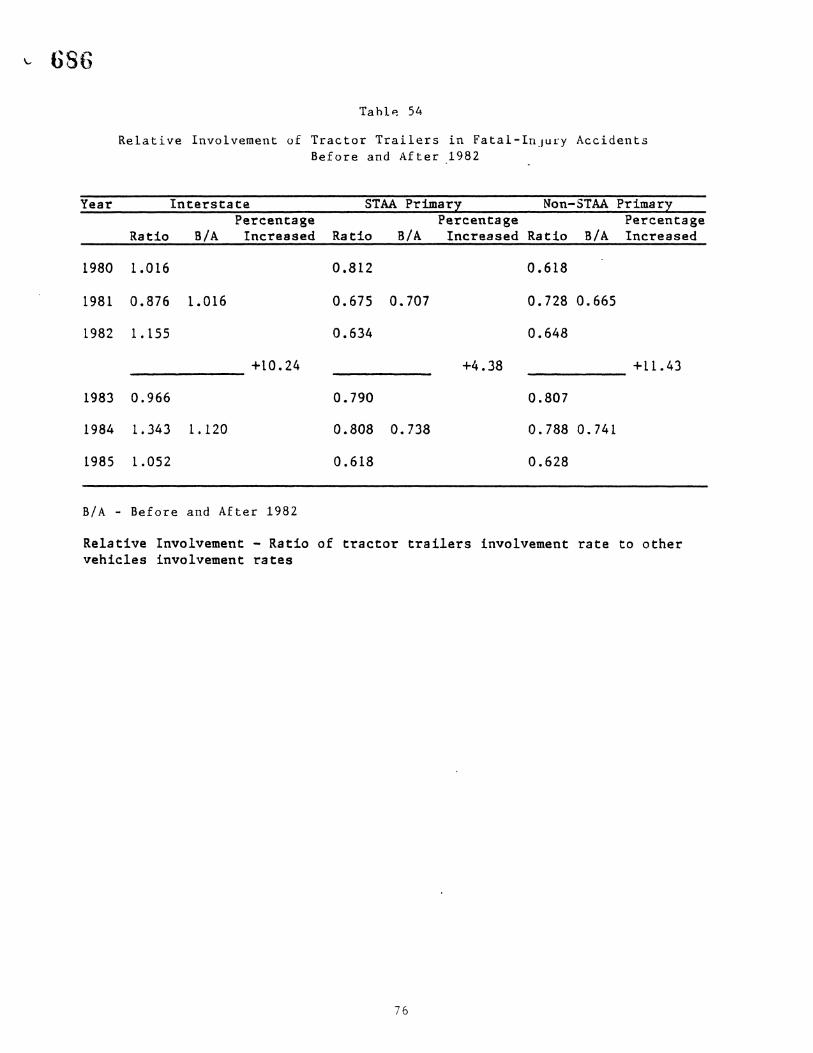
~ 686
Tahl~ 54
Relative Involvement of Tractor Trailers in Fatal-Injury AccidentsBefore and After 1982
Year InterstatePercentage
Ratio B/A Increased
1980 1.016
1981 0.876 1.016
1982 1 . 155
+10.24
1983 0.966
1984 1.343 1.120
1985 1.052
B/A - Before and After 1982
STAA Primary Non-STAA PrimaryPercentage Percentage
Ratio BfA Increased Ratio BfA Increased
0.812 0.618
0.675 0.707 0.728 0.665
0.634 0.648
+4.38 +11 .43
0.790 0.807
0.808 0.738 0.788 0.741
0.618 0.628
Relative Involvement - Ratio of tractor trailers involvement rate to othervehicles involvement rates
76