Embed Size (px)
Citation preview
Spring 2020 Data Presentation
& Session Recap Report
Saturday Science Academy II
Department of Pipeline and School Partnership Programs
Charles R. Drew University of Medicine and Science
2
Table of Contents
Spring 2020 – Physical Science, Global Health, and Biomedical Engineering 3
Registration Process 3
Platform 3
Student Demographics 3
Grade Ranges 4
Student Enrollment 4
Student Attendance 5
Science Day 2020 6
Event Goals 6
Event Objectives 6
Student and Family Demographics 7
Overall Attendance 7
Teacher Profiles 8 Kindergarten through 2nd 8 3rd through 5th 8 6th through 8th 8 9th through 12th 8
Community Engagement Workshops 8 Ju-Jitsu 8 Mindful Breathing 9 Mental Health During COVID-19 9 Moving from Adversity to Advantage 9
YouTube Analytics - Ju-Jitsu and Mindful Breathing 9
Questionnaire Responses and Reflection 10 Questionnaire Responses 10 Reflection 11
SHPEP College Science Day 2020 14
Attendees and Demographics 14
Next Generation Science Standards Alignment 16
Pre- and Post-Assessment Outcomes 17
3
Spring 2020 – Physical Science, Global Health, and Biomedical Engineering The Spring 2020 session took place online beginning in April and ending in early June 2020.
During this session, the curriculum for students in pre-kindergarten to eighth grade focused on
physical science, global health, and biomedical engineering. Students in high school focused on
medical simulations with the specifics of their session covered here in this report.
In response to the spread and growing threat of the COVID-19 pandemic in Los Angeles County,
SSA II took significant steps to “flatten the curve” and reduce the potential spread of the virus.
Following the suspension of the spring session in-person programming, SSA II staff worked
diligently to find a platform that would enable the program to continue and reduce learning loss
for new and current SSA II students. Of equal importance was providing continuity in STEMM
enrichment programming to marginalized communities of color. SSA II usually serves 100-200
PK-12th grade youth in a given session on the CDU campus in South Los Angeles; our goal was
to meet and grow these numbers on our new platform.
This report recaps the session, presents session data, and includes a reflection and goals for the
next session.
Registration Process The Department moved swiftly to provide a platform for youth to participate in an online
session. Due to the need to quickly register/enroll students, the Department had an
unconventional and expedited registration process for the session. As a result, we were unable to
capture all of the demographic information usually requested.
Platform Implementing and utilizing GoogleClassrooms granted us the ability to host live lectures and
labs, post pre-recorded lectures and labs, ask reinforcing questions, and have direct and open
communication with students and their families. The online classroom—launched with the start
of the session on Saturday, April 18—afforded SSA II the opportunity and ability to develop and
deliver to our students’ home computers the same quality education received on the CDU
campus.
Student Demographics During the Spring 2020 session, a total of 219 individual students were served. As noted above,
our nontraditional registration process resulted in us not collecting pertinent information. The
Science Day 2020 report captures demographic information for the event.
4
Grade Ranges
Student Enrollment Students who viewed/engaged with the content during the week.
0
50
100
150
200
250
18-Apr 24-Apr 30-Apr 6-May 12-May 18-May 24-May 30-May 5-Jun
18-Apr 25-Apr 2-May 9-May 16-May 23-May 30-May 6-Jun
Enrollment 63 82 114 130 142 146 217 217
Overall Enrollment
0
10
20
30
40
50
60
70
18-Apr 25-Apr 2-May 9-May 16-May 23-May 30-May 6-Jun
18-Apr 25-Apr 2-May 9-May 16-May 23-May 30-May 6-Jun
PK-2nd 24 24 28 34 35 35 43 43
3rd-5th 28 23 31 32 33 33 59 59
6th-8th 11 12 22 24 26 26 54 54
9th-12th 0 12 33 40 48 52 61 61
Enrollment by Grades
Grade Ranges No. Pct.
PK – 2nd Grade 44 20%
3rd – 5th Grade 61 28%
6th – 8th Grade 55 25%
9th – 12th Grade 59 27%
20%
28%
25%
27%
PK-2nd 3rd-5th
6th-8th 9th-12th
5
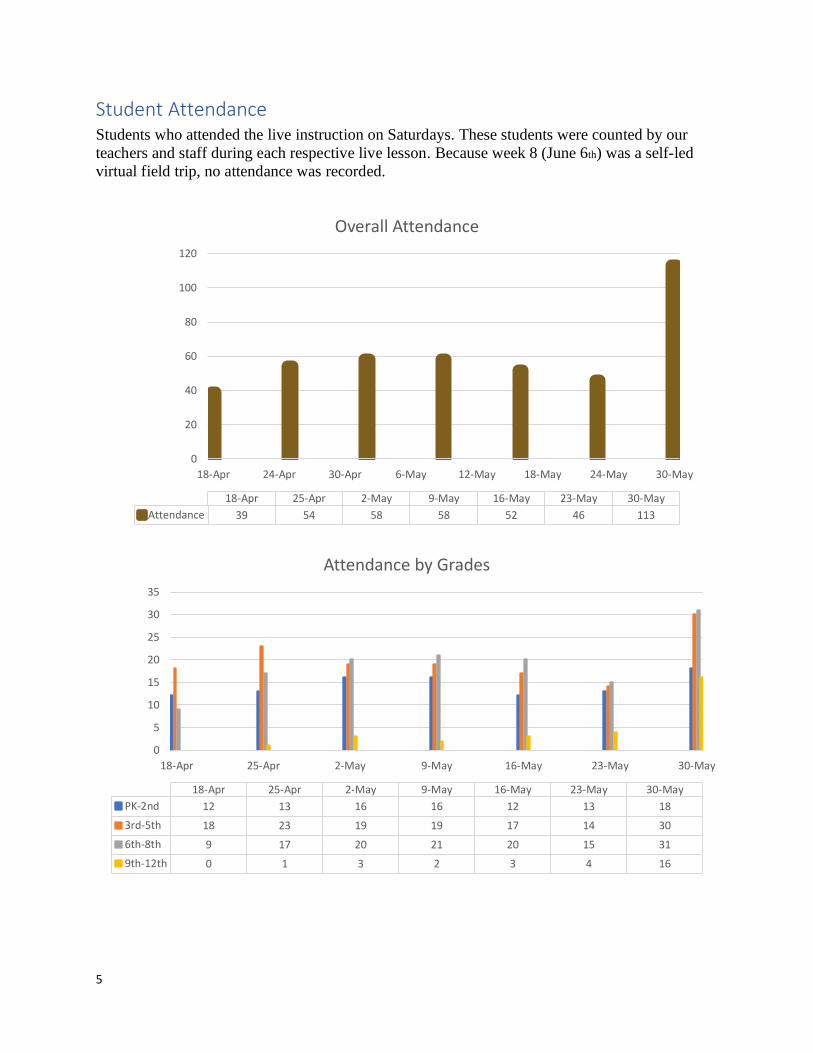
Student Attendance Students who attended the live instruction on Saturdays. These students were counted by our
teachers and staff during each respective live lesson. Because week 8 (June 6th) was a self-led
virtual field trip, no attendance was recorded.
0
20
40
60
80
100
120
18-Apr 24-Apr 30-Apr 6-May 12-May 18-May 24-May 30-May
18-Apr 25-Apr 2-May 9-May 16-May 23-May 30-May
Attendance 39 54 58 58 52 46 113
Overall Attendance
0
5
10
15
20
25
30
35
18-Apr 25-Apr 2-May 9-May 16-May 23-May 30-May
18-Apr 25-Apr 2-May 9-May 16-May 23-May 30-May
PK-2nd 12 13 16 16 12 13 18
3rd-5th 18 23 19 19 17 14 30
6th-8th 9 17 20 21 20 15 31
9th-12th 0 1 3 2 3 4 16
Attendance by Grades
6
Science Day 2020 CDU Science Day is an annual day of explorations in medicine and science for more than 250
elementary, middle and high school youth. While this event is traditionally hosted on the campus
of Charles R. Drew University, we had to make the transition to an online platform amid the
current COVID-19 pandemic. This year’s event is taking place virtually on GoogleClassroom.
With STEMM (Science, Technology, Engineering, Math and Medicine) as the foundation, CDU
Science Day features multiple age and grade-level appropriate fun learning labs. At each lab,
students engage in instructional and kinesthetic activities designed to increase their knowledge of
1) scientific principles and the fields of mental health, public health, and medicine, 2) the science
behind a variety of medical procedures and specialties and, 3) health care professions.
Event Goals
▪ Advocate for the academic achievement and excellence of underrepresented students of
color
▪ Expose students to the fields of medicine, science, health and the many educational and
professional opportunities the medical and health care professions
▪ Encourage underrepresented students of color to consider/pursue STEMM degrees.
▪ Provide information and other resources on STEMM-focused college/post-secondary
college
▪ Provide students attendees access and exposure to medical and health care students
professionals as role models
▪ Increase and effectively leverage CDU and community resources and partnerships to
underwrite 60% of the event budget
▪ Increase collaboration among CDU stakeholders in planning, outreach, implementation,
and evaluation support for Science Day
▪ Increase the number of SPA 6 youth participating in Saturday Science Academy II and
other CDU pipeline programs
▪ Conduct a culturally relevant and socially meaningful science and medicine-focused
STEMM event
▪ Significantly increase the visibility and knowledge of CDU, its history, academic,
pipeline and community programs, in the local community.
Event Objectives
▪ 50% of Science Day attendees students in grades 8-12
▪ 50% of student attendees are residents of SPA 6, collected for registered students only
▪ 20% of student attendees are residents of the Watts/Willowbrook community
▪ 75% of student attendees participate in 80% learning labs
▪ 75% of student attendees complete their Science Day Passports
▪ 100% of student attendees complete the Science Day Evaluation form/questionnaire
7
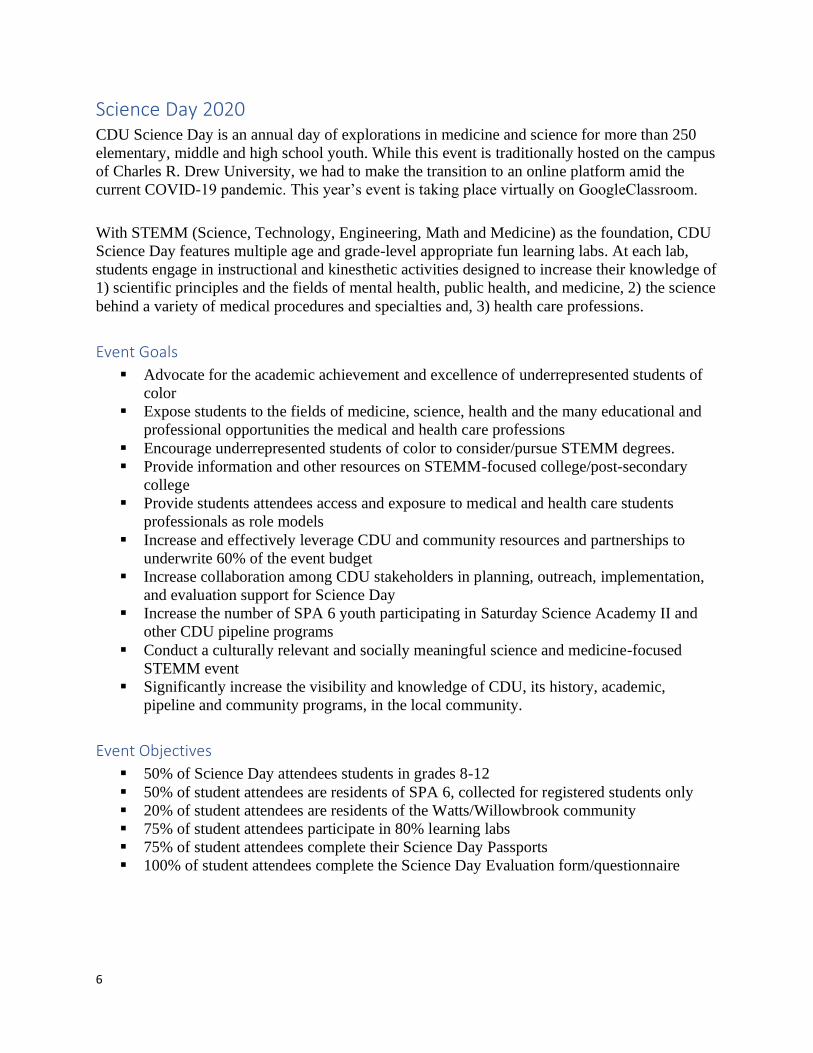
Student and Family Demographics
For Science Day 2020, 329 students and families were served. The tables and charts below break
down the overall attendance and student demographics by ethnicity, gender, zip code.
Overall Attendance
Class Registrations Total Participation
Community Workshops 19 127
STEMM classes 217 202
Science Day Grand Total 300 329
49%
33%
9%6%
3%Ethnicity
African American/Black/Caribbean/African decent
Hispanic/Latino(a)/Chicano(a)/Brown
Asian/Pacific Islander
Caucasian/White/European decent
Native American/American Indian/Indigenous
Other
29%
71%
Gender
Male Female
8
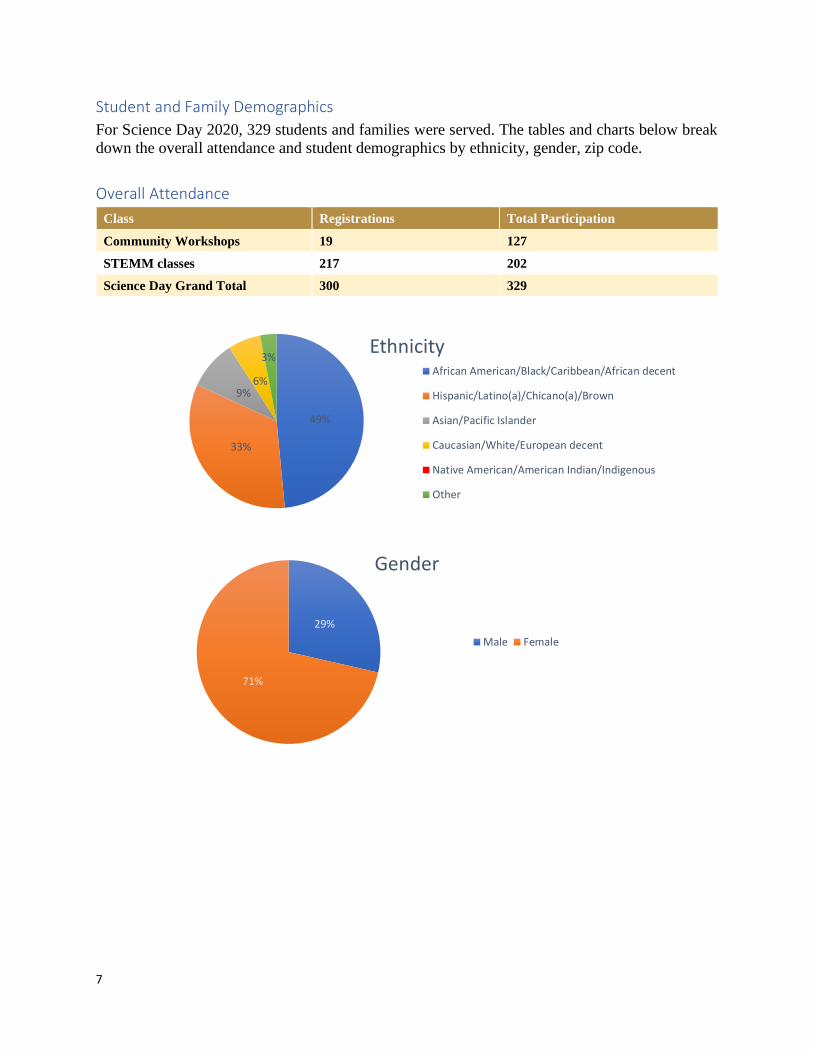
Teacher Profiles
Kindergarten through 2nd
Kyle, a UC Irvine graduate with a Bachelor’s of Science degree in the Biological Sciences and
Keonna, an SSA II alumna, LA Harbor College graduate, and CSUDH student, led the activities
on Engineering Lung Support for Cancer Patients and Neurology.
3rd through 5th
Austin, Xavier University graduate with a Bachelor’s of Science degree in Biology and Tamyra,
CSU Dominguez Hills graduate with a Bachelor’s of Arts degree in Human Services and a minor
in Health Science, led the activities Neurology Lab and Drone and Global Health.
6th through 8th
Timothy, an SSA II alum and Morehouse College graduate, obtained a Bachelor’s of Science
degree in Biology, and Kristiana, a Los Angeles Southwest College graduate with an Associate’s
Degree in Criminal Justice, led the activities Restrictive Lung Disease: Side Effects of Nicotine
Use and Brain and Nutrition.
9th through 12th
Albert, Combat Veteran and Army Medic, and Christina, USC graduate, led the activities
Prevention: Drug and Alcohol and Ultrasound. Tilo from Enrollment Management led the
session for College Advising. Chelsea, Prevention Program Director for the Avalon Carver
Community Center, and Albert co-led a session on drug and alcohol prevention.
Community Engagement Workshops
Ju-Jitsu
Gregory, founder and CEO of MobileStemLabs, led a session on Ju-Jitsu. Mr. Hill taught basic
Ju-Jitsu techniques and incorporated light-to-medium cardio.
6%
17%
18%
6%6%12%
6%
23%
6%
Zipcode
96078 90003 90008
90019 90023 90026
90043 90044 90230
9
Mindful Breathing
Jasmine led a session on Mindful Breathing. Her techniques help one consider healthier
alternatives to cope with stress by incorporating breathing.
Mental Health During COVID-19
Mishka, founder and CEO of Kimball Therapy, discussed the COVID-19 pandemic and its direct
impact on mental health in communities of color.
Moving from Adversity to Advantage
Charles, Social Work Department Chair at California Baptist University and CEO of the National
Family Life and Education Center, focused on moving from adversity to advantage. Charles helped
participants find their own worth, especially during this turbulent time of uncertainty.
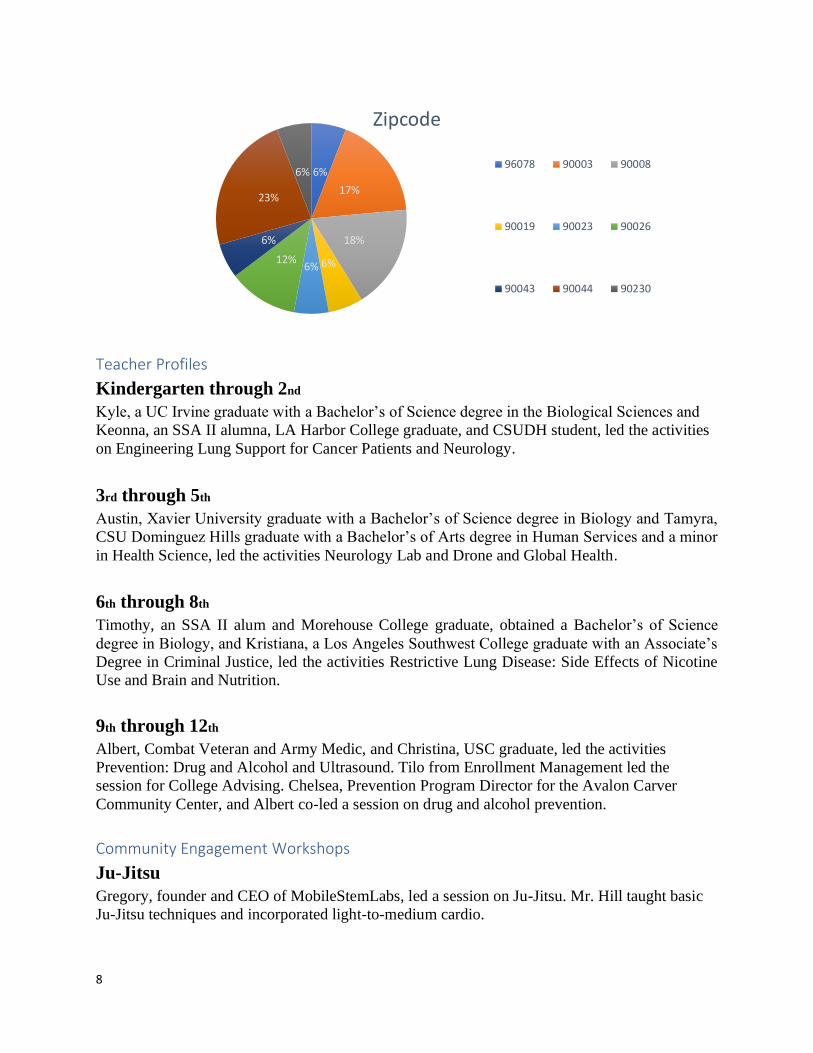
YouTube Analytics - Ju-Jitsu and Mindful Breathing
The stats below break down viewership for the community webinars. It brought to light
interesting information regarding our participants, their areas of interest, and their method for
connecting.
How viewers engaged with the live stream
Viewers by gender
How viewers accessed the video
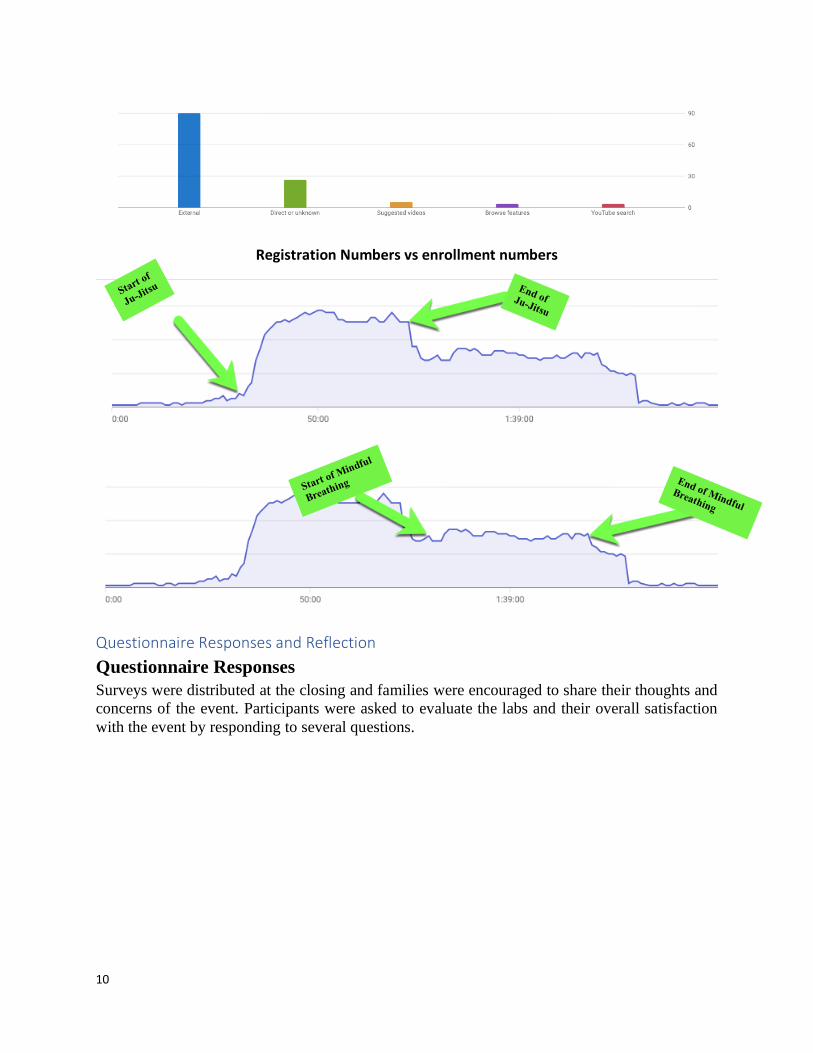
10
Registration Numbers vs enrollment numbers
Questionnaire Responses and Reflection
Questionnaire Responses
Surveys were distributed at the closing and families were encouraged to share their thoughts and
concerns of the event. Participants were asked to evaluate the labs and their overall satisfaction
with the event by responding to several questions.
11
Reflection
86%
14%
Are you more aware of mental health services and resources in your community?
Yes No
100%
Do you have a better understanding of health and wellbeing?
Yes
91%
9%
Are you more likely to tell a family member, friend, coworker, or neighbor about mental health services and resources?
Yes No
12
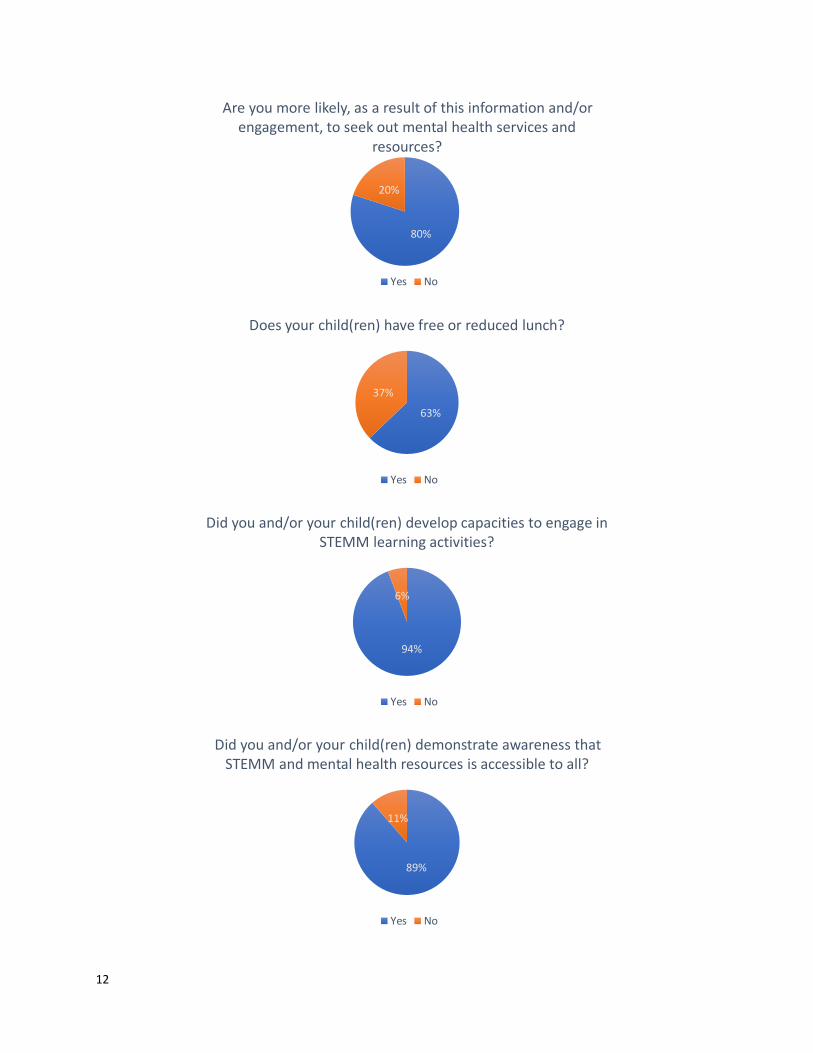
80%
20%
Are you more likely, as a result of this information and/or engagement, to seek out mental health services and
resources?
Yes No
63%
37%
Does your child(ren) have free or reduced lunch?
Yes No
94%
6%
Did you and/or your child(ren) develop capacities to engage in STEMM learning activities?
Yes No
89%
11%
Did you and/or your child(ren) demonstrate awareness that STEMM and mental health resources is accessible to all?
Yes No
13
91%
9%
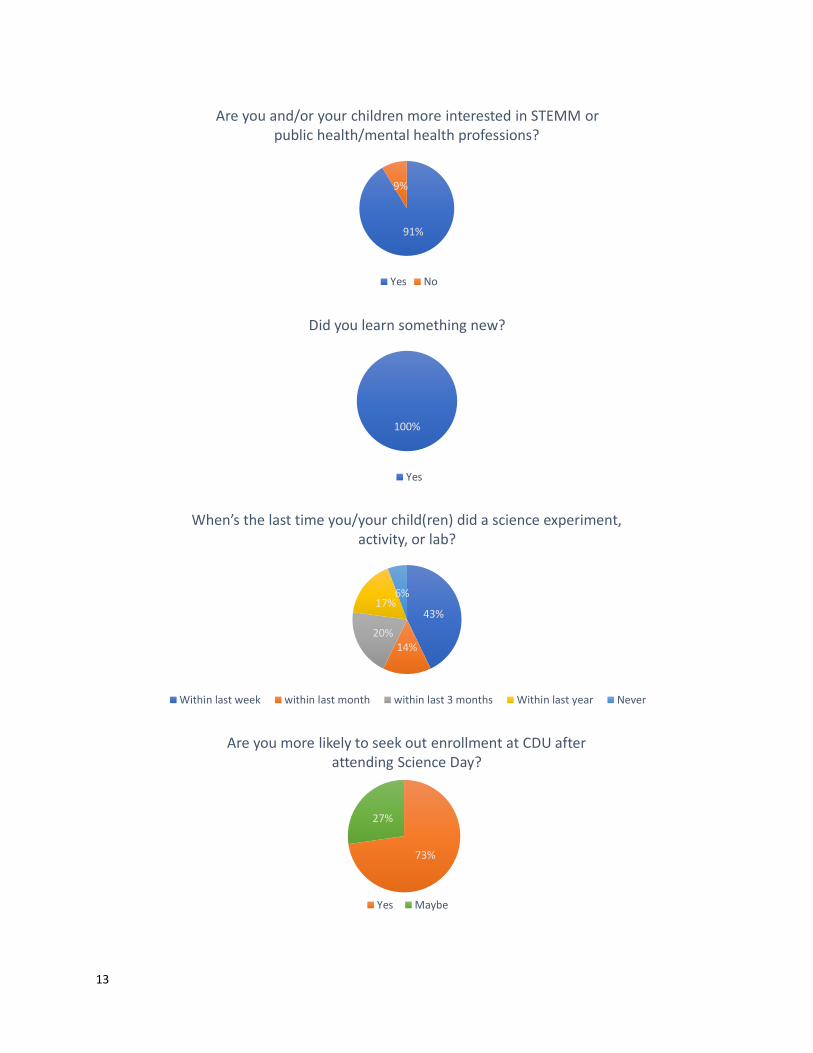
Are you and/or your children more interested in STEMM or public health/mental health professions?
Yes No
100%
Did you learn something new?
Yes
43%
14%20%
17%6%
When’s the last time you/your child(ren) did a science experiment, activity, or lab?
Within last week within last month within last 3 months Within last year Never
73%
27%
Are you more likely to seek out enrollment at CDU after attending Science Day?
Yes Maybe
14
SHPEP College Science Day 2020 Summer Health Professions Education Program (SHPEP) College Science Day is an annual day
of explorations in medicine and science for undergraduate students from universities across the
nation. This is a collaboration between the Charles R. Drew University and UCLA. With
STEMM (Science, Technology, Engineering, Math and Medicine) as the foundation, SHPEP
College Science Day features multiple age and grade-level appropriate, fun learning stations and
mental health workshops. At each station, students engage in instructional and kinesthetic
activities designed to increase their knowledge of 1) scientific principles, and the field of health
and medicine, 2) the science behind a variety of medical procedures and specialties and, 3)
health care professions. Each learning station has defined student learning outcomes; students
document the learning concepts and theories.
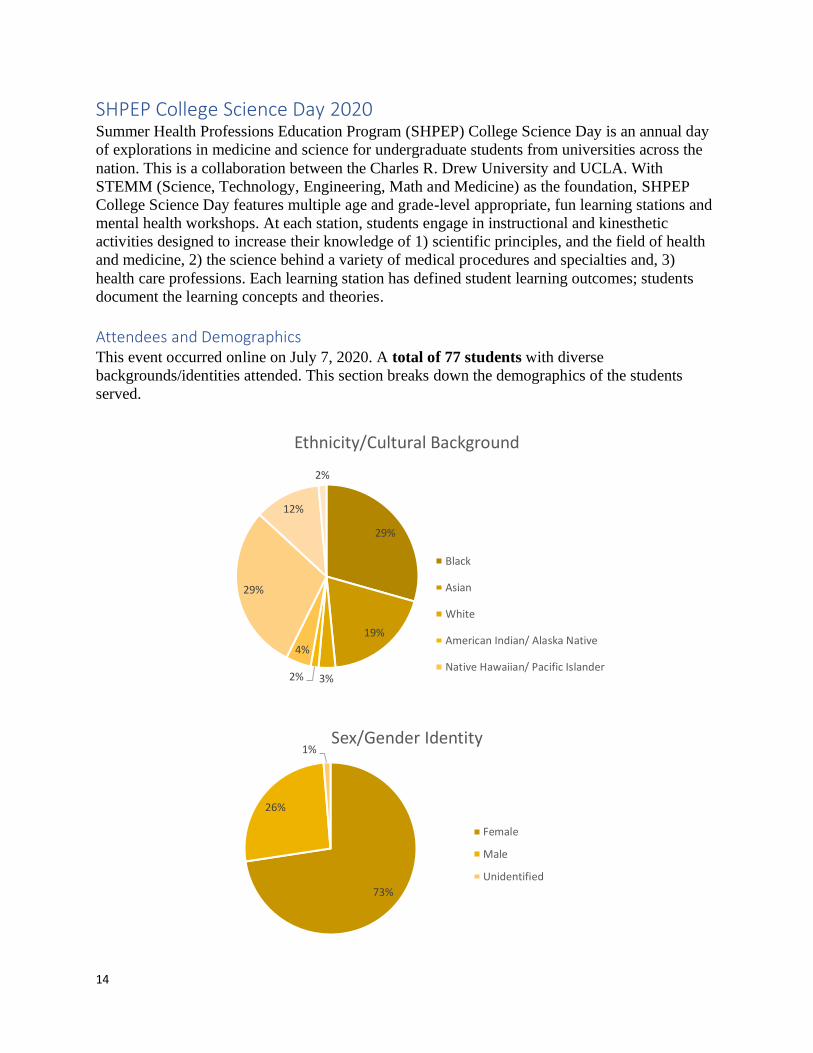
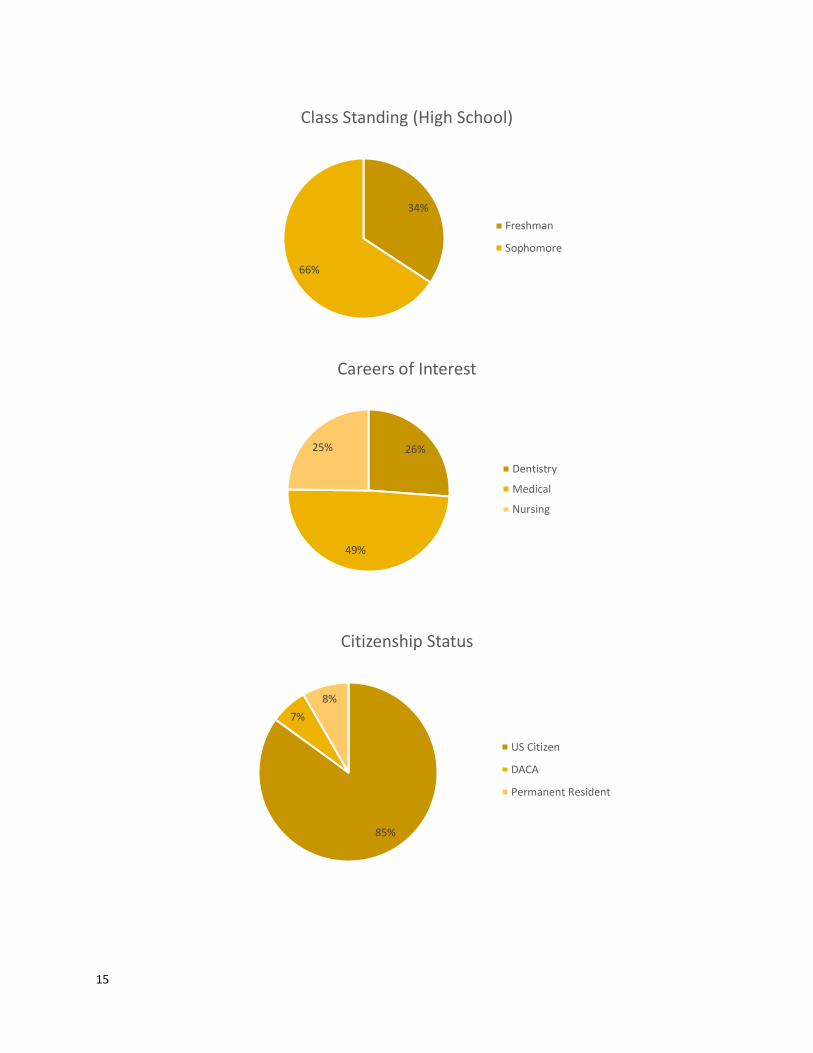
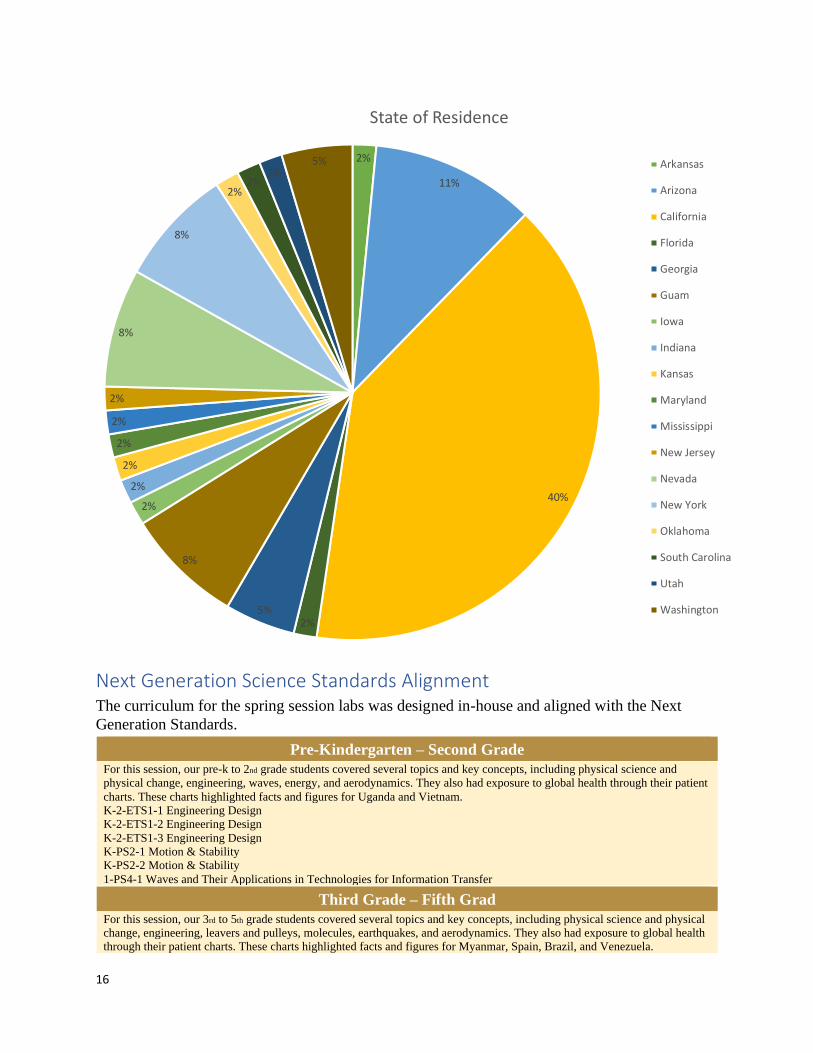
Attendees and Demographics This event occurred online on July 7, 2020. A total of 77 students with diverse
backgrounds/identities attended. This section breaks down the demographics of the students
served.
29%
19%
3%2%
4%
29%
12%
2%
Ethnicity/Cultural Background
Black
Asian
White
American Indian/ Alaska Native
Native Hawaiian/ Pacific Islander
73%
26%
1%Sex/Gender Identity
Female
Male
Unidentified
15
34%
66%
Class Standing (High School)
Freshman
Sophomore
26%
49%
25%
Careers of Interest
Dentistry
Medical
Nursing
85%
7%
8%
Citizenship Status
US Citizen
DACA
Permanent Resident
16
Next Generation Science Standards Alignment The curriculum for the spring session labs was designed in-house and aligned with the Next
Generation Standards.
Pre-Kindergarten – Second Grade
For this session, our pre-k to 2nd grade students covered several topics and key concepts, including physical science and
physical change, engineering, waves, energy, and aerodynamics. They also had exposure to global health through their patient
charts. These charts highlighted facts and figures for Uganda and Vietnam.
K-2-ETS1-1 Engineering Design
K-2-ETS1-2 Engineering Design
K-2-ETS1-3 Engineering Design
K-PS2-1 Motion & Stability
K-PS2-2 Motion & Stability
1-PS4-1 Waves and Their Applications in Technologies for Information Transfer
Third Grade – Fifth Grad
For this session, our 3rd to 5th grade students covered several topics and key concepts, including physical science and physical
change, engineering, leavers and pulleys, molecules, earthquakes, and aerodynamics. They also had exposure to global health
through their patient charts. These charts highlighted facts and figures for Myanmar, Spain, Brazil, and Venezuela.
2%
11%
40%
2%5%
8%
2%
2%
2%
2%
2%
2%
8%
8%
2%2%
2%5%
State of Residence
Arkansas
Arizona
California
Florida
Georgia
Guam
Iowa
Indiana
Kansas
Maryland
Mississippi
New Jersey
Nevada
New York
Oklahoma
South Carolina
Utah
Washington
17
3-5-ETS1-1 Engineering Design
3-5-ETS1-2 Engineering Design
3-5-ETS1-3 Engineering Design
3-5-PS1-4 Matter and Its Interactions
3-PS2-2 Motion & Stability
4-PS3-1 Energy
5-PS1-1 Matter and Its Interactions
5-PS1-3 Matter and Its Interactions
Sixth Grade – Eighth Grade
For this session, our 6th to 8th grade students covered several topics and key concepts, including physical science and physical
change, engineering, leavers and pulleys, molecules, atoms, and aerodynamics. They also had exposure to global health
through their patient charts. These charts highlighted facts and figures for Thailand, Spain, and Ukraine.
3-5-PS1-4 Matter and Its Interactions
MS-ETS1-1 Engineering Design
MS-PS1-2 Matter and Its Interactions
MS-PS2-2 Motion and Stability
High School
Medical Simulations curriculum crafted in-house. Youth actively engaged with their teacher and saw him perform these
simulations from their screens. They also had the opportunity to put into practice what they learned with items found at home.
Topics covered include: vital signs; sutures; IV; airways; wound care; and ultrasounds.
Pre- and Post-Assessment Outcomes 94% of the students improved on their post-assessment. This is on track with our goal that at
least 90% of our student population improves their subject content knowledge. Students scored
an average of 60% on their pre-assessment which is a “D-.” They improved to 80% which is a
“B-.” That in itself shows that students improve their subject content knowledge on average by
33%, meaning they are 33% more knowledgeable than when they started the session. Please
note, this considers data pulled for students who have completed both the pre-assessment and the
post-assessment.
Improvement Numbers
Pre-Kinder – 2nd Grade: 11 out of 11 students improved
3rd Grade – 5th Grade: 8 out of 8 students improved
6th – 8th Grade: 12 out of 13 students improved; 1 remained the same
High School: 2 out of 3 students improved; 1 remained the same
Total Assessment Percentages
Spring 2020 PK-2 3-5 6-8 9-12 Total
Total Pre Assessment+ 64.27% 55.10% 67.26% 55.17% 60.45%
Total Post Assessment+: 88.45% 87.73% 82.30% 62.67% 80.29% +Data pulled for all students who completed either the pre-assessment, the post-assessment, or both