Embed Size (px)
Citation preview

Socio-economic inequality in the prevalence ofviolence against older adults – Findings from IndiaDebashree Sinha
International Institute for Population SciencesPrem Shankar Mishra
Institute for Social and Economic ChangeShobhit Srivastava
International Institute for Population SciencesPradeep Kumar ( [email protected] )
International Institute for Population Sciences https://orcid.org/0000-0003-4259-820X
Research article
Keywords: Violence, Older adults, Inequality, India
Posted Date: October 26th, 2020
DOI: https://doi.org/10.21203/rs.3.rs-72248/v1
License: This work is licensed under a Creative Commons Attribution 4.0 International License. Read Full License
Version of Record: A version of this preprint was published at BMC Geriatrics on May 20th, 2021. See thepublished version at https://doi.org/10.1186/s12877-021-02234-6.

Page | 1
Title: Socio-economic inequality in the prevalence of violence against older adults –
Findings from India
1. Debashree Sinha, M.Phil.
Affiliation: PhD Research Scholar, Department of Development Studies, International
Institute for Population Sciences, Mumbai, Maharashtra, India-400088
Email: [email protected]
2. Prem Shankar Mishra, M.Phil.
Affiliation: PhD Research Scholar, Population Research Centre, Institute for Social and
Economic Change, Bengaluru- 560072, Karnataka, India.
Email: [email protected]
ORCID: 0000-0003-0601-7025
3. Shobhit Srivastava, M.Phil.
Affiliation: PhD Research Scholar, Department of Mathematical Demography & Statistics,
International Institute for Population Sciences, Mumbai, Maharashtra, India-400088.
Email: [email protected]
ORCID: 0000-0002-7138-4916
4. Pradeep Kumar, M.Phil. (Corresponding)
Affiliation: PhD Research Scholar, Department of Mathematical Demography & Statistics,
International Institute for Population Sciences, Mumbai, Maharashtra, India-400088.
Email: [email protected]
ORCID: 0000-0003-4259-820x

Page | 2
Socio-economic inequality in the prevalence of violence against older adults – Findings
from India
Abstract
Background: Violence against older adults is a well-recognised socio-psychological and
public health problem worldwide. It is uncared-for, undiagnosed, and untreated problem that
is widespread across both developed and developing countries. Therefore, this paper aims to
understand the extent of socio-economic status related inequality in violence against older
adults.
Methods: Data for this study came from Building a Knowledge Base on Population Aging in
India (BKPAI). Violence against older adults was the outcome variable for this study and
defined as older adults who faced any abuse or violence or neglect or disrespect by any
person. Bivariate analysis and regression-based decomposition technique is used to
understand the relative contribution of various socioeconomic factors to violence among
(N=9541) older adults.
Results: The most dominant form of violence is verbal (10%) followed by disrespect (5.8%)
and economic violence (5.2%). Older adults aged 80+ years [OR: 1.49; CI: 1.14-1.93] and
working [OR: 1.26; CI: 1.02-1.56] had higher likelihood to suffer from violence than their
counterparts. On the other hand older adults who were currently in union [OR: 0.79; CI: 0.65-
0.95], living with children [OR: 0.53; CI: 0.40-0.72] and belonging to richer wealth quintile
[OR: 0.35; CI: 0.24-0.51] had lower likelihood to suffer from violence than their
counterparts. The decomposition results revealed that poor older adults are more prone to
violence (Concentration index: -0.20). Household’s wealth status was responsible for 93.7%
of the SES-related inequality whereas living arrangement of older adults explained 13.7%
SES-related inequality. Education and working status of older adults made a substantial
contribution to the inequalities in reported violence, explaining 3.7% and 3.3% of the total
inequality, respectively.

Page | 3
Conclusion: With no or meagre income of their own, older adults belonging to the poorest
wealth quintile have little or no bargaining power to secure a violent free environment for
themselves. Therefore, special attention in terms of social and economic support should be
given to the economically vulnerable older population.
Keywords: Violence, Older adults, Inequality, India
Page | 4
Background
Violence against older adults is a larger socio-psychological and public health problem
worldwide. It is a largely undiagnosed, uncared-for, and untreated problem that is widespread
across both developed and developing countries [1]–[4]. It is reported that around one in six
people aged 60 years and above experienced some forms of abuse or violence in the
community or household level settings [5]. This has eventually led to older adults experience
devastating consequences like serious injuries, health, and long-term socio-economic and
psychological problems [6]–[10]. However, the growing unprecedented abuse and violence
against older adults is one of the most serious socio-psycho-health problems in many low and
middle-income countries [11]. The lack of appropriate approach, neglect and under report of
older adult violence in these settings make it more challenging. Besides, these countries are
also witnessing a rapid growth in aging population. For example, according to the 2011
census currently, India contributes 8.6 percent of the aged population, and further, it is
expected to increase to 20 percent in 2050 [6]. Globally, an estimation showed that people
aged 60 years and above comprise 900 million in 2015 and it is about to increase of 2 billion
in 2050 [12]. The increase in aged population in every corner of the world has created several
social and health problems, and violence against older adults is one of them.
The World Health Organization defines elder abuse as “a single or repeated act or lack of
appropriate action, occurring within any relationship where there is an expectation of trust
which causes harm or distress to an older person” [5]. Older adults are abused by their family
members, spouses, friends, community members, and also by healthcare providers. There are
multiple forms of violence and abuses that have been reported. These include physical,
sexual, psychological, and emotional abuse; financial and material abuse; abandonment;
neglect; and serious loss of dignity and respect [5], [13], [14]. And, it is highly associated
with decreased older adults’ quality of life and increased morbidity and mortality rates [9],

Page | 5
[13], [15]–[17]. Further, Abusing the older is linked to disability and functional limitation
[15]. Some determinants influence the greater risk of older adults’ violence such as the older
person having low education, belong to low-income groups, and poor social status [6], [8],
[18]. Although there are other facets of certain risk factors that create such an environment
against older adults in physical violence and verbal abuse, however, it has not been
extensively understood in the Indian scenario.
Though most of the studies found that a high incidence violence against older adults exists in
low socio-economic strata of the society, however, it has not been frequently reported in
many communities and therefore is highly underreported [6], [8], [18], [19]. The low
coverage of such reporting is caused by several reasons such as inaccessible institutional
supports and a lack of information, education, and communication [8], [18]. For
understanding this, a systematic review presented and identified the major causes like the
older adult faces nearly 11.6% psychological abuse, 6.8% financial abuse, 4.2 neglect, 2.6%
physical violence, and 0.9 percent sexual abuse [11]. Similarly, a study found in India shows
that nearly 11% of older adults have experienced some form of violence after turning the age
of 60 [8]. However, it significantly varies across gender and income groups. Increasing the
trends and patterns of older adults’ violence in India that is more consistently linked to their
health and socio-psychological well-being [6], [7], [20], [21]. However, very few studies
have tried to understand the multiple determinants which influence the prevalence of violence
among older adults in India and its regions.
Poor healthcare, mistreatment, neglect, and financial abuse are the more common practices
against older adults that are usually penetrated by family members in Indian society [19]–
[21]. Nonetheless, there are many theories such as social exchange theory, feminist theory,
political-economic theory, psychopathology of the caregiver theory, role accumulation
theory, situational theory, social learning theory, stratification theory, and symbolic

Page | 6
interactionism theory that provide plausible causes of older adults abuse and violence [22].
Further, these theories also explain the pros and cons of abuse among older adults and
violence caused by family members, relatives, spouses, friends, or community members [22].
This evolves a range of physical, emotional, sexual, and financial causes.
Although there may be multiple forms of older adult abuse and violence like intentional or
unintentional, negligence, and abandonment, but in the Indian context, negligence,
abandonment, and financial abuses are more common [21], [23], [24]. However, still, these
types of abuse and violence are underreported in most cases [19]. For that, the associated risk
factors are comprised of physical disability, poor physical and mental health, and also from
poor socio-economic conditions of the individuals [6], [18], [25]. The unprecedented growing
social and public health issues like older adults’ violence create disastrous for social values
and health vulnerability [13], [17], [19]. In the context of India, there is a paucity of literature
on older adults who experience violence in various socio-economic settings. India is an
orthodox and patriarchal society where older adults have been taken care of by their sons and
daughters-in-law. In India, there is low coverage of social security for older adults that tends
to increase the high burden on their families who support them [8]. In due course, this leads
to a higher chance of older adult violence in India.
Based on the above pieces of evidences, this paper aims to understand the extent of socio-
economic status related inequality in violence against older adults in Indian society. The
effort is made to identify the most vulnerable population sub-group who suffers from
different types of violence in multi-setting cultures. The present paper hypothesized that there
was no socio-economic status related inequality in violence among older adults in India.
Methods
Data

Page | 7
The present research used data from Building a Knowledge Base on Population Aging in
India (BKPAI) which was a national level survey and was conducted in 2011, across seven
states of India. The survey was sponsored by Institute for social and economic change
(ISEC), Tata Institute for social sciences (TISS), Institute for economic growth (IEG) and
UNFPA, New Delhi. The survey gathered information on various socio-economic and health
aspects of ageing among households of those aged 60 years and above. Seven major
regionally representative states were selected for the survey with the highest 60+ year’s
population than the national average. This survey was carried out on a representative sample
in the northern, western, eastern, and southern part of India following a random sampling
process.
The primary sampling unit (PSU) were villages for rural areas, and urban wards in urban
areas. The sample of 1280 elderly households were fixed for each state. Further details on the
sampling procedure, sample size is available in national and state reports of BKPAI, 2011
[23]. For the current study the effective sample size was of 9541 older adults residing in
seven states aged 60+ years were selected.
Outcome variables
The outcome variable was binary in nature. The question was asked to older adult that “Ever
since you completed 60 years of age, have you faced any abuse or violence or neglect or
disrespect by any person?” The response was coded as 0 “No” and 1 “Yes”.
Predictor variables
The predictors included age (60-69, 70-79 and 80+), gender (men and women), education
(none, below five years, 6-10 years and 11+ years), marital status (not in union and currently
in union), living arrangement (alone, with spouse, with children and others), working status
(no, yes), contribute money to household expenditure (no income, yes and no), wealth

Page | 8
(poorest, poorer, middle, richer and richest), religion (Hindu, Muslim, Sikh and others), caste
(scheduled caste (SC), scheduled tribe (ST), other backward class, and others), place of
residence (rural and urban) and states (Himachal Pradesh, Punjab, West Bengal, Odisha,
Maharashtra, Kerala and Tamil Nadu).
Statistical analysis
Descriptive statistics and bivariate analysis were used to find the preliminary results. Further,
multivariate analysis (binary logistic) has been done to fulfil the objective of the study. The
results were presented in the form of odds ratio (OR) with a 95% confidence interval (CI).
The model is usually put into a more compact form as follows:
ln ( 𝑃𝑖1 − 𝑃𝑖) = 𝛽0 + 𝛽1𝑥1 + ⋯ + 𝛽𝑀𝑥𝑚−1, Where 𝛽0, … . . , 𝛽𝑀 are regression coefficient indicating the relative effect of a particular
explanatory variable on the outcome. These coefficients change as per the context in the
analysis in the study.
Moreover, wealth quintile was the key variable to measure the economic status of the
household. A household wealth index was calculated in the survey by combining household
amenities, assets and durables and characterizing households in a range varying from the
poorest to the richest, corresponding to wealth quintiles ranging from the lowest to the
highest.
The study used wealth score (continuous variable) for decomposition analysis and for the
calculation of Concentration Index (CI), the study used wealth quintile which has divided into
five equal size of the population.
Concentration index

Page | 9
Concentration index represents the magnitude of inequality by measuring the area between
the concentration curve and line of equality, and calculated as twice the weighted covariance
between the outcome and fractional rank in the wealth distribution divided by variable mean.
The concentration index can be written as follows:
𝑪 = 𝟐𝝁 𝒄𝒐𝒗(𝒚𝒊,𝑹𝒊)
Where, C is the concentration index; 𝑦𝑖 is the outcome variable index; R is the fractional rank
of individual i in the distribution of socio-economic position; 𝝁is the mean of the outcome
variable of the sample and 𝒄𝒐𝒗 denotes the covariance [26]. The index value lies between -1
to +1.
Further, study decompose the concentration index to understand the relative contribution of
various socioeconomic factors to the violence among older adults. To do this, study used
regression based decomposition technique, which was proposed by Wagstaff et al. [27].
Results:
Figure 1 displays the type of violence faced by older adults in India. The highest percentage
of older adults reported verbal violence (10%) followed by disrespect (5.8%), economic
violence (5.2%) and neglect (5.1%).
[Figure 1 about to here]
Socio-demographic profile of older adults was presented in Table 1. About three-fifth of
older adults belonged to 60-69 years age group and nearly half of them women. Only six
percent of older adults had more than 11 years of education and same proportion of older
adults were living alone. Around one-fourth of older adults working and half of the older

Page | 10
adults contributed money for household expenditure. Majority of older adults were Hindu and
lived in rural areas.
[Table 1 about to here]
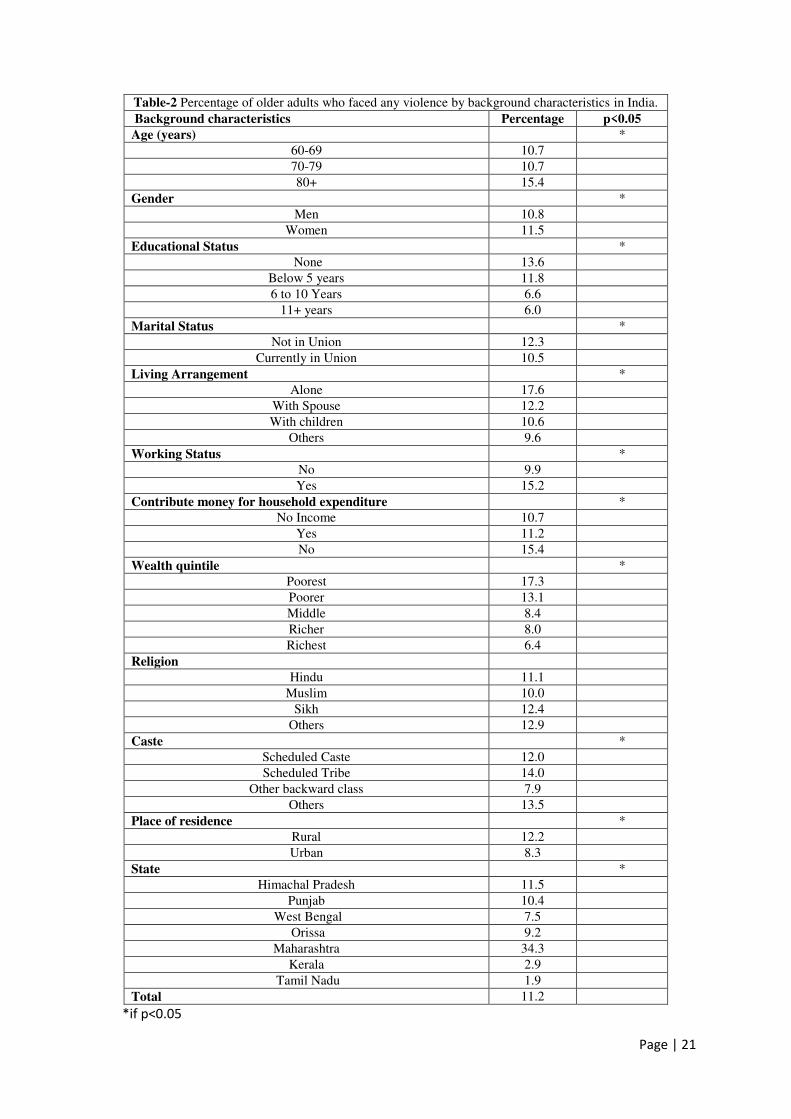
Percentage of older adults who faced any violence by background characteristics were
presented in Table 2. Older adults with 80+ years of age (15.4%), women (11.5%) and those
who had no education (13.6%) reported more violence compared to their counterparts. Older
adults with higher education and currently in union faced less violence in the household.
Older adults lived alone (17.6%) and working (15.2%) reported more violence than those
who were lived with others and not working respectively. Older adults those who did not
contribute money for household expenditure (15.4%) faced more violence compared to the
rest of the categories. There was a negative association between wealth quintile and reporting
of violence by older adults. A higher proportion of older adults belonged to scheduled tribe
and lived in rural areas reported more violence than other caste categories and those lived in
urban areas. The highest percentage of violence was reported in Maharashtra (34.3%)
followed by Himachal Pradesh (11.5%).
[Table 2 about to here]
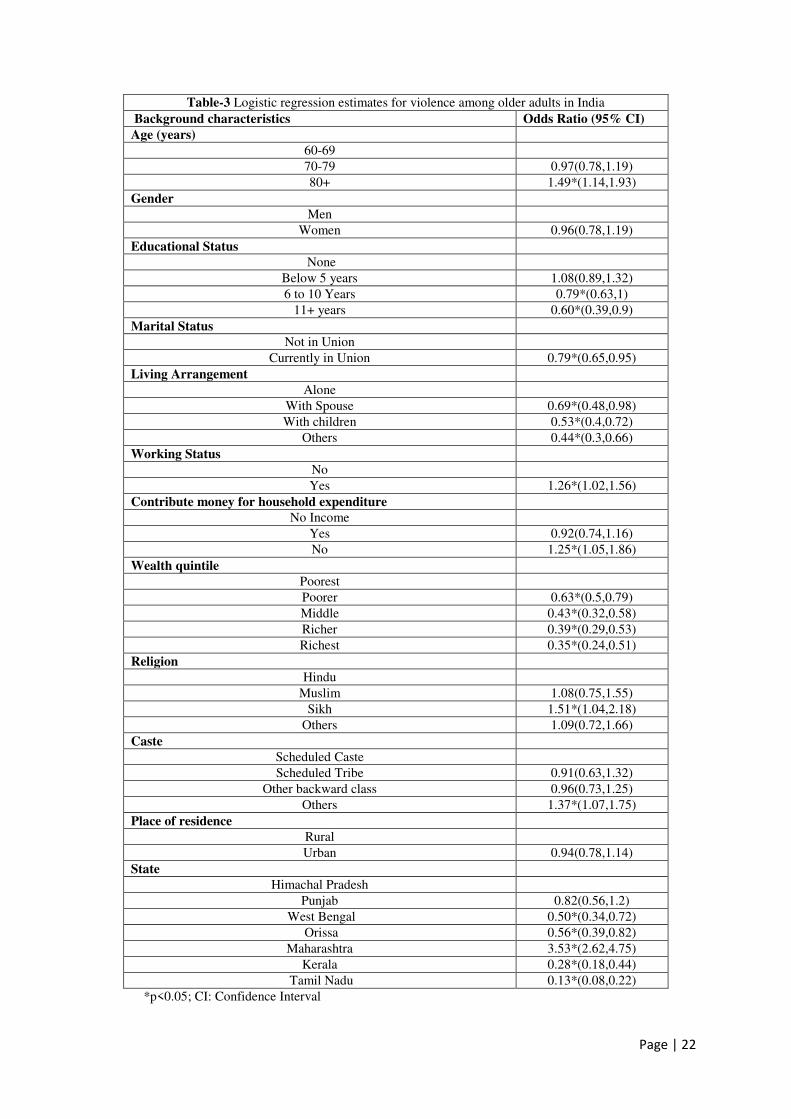
Results from logistic regression estimates for violence among older adults were presented in
Table 3. The likelihood of violence was significantly higher among older adults with age 80+
years (OR, 1.49; CI: 1.14-1.93) compared to 60-69 years age group. Moreover, older adults
currently in union (OR, 0.79; CI: 0.65-0.95) were less likely to faced violence than those who
were not in union. Older adults those who were working (OR, 1.26; CI: 1.02-1.56) reported
significantly higher odds of violence compared to those who were not working. The
likelihood of violence was higher among older adults those who did not contribute money for
household expenditure (OR, 1.25; CI: 1.05-1.86) than reference category. The odds of
Page | 11
violence was higher in Maharashtra (OR, 3.43 CI: 2.62-4.75) however it was lower in West
Bengal (OR, 0.50; CI: 0.34-0.72), Orissa (OR, 0.56; CI: 0.39-0.82), Kerala (OR, 0.28; CI:
0.18-0.44) and Tamil Nadu (OR, 0.13; CI: 0.08-0.22) compared to Himachal Pradesh.
[Table 3 about to here]
Estimates of decomposition analysis for the contribution of various explanatory variables to
violence among older adults were presented in Table 4. The positive scores of concentration
index denotes that violence among older adults concentrated among rich older adults for that
particular predictor and vice-versa. Older adults aged 70-79 years, women, living with
spouse, working, those contributed money for household expenditure, belonged poorer
wealth quintile, and to SC/ST categories and lived in urban areas concentrated more among
disadvantaged population in terms of reported violence. On the other hand, having secondary
or higher education, currently in union, living with children, and belonged to Muslim or Sikh
religion inclined to concentrate among better off. Household’s wealth status, living
arrangement, education, and working status of older adults were the major contributors to the
inequalities. Household’s wealth status was responsible for 93.7% of the SES-related
inequality whereas living arrangement of older adults explained 13.7% SES-related
inequality. Education and working status of older adults made a substantial contribution to
the inequalities in reported violence, explaining 3.7% and 3.3% of the total inequality,
respectively.
[Table 4 about to here]
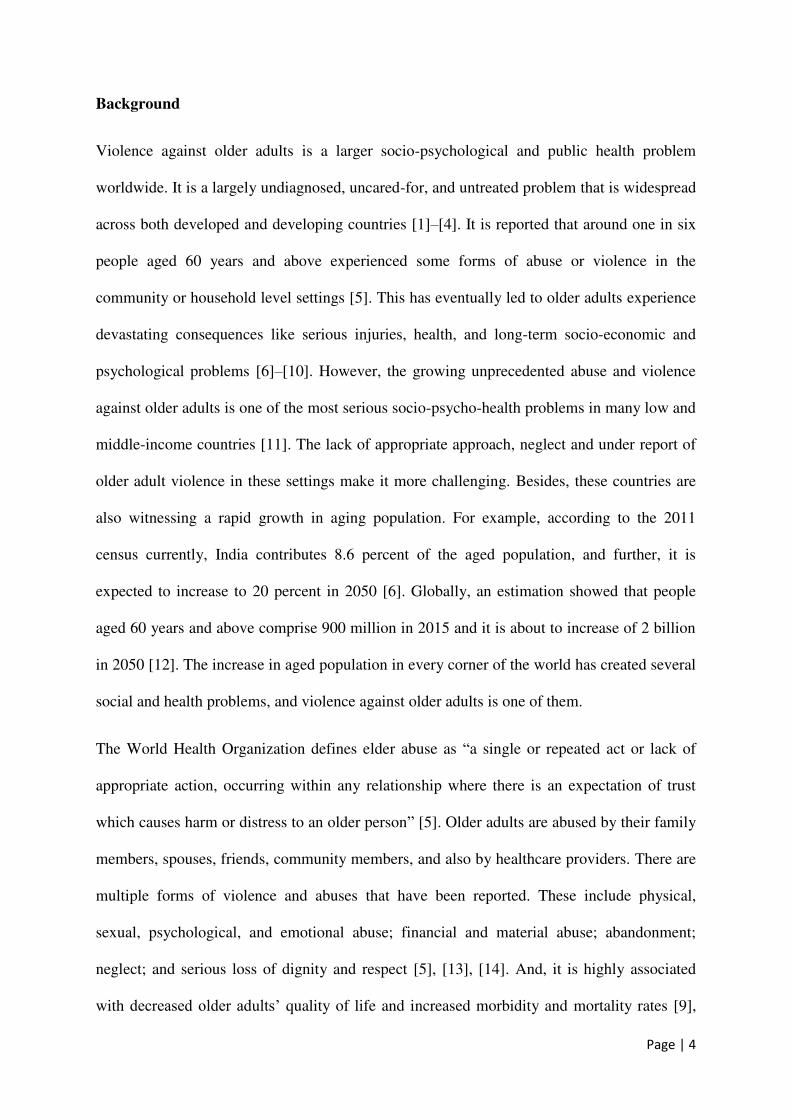
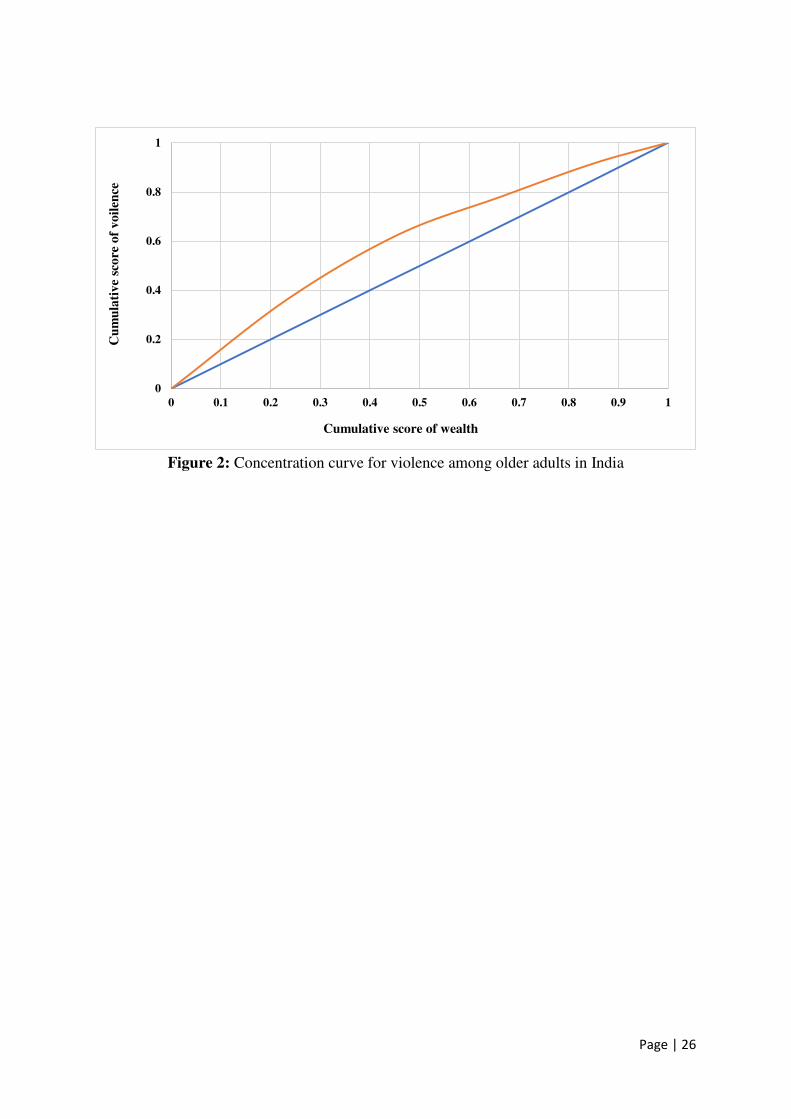
Figure 2 depicts the concentration curve for violence reported by older adults in India. Since
the concentration curve lies above the line of equality it implies that violence among older
adults is concentrated towards the poor. If the curve is formed below the line of equality than
the inequality is concentrated towards rich and vice-versa. Moreover, more the area between

Page | 12
line of equality and curve higher the inequality. India was having inequality of -0.20 which
depicts that violence was concentrated more among poor older adults.
[Figure 2 about to here]
Discussion
Using the BKPAI data of 2011, we tried to understand the socio-economic inequality for
violence among 9541 older adults residing in the Indian states of Himachal Pradesh, Punjab,
West Bengal, Odisha, Maharashtra, Kerala and Tamil Nadu. The key highlights of the present
paper are as follows: First, of all the forms of violence faced by the older adults, the highest
was verbal violence followed by disrespect, economic violence, and neglect. Second, while
the positive significant determinants of experiencing violence among the older adults are age
and work status, the negative significant determinants are educational and marital status,
living arrangement, and wealth quintile. Third, there exist clear evidence of socio-economic
inequality in experiencing violence and household’s wealth status contributed the maximum;
consequently older adults belonging to the poorer sections of the society are more susceptible
to violence.
One-eighth of the world’s population of older adult lives in India. With falling income and
health, breaking of the joint family and change in social attitudes, the older adults are the
most vulnerable sub-population of the country. Coupled with this, abuse among older adult’s
is becoming more and more prevalent in India [18], [28], [29]. Our finding on the highest
percentage of verbal abuse experienced by the older adults is consistent with past studies
[30]–[32]. Ruelas-González et al., 2016 by using the Mexican data of National Health and
Nutrition Survey 2012, that included a sample of 8,894 individuals who were 60 years or
older found that verbal aggressions was the most prevalent. Existing literature explains
different pathways that causes verbal abuse faced by the older adults. According to Summers

Page | 13
& Hoffman, (2006), the most common abuse among the older adults is verbal abuse which is
not visible but has a huge repercussion on the older adults. They explain that a conversation
taking place in the presence of an older adult does not imply that the message is
comprehended or understood by the older adult since the most obvious barrier to
communication is hearing impairment or hearing loss which is quite common among the
older adults. Further, Lai, 2011 emphasizes that yelling, scolding, treating impolitely, and
threatening verbally is a way of showing disrespect in interpersonal interactions.
Our finding that the likelihood of experiencing violence increases with age contradicts with
studies [31], [32], [34]. However, excerpts from focus group discussion on reasons of abuse
among older adults due to age revealed that since the older adults are not young and do not
belong to vibrant young culture, it is easy to being disrespected [35]. Education is found to be
a significant negative predictor of experience of violence among older adults and is in line
with other studies [7], [31], [34], [36], [37]. Higher educational attainment may affect the
level of openness on abuse among the older adults and therefore they may be unwilling to
share information on sensitive topics like abuse to maintain a family façade [8]. A popular
believe is that, those who are economically independent have lesser odds of experiencing
violence [38]. However, our results indicated otherwise - older adults with working status
experience higher odds of violence. The possible explanation for our study finding might be
because the income earned is forcibly taken suggesting the presence of economic violence.
Further, those who do not contribute money for household expenses are more likely to
experience violence because they are economically dependent on their children [30]. Our
study results indicate that for older adults being employed (i.e. economically independent) as
well as not contributing to household expenses (i.e. economically dependent), both are risk
factors to experience violence.

Page | 14
Our decomposition results indicate that there exist economic inequality in reporting of
violence by older adults. A study by Naughton et al., 2012 in Ireland showed that individuals
with a low-income had a doubled risk of being victims of abuse of any kind. Likewise, low
income was associated with neglect, but not when other forms of abuse was considered [40].
In Iran, Hosseinkhani, Zahra Khodamoradi & Sheikh, 2019 found that older adults belonging
to lower socio-economic status are majorly at risk of abuse. The World Health Organization
(WHO) and International Network for the Prevention of Elder Abuse (INPEA) in their study
Missing Voices gathered the views of older persons on elder abuse and showed that poverty
and inequality are reasons for elder abuse (WHO & INPEA, 2002). Keskinoglu et al., 2007
tries to explain the factors such as living with many family members and with low family
income that cause violence towards older adults with low income. Further, the rates of abuse
among older adults are highest in families where income levels for the older adult and for the
abuser/caregiver are extremely low [44] and, there is low coverage of social security for older
adults that tends to increase the burden on their care givers [8].
Our study is not devoid of limitation. One of them is that the analysis is based on cross-
section data that limited our scope to do cause-effect analysis. Absence of traditional Indian
values have always perceived old age as a stage of wisdom, maturity, prestige, and power,
with respect given to older adults, especially to the oldest male [45]. However, recent
verbatim from focus group discussions reveal that older adults are now considered as burden
in the society [29]. Therefore, it is quite ironical to discuss the different forms of abuse faced
by the older adults in a country trapped in its own contradictory ideas.
Conclusion
Our results indicate that violence among older adults is prevalent in the society and therefore
an understanding of its determinants is valuable for policy makers to improve the services

Page | 15
towards the older adults of the country. The existence of economic inequality in reporting of
violence shows the miserable conditions of the older adults belonging to the poorest wealth
quintile. With no or meagre income of their own they have little or no bargaining power to
secure a violent free environment for themselves. Social and economic support should be
given to these older adults to live a dignified life. Finally, keeping in mind, the changing
pattern of Indian culture and values, efforts should be made to make individuals across all age
group respect, honour and care for the older adults.
Declarations:
1. Ethics approval and consent to participate: The study is based on secondary data,
which is in public domain and available on request. Therefore, ethical approval and
consent to participate are not required.
2. Funding: We declare that we did not receive any funding for this work.
3. Availability of data and material: We have provided details of the data in the
methodology section. The BKPAI data can be obtained from the ISEC Bangalore. The
report and the survey tools are also available on the website:
https://india.unfpa.org/sites/default/files/pub-pdf/AgeingReport_2012_F.pdf
4. Authors' contributions: Conception and design of the study: DS, SS, PSM and PK;
analysis and/or interpretation of data: PK and SS; drafting the manuscript: PSM, and
DS; reading and approving the manuscript: DS, PSM, SS and PK.
5. Competing interests: Authors declare that they do not have any competing interest.
6. Consent for publication: Not applicable.

Page | 16
References
[1] L. Mosqueda, K. Burnight, and M. W.Gironda, “intervention The Abuse Intervention Model: A Pragmatic Approach to,” J Am Geriatr Soc, vol. 64, no. 9, pp. 1879–1883,
2016, doi: 10.1158/1940-6207.CAPR-14-0359.Nrf2-dependent.
[2] C. S. H. Ho, S. Y. Wong, M. M. Chiu, and R. C. M. Ho, “Global prevalence of elder abuse: A meta-analysis and meta-regression,” East Asian Arch. Psychiatry, vol. 27, no.
2, pp. 43–55, 2017.
[3] M. Evandrou, J. C. Falkingham, M. Qin, and A. Vlachantoni, “Elder abuse as a risk factor for psychological distress among older adults in India : a cross-sectional study,” BMJ Open, pp. 1–15, 2017, doi: 10.1136/bmjopen-2017-017152.
[4] WHO, “World report And Ageing on Health,” 2015.
[5] WHO, “Abuse of the elderly,” 2020. [Online]. Available: http://www.who.int/violence_injury_prevention/violence/global_campaign/en/chap5.p
df.
[6] M. Evandrou, J. C. Falkingham, M. Qin, and A. Vlachantoni, “Elder abuse as a risk factor for psychological distress among older adults in India: A cross-sectional study,” BMJ Open, vol. 7, no. 10, 2017, doi: 10.1136/bmjopen-2017-017152.
[7] X. Dong, T. Beck, and M. A. Simon, “The associations of gender , depression and elder mistreatment in a community- dwelling Chinese population : The modifying effect of social support,” Arch. Gerontol. Geriatr., vol. 50, pp. 202–208, 2010, doi:
10.1016/j.archger.2009.03.011.
[8] V. Skirbekk and K. S. James, “Abuse against elderly in India – The role of education,” BMC Public Health, vol. 14, pp. 1–8, 2014.
[9] P. Shahi and D. Julka, “Prevalence of Abuse in Elders With Psychiatric Morbidity and Its Sociodemographic Association Study design,” Cureus, vol. 12, no. 4, pp. 1–7,
2020, doi: 10.7759/cureus.7906.
[10] X. Dong, M. A. Simon, R. O. Mba, and M. Gorbien, “Depression and Elder Abuse and Neglect Among a Community-Dwelling Chinese Elderly Population,” J. Elder Abuse
Negl., vol. 20, no. 1, pp. 25–41, 2008, doi: 10.1300/J084v20n01.
[11] Y. Yon, C. R. Mikton, Z. D. Gassoumis, and K. H. Wilber, “Elder abuse prevalence in community settings: a systematic review and meta-analysis,” Lancet Glob. Heal., vol.
5, no. 2, pp. e147–e156, 2017, doi: 10.1016/S2214-109X(17)30006-2.
[12] P. D. United Nations, Department of Economic and Social Affairs, “World Population Prospects The 2015 Revision, Key Findings and Advance Tables,” Work. Pap. No.
ESA/P/WP.241, 2015.
[13] S. Perel-levin, “Abuse , Neglect and Violence against Older Persons,” UNDESA
Expert Gr. Meet. “Older Pers. Emerg. Cris. New York, May, no. May, pp. 1–10, 2019.
[14] WHO, “GLOBAL STATUS PREVENTION VIOLENCE REPORT ON 2014,” 2014. doi: 10.1080/14768320500230185.
[15] T. Sathya and R. Premkumar, “Association of functional limitations and disability with elder abuse in India: a cross-sectional study,” BMC Geriatr., vol. 20, no. 1, p. 220,
Page | 17
2020, doi: 10.1186/s12877-020-01619-3.
[16] L. M. Young, “Elder physical abuse,” Clin. Geriatr. Med., vol. 30, no. 4, pp. 761–768,
2014, doi: 10.1016/j.cger.2014.08.005.
[17] K. Pillemer, D. Burnes, C. Riffin, and M. S. Lachs, “Elder Abuse : Global Situation , Risk Factors , and Prevention Strategies,” Gerontologist, vol. 56, no. S2, pp. 194–205,
2016, doi: 10.1093/geront/gnw004.
[18] S. Sembiah, A. Dasgupta, C. S. Taklikar, B. Paul, L. Bandyopadhyay, and J. Burman,
“Elder abuse and its predictors : a cross-sectional study in a rural area of West Bengal ,
eastern part of India,” PSYCHOGERIATRICS, pp. 1–9, 2020, doi:
10.1111/psyg.12550.
[19] S. Soneja, “ELDER ABUSE IN INDIA: Country Report for World Health Organization,” Help. India C-14, Qutab Institutional Area New Delhi - 110016, 2011,
[Online]. Available: https://www.who.int/ageing/projects/elder_abuse/alc_ea_ind.pdf.
[20] M. Arulmohi, V. Vinayagamoorthy, and D. A. R., “Physical Violence Against Doctors: A Content Analysis from Online Indian Newspapers,” Indian J. Community
Med., vol. 42, no. 1, pp. 147–50, 2017, doi: 10.4103/ijcm.IJCM.
[21] R. Sooryanarayana, W. Y. Choo, and N. N. Hairi, “A Review on the Prevalence and Measurement of Elder Abuse in the Community,” Trauma, Violence, Abus., vol. 14,
no. 4, pp. 316–325, 2013, doi: 10.1177/1524838013495963.
[22] Y. Abolfathi Momtaz, T. A. Hamid, and R. Ibrahim, “Theories and measures of elder abuse,” Psychogeriatrics, vol. 13, no. 3, pp. 182–188, 2013, doi: 10.1111/psyg.12009.
[23] BKPAI, “Report on the status of elderly in selected states of India,” 2011.
[24] S. Universitesi et al., “Issues of Elder Care and Elder Abuse in the Indian Context,” J.
Aging Soc. Policy, no. January 2015, pp. 37–41, 2008, doi: 10.1300/J031v15n02.
[25] R. Melba, Alexandra Hernandez-tejada, Amstadter, Ananda, Muzzy, Wendy &
Acierno, “The National Elder Mistreatment Study : Race and Ethnicity Findings,” J.
Elder Abuse Negl., vol. 25, no. 4, pp. 281–293, 2013, doi:
10.1080/08946566.2013.770305.
[26] O. O’donnell, E. Van Doorslaer, A. Wagstaff, and M. Lindelow, Analyzing health
equity using household survey data: a guide to techniques and their implementation.
The World Bank, 2007.
[27] A. Wagstaff, P. Paci, and E. van Doorslaer, “On the measurement of inequalities in health,” Soc. Sci. Med., vol. 33, no. 5, pp. 545–557, 1991, doi:
https://doi.org/10.1016/0277-9536(91)90212-U.
[28] H. Chaurasia and S. Srivastava, “Abuse , Neglect , and Disrespect against Older Adults in India,” J. Popul. Ageing, 2020.
[29] A. Rashmi, L. Sequeira, P. S. Kumar, and Rashmi, “Elder Abuse in Indian Setting–A
Misconception or a Reality– A Deductive Analysis,” Indian J. Public Heal. Res. Dev.,
vol. 11, no. 01, pp. 31–34, 2020.
[30] S. Chokkanathan and A. E. Y. Lee, “Elder Mistreatment in Urban India : A Community Based Study Elder Mistreatment in Urban India : A Community Based

Page | 18
Study,” J. Elder Abuse Negl., vol. 17, no. 2, pp. 45–61, 2005, doi:
10.1300/J084v17n02.
[31] D. W. L. Lai, “Abuse and Neglect Experienced by Aging Chinese in Canada Abuse and Neglect Experienced by Aging Chinese in Canada,” J. Elder Abuse Negl., vol. 23,
no. 4, pp. 326–347, 2011, doi: 10.1080/08946566.2011.584047.
[32] M. G. Ruelas-gonzález et al., “Prevalence and factors associated with violence and abuse of older adults in Mexico ’ s 2012 National Health and Nutrition Survey,” Int. J.
Equity Health, pp. 1–9, 2016, doi: 10.1186/s12939-016-0315-y.
[33] R. W. Summers and A. M. Hoffman, Elder abuse: A public health perspective.
American Public Health Association, 2006.
[34] X. Dong, M. A. Simon, and M. Gorbien, “Elder Abuse and Neglect in an Urban Chinese Population Elder Abuse and Neglect in an Urban Chinese Population,” J.
Elder Abus. Negl. ISSN, vol. 19, no. 3/4, pp. 79–96, 2007, doi: 10.1300/J084v19n03.
[35] J. Ploeg, L. Lynne, and C. A. Walsh, “What Is ‘ Elder Abuse ’? Voices From the Margin : The Views of Underrepresented Canadian Older Adults,” J. Elder Abuse
Negl., vol. 25, no. 5, pp. 396–424, 2013, doi: 10.1080/08946566.2013.780956.
[36] A. Ghodousi, S. Maghsoodloo, S. Mohsen, and S. Hoseini, “Original Article Forensic aspect of elder abuse: risk factors and characteristics,” J. Res. Med. Sci., vol. 16, no.
12, pp. 1598–1604, 2011.
[37] S. Fraga et al., “Elder abuse and socioeconomic inequalities : A multilevel study in 7
European countries,” Prev. Med. (Baltim)., vol. 61, pp. 42–47, 2014, doi:
10.1016/j.ypmed.2014.01.008.
[38] M. Yalç and F. Kara, “Prevalence of violence against older adults and associated factors in Çanakkale , Turkey : A cross-sectional study,” Geriatr. Gerontol. Int, vol.
20, pp. 66–71, 2019, doi: 10.1111/ggi.13819.
[39] C. NAUGHTON, A. DRENNAN, JONATHAN LYONS, IMOGEN LAFFERTY, A.
TREACY, MARGARET PHELAN, A. O’LOUGHLIN, and L. DELANEYs, “Elder abuse and neglect in Ireland : results from a national prevalence survey,” Age Ageing,
vol. 41, no. October 2011, pp. 98–103, 2012, doi: 10.1093/ageing/afr107.
[40] R. Acierno, M. A. Hernandez, A. B. Amstadter, H. S. Resnick, K. Steve, and W.
Muzzy, “Prevalence and Correlates of Emotional , Physical , Sexual , and Financial
Abuse and Potential Neglect in the United States : The National Elder Mistreatment Study,” Am. J. Public Health, vol. 100, no. 2, pp. 292–297, 2010, doi:
10.2105/AJPH.2009.163089.
[41] F. Hosseinkhani, Zahra Khodamoradi and S. Sheikh, “Socioeconomic Inequality of Elder Abuse in Qazvin , Iran,” Soc. Heal. Behav., no. 2, pp. 47–51, 2019, doi:
10.4103/SHB.SHB.
[42] W. & INPEA, “M i s s i n g V o i c e s: Views of older persons on elder abuse,” 2002.
[43] P. Keskinoglu, M. Pýcakcýefe, N. Bilgic, H. Giray, N. Karakus, and R. Ucku, “Elder abuse and neglect in two different socioeconomic districts in Izmir , Turkey,” Int.
Psychogeriatrics, vol. 19, no. 4, pp. 719–731, 2007, doi:
10.1017/S1041610207005315.
Page | 19
[44] H. White, “ELDER ABUSE IN TRIBAL COMMUNITIES,” Southwest Center for
Law and Policy & Office on Violence Against Women, U.S. Department of Justice, pp.
1–8, 2004.
[45] S. V. Kumar, “Economic Security for the Elderly in India Economic Security for the Elderly in India : An Overview,” J. Aging Soc. Policy, vol. 15, no. 2–3, pp. 45–65,
2003, doi: 10.1300/J031v15n02.

Page | 20
Table-1 Socio-economic profile of older adults in India
Variables Sample Percentage
Age (years)
60-69 5,890 61.8
70-79 2,612 27.4
80+ 1,036 10.9
Gender
Men 4,525 47.4
Women 5,014 52.6
Educational Status
None 4,871 51.1
Below 5 years 1,954 20.5
6 to 10 Years 2,136 22.4
11+ years 578 6.1
Marital Status
Not in Union 3,759 39.4
Currently in Union 5,780 60.6
Living Arrangement
Alone 561 5.9
With Spouse 1,521 15.9
With children 6,717 70.4
Others 740 7.8
Working Status
No 7,229 75.8
Yes 2,310 24.2
Contribute money for household expenditure
No Income 4,110 43.1
Yes 5,013 52.6
No 416 4.4
Wealth quintile
Poorest 2,251 23.6
Poorer 2,114 22.2
Middle 1,970 20.7
Richer 1,771 18.6
Richest 1,433 15.0
Religion
Hindu 7,570 79.4
Muslim 671 7.0
Sikh 898 9.4
Others 400 4.2
Caste
Scheduled Caste 1,979 20.7
Scheduled Tribe 531 5.6
Other backward class 3,507 36.8
Others 3,522 36.9
Place of residence
Rural 7,042 73.8
Urban 2,497 26.2
State
Himachal Pradesh 1,470 15.4
Punjab 1,351 14.2
West Bengal 1,127 11.8
Orissa 1,453 15.2
Maharashtra 1,380 14.5
Kerala 1,356 14.2
Tamil Nadu 1,403 14.7
Total 9,539 100
Page | 21
Table-2 Percentage of older adults who faced any violence by background characteristics in India.
Background characteristics Percentage p<0.05
Age (years) *
60-69 10.7
70-79 10.7
80+ 15.4
Gender *
Men 10.8
Women 11.5
Educational Status *
None 13.6
Below 5 years 11.8
6 to 10 Years 6.6
11+ years 6.0
Marital Status *
Not in Union 12.3
Currently in Union 10.5
Living Arrangement *
Alone 17.6
With Spouse 12.2
With children 10.6
Others 9.6
Working Status *
No 9.9
Yes 15.2
Contribute money for household expenditure *
No Income 10.7
Yes 11.2
No 15.4
Wealth quintile *
Poorest 17.3
Poorer 13.1
Middle 8.4
Richer 8.0
Richest 6.4
Religion
Hindu 11.1
Muslim 10.0
Sikh 12.4
Others 12.9
Caste *
Scheduled Caste 12.0
Scheduled Tribe 14.0
Other backward class 7.9
Others 13.5
Place of residence *
Rural 12.2
Urban 8.3
State *
Himachal Pradesh 11.5
Punjab 10.4
West Bengal 7.5
Orissa 9.2
Maharashtra 34.3
Kerala 2.9
Tamil Nadu 1.9
Total 11.2
*if p<0.05
Page | 22
Table-3 Logistic regression estimates for violence among older adults in India
Background characteristics Odds Ratio (95% CI)
Age (years)
60-69
70-79 0.97(0.78,1.19)
80+ 1.49*(1.14,1.93)
Gender
Men
Women 0.96(0.78,1.19)
Educational Status
None
Below 5 years 1.08(0.89,1.32)
6 to 10 Years 0.79*(0.63,1)
11+ years 0.60*(0.39,0.9)
Marital Status
Not in Union
Currently in Union 0.79*(0.65,0.95)
Living Arrangement
Alone
With Spouse 0.69*(0.48,0.98)
With children 0.53*(0.4,0.72)
Others 0.44*(0.3,0.66)
Working Status
No
Yes 1.26*(1.02,1.56)
Contribute money for household expenditure
No Income
Yes 0.92(0.74,1.16)
No 1.25*(1.05,1.86)
Wealth quintile
Poorest
Poorer 0.63*(0.5,0.79)
Middle 0.43*(0.32,0.58)
Richer 0.39*(0.29,0.53)
Richest 0.35*(0.24,0.51)
Religion
Hindu
Muslim 1.08(0.75,1.55)
Sikh 1.51*(1.04,2.18)
Others 1.09(0.72,1.66)
Caste
Scheduled Caste
Scheduled Tribe 0.91(0.63,1.32)
Other backward class 0.96(0.73,1.25)
Others 1.37*(1.07,1.75)
Place of residence
Rural
Urban 0.94(0.78,1.14)
State
Himachal Pradesh
Punjab 0.82(0.56,1.2)
West Bengal 0.50*(0.34,0.72)
Orissa 0.56*(0.39,0.82)
Maharashtra 3.53*(2.62,4.75)
Kerala 0.28*(0.18,0.44)
Tamil Nadu 0.13*(0.08,0.22)
*p<0.05; CI: Confidence Interval

Page | 23
Table 4: Estimates of decomposition analysis for contribution of various explanatory variables for violence among
older adults in India
Background characteristics Coefficient Elasticity CI Absolute
contribution
%
Contribution
Age (years)
60-69
70-79 0.06 -0.001 -0.014 0.000 -0.1
80+ 0.51* 0.004 0.018 0.000 -0.3 -0.4
Gender
Men
Women -0.05 -0.001 -0.033 0.000 -0.2 -0.2
Educational Status
None
Below 5 years 0.08 0.003 0.002 0.000 0.0
6 to 10 Years -0.23* -0.003 0.260 -0.001 3.8
11+ years -0.52 0.000 0.613 0.000 0.0 3.7
Marital Status
Not in Union
Currently in Union -0.24* -0.009 0.040 0.000 1.7 1.7
Living Arrangement
Alone
With Spouse -0.37* -0.005 -0.197 0.001 -4.7
With children -0.63* -0.038 0.089 -0.003 16.3
Others -0.81* -0.005 0.092 0.000 2.2 13.7
Working Status
No
Yes 0.23* 0.004 -0.174 -0.001 3.3 3.3
Contribute money for household
expenditure
No Income
Yes -0.12 -0.003 -0.006 0.000 -0.1
No 0.16* 0.001 -0.054 0.000 0.3 0.2
Wealth
Poorest
Poorer -0.38* -0.012 -0.338 0.004 -19.5
Middle -0.73* -0.018 0.139 -0.003 12.0
Richer -0.91* -0.017 0.523 -0.009 42.7
Richest -1.03* -0.016 0.760 -0.012 58.5 93.7
Religion
Hindu
Muslim 0.03 0.001 0.146 0.000 -0.7
Sikh 0.37* 0.004 0.311 0.001 -6.0
Others 0.06 0.000 0.296 0.000 0.0 -6.7
Caste
Scheduled Caste
Scheduled Tribe 0.01 -0.001 -0.444 0.000 -2.1
Other backward class 0.03 -0.001 -0.029 0.000 -0.1
Others 0.30* 0.012 0.219 0.003 -12.6 -14.9
Place of residence
Rural
Urban -0.07 -0.001 0.247 0.000 1.2 1.2
State
Himachal Pradesh
Punjab -0.05 -0.003 0.331 -0.001 4.8
West Bengal -0.50* -0.007 -0.163 0.001 -5.5
Orissa -0.59* -0.008 -0.368 0.003 -14.2
Maharashtra 1.29* 0.031 -0.125 -0.004 18.6
Kerala -1.06* -0.010 0.349 -0.003 16.8

Page | 24
Tamil Nadu -2.04* -0.015 -0.222 0.003 -16.0 4.5
Calculated CI -0.021
Actual CI -0.198
Residual -0.177
CI: Concentration index; *if p<0.05; %: percentage

Page | 25
Figure 1: Type of violence reported by older adults in India
10.0
5.8 5.2 5.1
4.2
0.8
0.0
2.0
4.0
6.0
8.0
10.0
12.0
Verbal
voilence
Disrespect Economic
voilence
Neglect Physical
voilence
Others
Per
centa
ge
Type of Voilence
Page | 26
0
0.2
0.4
0.6
0.8
1
0 0.1 0.2 0.3 0.4 0.5 0.6 0.7 0.8 0.9 1
Cu
mu
lati
ve
sco
re o
f v
oil
ence
Cumulative score of wealth
Figure 2: Concentration curve for violence among older adults in India

Figures
Figure 1
Type of violence reported by older adults in India

Figure 2
Concentration curve for violence among older adults in India