Embed Size (px)
Citation preview
SSS10 Proceedings of the 10th International Space Syntax Symposium
P D A Vieira Zechin & F R Borges de Holande The Spatial Dimension of urban socio-economic inequality: a study on five Brazilian cities
116:1
The spatial dimension of urban socio-economic inequality: a study on five Brazilian cities.
Patrick Di Almeida Vieira Zechin Universidade Estadual de Goiás [email protected]
Frederico Rosa Borges de Holanda Universidade de Brasília [email protected]
Abstract
The aim of this paper is to present the implications of urban morphology on socio-economic features of five Brazilian Capitals (Goiania, Fortaleza, Belo Horizonte, Brasilia and Curitiba). They are considered the most unequal cities amongst Brazilian State Capitals and are placed among the world’s most unequal cities, according to a UN-HABITAT report. Our purpose is to contribute to the understanding of Brazilian cities by analyzing the relations between two very distinct socio-economic areas: the ones presenting the lowest and the highest income indexes. Besides their income layers, these areas were compared in terms of their contrasting spatial structures. By correlating opposing income groups and urban configuration, it is possible to perceive how diverse they are regarding angular global and local integration, and choice values. Results point to a very strong relationship between spatial patterns, segregation, income layers, and different capacity of the inhabitants to access urban facilities and services. A poor spatial structure is essential to understand poverty and segregation in Brazil’s biggest cities. Such understanding may contribute to the public debate concerning public policies, particularly those related to the architecture of the city.
Keywords
Space syntax, inequality, segregation, spatial patterns.
SSS10 Proceedings of the 10th International Space Syntax Symposium
P D A Vieira Zechin & F R Borges de Holande The Spatial Dimension of urban socio-economic inequality: a study on five Brazilian cities
116:2
1. Introduction
It is certainly not an overstatement to affirm that one of the most critical problems concerning urban life in Brazil is socio-economic inequality. Over the past decade inequality has diminished, albeit the addition of a sizable population contingent to the production mechanisms, circulation and consumption of goods and services still represents a major challenge to the country.
Inequality is not a problem in itself, since individuals set themselves apart in their accomplishments and these are, at least in part, the result of different levels of skills, either innate or environment-based. In fact, what shreds human coexistence in cities is socio-economic inequality.
In Brazilian major urban areas, one of the most critical issues is urban poverty driven by the profound inequality produced by our conservative society, as well as the urban settings that characterize this reality. Segregation is the trademark of spaces that end up lodging the poorest in central areas although it also appears to be the response of the privileged classes to the challenge of inhabiting swollen, violent cities with disconnected spaces.
We may assume, quite empirically, that cities can be open or closed in relation to the capacity of its inhabitants to access, occupy and use the urban space, and even create new spaces to meet their objective demands. Cities can also be open or closed regarding the ability of their dwellers to make decisions concerning the everyday administration processes and have a role in the different parts of interaction and exchange. For some dwellers, the city is the stage for social and political life, where knowledge is produced and shared, and the setting for several forms of creativity and art to be developed; for others, the city fails to offer the same opportunities. Thus, cities can be places of inclusion and participation, as well as the backdrop of exclusion and ostracism.
Over time, Brazilian cities have experienced a growing spatial fragmentation of the urban fabric according to Medeiros (2006). The author points out that Brazilian cities resemble Asian and European settlements although the comparison between absolute values of the variables analyzed shows, without a doubt, that the first are the most segregated, least articulated, displaying the lowest level of synchronicity across accessibility values among parts of the urban fabric. Besides, they possess the lowest correlation between the existing amount of connections in each chosen path and the potential of accessibility among parts of the path chosen calculated for the whole system. There is no other set of cities displaying the same features in the same level.
When the areas of poverty are physically isolated and disconnected from the main urban fabric, the dwellers are set apart within the city. These individuals are frequently faced with endless commuting hours on a daily basis, on costly public transportation, whose prices might be lower if their boroughs possessed better integration with the urban fabric. Besides their low income and housing demands, these citizens are less favored in terms of access to scale urban economics.
Bearing in mind the scenario of economic inequality presented thus far, at the core of this issue we find the poorest and the wealthiest urban segments severely stratified into specific parts of the city (in this study, we discuss Brazil’s most unequal capital cities, Goiânia, Fortaleza, Belo Horizonte, Brasília and Curitiba, according to the 2010/2011 UN- HABITAT State of the World’s Cities report), which leads us to this study’s central hypothesis: what is the relationship between these cities spatial structure and their high level of socio-economic inequality?
Let us take into account that the spatial structure of a given city has striking influence over the distribution of the movement potential of its different social segments across the different parts of the urban fabric. According to studies in the field of space syntax (Hillier, 2009), there are two distinctive ways to measure the movement potential of a given urban spatial structure: (i) the so-called “to-movement”, which refers to the accessibility potential of a segment in relation to all other segments in the system; (ii) the so-called “through-movement”, which refers to the use of a set of segments as a walkway for other sets of segments. Such attributes can be measured both in a local range, capturing the movement of the different parts of the system, as well as in a global range, which captures the major movements among parts of the system as a whole.
SSS10 Proceedings of the 10th International Space Syntax Symposium
P D A Vieira Zechin & F R Borges de Holande The Spatial Dimension of urban socio-economic inequality: a study on five Brazilian cities
116:3
The aim of this study was to investigate the relationship between the urban configuration of a specific group of particularly unequal Brazilian cities and the socio-economic conditions of two opposing social classes: the very wealthy and the very poor, taking into account their capacity for movement within the urban fabric.
2. Methodology
This study used a set of data to establish the correlation between spatial structure and socio-economic variables. The data include: (i) data obtained from IBGE
1 and (ii) maps of segments
obtained from Brazilian researchers specialized in space syntax. The study was designed in the following manner. First, the data from IBGE were processed using a Spatial Data Analysis tool (AEDE), which can be classified as univariate and multivariate, depending on the number of variables involved. In this study, we used Greene and Pick’s (2012, p. 209) Centrographic Method, which is presented as a statistical alternative to overcome the fact that the Dissimilarity Index (Duncan and Duncan, 1955) fails to measure certain aspects of the spatial distribution of the population segments studied.
In the field of space syntax research, we turned to Holanda (2002, p.95), to whom the study of the aspects of co-presence in the architectural space requires the establishment and development of a set of variables which typify this approach. This set allows for the assessment of the relationships between space and society, which can be developed in three analytical levels: (i) spatial patterns; (ii) encounter and avoidance systems and (iii) general socio-economic categories. In this study, we focused on the first and the last analytical levels.
The maps of segments were analyzed by means of depthmapX software, developed by UCL. In this specific case, our particular variables were “angular integration” and “angular choice” calculated for two radii of analysis: n and 900m.
3. Inequality – The urban divide
Up to the end of the XX century, Brazil had been perceived as a country with heightened income inequality, showing no retraction trends. Nevertheless, the country, in some instances, led poverty to a decline as it was the situation over the 1970’s, for example. However, with inequality failing to decline, poverty decreased, according to Barros et al (2011), due single-handedly to economic growth which led, in due course, to increasingly scarce episodes combining economic growth and public policies targeting income distribution. For the purpose of this study, we focused on data gathered by the UN-HABITAT regarding city inequalities, mainly those referring to:
(i) income inequality; (ii) spatial ostracism and its staggering consequences and (iii) the deflation of the “urban advantage” due to the rise of poverty. Contemporary cities in underdeveloped countries fail to provide access to the fulfillment of the most basic aspirations of urban living due to economic, social, cultural and, in some cases, even ethnic, gender and age segregation. They display the phenomenon known as the “urban divide”. Cities in underdeveloped countries are profoundly divided between the “haves and the have nots”, exposing a chasm which, more often than not, produces social instability at high social and economic costs, not only for the very poor, but for society as a whole.
Interestingly, these cities are merging among themselves giving way to urban settlements on a massive scale. Such configurations take the shape of mega-regions, urban corridors and city-regions. They pop up in several locations worldwide, becoming spatial units which are joined together by economic, political, socio-cultural and ecological systems. They eventually work as great engines to both global and regional economies, reflecting the links that surface between urban expansion and the new models of economic activity. Nonetheless, they may result in an unbalanced regional and
1 The Brazilian Census Bureau.
SSS10 Proceedings of the 10th International Space Syntax Symposium
P D A Vieira Zechin & F R Borges de Holande The Spatial Dimension of urban socio-economic inequality: a study on five Brazilian cities
116:4
urban development in that they reinforce the links with the existing economic centers instead of allowing for a broader spatial growth.
Therefore, it is pertinent to inquire whether it may be a coincidence that all of the five most unequal cities in the country emerge as “city-regions”, whereas Goiânia is connected to Brasília in what the study sees as “an urban corridor”.
4. Spatial analysis and overall results
First and foremost, it is crucial to establish the guidelines from which our spatial analysis departed. This requires defining how Brazilian cities behave morphologically so as to enable the identification of a common ground for comparison, despite their diverse historical and territorial realities.
The common features among the analyzed cities enable the recognition of the same socio-economic and morphological driver of inequality which was our primary concern in this study.
Several studies in the field of space syntax posit that different urban clusters – in terms of their history, social and cultural organization – may have similar morphological-syntactic patterns, even when the geometrical design of roads, public spaces and blocks, for instance, varies enormously.
In light of the methodological tools proposed by the space syntax, it is possible, therefore, to find spatial patterns that may characterize Brazilian cities morphologically as a typical topological form as well as to link them to several other cities found worldwide through the analysis of syntactic variables.
Medeiros finds a set of common attributes in Brazilian cities as a whole and highlights that these settlements take up large areas and can be identified in terms of: (i) discontinued urban spots; (ii) prevalence of regular configurations following a patchwork pattern; (iii) heterogeneity in the size of the lines constituting the designs, which reveals a conspicuous differentiation; (iv) major density; (v) not very compact cities due to the existence of several urban voids; (vi) relevant role in the major lines of systems; (vii) great presence – 90% - of minor lines indicating the maze-like character of Brazilian cities; (viii) a larger number of lines in the integration cores than in the old centers; (ix) little integration caused both by the design and the mean depth of the systems; (x) lower synergy
2 and
intelligibility3 and (xi) a larger proportion of the integration core in the shape of a deformed wheel
and a minor proportion in a mixed shape, which is a requirement for heterogeneous flow towards the growth of the urban spot. In the author’s view, the result is “a large heterogeneous city made up of varied parts devoid of any clear connection with each other.” The mean integration value of several cities around the world presented by the author is 1.028; in Brazilian cities, the same value equals 0.768, which empirically represents: (i) cities with an increased socio-spatial segregation since dislocation within the city becomes impaired; (ii) higher transportation costs, the result of longer distances to cover; (iii) consistent time wasted in the accomplishment of daily tasks; (iv) greater separation among parts in the fragmented city; (v) rise of urban decay in the old centers caused by spatial segregation; (vi) steep land prices in the most accessible areas due to real estate speculation.
5. Socio-economic variables – The spatialization of income
The task we attempted was to consider the information referring to how the groups are distributed within the urban system of each of the studied cities. Given the nature of the data made available by the IBGE Census, these are classified according to the income received and not the social class. Identifying the spatialization of the government data by means of a GIS application enhances our understanding of the spatialization of the relationships between the different parts of a city and clarifies how these parts relate to the system.
2 Level of synchronicity between global integration values (Rn) and local integration values (R3), where the
dependency of a variable in relation to another is evaluated (MEDEIROS, 2012, p.57) 3 Correlation between the connectivity and the integration value of the axes of a given system (MEDEIROS,
2012a, p.57)
SSS10 Proceedings of the 10th International Space Syntax Symposium
P D A Vieira Zechin & F R Borges de Holande The Spatial Dimension of urban socio-economic inequality: a study on five Brazilian cities
116:5
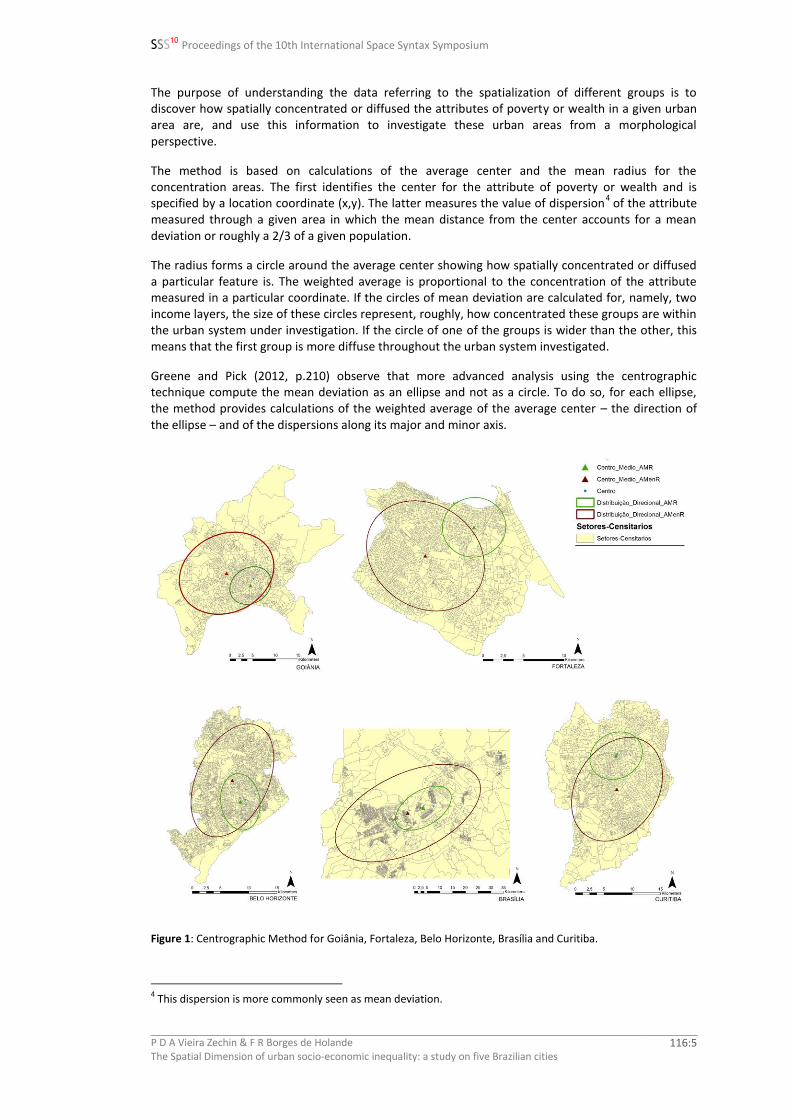
The purpose of understanding the data referring to the spatialization of different groups is to discover how spatially concentrated or diffused the attributes of poverty or wealth in a given urban area are, and use this information to investigate these urban areas from a morphological perspective.
The method is based on calculations of the average center and the mean radius for the concentration areas. The first identifies the center for the attribute of poverty or wealth and is specified by a location coordinate (x,y). The latter measures the value of dispersion
4 of the attribute
measured through a given area in which the mean distance from the center accounts for a mean deviation or roughly a 2/3 of a given population.
The radius forms a circle around the average center showing how spatially concentrated or diffused a particular feature is. The weighted average is proportional to the concentration of the attribute measured in a particular coordinate. If the circles of mean deviation are calculated for, namely, two income layers, the size of these circles represent, roughly, how concentrated these groups are within the urban system under investigation. If the circle of one of the groups is wider than the other, this means that the first group is more diffuse throughout the urban system investigated.
Greene and Pick (2012, p.210) observe that more advanced analysis using the centrographic technique compute the mean deviation as an ellipse and not as a circle. To do so, for each ellipse, the method provides calculations of the weighted average of the average center – the direction of the ellipse – and of the dispersions along its major and minor axis.
Figure 1: Centrographic Method for Goiânia, Fortaleza, Belo Horizonte, Brasília and Curitiba.
4 This dispersion is more commonly seen as mean deviation.
SSS10 Proceedings of the 10th International Space Syntax Symposium
P D A Vieira Zechin & F R Borges de Holande The Spatial Dimension of urban socio-economic inequality: a study on five Brazilian cities
116:6
Based on the data made available by the 2010 Census and the utilization of the centrographic method for census variables, namely: (i) private households with nominal income per capita of over 1/8 to 1/4 of the minimum wage and (ii) private households with monthly nominal income per capita of over 10 minimum wages, (in a sequence of maps in figure 1), we spatialized these two income groups in an attempt to fine-tune the data using spatial statistics tools.
We noticed a strong preference from the higher classes for the area around the historic city centers so that the ellipses referring to this group tend to be less eccentric. The most underprivileged groups display stronger dispersion, albeit not uniformly, perceived throughout the urban fabric, the exception being Brasília, which is known for the social dynamics of sorting between the wealthy (in the center) and the poor (in the suburbs every which way). In this particular case, the dispersion is more homogeneous, according to Holanda (2007).
The distances between the average centers of The Highest and Lowest Income Areas are similar for all the analyzed cities: (i) 5.7Km for Goiânia; (ii) 6.9Km for Fortaleza; (iii) 4.3Km for Belo Horizonte; (iv) 6.1Km for Brasília and (v) 5.9Km for Curitiba. Overall, this distance indicates the transition to a less dense and less fragmented urban fabric.
While the average centers of the Highest Income Areas almost overlap as to be perceived as the initial milestone of the cities; the average centers of the Lowest Income Areas meet at the edges of important landmarks for infrastructure and road traffic along its city routes: BR 060 and GO 060 (Goiânia), CE 060 and CE 065 (Fortaleza), Ring Road (Belo Horizonte), Epia (Brasília) and Régis Bittencourt (Curitiba). We assume that these gigantic infrastructure landmarks strongly contribute to the dislocation of natural movement and the role of movement in the economy of the cities, as theorized by Hillier et al (1993) e Hillier (1996).
6. Spatial patterns
Turner (2000) presents a method for the quantification of the configuration of a space with the aim of making an accurate prediction of movement. The method discussed by the author is known as Angular Analysis of Space. It is described as the result of the manipulation of two ideas: the first one is that as an individual moves between two points, this will be attempted with the smallest possible number of inflexions – instead of using the shortest path, as common sense may initially assume. The second one is that any point may be considered either the beginning or the end of a journey, and any journey from any point to another is equally as probable as any other. The combination of these two basic premises is the basis for the quantification of the points within the urban space.
Turner argues that these ideas are intrinsically connected with the notion of the space syntax as proposed by Hillier and Hanson (2003). Angular Analysis proposes, according to Turner (2000), a fine-tuning of the method used by the space syntax in that it offers a more accurate representation of where the movement actually occurs. The angular analysis of a segment converts the axial lines into segments and, thus, calculates the sum of the angles taken in these segments from the beginning of the route – departure – up to the last point – the destination - within an urban system.
The angular sum is seen as a penalty imposed by the chosen route between the segmented axial lines. Hillier and lida (2005) discusses the ideal correlations between the angular analysis of the segment and the movements – vehicle and pedestrians – in four areas of the city of London.
To capture the dynamics described above, it was necessary to elaborate analysis maps containing the segments for the five studied cities from their respective axial maps using depthmapX. For the analysis of the global scale, we used radius “n” and for the local scale the measure of the routes from any line was confined to those that follow the defined metric scale.
The more general urban structure takes a dual shape divided into a network both in the foreground and in the background. The first one is made up of a relatively small number of long lines connected at their edges in angles forming an orderly structure within which we find the background network.
SSS10 Proceedings of the 10th International Space Syntax Symposium
P D A Vieira Zechin & F R Borges de Holande The Spatial Dimension of urban socio-economic inequality: a study on five Brazilian cities
116:7
This network accounts for a large number of small lines that tend to intercept each other and connect at their edges by means of closed angles, forming local grids.
By comparing the measures of income through the spatialization of the wealthiest and the poorest groups within the cities with the aid of syntactic information on the potential of the paths contained in the Highest and Lowest Income Areas as a route or destination, we may be able to further assemble the scenario portraying the relationship between the spatial properties of spatial configuration and the characteristics of inequality in the cities under investigation.
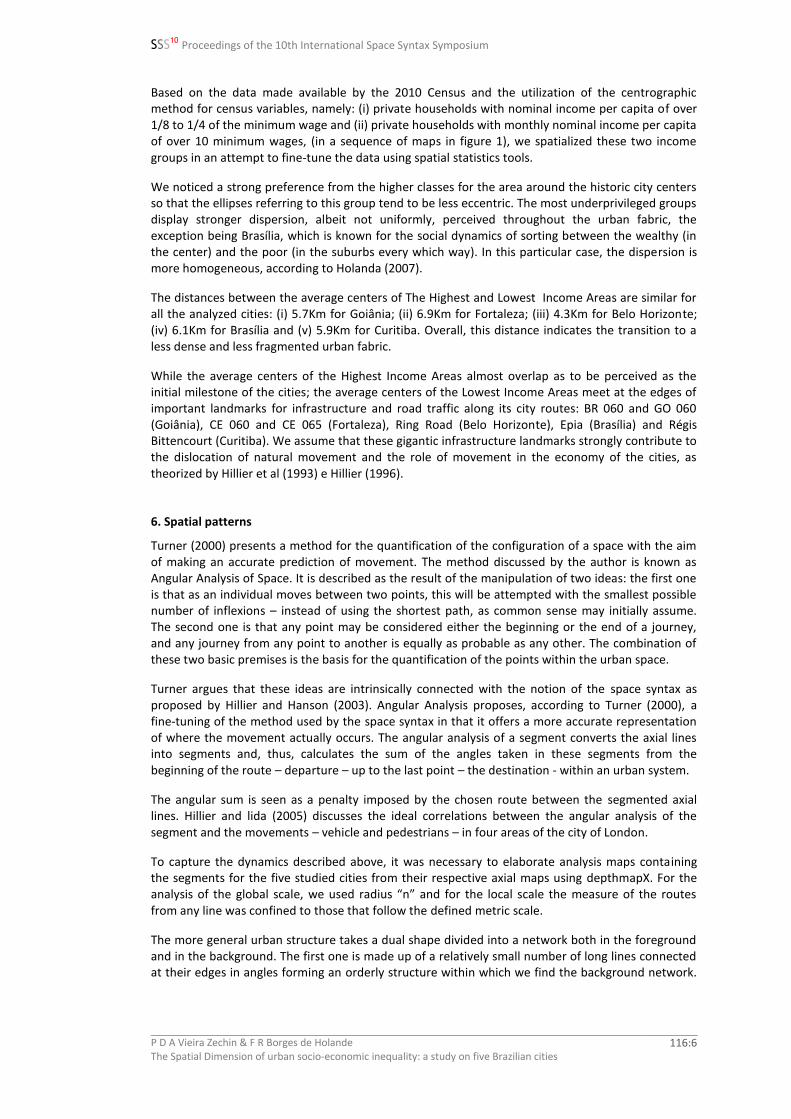
Generally speaking, the existence of major lines cutting through the urban system exerts considerable effect upon the city’s structure. They work as potent axes that connect both the uninterrupted fabric and the farthest and most discontinued parts to the core.
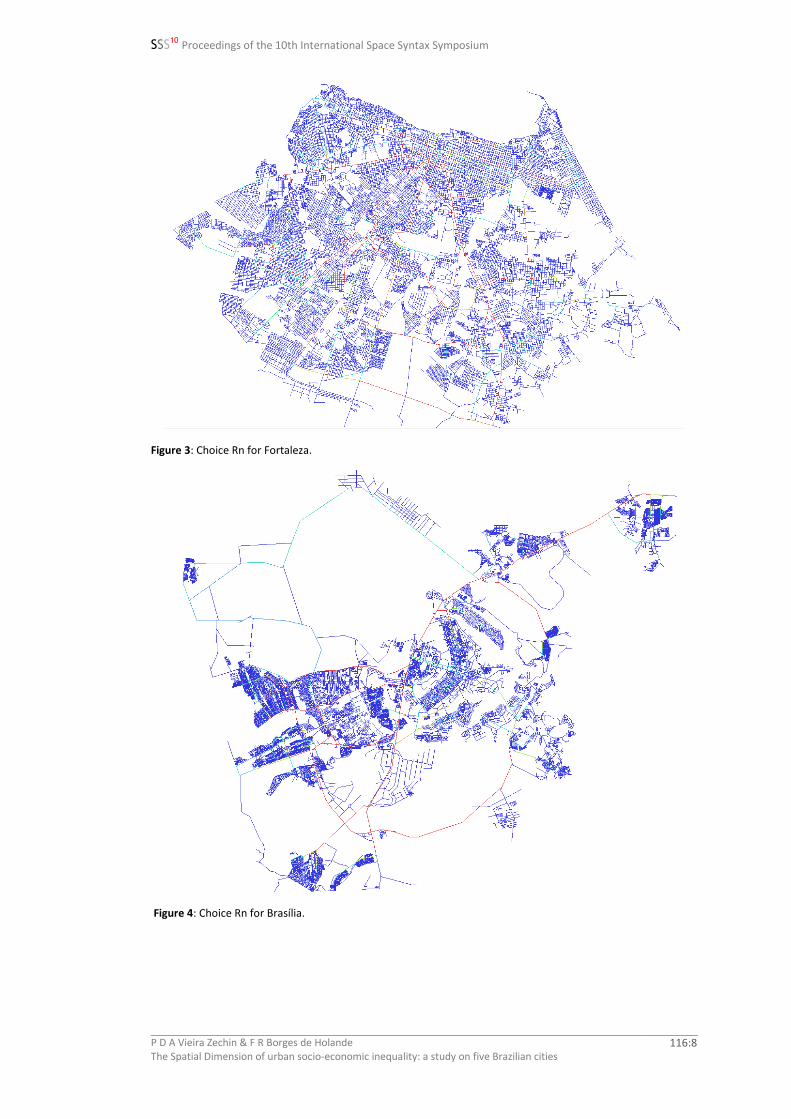
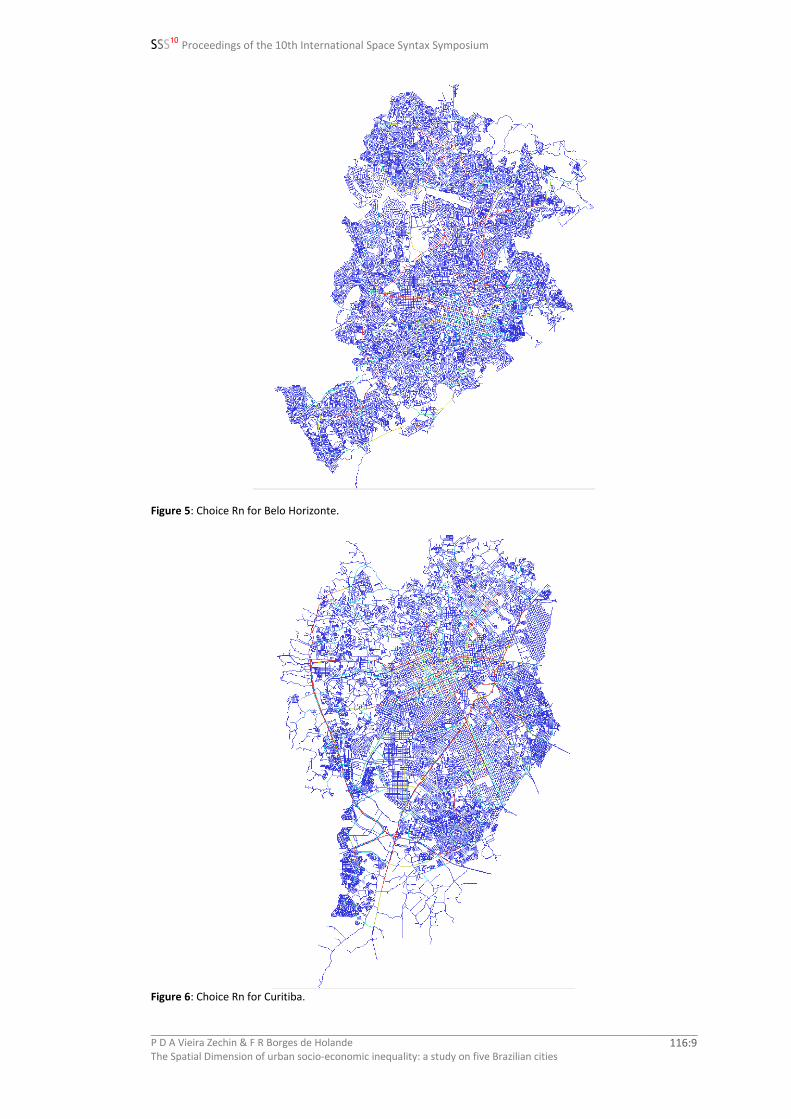
On a global scale analysis (figure 2 to 6), we observed that it is the formation of a network of paths in the area circumscribed by the ellipse that outlines the direction distribution of the Highest Income Area.
Figure 2: Choice Rn for Goiânia.
SSS10 Proceedings of the 10th International Space Syntax Symposium
P D A Vieira Zechin & F R Borges de Holande The Spatial Dimension of urban socio-economic inequality: a study on five Brazilian cities
116:8
Figure 3: Choice Rn for Fortaleza.
Figure 4: Choice Rn for Brasília.
SSS10 Proceedings of the 10th International Space Syntax Symposium
P D A Vieira Zechin & F R Borges de Holande The Spatial Dimension of urban socio-economic inequality: a study on five Brazilian cities
116:9
Figure 5: Choice Rn for Belo Horizonte.
Figure 6: Choice Rn for Curitiba.
SSS10 Proceedings of the 10th International Space Syntax Symposium
P D A Vieira Zechin & F R Borges de Holande The Spatial Dimension of urban socio-economic inequality: a study on five Brazilian cities
116:10
Interestingly, this network, which potentially concentrates the “through- movement”, also creates a criss-cross pattern for the major paths, which, in turn, bears no resemblance to any other part of the fabric. At the fringes of the systems, the major paths become increasingly rare and apart from each other the farther the central area is.
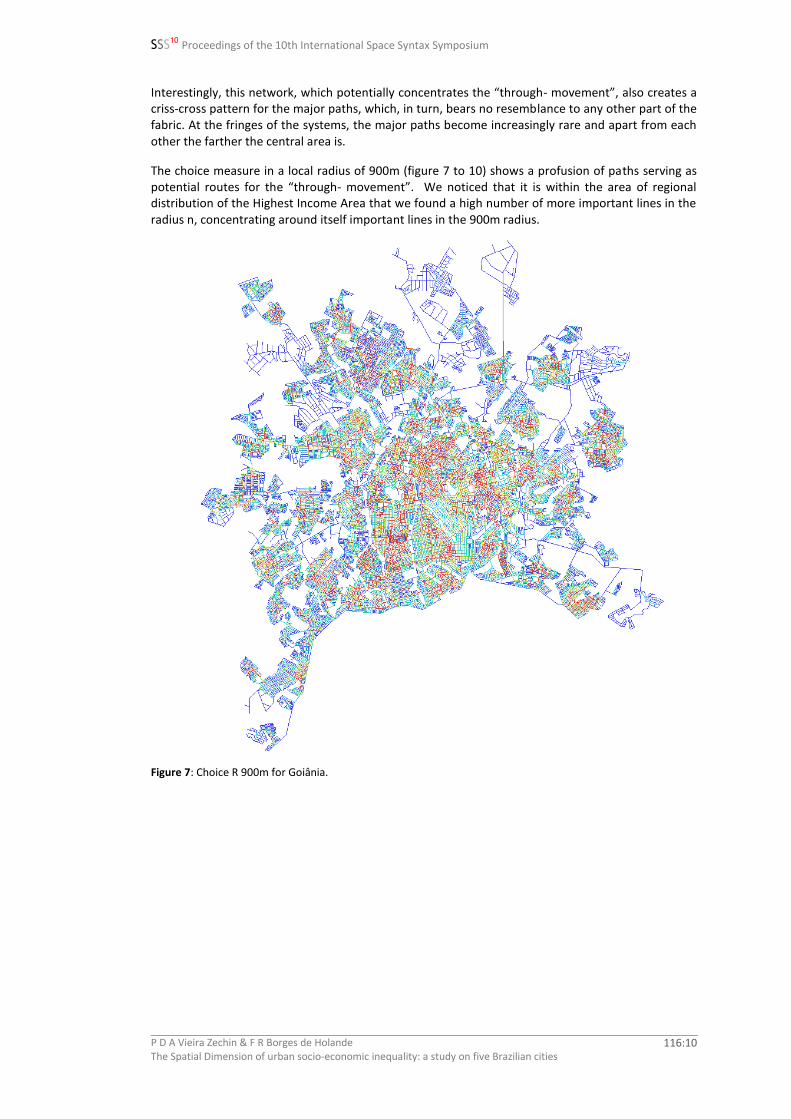
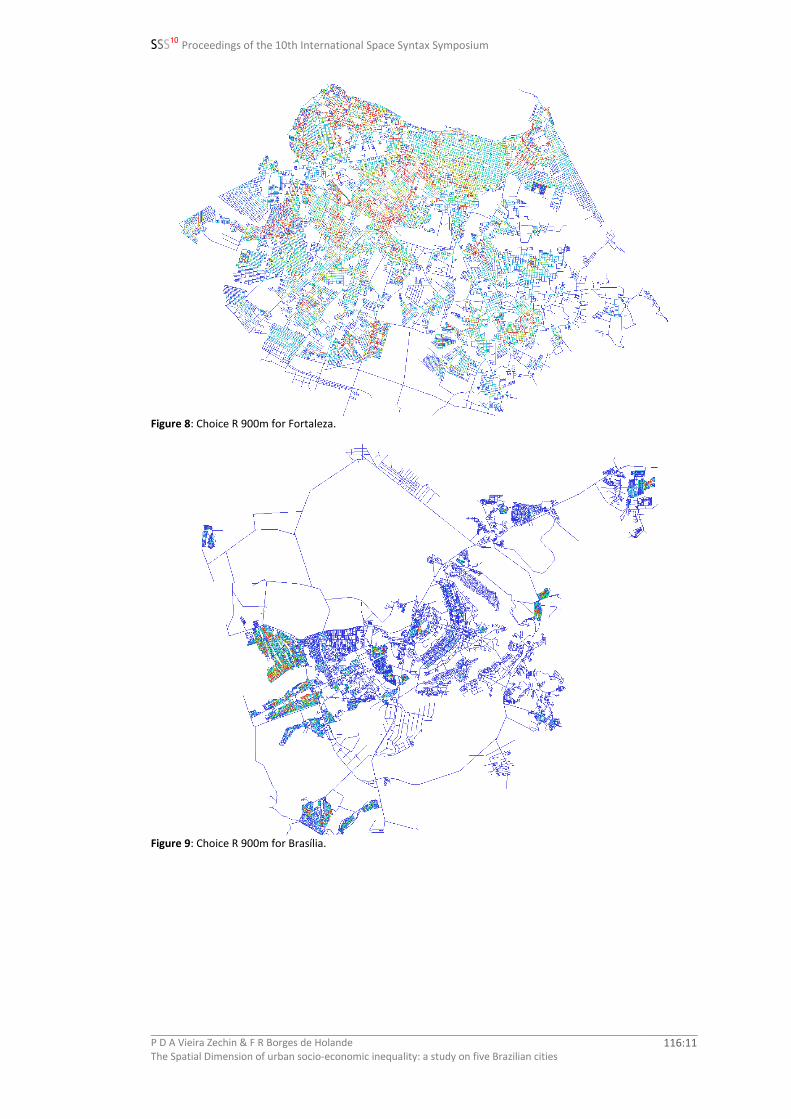
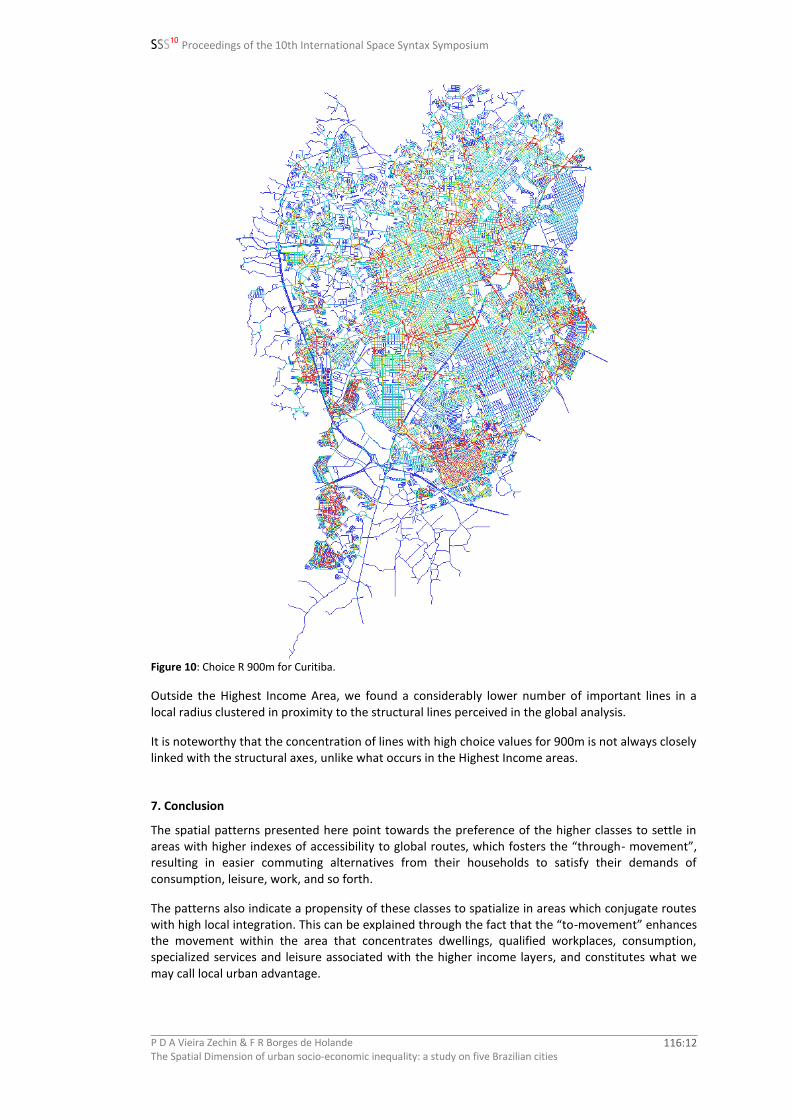
The choice measure in a local radius of 900m (figure 7 to 10) shows a profusion of paths serving as potential routes for the “through- movement”. We noticed that it is within the area of regional distribution of the Highest Income Area that we found a high number of more important lines in the radius n, concentrating around itself important lines in the 900m radius.
Figure 7: Choice R 900m for Goiânia.
SSS10 Proceedings of the 10th International Space Syntax Symposium
P D A Vieira Zechin & F R Borges de Holande The Spatial Dimension of urban socio-economic inequality: a study on five Brazilian cities
116:11
Figure 8: Choice R 900m for Fortaleza.
Figure 9: Choice R 900m for Brasília.
SSS10 Proceedings of the 10th International Space Syntax Symposium
P D A Vieira Zechin & F R Borges de Holande The Spatial Dimension of urban socio-economic inequality: a study on five Brazilian cities
116:12
Figure 10: Choice R 900m for Curitiba.
Outside the Highest Income Area, we found a considerably lower number of important lines in a local radius clustered in proximity to the structural lines perceived in the global analysis.
It is noteworthy that the concentration of lines with high choice values for 900m is not always closely linked with the structural axes, unlike what occurs in the Highest Income areas.
7. Conclusion
The spatial patterns presented here point towards the preference of the higher classes to settle in areas with higher indexes of accessibility to global routes, which fosters the “through- movement”, resulting in easier commuting alternatives from their households to satisfy their demands of consumption, leisure, work, and so forth.
The patterns also indicate a propensity of these classes to spatialize in areas which conjugate routes with high local integration. This can be explained through the fact that the “to-movement” enhances the movement within the area that concentrates dwellings, qualified workplaces, consumption, specialized services and leisure associated with the higher income layers, and constitutes what we may call local urban advantage.
SSS10 Proceedings of the 10th International Space Syntax Symposium
P D A Vieira Zechin & F R Borges de Holande The Spatial Dimension of urban socio-economic inequality: a study on five Brazilian cities
116:13
For a 900m radius, the choice variable shows the existence of several sub-centers located mostly in the uninterrupted part of the urban fabric, indicating pathways that may potentially develop intense local economic activity. We may assume that a number of these sub-centralities may also be identified with intense global economic activity since they are joined together by structural axes.
It is quite obvious that the Brazilian metropolises analyzed share a highly frail and clearly unequal spatial structure. The spatial behavior of the city of the wealthy in contrast with that of the poor seems decisive in what regards the capacities of these groups to access services and urban equipment deemed essential to quality city living.
It is crucial that further studies are carried out for the remainder of the country’s metropolises, and even for the medium-sized cities, which have increasingly become assets to Brazilian economy.
References
Barros, R., Carvalho, M., Franco, S., Mendonça, R. and Rosalém, A. (2011). ‘Sobre a evolução recente da pobreza e da desigualdade no Brasil’. In: Castro, J., Vaz, F. (eds.) Situação Social Brasileira – Monitoramento das condições de vida 1. Brasília: IPEA, 41-65.
Greene, R., Pick, J. (2012), ‘Exploring the urban community: A GIS approach’. New Jersey: Prentice Hall. Medeiros, V. (2013), Urbis Brasiliae: o labirinto das cidades brasileiras’. Brasília: EdUnB. Medeiros, V. (2012). As cidades labirinto: A configuração espacial em assentamentos brasileiros’. In: Holanda, F.
(ed.) Ordem e desordem: Arquitetura & vida social. Brasília: FRBH edições. United Nations Human Setlements Program (2012). State of the world`s cities 2010/2011 – Bridging the urban
divide. Londres: Earthscan. Hillier, B. and Iida, S, (2005) ‘Network effects and psychological effects: a theory of urban movement’. In: van
Nes, A. (ed.), Proceedings of the Fifth International Space Syntax Symposium, Delft: University of Technology, Vol. 1, p. 553-564.
Hillier, B., Penn, A., Hanson, J., Grajewski, T., and Xu, J. (1993), ‘Natural movement; or configuration and attraction in urban pedestrian movement’. In: Environment and Planning (B), Vol. 20, n.1, p. 29-66.
Hillier, B. (2009), ‘Spatial Sustainability in cities. Organic Patterns and sustainable forms’. In: Koch, D., Marcus, L. and Steen, J. (eds.), Proceedings of the Seventh International Space Syntax Symposium, Stockholm: Royal Institute of Technology, p. K01:1- K01:20.
Hillier, B. (1996). ‘Cities as movement economies’. In: Urban Design International v.1, n.1. Holanda, F. (2007), ‘Be aware of local properties’. In: Kubat, A. S., Ertekin, Ö., Güney, Y.I. and Eyübolou, E. (eds.),
Proceedings of the Sixth International Space Syntax Symposium, Istanbul: ITU Faculty of Architecture, p. 082.1 – 082.14.
Turner, A. (2000), ‘Angular analysis: a method for the quantification of space’. In: Centre for advanced spatial analysis – Working paper series, paper 23.