Embed Size (px)
Citation preview

SOCIO-ECONOMIC INEQUALITY IN SWEDEN AND
FRANCE: A COMPARATIVE STUDY
by
KORINNE BREED
A THESIS
Presented to the Department of International Studies and the Robert D. Clark Honors College
in partial fulfillment of the requirements for the degree of Bachelor of Arts
June 2016

An Abstract of the Thesis of
Korinne Breed for the degree of Bachelor of Arts in the Department oflnternational Studies to be taken June 2016
Title: Socio-Economic Inequality in Sweden and France: A Comparative Study
Approved: /f:=$ ~ ~ Dr. Geoff Kennedy
Sweden and France have two of the highest levels of public social spending in
Europe with each country exemplifying a different welfare state model. While there are
some similarities in their labor market and social policies, the differences have
contributed to discrepancies between the two countries in terms of socio-economic
inequality. This study features the most recent data available to analyze factors
contributing to socio-economic inequality, specifically income inequality, labor market
policies, fiscal sustainability, and-educational systems. It compares visual
representations of this data to reports by governing bodies and international
organizations. Findings indicate that Sweden generally has lower levels of inequality
and better well-being than France, but not in all cases. Sweden faces high
unemployment for the low skilled and migrants, as well as problematic educational
outcomes. France's social transfers are poorly targeted. Its government has struggled to
control its increasing debt, and is facing calls to reduce its social services. This research
is significant because inequality is correlated with poverty, leads to social exclusion,
and can even curb economic growth.
ii

iii
Acknowledgements
I would like to thank Dr. Geoff Kennedy for inspiring me to pursue research in
the field of political economy and for his support as my Primary Advisor. I would also
like to thank Dr. Ellen Scott and Dr. Barbara Mossberg for their guidance and
encouragement as members of my Defense Committee.
I am sincerely grateful for the many additional faculty members in International
Studies, Economics, the Honors College, and other departments whose challenging
coursework prepared me to undertake this project.
A huge thanks to my supervisors at the American English Institute who have
been incredibly understanding throughout my thesis writing process. I am forever
grateful for the opportunities they have given me and the expertise they have shared.
I cannot imagine writing my thesis without the backing of my friends and
family. Thank you for building me up, calming me down, and reminding me that I have
the capability to accomplish whatever I set my mind to.
Most of all, I extend my utmost appreciation to my parents for making my
college experience possible and for their unyielding faith in me. They have always
pushed me to excel, and in the end what I wanted most was to make them proud. This
work is dedicated to them.

iv
Table of Contents
Introduction 1
What is a welfare state? 2
Definition of a welfare state 2
Categories of welfare states 2
Country Background 4
Origins of the Swedish welfare model 4
Sweden: Essential facts 5
Origins of French welfare model 5
France: Essential facts 6
Retrenchment and Inequality 8
Welfare state retrenchment 8
Introduction to socio-economic inequality 9
Methods 11
Results 12
Income and transfers 12
Gini coefficient 12
Targeting of social transfers 13
Labor force statistics 15
Labor force participation rate 15
Employment 17
Unemployment 18
Wages 23
Job protection and dismissal procedures 26
Fiscal sustainability 29
Education 35
Conclusion 40 Bibliography 41
v
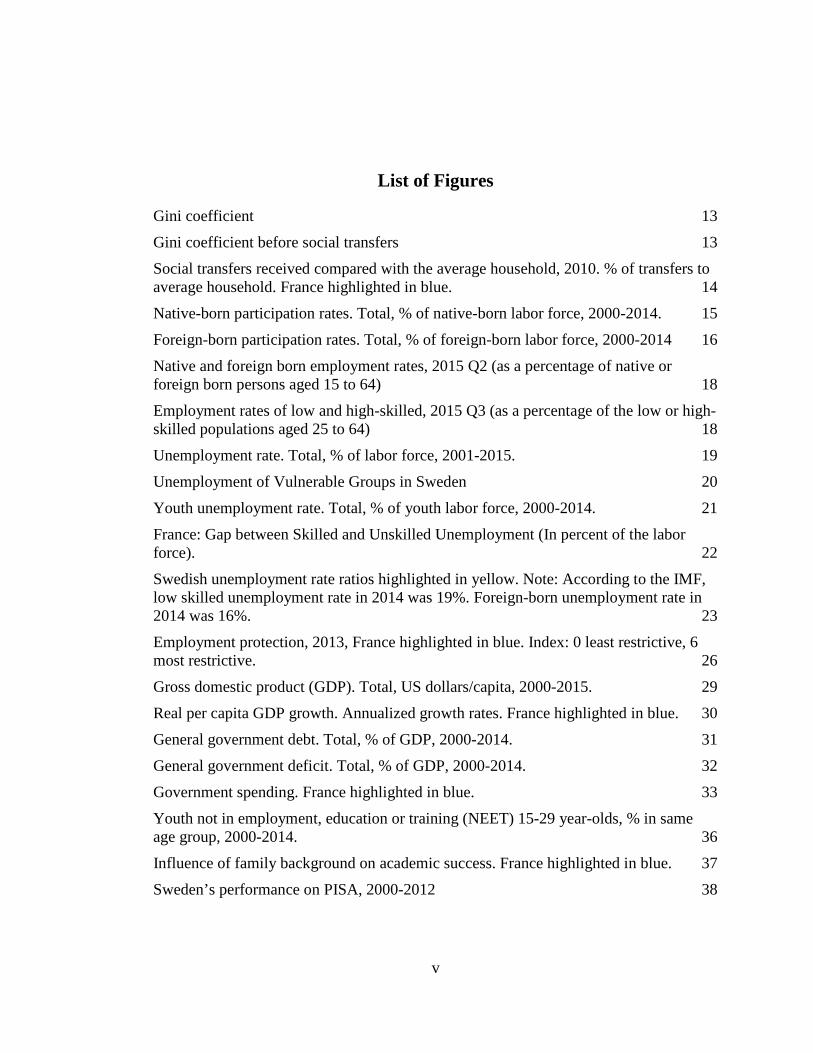
List of Figures
Gini coefficient 13 Gini coefficient before social transfers 13 Social transfers received compared with the average household, 2010. % of transfers to average household. France highlighted in blue. 14 Native-born participation rates. Total, % of native-born labor force, 2000-2014. 15 Foreign-born participation rates. Total, % of foreign-born labor force, 2000-2014 16 Native and foreign born employment rates, 2015 Q2 (as a percentage of native or foreign born persons aged 15 to 64) 18 Employment rates of low and high-skilled, 2015 Q3 (as a percentage of the low or high-skilled populations aged 25 to 64) 18 Unemployment rate. Total, % of labor force, 2001-2015. 19 Unemployment of Vulnerable Groups in Sweden 20 Youth unemployment rate. Total, % of youth labor force, 2000-2014. 21 France: Gap between Skilled and Unskilled Unemployment (In percent of the labor force). 22 Swedish unemployment rate ratios highlighted in yellow. Note: According to the IMF, low skilled unemployment rate in 2014 was 19%. Foreign-born unemployment rate in 2014 was 16%. 23 Employment protection, 2013, France highlighted in blue. Index: 0 least restrictive, 6 most restrictive. 26 Gross domestic product (GDP). Total, US dollars/capita, 2000-2015. 29 Real per capita GDP growth. Annualized growth rates. France highlighted in blue. 30 General government debt. Total, % of GDP, 2000-2014. 31 General government deficit. Total, % of GDP, 2000-2014. 32 Government spending. France highlighted in blue. 33 Youth not in employment, education or training (NEET) 15-29 year-olds, % in same age group, 2000-2014. 36 Influence of family background on academic success. France highlighted in blue. 37 Sweden’s performance on PISA, 2000-2012 38

Introduction
Economic inequality has drawn wide attention in the media in the 21st century.
The gap between the rich and the poor has grown at an alarming rate in the last few
decades. Countries representing various models of welfare states mitigate inequality
differently. However, even those which have implemented extensive welfare policies
are not immune to the risks of inequality. Sweden and France exemplify two different
types of welfare models. This thesis analyzes how the differences in these models have
influenced the disparities in well-being of their citizens. Specifically, this study explores
the impact of factors influencing socio-economic inequality in Sweden and France.
This study utilizes the models from Gøsta Esping-Andersen’s The Three Worlds
of Welfare Capitalism (1990) to explain the fundamentals of welfare states. The
development of the French and Swedish welfare states is also discussed, along with
some basic facts about the two countries. The study introduces the topic of welfare state
retrenchment, which has the potential to lead to greater inequality. Next, the study
examines data related to socio-economic inequality in France and Sweden. The thesis
analyzes labor market outcomes for various vulnerable groups, including migrants,
youth, and low-skilled workers. Explanation is given of certain labor market policies
and reforms which impact the vulnerable groups and can exacerbate inequality. The
study also reviews the contribution of governments’ financial sustainability and
educational systems to socio-economic inequality.
2
What is a welfare state?
Definition of a welfare state
A welfare state is a type of government which assumes responsibility for
securing the basic welfare of its citizens (Esping-Andersen, 1990, p. 19). Esping-
Andersen points out that the amount of social expenditure does not necessarily reflect a
country's commitment to welfare. There are many other factors at play, such as the
strength of different institutions, ideologies of political parties, and global dynamics.
Asbjørn Wahl asserts that welfare states traditionally have three main components:
"collective insurance schemes (the social security system), general welfare services
(health care, education), [and] social benefits (social assistance, housing benefits and so
on)" (2011, p. 40).
A concept that is commonly discussed in conjunction with the welfare model is
de-commodification of labor. Esping-Andersen says "de-commodification occurs when
a service is rendered as a matter of right, and when a person can maintain a livelihood
without reliance on the market" (1990, p. 21-22). This is connected to the welfare model
because under this system certain people receive assistance at times when they are not
employed, such as after losing their job or having children. Various types of welfare
systems allow different levels of de-commodification.
Categories of welfare states
Esping-Andersen identifies three categories of welfare states called liberal,
corporatist, and social-democratic models. The French model exemplifies the
corporatist model, and the Swedish system is an example of the social-democratic

3
category. The liberal model only provides assistance for those with demonstrable need
(Esping-Andersen, 1990, p. 22). Esping-Andersen says this reduces some of the de-
commodifying effect, and actually reinforces the market because benefits are modest
and often come with a stigma. This model is the most common in Anglo-Saxon
countries such as the United States, United Kingdom, and Australia. The liberal model
stratifies the population into those receiving welfare and those in the work force
(Esping-Andersen, 1990, p. 27).
The corporatist model is exemplified by benefits that are large but nearly
entirely dependent on contributions from employment (Esping-Andersen, 1990, p. 22).
Countries such as Germany, France, Austria, and Italy are examples of this model. In
this model the state is concerned with upholding existing class status differences and
traditional family models. Therefore, it is not very redistributive in its actions and
certain areas of benefits are underdeveloped such as day care and other services for
dual-income families (Esping-Andersen, 1990, p. 27).
The final model which Esping-Andersen distinguishes is the social-democratic
regime. Under this model all citizens receive assistance from the state regardless of their
prior earnings or position in society. Esping-Andersen explains that values of social
democracy and equality made up the basis for the creation of the social democratic
regime, especially in the Nordic countries. Because everyone in the society universally
benefits and relies on the welfare state, they will hopefully feel inclined to contribute,
especially in the form of taxes (Esping-Andersen, 1990, p. 28).

4
Country Background
Origins of the Swedish welfare model
Steve Valocchi notes that though social scientists disagree on exactly when the
Swedish welfare state took form, he believes that "class interests and state structures
during Sweden's early industrialization provided the context within which working-
class welfare politics were made and remade from the 1930s to present day" (1992, p.
190). He says that Sweden's welfare policies were more interventionist and universal
compared to other European countries at the same time as their industrialization. One
perspective states that agrarian interests also held much political power in the early
twentieth century, and this shaped pension laws into becoming more universal than in
other countries.
Some members of the upper class attempted to reform social insurance laws in
order to benefit only industrial workers, but farmers were able to block this legislation.
In 1913 pension laws that would benefit all citizens were passed and financed through
taxes (Valocchi, 1992, p. 190). This all played into the development of the Social
Democratic political party which represented the values of the working class. Due to the
work of the Social Democratic party and Agrarian party, the ‘universal benefits’ aspect
of the Swedish welfare model was established by the late 1940s (Huber and Stephens,
2001, p. 119). The welfare state continued to expand through the 1980s in the form of
public health, education, and welfare employment (Huber and Stephens, 2001, p. 125).
These extreme expansions came with the price of some of the highest tax rates in the
world.

5
Sweden: Essential facts
The Central Intelligence Agency’s World Factbook says that Sweden has a
population of about 9,801,616 (2016). GDP per capita on a purchasing power parity
basis is about $48,000. The labor force is approximately 5.184 million people. A total of
2% of the labor force works in agriculture, 12% in industry and 86% in services as of
2014. The CIA estimates that 14% of the population was below the poverty line in
2011. The net migration rate in 2015 was about 5.42 migrants per 1000 people. In 2014
the share of foreign-born persons in Sweden was 16.5% of the population (Sweden:
Selected Issues, 2015, p. 6). Sweden has a well-organized process for integrating
migrants and utilizes many active labor market policies, yet unemployment rates are
still high for migrants and the low skilled.
Origins of French welfare model
France's welfare system developed later than Sweden's. Timothy B. Smith
explains that before 1914 there was a great distrust in France of German-style social
legislation due to their perceived special treatment of certain citizens (2004, p. 26). This
may have prevented them from enacting certain types of welfare legislation. At this
time France only excelled in child and maternal welfare. Their social programs reached
only a small number of citizens; they did not reach 70% of the population until the early
1970s. National unemployment insurance policy was passed in 1958, which was already
significantly later than many other European countries. However, Smith notes that this
does not mean France was entirely lagging behind in its welfare policies. In fact, they
spent the average amount on welfare in comparison with other European countries
(Smith, 2004, p. 26).

6
Michel R. Gueldry explains that France's welfare state, the Etat-Providence,
consists of two main components: The Sécurité Sociale and compensation for
unemployment (2001, p. 91). The Social Security system was created in 1945 with "a
public health plan, a retirement plan, family allowances and workers' disability
compensation." Compensation for unemployment consists of a professional insurance
plan that all workers contribute to and a state solidarity plan for previously employed
individuals who are no longer eligible for unemployment insurance (Gueldry, 2001, p.
91). Gueldry says that droits sociaux (social rights) are a crucial part of French political
culture alongside civil and political rights (2001, p. 92).
One aspect of the French welfare model which sets it apart from that of Sweden
is that it primarily benefits the middle and upper economic classes. As Timothy B.
Smith suggests in France in Crisis, "French social policy is not geared towards the
interests of those stuck in poverty and the 2.5 million unemployed” (2004, p. 6). Money
is instead channeled to the so-called "insiders," the comfortably employed, who make
up the welfare state's main supporters.
France: Essential facts
According to the Central Intelligence Agency’s World Factbook, France has a
population of about 66,553,766 (2016). GDP per capita on a purchasing power parity
basis is about $41,400. The labor force is approximately 29.84 million people. A total of
3% of the labor force works in agriculture, 21.3% in industry and 75.7% in services as
of 2014. The CIA estimates that 8.1% of the population was below the poverty line in
2012. The net migration rate in 2015 was about 1.09 migrants per 1000 people.

7
The French Directorate General of the Treasury (DG Trésor) states that “young
people, blue-collar workers, and low-wage earners have been the hardest hit by the
crisis” (Vincent, 2011, p. 5). The country has struggled to control its mounting
governmental debt, leading to calls for the government to reduce its social spending.

8
Retrenchment and Inequality
Welfare state retrenchment
Welfare state retrenchment implies the cutting back of social services that
commonly comprise a welfare state. Sometimes retrenchment is considered quantitative
changes in expenditure, but it can also mean changes in the nature of the institutions
which make up the welfare model. There is much controversy among academics over
whether welfare state retrenchment indeed is a real phenomenon, or a figment of
concerned socialists' imaginations.
Authors of Development and Crisis of the Welfare State find through a study of
multiple welfare states that "the mean annual increase in almost all of the expenditure
measures was higher for the 1970s than for the Golden age and then lower for the 1980s
than for either of the two earlier periods" (Huber and Stephens, 2001, p. 207). Also, "a
comparison of the mean annual changes indicates that expenditure was increasing much
faster in the 1970s in all regime types, whereas in the 1980s average annual increases in
revenue exceeded those of expenditure in all three regime types" (Huber and Stephens,
2001, p. 207). These two pieces of evidence support the claim of retrenchment.
In Political Economy of European Welfare Capitalism, Colin Hay and Daniel
Wincott suggest that if we consider retrenchment to be a reduced share of GDP being
put towards welfare, evidence shows that retrenchment does not exist. However, if "we
see the welfare state as an institution…for responding to societal needs…then we are
unlikely to feel able to conclude, on the basis of stable or even increasing levels of

9
expenditure alone, that no retrenchment has occurred" (Hay & Wincott, 2012, p. 105).
This implies that levels of and access to benefits have changed.
In The Rise and Fall of the Welfare State Asbjørn Wahl says that even if data
doesn't show signs of retrenchment, the neoliberal ideals of deregulation and increased
power of capital are slowly chipping away at the model. He discusses the increasing
exclusion of people from participation in work and society at large, as well as increased
inequality and poverty in European countries (Wahl, 2011, p. 9-10). Even conservative
politicians are backing the welfare model or attempting to take credit for it. Wahl says
we must be wary of this because they have ulterior motives.
To summarize, there is potential quantitative evidence of welfare state
retrenchment in the late 20th century. Even without quantitative evidence there are signs
of retrenchment or encroaching retrenchment in the form of increasing inequality,
poverty, and reforms to reduce social services.
Introduction to socio-economic inequality
Socio-economic inequality is defined as “differences in a range of economic and
social factors that influence well-being, including income, education and health”
(European Commission, 2010, p. 9). Measures of socio-economic inequality relate to
three sources of income: market earnings from paid employment, social transfers
through taxes and benefits, and non-cash resources (European Commission, 2010, p. 9).
Research by the European Commission shows that economic inequality and poverty are
interrelated. This is one reason why studying socio-economic inequality, not just
earnings inequality, is important.

10
A concept that is related to socio-economic inequality is social exclusion. Social
exclusion is “the process through which individuals or groups become excluded from
full participation in the society within which they live” (European Commission, 2010,
p. 10). While poverty is defined in economic terms and focuses on material depravation,
social exclusion has economic, social, and political aspects. Welfare states can enact
policies which promote greater social inclusion through redistribution of resources and
other policies.
This analysis will focus on inequality for certain vulnerable groups such as
youth, migrants, and low-skilled workers. According to the OECD Glossary of
Statistical Terms, migrants are considered long-and short-term immigrants or emigrants,
residents returning after or leaving for working abroad, and nomads (2003).

11
Methods
This research takes the form of a Small-N style comparative study with two
countries as cases (Halperin & Heath, 2012, p. 208). The independent variables include
the various policies enacted by the governments of the two countries. The dependent
variables are the outcomes of inequality experienced by certain vulnerable groups of the
populations.
The study utilizes both quantitative and qualitative sources to analyze these
variables. The quantitative sources are accessible in the form of graphs and statistics.
The qualitative sources provide context to the quantitative sources and give a
comprehensive perspective of socio-economic inequality in Sweden and France. The
results are organized into sections regarding overall income inequality, labor market
policies, fiscal sustainability, and education.
Data
The graphs in the following sections highlight various aspects of the French and
Swedish societies related to inequality. They show the state of each country’s economy
currently or over time using the most recent data available. Some of the graphs include
data from other countries in the European Union or OECD for comparison. Data were
retrieved from the Organisation of Economic Co-operation and Development (OECD),
International Monetary Fund (IMF) and Eurostat, the official statistical office of the
European Union. Some graphs were constructed by the author using data collected from
the previously mentioned organizations. Other graphs were retrieved from reports
written by the same organizations and other sources.

12
Results
Income and transfers
Gini coefficient
The graphs featured below demonstrate the change in Gini coefficient over time.
The Gini coefficient is one of the most basic measurements of income inequality in a
country. The European Commission defines the Gini coefficient as “the relationship of
cumulative shares of the population arranged according to the level of equivalised
disposable income, to the cumulative share of the equivalised total disposable income
received by them” (Eurostat, 2016). A Gini coefficient of 100 represents complete
income inequality (one person has all of the income in a society), and a coefficient of
zero represents complete equality. The second graph shows the Gini coefficient before
the effects of social transfers (with pensions). Pensions in Europe are a source of
income for retired people from the state. In the second graph below pensions are
considered part of social transfers, not income, therefore their effect is not included.
In comparison to other countries in the European Union, Sweden’s Gini
coefficient falls in the lower half and France’s falls in the upper half (OECD Data,
2012). Social transfers play a large equalizing role in both countries. Sweden has a
higher level of income inequality than France does before social transfers. Because of
its welfare model Sweden is able to mitigate inequality to a higher degree than does
France.

13
Gini coefficient
Gini coefficient before social transfers
Targeting of social transfers
As seen previously in the graph “Gini coefficient before social transfers,” social
transfers play an important role in reducing inequality in Sweden and France. The IMF
says that “taxes and transfers reduce income inequality [in France]…by about 40
percent. Over 60 percent of this reduction is achieved by transfers” (France: Selected
Issues, 2015, p. 3). Even though these redistributive benefits exist, there is also evidence
of very poor targeting of social transfers in France. “27 percent of social benefits (in

14
cash) go to the highest income quintile, and less than 17 percent to the lowest income
quintile” (France: Selected Issues, 2015, p. 3). Explained a different way, the OECD
says that as of 2010 “in France the bottom three deciles received slightly less than the
average household, while the top three deciles enjoyed about a quarter more than the
average” (OECD Economic Surveys: France 2015, 2015, p.19). This point is illustrated
in the graph below.
Social transfers received compared with the average household, 2010. % of transfers to
average household. France highlighted in blue.
Source: OECD Economic Surveys: France 2015, 2015, p. 19.
This evidence is aligned with Esping-Andersen’s argument that countries following the
corporatist model are more concerned with upholding existing economic class
differences; whereas the social democratic model provides assistance for all citizens
regardless of their social status (Esping-Andersen, 1990, p. 27-28). Esping-Andersen
also mentions that just because a country spends a large amount on social expenditure,
it does not mean the country is equally committed to the welfare of all of its citizens.
This concept applies to the French welfare model.

15
Labor force statistics
Labor force participation rate
The two graphs below exhibit the native-born and foreign-born participation
rates in the labor market compared to other countries in the European Union. The
participation rate counts those ages 15-64 who are both employed or unemployed in the
respective group (native or foreign-born) out of the total group of that age (OECD Data,
2016). In 2014 Sweden’s native-born participation rate was 82.9% and its foreign-born
participation rate was 75.9%. France’s native-born participation rate was 71.8% and its
foreign-born participation rate was 67.5% (OECD Data, 2016).
Native-born participation rates. Total, % of native-born labor force, 2000-2014.
Source: OECD (2016), Native-born participation rates (indicator). doi:
10.1787/afed6c9e-en (Accessed on 02 April 2016)

16
Foreign-born participation rates. Total, % of foreign-born labor force, 2000-2014
Source: OECD (2016), Foreign-born participation rates (indicator). doi:
10.1787/fa75b43e-en (Accessed on 02 April 2016)
The Swedish labor force is experiencing compositional changes, especially in
the form of foreigners joining the population. According to the OECD, matching
workers to vacant jobs is becoming increasingly difficult, which reflects the change in
labor force composition (OECD Economic Surveys: Sweden 2015, 2015, p. 8). Foreign
born are contributing to the employment rate, but this is outpaced by their addition to
the total labor supply (Sweden: Selected Issues, 2015, p.4). Asylum seekers take a long
time to integrate into the Swedish labor market, which means “average employment
gaps are higher in Sweden compared with other Nordic peers” (Sweden: Selected
Issues, 2015, p.9).
The Migration Integration Policy Index says that about one fourth of France’s
population has an immigrant background (MIPEX, 2015). The organization says that
there are major problems regarding labor market integration and mobility for non-EU
immigrants in France. Many potential jobs are legally closed to non-EU immigrants.
Further, they often cannot access the training and study grants, or receive official

17
recognition for their foreign qualifications, which are needed to land a job. These are
some of the reasons why France has one of the lowest foreign-born participation rates in
the European Union (OECD Data, 2016).
Employment
Employment rates are high for middle and high-skilled workers and low for low-
skilled workers in Sweden (OECD Economic Surveys: Sweden 2015, 2015, p. 28). High
and medium-skilled people accounted for all of the employment gains in Sweden from
2004 to 2014. There was a five percent decrease in the employment of low-skilled
people in the same time period (Sweden: Selected Issues, 2015, p. 5). Nonetheless,
Sweden has higher employment rates for the low skilled and foreign born than France
as demonstrated in the graphs below. Sweden has the second highest level of spending
on labor market policies in the OECD (two percent of GDP) (Sweden: Selected Issues,
2015, p. 13). Active labor market policies include training, wage subsidy schemes, and
job matching services. These policies contribute to higher levels of employment than in
France, especially for the low skilled and migrants.

18
Native and foreign born employment rates, 2015 Q2 (as a percentage of native or
foreign born persons aged 15 to 64)
Source: OECD, Building more resilient..., 2015
Employment rates of low and high-skilled, 2015 Q3 (as a percentage of the low or high-
skilled populations aged 25 to 64)
Source: OECD, Building more resilient…, 2015
Unemployment
The following graph shows the total unemployment rates in Sweden and France,
defined as the percentage of the labor force – not the total working age population –
which is unemployed (OECD Data, 2016). In order to be classified as unemployed a
person must have reported that they are without work and have actively been trying to

19
find work in the last four weeks. Neither the unemployment rate nor the total labor force
include people who have become discouraged and stopped looking for work. As the
OECD points out, this means that even if the unemployment rate drops or stabilizes, a
country’s economy may not have improved (OECD Data, 2016).
Unemployment rate. Total, % of labor force, 2001-2015.
Source: OECD (2016), Unemployment rate (indicator). doi: 10.1787/997c8750-en
(Accessed on 01 April 2016)
Sweden’s overall unemployment rate was 7.4% in 2015 (OECD Data, 2016).
Unemployment levels are higher for vulnerable groups in Sweden. “The share of the
unemployed who have been out of a job for more than one year is about half the OECD
average, with low-skilled workers and immigrants affected the most” (OECD Economic
Surveys: Sweden 2015, 2015, p. 8). The Swedish Public Employment Service (PES)
says “the share of vulnerable groups among the unemployed reached close to 70 percent
in April 2015” (Sweden: Selected Issues, 2015, p. 4). The IMF breaks this down into
greater detail: “Unemployment [in Sweden] increased by more than 100,000 over the
past decade, of which the low skilled accounted for about 80 percent; whereas the

20
foreign accounted for more than one-third of the rise in unemployment” (Sweden:
Selected Issues, 2015, p. 5). The graph below visualizes this inequality.
Unemployment of Vulnerable Groups in Sweden
Source: Sweden: Selected Issues, 2015, p. 4.
France has high levels of structural unemployment. In 2008 France’s total
unemployment level was 7.5%, whereas in April 2015 it was 10.5% (France: Selected
Issues, 2015, p. 9). Two in every five unemployed in France are out of work for over a
year (France: Selected Issues, 2015, p. 9). The level of youth unemployment in France
is slightly less than 24%. Sweden’s youth unemployment rate used to be much lower
than France’s but has since increased to a similar level, as seen in the graph below. The
youth employment rate is measured in the same way as the total unemployment rate
except it is calculated as a percentage of the youth labor force (ages 15-24).

21
Youth unemployment rate. Total, % of youth labor force, 2000-2014.
Source: OECD (2016), Youth unemployment rate (indicator). doi: 10.1787/c3634df7-en
(Accessed on 01 April 2016)
The gap between skilled and unskilled employment in France has grown over
time, as shown by the graph below. In 2012 the unemployment rate of low skilled
people was almost three times that of skilled workers. Ample unemployment benefits
may have reduced incentives to work.

22
France: Gap between Skilled and Unskilled Unemployment (In percent of the labor
force).
Source: France: Selected Issues, 2015, p. 10.
Unemployment benefits account for three percent of general government
spending in France (France: Selected Issues, 2015, p. 5). Multiple aspects of the system
reduce reliance on the market and thus have led to de-commodification of labor. French
workers can receive unemployment benefits after four months of service. An
unemployed person can reject their first job offer since receiving benefits, without a
penalty (France: Selected Issues, 2015, p. 13). “The system also does not provide for a
progressive reduction in benefits (degressivity) for long-term unemployed to encourage
their rapid return to the labor market” (France: Selected Issues, 2015, p. 13). Further,
the condition that an unemployment benefit recipient must be actively searching for a
job isn’t always strictly enforced. In 2015 the French employment agency said
inspectors would be deployed to enforce job search requirements for the unemployed.
These factors, among others such as costly dismissal procedures and skill mismatches,
contribute to France’s high unemployment levels (France: Selected Issues, 2015, p. 11).
Low-skilled and foreign born unemployment rate ratios are higher in Sweden
than in France as seen in the graphs below. This could be because there is less
protection for temporary contracts in Sweden than in France, and in Sweden “temporary
jobs have tended to become more concentrated on vulnerable groups, especially
immigrants and those with low qualifications” (OECD Economic Surveys: Sweden
2015, 2015, p. 30). Additionally, “Sweden’s competitiveness increasingly hinges on
high-value-added services involving high skills and intangible capital intensity” (OECD

23
Economic Surveys: Sweden 2015, 2015, p. 19-20). In a knowledge-intensive economy,
“employment is more polarised between highly paid professional and managerial work
and more routine manual service work” (European Commission, 2010, p. 25). Because
the economy is so focused on high level skills, it can be difficult for migrants and the
low skilled to enter the labor force. However, once they gain the skills necessary to
participate in the economy, high protection for permanent contracts might help them
stay employed. This could be one reason why employment rates for the low skilled and
migrants are higher in Sweden than in France, yet unemployment rate ratios are high as
well.
Swedish unemployment rate ratios highlighted in yellow. Note: According to the IMF,
low skilled unemployment rate in 2014 was 19%. Foreign-born unemployment rate in
2014 was 16%.
Source: Sweden: Selected Issues, 2015, p. 3.
Wages
Both countries have made efforts to reduce wage inequality. High entry-level
wages and low wage dispersion are apparent in the data for both Sweden and France.
Even though inequality has been reduced for some groups, it is controversial whether
the economic outcomes have benefited those most vulnerable in the two societies.

24
Collective bargaining causes high entry-level wages in Sweden. Sweden does
not have a national minimum wage; instead, “the roughly 600 collective agreements
include multiple minimum wages that are differentiated by sector, occupation, age and
experience…In 2011, these collectively negotiated wage floors were, on average, 80
percent of average wages,” which is high compared to national minimum wages
elsewhere (Sweden: Selected Issues, 2015, p. 10). There is not much leeway to adjust
for local conditions.
Because of high wages sectors that would typically employ low-skill workers
are small. In general, Sweden prefers to increase workers’ skills to match the
productivity and wages it is looking for instead of paying low wages for low skills and
productivity (Sweden: Selected Issues, 2015, p. 11). As shown in the graph below
Sweden has the lowest wage dispersion in the OECD. France also has very low wage
dispersion.
Dreger, López-Bazo, Ramos, Royuela, and Suriñach discuss the relationship
between wage dispersion and income inequality (2014). Because the wage dispersion

25
measures the variation in wages throughout a society, a lower dispersion means greater
equality. However, the authors note that there are other factors which affect income
inequality. Transfers make a large difference, as seen in the earlier graph “Gini
coefficient before social transfers.”
The IMF says that real wages are growing in France despite high unemployment
(France: Selected Issues, 2015, p. 10). The French minimum wage has risen by 14%
since 2007, and GDP has only grown 12% in nominal terms (France: Selected Issues,
2015, p. 11). The OECD argues that the high wages for unskilled labor undermine
employment prospects (OECD Economic Surveys: France 2015, 2015, p. 28). The
belief that vulnerable groups become “priced out of the job market” is extremely
common in orthodox economic theory (Howell, Azizoglu, & Okatenko, 2012, p. 2).
Scholars from the New School for Social Research have challenged this
perspective. They explain that France started the salaire minimum de croissance
(SMIC) in 1970, which established minimum wage increases at set intervals over time
(Howell, Azizoglu, & Okatenko, 2012, p. 1). The SMIC has effectively “compressed
the bottom of the wage distribution and substantially raised the hourly pay of minimum
wage workers” (Howell, Azizoglu, & Okatenko, 2012, p. 2). Their findings do not show
evidence of worsened employment performance as the SMIC has risen.

26
Job protection and dismissal procedures
Employment protection, 2013, France highlighted in blue. Index: 0 least restrictive, 6
most restrictive.
Source: OECD Economic Surveys: France 2015, 2015, p. 24.
There is a difference in the degree of employment protection for permanent and
temporary contracts in France and Sweden. The graphs above show indexes of
restriction levels in OECD countries in 2013. Both Sweden and France have high levels
of protection for permanent contracts. However, France has a high level of protection
for temporary contracts while Sweden has a low level.
The IMF notes that protections for temporary contacts in Sweden have been
reduced over time (Sweden: Selected Issues, 2015, p. 12). This asymmetry between
permanent and temporary contracts has been shown to raise unemployment rates for
migrants and low-skilled individuals. Transitions from temporary to permanent
positions are fairly high in Sweden, yet “transitions from temporary employment to
inactivity (and to a lesser extent to unemployment) are also common” (Sweden:
Selected Issues, 2015, p. 12).

27
The large degree of protection for permanent contracts (contrat à durée
indéterminée) leads to duality between contract types in the French labor market
(OECD Economic Surveys: France 2015, 2015, p. 7). Despite previous reforms the
French labor market is still segmented. In 2010 only 24% of French employees on
fixed-term contracts transitioned to permanent positions, and “permanent contracts
(CDIs) accounted for no more than 16% of new hires in 2013 (23% in 2009)” (OECD
Economic Surveys: France 2015, 2015, p. 26). The segmentation especially hurts the
most vulnerable groups in the labor force such as young people. According to the IMF,
in 2012 “55 percent of workers below 25 [were] hired on a fixed-term contract”
(France: Selected Issues, 2015, p. 9). Fixed-term contracts are often very short term.
Costly dismissal procedures discourage permanent contract job growth in
France. Companies must have strong justification to dismiss an employee in order to
comply with employment protection legislation (France: Selected Issues, 2015, p. 12).
This system encourages fixed-term contracts because their termination costs are set,
unlike those for permanent positions which are up for lengthy negotiation in labor
courts. Mutually agreed termination, or rupture conventionnelle, is defined as
voluntarily leaving employment with the agreement of the employer and receiving
“formula-based termination compensation.” (France: Selected Issues, 2015, p. 12).
However, the OECD notes that this improvement isn’t enough to make up for the rules
and inefficiencies which are hindering labor flexibility (OECD Economic Surveys:
France 2015, 2015, p. 2).
The OECD argues that simplifying lay off procedures for permanent contracts
would help reduce duality in the French labor market; however, they add that “this

28
increased flexibility must remain associated with good income protection for workers
between jobs” (OECD Economic Surveys: France 2015, 2015, p. 27). Reforms
introduced in June 2015 attempt to promote job growth through a number of measures
often pertaining to small-and medium-sized enterprises (SMEs). Bertrand Bissuel
discusses the measures in the article “Le plan Valls pour amadouer les PME” for Le
Monde (2015). One of the measures limits severance payments for employees by
implementing a scale based on an employee’s seniority and the size of the company.
This is supposed to make the labor market more flexible and hopefully increase
employment levels.
Temporary contracts can be a beneficial approach to transition workers to
permanent jobs, yet in Sweden they have “become more concentrated on vulnerable
groups” (OECD Economic Surveys: Sweden 2015, 2015, p. 30). Moreover, in France
the probability of accessing employer-sponsored training while having a temporary
contract is extremely low (OECD Economic Surveys: France 2015, 2015, p. 26). This
can make it more difficult for people in vulnerable groups to gain skills in order to
transition to a permanent job. However, as Gaëlle Picut notes, not all workers with
temporary contracts wish to find permanent employment. “Au contrario, au Danemark,
en France, en Suisse, en Suède et au Royaume-Uni, un cinquième de travailleurs
temporaires ne souhaitent pas un employ permanent” (2015). Picut says that according
to OECD statistics one fifth of workers with temporary contracts do not want a
permanent job.

29
Fiscal sustainability
The OECD says that “Sweden is among the few countries where output is now
well above its level before the 2008 global financial and economic crisis” (OECD
Economic Surveys: Sweden 2015, 2015, p. 4). Output as a whole has bounced back but
gross domestic product (GDP) per capita has not grown significantly (OECD Economic
Surveys: Sweden 2015, 2015, p. 8). The graph below shows GDP per capita levels for
Sweden and France over time.
Gross domestic product (GDP). Total, US dollars/capita, 2000-2015.
Source: OECD (2016), Gross domestic product (GDP) (indicator). doi:
10.1787/dc2f7aec-en (Accessed on 26 April 2016)
France’s real per capita GDP growth is structurally weak and one of the lowest
in the OECD, compared to Sweden which is in the upper half of the OECD growth rates
rankings as shown in the graph below (OECD Economic Surveys: France 2015, 2015,
p. 6). GDP is supposed to measure the overall health of the economy, but GDP per
capita does not provide a sufficient measurement of inequality. It is calculated by
dividing the total GDP by the population. This is an indication of the average income
level, but does not offer any information about the welfare of different economic
classes.

30
Real per capita GDP growth. Annualized growth rates. France highlighted in blue.
Source: OECD Economic Surveys: France 2015, 2015, p. 6.
The relationship between inequality and economic growth is complicated. According to
studies conducted by the European Commission, there is “no evidence that
redistributive policies adversely affects growth or that growth leads to lower levels of
inequality…The projects report robust evidence that high levels of initial inequality
tend to reduce growth” (2010, p. 24). This shows that it is possible for countries to
value and promote equality while maintaining economic growth and financial stability.
Sweden has achieved this more successfully than has France.
The following graphs show the general government debt and deficit for Sweden
and France over time. Other European Union countries are shown in gray for
comparison. The debt-to-GDP ratio demonstrates if a government’s financial situation
is sustainable. (OECD Data, 2016). The change in debt shows the total impact of
deficits. In other words, the debt shows the accrued deficits over time. As of 2014
France’s debt was 119% of GDP and Sweden’s debt was 62% of GDP (OECD Data,
2014).

31
General government debt. Total, % of GDP, 2000-2014.
Source: OECD (2016), General government debt (indicator). doi: 10.1787/a0528cc2-en
(Accessed on 01 April 2016)
The deficit is “the fiscal position of government after accounting for capital
expenditures” (OECD Data, 2016). The deficit can either exhibit net lending or net
borrowing. As of 2014 France’s deficit was 4 percent of GDP and Sweden’s deficit was
1.6% of GDP (OECD Data, 2014).

32
General government deficit. Total, % of GDP, 2000-2014.
Source: OECD (2016), General government deficit (indicator). doi: 10.1787/77079edb-
en (Accessed on 01 April 2016)
The OECD reports that Sweden’s fiscal policy is strong and sustainable (OECD
Economic Surveys: Sweden 2015, 2015, p. 12-13). Even though the government did not
meet their desired fiscal balance due to a period of weak growth, their deficit level is
within European Union regulatory limits (OECD Economic Surveys: Sweden 2015,
2015, p. 13).
33
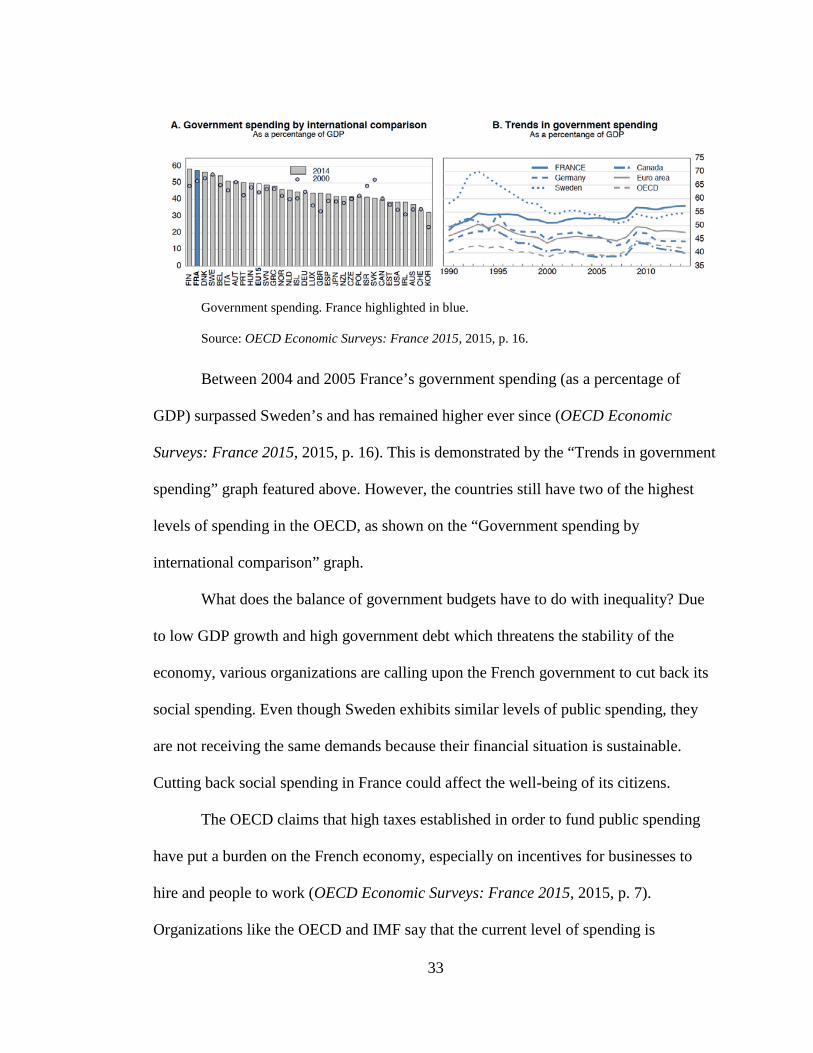
Government spending. France highlighted in blue.
Source: OECD Economic Surveys: France 2015, 2015, p. 16.
Between 2004 and 2005 France’s government spending (as a percentage of
GDP) surpassed Sweden’s and has remained higher ever since (OECD Economic
Surveys: France 2015, 2015, p. 16). This is demonstrated by the “Trends in government
spending” graph featured above. However, the countries still have two of the highest
levels of spending in the OECD, as shown on the “Government spending by
international comparison” graph.
What does the balance of government budgets have to do with inequality? Due
to low GDP growth and high government debt which threatens the stability of the
economy, various organizations are calling upon the French government to cut back its
social spending. Even though Sweden exhibits similar levels of public spending, they
are not receiving the same demands because their financial situation is sustainable.
Cutting back social spending in France could affect the well-being of its citizens.
The OECD claims that high taxes established in order to fund public spending
have put a burden on the French economy, especially on incentives for businesses to
hire and people to work (OECD Economic Surveys: France 2015, 2015, p. 7).
Organizations like the OECD and IMF say that the current level of spending is

34
financially unsustainable. Pensions are France’s largest social expenditure at 14% of
GDP. In 2002 the effective retirement age was 58.5, which is low by international
standards (France: Selected Issues, 2015, p. 4). France’s public sector wage bill is high
at 13% of GDP (France: Selected Issues, 2015, p. 6). Immense local government
expenditure is commonly identified as a major problem.
Multiple layers (referred to as mille-feuille) and overlapping of government
institutions have led to inefficiency in public policies and staffing (OECD Economic
Surveys: France 2015, 2015, p. 7). Loose budget constraints and overall fiscal
autonomy of local governments created this excess in spending. The French national
government has attempted to contain local governmental spending yet thus far has not
achieved much success.
The French government has had issues communicating reforms to the public:
“The potential beneficiaries of the French labour market and pension reforms – i.e. the young and low skilled – have often been reluctant to support them, because their benefits are poorly understood and seen as uncertain…France has many vested interests who benefit from a variety of economic rents and privileges. Older generations who have enjoyed substantial income gains and high social mobility may well see necessary reforms as an arbitrary paradigm shift” (OECD Economic Surveys: France 2015, 2015, p. 22-23).
The French people are concerned about the retrenchment of social services which have
been in place for many years. They question whether the reforms are truly in their best
interest. It remains to be seen if these reforms will have the effect desired by the OECD
and IMF, or if they will exacerbate inequalities and reduce French quality of life.

35
Education
The European Commission asserts that educational systems can “either
contribute to social cohesion or exacerbate exclusion” (2010, p. 27). Both Sweden and
France face major problems with their educational systems. The OECD says “only 5%
of Swedish teachers report that their profession is valued in society, as against 60% in
Finland” (OECD Economic Surveys: Sweden 2015, 2015, p. 26). Swedish student
performance on a major international assessment has declined over the past decade. The
French vocational system isn’t accessible for all citizens, and evidence shows that
intergenerational educational mobility is poor. Moreover, both Sweden and France have
a percentage of young people who are not employed nor in education or training
(NEET).
The NEET indicator measures the percentage of youth in this situation out of the
total number of youth in the corresponding age group. These youths are not only at risk
of poverty and social exclusion but are “lacking the skills to improve their economic
situation” (OECD Data, 2016). The graph below shows the NEET levels in Sweden and
France over time compared to other European Union countries.

36
Youth not in employment, education or training (NEET) 15-29 year-olds, % in same
age group, 2000-2014.
Source: OECD (2016), Youth not in employment, education or training (NEET)
(indicator). doi: 10.1787/72d1033a-en (Accessed on 01 April 2016)
The IMF suggests that structural change in the French economy has produced
skill mismatches in the labor market. There are also major differences in skills between
generations because of technological change (OECD Economic Surveys: France 2015,
2015, p. 27). Youth may not have the skills which are in demand, and “the professional
training system, which costs about 1.4 percent of GDP, has been slow to respond to the
needs of job seekers.” (France: Selected Issues, 2015, p. 12-13). The French vocational
education system has a large amount of resources but isn’t producing results for the
people most in need (OECD Economic Surveys: France 2015, 2015, p. 7). The OECD
states that the low skilled have trouble accessing vocational training.
37
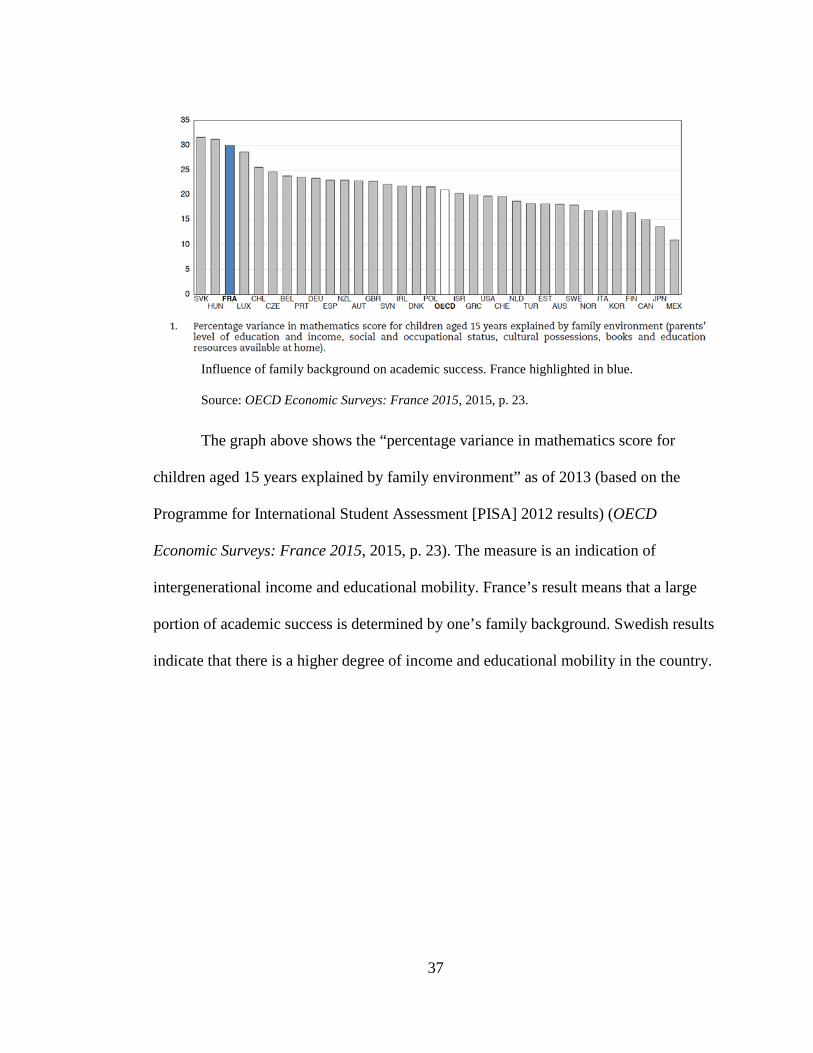
Influence of family background on academic success. France highlighted in blue.
Source: OECD Economic Surveys: France 2015, 2015, p. 23.
The graph above shows the “percentage variance in mathematics score for
children aged 15 years explained by family environment” as of 2013 (based on the
Programme for International Student Assessment [PISA] 2012 results) (OECD
Economic Surveys: France 2015, 2015, p. 23). The measure is an indication of
intergenerational income and educational mobility. France’s result means that a large
portion of academic success is determined by one’s family background. Swedish results
indicate that there is a higher degree of income and educational mobility in the country.
38
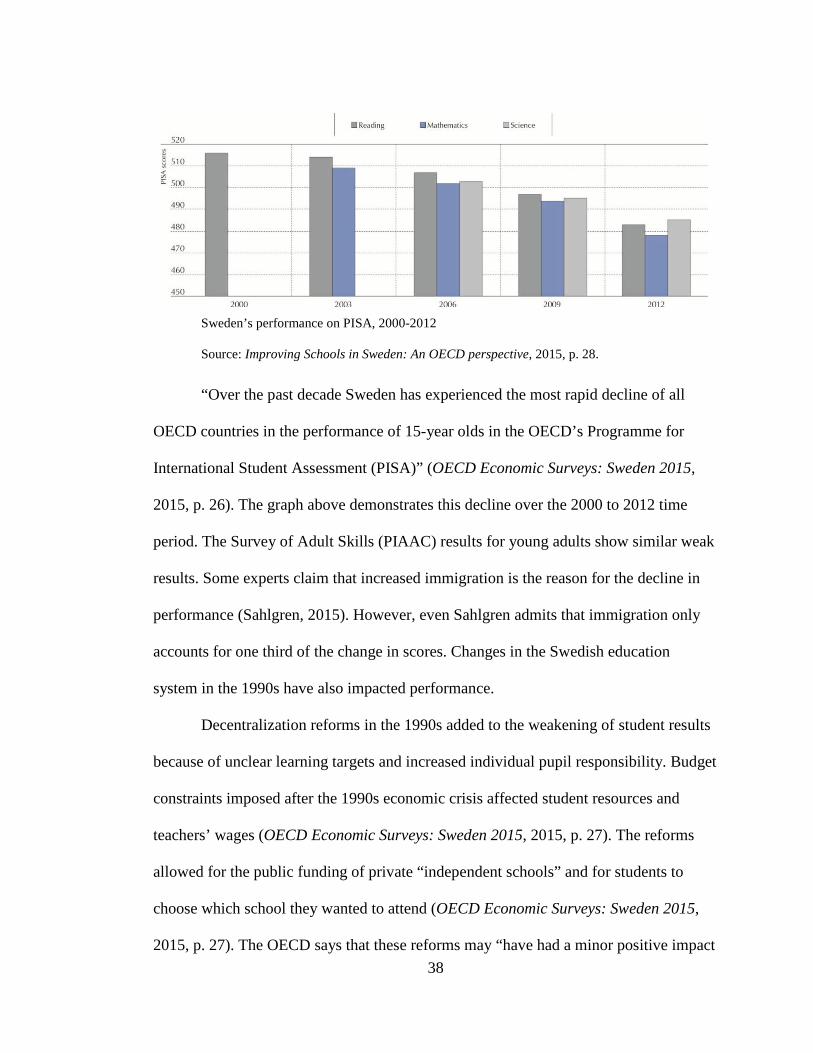
Sweden’s performance on PISA, 2000-2012
Source: Improving Schools in Sweden: An OECD perspective, 2015, p. 28.
“Over the past decade Sweden has experienced the most rapid decline of all
OECD countries in the performance of 15-year olds in the OECD’s Programme for
International Student Assessment (PISA)” (OECD Economic Surveys: Sweden 2015,
2015, p. 26). The graph above demonstrates this decline over the 2000 to 2012 time
period. The Survey of Adult Skills (PIAAC) results for young adults show similar weak
results. Some experts claim that increased immigration is the reason for the decline in
performance (Sahlgren, 2015). However, even Sahlgren admits that immigration only
accounts for one third of the change in scores. Changes in the Swedish education
system in the 1990s have also impacted performance.
Decentralization reforms in the 1990s added to the weakening of student results
because of unclear learning targets and increased individual pupil responsibility. Budget
constraints imposed after the 1990s economic crisis affected student resources and
teachers’ wages (OECD Economic Surveys: Sweden 2015, 2015, p. 27). The reforms
allowed for the public funding of private “independent schools” and for students to
choose which school they wanted to attend (OECD Economic Surveys: Sweden 2015,
2015, p. 27). The OECD says that these reforms may “have had a minor positive impact

39
on results, but may have contributed to inequalities” (OECD Economic Surveys:
Sweden 2015, 2015, p. 27). Policies starting in 2015 planned to increase support for
disadvantaged schools (OECD Economic Surveys: Sweden 2015, 2015, p. 27). There
have been problems with municipalities not allocating enough resources to “schools
with a disadvantaged socio-economic mix of pupils” (OECD Economic Surveys:
Sweden 2015, 2015, p. 27). The European Commission warns that “differential barriers
to education and training relating to educational systems and styles” can widen
inequalities (2010, p. 25). Sweden and France must ensure that their educational
systems benefit everyone in their societies.

40
Conclusion
Summary of results
Overall, Sweden has lower levels of socio-economic inequality than France.
This is aligned with Esping-Andersen’s hypothesis about the corporatist and social-
democratic models of welfare states. However, the Swedish economy still suffers from
high unemployment of migrants and the low skilled. Their education system is not
producing adequate outcomes for students. On the other hand, the French system of
social transfers is not targeted to those most in need. France has high levels of total
unemployment and labor market duality. The French government is encountering calls
to reduce its social spending in the face of rising debt.
Increases in inequality can be attributed in part to labor market changes and the
shift to knowledge-based economies (European Commission, 2010, p. 23). However,
this kind of resulting inequality isn’t inevitable; policies can counteract the effects of
these changes. Nevertheless, the European Commission notes that it will take more than
redistribution of resources to maintain the ideal welfare state. “Policy discussion tends
to focus on narrow redistributive actions…with little attention to the broader economic
and social policy tools that may reverse the increase in inequality” (European
Commission, 2010, p. 24). Sweden and France must make use of all of the policy tools
at their disposal in order to improve social inclusion, mitigate inequality, and sustain the
high standards of living for which they are known.

41
Bibliography
Bissuel B., Bonnefous B., & Roger, P. “Le plan valls pour amadouer les PME.” Le Monde. June 9, 2015.
Central Intelligence Agency. (2016). “France.” World factbook. Retrieved from https://www.cia.gov/library/publications/the-world-factbook/geos/fr.html
Central Intelligence Agency. (2016). “Sweden.” World factbook. Retrieved from https://www.cia.gov/library/publications/the-world-factbook/geos/sw.html
Dreger, C., López-Bazo, E., Ramos, R., Royuela, V., & Suriñach, J. (2014). Income inequality: Wage dispersion in the EU. Brussels, Belgium: European Union.
El-Ganainy, A.A. & Ho, G. (2015). Sweden: Selected Issues. Washington D.C.: International Monetary Fund.
Esping-Andersen, G. (1990). The three worlds of welfare capitalism. Cambridge: Polity Press.
European Commission. (2016). Eurostat Data. Retrieved from http://ec.europa.eu/eurostat/data/database
European Commission. (2010). Why socio-economic inequalities increase? Facts and policy responses in Europe. European Commission. Retrieved from https://ec.europa.eu/research/social-sciences/pdf/policy_reviews/policy-review-inequalities_en.pdf
Gueldry, M. (2001). France and European integration: Toward a transnational policy. Westport, CT: Praeger Publishers.
Hallaert, J.J., Perez-Ruiz, E., Gorbanyov, M., & Kongsamut, P. (2015). France: Selected Issues. Washington D.C.: International Monetary Fund.
Halperin, S., & Heath, O. (2012). Political research: Methods and practical skills. Oxford: Oxford University Press.
Hay, C., & Wincott, D. (2012). The political economy of European welfare capitalism. New York: Palgrave Macmillan.
Howell, D., Azizoglu, B., & Okatenko, A. (2012). Confronting low pay: Minimum wage policy and employment in the U.S. and France. New York, NY: The New School for Social Research.
Huber, E., & Stephens, J. (2001). Development and crisis of the welfare state. Chicago: The University of Chicago Press.

42
MIPEX. (2015). France. Migration Integration Policy Index. Retrieved from http://www.mipex.eu/france
OECD. (2015). “Building more resilient and inclusive labour markets. How does your country compare? OECD labour and employment ministerial meeting 15 January 2016.” OECD. [PowerPoint slides]. Retrieved from https://www.oecd.org/employment/ministerial/How-does-your-country-compare.pdf
OECD. (2015). Improving schools in Sweden: An OECD perspective. Retrieved from http://www.oecd.org/edu/school/Improving-Schools-in-Sweden.pdf
OECD. (2016). OECD data. Retrieved from https://data.oecd.org
OECD. (2015). OECD economic surveys: France 2015. Paris: OECD Publishing. DOI: http://dx.doi.org/10.1787/eco_surveys-fra-2015-en
OECD. (2015). OECD economic surveys: Sweden 2015. Paris: OECD Publishing. DOI: http://dx.doi.org/10.1787/eco_surveys-swe-2015-en
OECD. (2003). Glossary of statistical terms. Retrieved from https://stats.oecd.org/glossary/index.htm
Picut, G. “Les inégalités ont augmenté face à la qualité de l’emploi en Europe.” Le Monde. 27 February 2015.
Sahlgren, G.H. (2015). “Immigration helps explain Sweden’s school trouble.” The Spectator. 10 August 2015.
Smith, T. (2004). France in crisis: Welfare, inequality and globalization since 1980. Cambridge: Cambridge University Press.
Valocchi, S. (1992). “The origins of the Swedish welfare state: A class analysis of the state and welfare politics" in Social Problems. Oxford Press, Vol. 39, No. 2, p. 189-200.
Vincent, J.P. (Ed.). (2011). Trésor-Economics, No. 83. Ministère de l’Économie, des Finances et de l’Industrie.
Wahl, A. (2011). The rise and fall of the welfare state. London: Pluto Press.