Embed Size (px)
Citation preview

www.fuse.ac.uk
Prevalence & socio-demographic
correlate of “active transport” in
the UK
Jean Adams
Newcastle University

WHO definition of physical activity
• In adults aged 18–64, physical activity includes, in the
context of daily, family, and community activities:
• transportation (walking or cycling),
• occupational,
• household chores,
• leisure time physical activity (walking, dancing, gardening,
hiking, swimming),
• play, games, sports or planned exercise
http://www.who.int/dietphysicalactivity/physical-activity-recommendations-18-64years.pdf

Benefits of physical activity
• People who are more active have lower rates of:
• all-cause mortality
• coronary heart disease
• high blood pressure
• stroke
• type 2 diabetes
• colon cancer
• breast cancer
• depression
• hip fracture
• People who are more active are more likely to:
• achieve weight maintenance
• have a healthy body mass
http://www.who.int/dietphysicalactivity/physical-activity-recommendations-18-64years.pdf
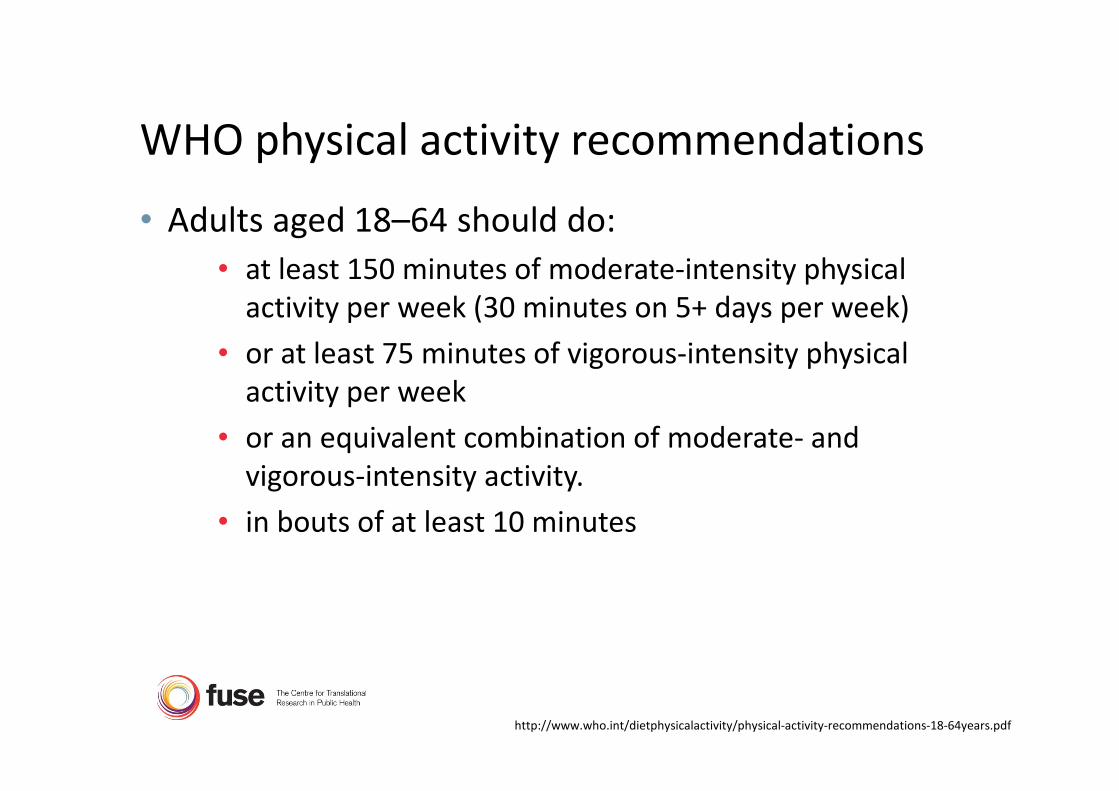
WHO physical activity recommendations
• Adults aged 18–64 should do:
• at least 150 minutes of moderate-intensity physical
activity per week (30 minutes on 5+ days per week)
• or at least 75 minutes of vigorous-intensity physical
activity per week
• or an equivalent combination of moderate- and
vigorous-intensity activity.
• in bouts of at least 10 minutes
http://www.who.int/dietphysicalactivity/physical-activity-recommendations-18-64years.pdf

http://www.ic.nhs.uk/webfiles/publications/HSE/HSE08/HSE_08_Summary_of_key_findings.pdf

Active transport
• Any self propelled movement for transport reasons
• walking/cycling to work
• walking the ‘school run’
• walking/cycling to the shops
• walking/cycling to visit friends/relatives
• Overcomes known barriers to physical activity
• time
• money
• equipment
• not “the sporty type”

How common is active transport?
• New Zealand• 10% of adults actively commute if their journey is <5km
• Canada• 36% of university students actively commute 10+ journeys
per week
• Australia• 71% of adults walked for transport in the last 2 weeks
• USA• 28% of adults walk for at least 10 mins per day
• 14% of adults spend time walking for transport

Research questions
• How common is active transport in the UK?
• Who does active transport?
• What contribution does active transport make to physical activity?

Measuring physical activity & active transport
• Questionnaires• quick & cheap for participants & researchers
• misunderstand of ‘physical activity’, ‘exercise’
• memory
• optimism & social desirability bias
• Transport diaries• fairly intensive for participant
• expensive to code
• more comprehensive
• Activity monitors• expensive
• fairly intensive for participant

UK Time Use Survey, 2005
• Part of National Statistics Omnibus Survey
• monthly random probability sample of private addresses, random individual aged 16+
• time use module in Feb, June, Sept, Nov 2005
• time use in 10 min slots for 24 hours
• 30 predefined codes
• completed during interview
• Time use as a measure of physical active & active transport
• no specific focus on physical activity
• all time must be accounted for
• no ambiguity over what counts as ‘exercise’ or ‘physical activity’


Time use survey, travel codes
• Mode of travel
• car/van
• walk/jog
• pedal bike
• bus/coach
• rail/tube
• other
• Reason for travel
• to escort someone else
on a journey that would
not otherwise have been
made
• purely for enjoyment
• to commute to/from
paid work
• for shopping
• for other reasons

Time use survey, travel codes
• Mode of travel
• car/van
• walk/jog
• pedal bike
• bus/coach
• rail/tube
• other
• Reason for travel
• to escort someone else
on a journey that would
not otherwise have been
made
• purely for enjoyment
• to commute to/from
paid work
• for shopping
• for other reasons

Methods
• UK Time Use Survey, 2005• any active transport – yes/no
• 30 mins+ of active transport – yes/no
• Characteristics of individuals (n = 3933)• gender
• age (25+ only)
• in paid employment – yes/no
• household access to car/van – yes/no
• age at completion of full time education - <15yrs, 15-18 yrs, >18 yrs
• social class – routine/manual, intermediate, managerial/professional

Results – overall & gender

Results – age

Results – employment & car/van

Results – employment & car/van

Results – logistic regression, any active transport
Any active transport
Odds ratio (95% CI) p-value
Female (vs male) 1.07 (0.91 to 1.26) 0.41
Age (years) 0.99 (0.98 to 0.99) <0.001
In paid employ (vs not) 0.94 (0.77 to 1.15) 0.53
Car/van (vs no car/van) 0.37 (0.30 to 0.45) <0.001
Social class (cf routine) 0.91 (0.83 to 1.01) 0.09
Education (cf <15 years) 1.13 (0.96 to 1.34) 0.15

Results – logistic regression, 30 mins+ active
transport
30 min+ active transport
Odds ratio (95% CI) p-value
Female (vs male) 0.98 (0.81 to 1.19) 0.84
Age (years) 0.98 (0.98 to 0.99) <0.001
In paid employ (vs not) 0.79 (0.63 to 1.00) 0.05
Car/van (vs no car/van) 0.36 (0.29 to 0.45) <0.001
Social class (cf routine) 0.82 (0.73 to 0.93) 0.002
Education (cf <15 years) 1.33 (1.09 to 1.63) 0.005

Conclusions
• Those who take part in any active transport are more likely to be:
• younger
• no access to car/van
• Those who take part in at least 30 mins of active transport per day are more likely to be:
• younger
• not in employment
• no access to car/van
• lower social class
• more education

Conclusions
• 28% of UK adults take part in active transport
• 19% of UK adults take part in at least 30 mins of
active transport per day
• 67% of UK adults who take part in any active
transport take part in 30 mins of active transport
• i.e. they are sufficiently active through active transport
alone

Acknowledgements
The work was undertaken by Fuse, a UKCRC Public Health Research: Centre of Excellence. Funding from the
British Heart Foundation, Cancer Research UK, Economic and Social Research council, Medical Research Council,
and the Department of Health, under the auspices of the UK Research Collaboration, is greatly acknowledged.
Adams (2010) The prevalence and socio-demographic
correlated of “active transport” in the UK: analysis of
the UK time use survey 2005 Preventive Medicine
50:199-203
www.fuse.ac.uk