Embed Size (px)
Citation preview
Silicon coupled-resonatoroptical-waveguide-based biosensorsusing light-scattering pattern recognitionwith pixelized mode-field-intensitydistributionsJiawei Wang, Zhanshi Yao, Ting Lei* & Andrew W. Poon
Photonic Device Laboratory, Department of Electronic and Computer Engineering, The Hong Kong University of Science andTechnology, Clear Water Bay, Kowloon, Hong Kong.
Chip-scale, optical microcavity-based biosensors typically employ an ultra-high-quality microcavity andrequire a precision wavelength-tunable laser for exciting the cavity resonance. For point-of-careapplications, however, such a system based on measurements in the spectral domain is prone to equipmentnoise and not portable. An alternative microcavity-based biosensor that enables a high sensitivity in anequipment-noise-tolerant and potentially portable system is desirable. Here, we demonstrate theproof-of-concept of such a biosensor using a coupled-resonator optical-waveguide (CROW) on asilicon-on-insulator chip. The sensing scheme is based on measurements in the spatial domain, and onlyrequires exciting the CROW at a fixed wavelength and imaging the out-of-plane elastic light-scatteringintensity patterns of the CROW. Based on correlating the light-scattering intensity pattern at a probewavelength with the light-scattering intensity patterns at the CROW eigenstates, we devise apattern-recognition algorithm that enables the extraction of a refractive index change, Dn, applied upon theCROW upper-cladding from a calibrated set of correlation coefficients. Our experiments using an8-microring CROW covered by NaCl solutions of different concentrations reveal a Dn of ,1.5 3 1024
refractive index unit (RIU) and a sensitivity of ,752 RIU-1, with a noise-equivalent detection limit of ,6 310-6 RIU.
Due to the increasing demand of healthcare, various chip-scale, label-free optical biochemical sensingtechnologies have been proposed and studied over the past two decades1–5. Specifically, optical micro-resonator-based biochemical sensors have been attracting significant attention over the past decade.
Conventional biochemical sensing techniques using optical microresonators typically employ two ways to quan-titatively derive real-time information of the analyte on the microresonator surface. One is to monitor ultra-high-quality (ultra-high-Q) cavity resonance wavelength shifts in the transmission spectrum through scanning theinput laser wavelength in the proximity of the resonance6–14. The other is to monitor the transmission intensitychange around a cavity resonance at a fixed wavelength7. However, both approaches working in the spectraldomain typically require a precision spectrum scanning system such as a wavelength-tunable diode laser.
Previously, our research group has proposed an alternative microresonator-based biochemical sensing schemeworking in the spatial domain by using a coupled-resonator optical waveguide (CROW) excited at a fixedwavelength and monitoring the analyte-induced discrete modulations of the pixelized light-scattering intensitypatterns among the CROW eigenstates15,16. Such a sensing scheme only requires a relatively simple optical read-out system including a fixed-wavelength laser and a camera. The simultaneous imaging of the spatially distributedcoupled microresonators allows such a scheme to be more immune to the equipment noise that equally affectseach microresonator but does not change the relative intensity distribution. Other researchers have also recentlystudied CROWs through imaging the out-of-plane elastic light scattering intensity patterns in the far field17–19.Nonetheless, our initial proposal fell short in measuring only discrete modulations in refractive index applied onthe CROW surface, and only considered an ideal CROW structure.
OPEN
SUBJECT AREAS:IMAGING AND SENSING
OPTICAL SENSORS
Received7 July 2014
Accepted1 December 2014
Published18 December 2014
Correspondence andrequests for materials
should be addressed toA.W.P. (eeawpoon@
ust.hk)
*Current address:Institute of Micro and
Nano Optics, Collegeof Optoelectronic
Engineering,Shenzhen University,Shenzhen 518060,
China.
SCIENTIFIC REPORTS | 4 : 7528 | DOI: 10.1038/srep07528 1
Here, we propose and demonstrate as a proof of concept animproved CROW-based biochemical sensing scheme working inthe spatial domain using albeit imperfect coupled microring resona-tors on the silicon-on-insulator (SOI) platform. The choice of theSOI platform in 1550 nm wavelengths is primarily motivated by thematuring complementary metal-oxide-semiconductor (CMOS)-compatible SOI technology available to silicon photonics. We devisea correlation analysis of the pixelized mode-field-intensity distribu-tions to extract from a library of calibrated correlation coefficients arefractive index change, Dn, applied upon the CROW surface from aknown cladding refractive index, n0. We model the CROW sensorassuming an imperfect CROW with fabrication-imperfection-induced randomly disordered coupled microresonators. Our experi-ments using a SOI 8-microring CROW in 1550 nm wavelengthsreveal a Dn of ,1.5 3 1024 refractive index unit (RIU). Upon aspecific probe wavelength, we demonstrate a sensitivity in terms ofcorrelation coefficient change per unit RIU of ,752 RIU21 and anoise-equivalent detection limit (NEDL) of ,6 3 1026 RIU.
ResultsPrinciple. Fig. 1 illustrates the proposed CROW-based biochemicalsensor. Fig. 1(a) shows the device schematic of a SOI CROW sensorcomprising eight identically designed coupled microring resonatorssymmetrically coupled to input and output bus waveguides in anadd-drop filter configuration. The out-of-plane elastic lightscattering of the CROW is imaged by a top-view objective lens intoan infrared (IR) camera in the far field. The sensor is integrated with amicrofluidic channel on the top.
In the case that the dimensional disorders are small and the ident-ically designed coupled microresonators are singlemode, the numberof CROW eigenstates within each transmission band equals to thenumber of microresonators. A perfect CROW without dimensionaldisorders only exhibits at half of its complete set of eigenstates (withinhalf of the transmission band) distinctive mode-field intensity distri-butions. The pair of symmetric and anti-symmetric intercavity-coup-ling-induced split modes have identical mode-field intensitydistributions but distinctive mode-field amplitude distributions and
eigenfrequencies. In practice, each coupled microresonator displayscertain deviations from the design due to fabrication imperfection.This breaks the symmetry between the pair of symmetric and anti-symmetric split modes. An imperfect CROW thus exhibits distinctivemode-field amplitude and intensity distributions among its completeset of eigenstates. Fig. 1(b) illustrates for an imperfect 8-elementCROW the inhomogeneously broadened transmission bands uponn0 and n0 1 Dn, and the complete set of distinctive eigenstate pix-elized mode-field intensity distributions upon n0, denoted as {Aj}.
We integrate the mode-field intensity of each microring to form apixelized one-dimensional (1D) pattern for the ease of analysis.Trading-off some detailed features of the distributions makes the pat-tern-recognition analysis of the mode-field-intensity distributions com-putationally efficient. Any mode-field amplitude profile at an arbitrarywavelength, lp, within the CROW transmission band upon n0 can begiven by a linear superposition of the complete set of the eigenstatemode-field amplitude distributions upon n0. Therefore, it is conceiv-able to uniquely identify by a correlation analysis any pixelized mode-field intensity profile, B(lp), as shown in inset (i), with {Aj}. Likewise,assuming a weak perturbation, we can uniquely identify by the cor-relation analysis any pixelized mode-field-intensity distribution upon asmall global Dn in the cladding, B9(lp), as shown in inset (ii), with {Aj}.
Correlation analysis and the sensing algorithm. A unique feature inour correlation analysis is the use of the CROW eigenstate mode-field intensity distributions as intrinsic references. We adopt thePearson’s correlation coefficient, r, in order to quantify thecorrelation between a pixelized pattern at an arbitrary wavelengthlp, B(lp), and the eigenstate pixelized patterns at the eigenstatewavelengths lj, A(lj). For an N-element CROW, we define thecorrelation coefficient as follows:
rj(lp)~
PNi
(Ai(lj){Ai(lj))(Bi(lp){Bi(lp))ffiffiffiffiffiffiffiffiffiffiffiffiffiffiffiffiffiffiffiffiffiffiffiffiffiffiffiffiffiffiffiffiffiffiffiffiffiffiffiPNi
(Ai(lj){Ai(lj))2
s ffiffiffiffiffiffiffiffiffiffiffiffiffiffiffiffiffiffiffiffiffiffiffiffiffiffiffiffiffiffiffiffiffiffiffiffiffiffiffiPNi
(Bi(lp){Bi(lp))2
s ð1Þ
Figure 1 | Working principle of CROW-based biochemical sensors in the spatial domain. (a) Schematic of a SOI CROW sensor comprising eight
coupled microring resonators in an add-drop filter configuration. (b) Illustration of an imperfect eight-element CROW, including the inhomogeneously
broadened transmission bands in a buffer solution and a solution under test, and the complete set of eigenstate normalized pixelized mode-field-intensity
distributions upon n0, {Aj}. Insets: (i) Pixelized mode-field-intensity distribution upon n0, B(lp). (ii) Pixelized mode-field intensity distribution upon a
small Dn, B9(lp).
www.nature.com/scientificreports
SCIENTIFIC REPORTS | 4 : 7528 | DOI: 10.1038/srep07528 2
where j 5 1, 2, …, N is the eigenstate number, i 5 1, 2, …, N is thecavity or pixel number, the pixel values Ai and Bi are normalizedrespectively to the total intensity of the entire patterns, the bar signdenotes the mean of the pixelized pattern over the number of pixels.
Previously20, Pearson’s product-moment correlation approach hasbeen used to describe the dependence of a measured optical fieldintensity distribution to calibrated reference intensity distributions.Here, we utilize its property of invariance to change of level and scalein the two distributions under comparison. The Pearson’s correlationcoefficient allows the noise that are common to all pixels, includingequipment noise and waveguide guided power fluctuation, to beeffectively normalized. Thus, this approach allows our sensingscheme to be tolerant to the equipment noise.
Here we detail our sensing algorithm. We first generate a library of{rj9(l0)} calibrated at a wavelength l0 centered at the CROW trans-mission band, with rj9 defined by replacing from equation (1) theB(lp) terms with the pixelized patterns B9(l0). The library is takenover a range of calibratedDn values, with a refractive index interval ofDni, and the range Dnd is given by an integral multiple of Dni. The{rj9(l0)} thus comprises a data array of N (rows) 3 M (columns),where M is given by Dnd/Dni. We then generate a column of {rj(lp)}according to equation (1) for an arbitrary baseline pattern B(lp)upon n0. We next find the closest match of {rj(lp)} with a particularcolumn of {rj9(l0)}. We can derive by interpolation for the baselinepattern a unique equivalent DnB that is associated with the wave-length offset between lp and l0. The interpolation enhances theresolution of DnB, given a certain Dni. We repeat the same processfor the sensing pattern B9(lp) to uniquely extract an equivalent DnB9.Finally, we obtain Dn 5 (DnB9 2 DnB).
In order to uniquely identify {rj(lp)} from the library, we findfrom our modeling that it is sufficient to use only the principalcomponent, rp, and the second-principal component, rs, of {rj(lp)},for N up to at least 28 (See Methods and Supplementary InformationS1–S3). This streamlines the algorithm linearly by a factor of 2/N.
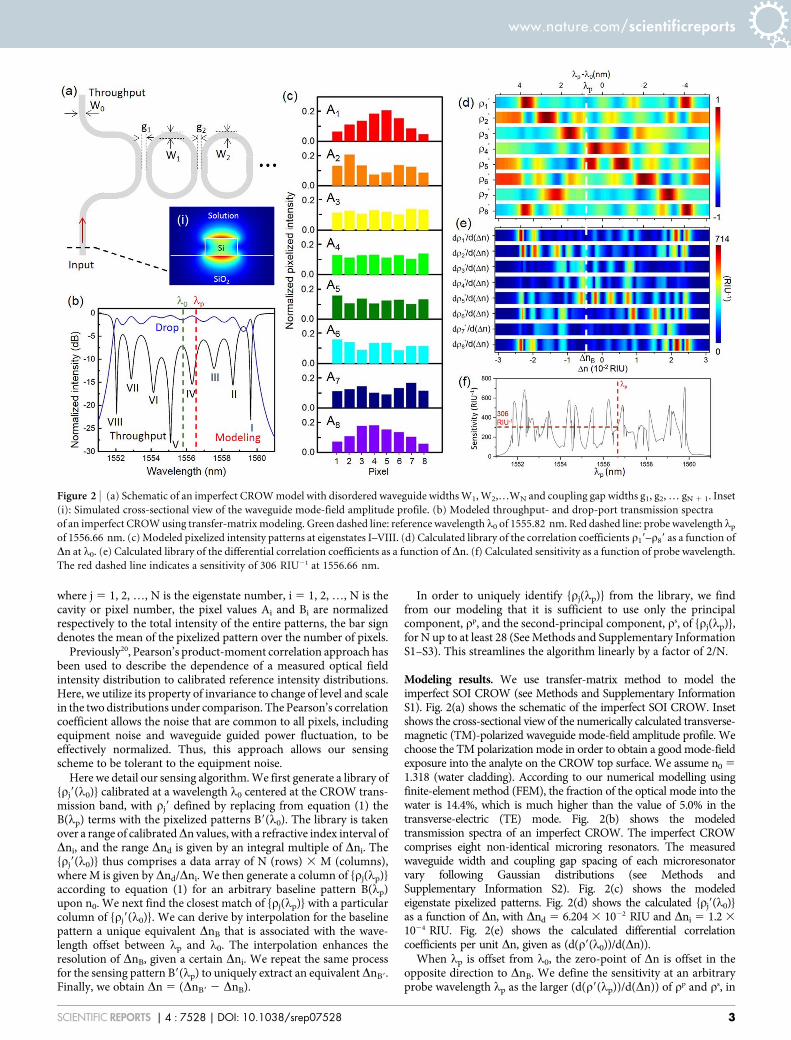
Modeling results. We use transfer-matrix method to model theimperfect SOI CROW (see Methods and Supplementary InformationS1). Fig. 2(a) shows the schematic of the imperfect SOI CROW. Insetshows the cross-sectional view of the numerically calculated transverse-magnetic (TM)-polarized waveguide mode-field amplitude profile. Wechoose the TM polarization mode in order to obtain a good mode-fieldexposure into the analyte on the CROW top surface. We assume n0 5
1.318 (water cladding). According to our numerical modelling usingfinite-element method (FEM), the fraction of the optical mode into thewater is 14.4%, which is much higher than the value of 5.0% in thetransverse-electric (TE) mode. Fig. 2(b) shows the modeledtransmission spectra of an imperfect CROW. The imperfect CROWcomprises eight non-identical microring resonators. The measuredwaveguide width and coupling gap spacing of each microresonatorvary following Gaussian distributions (see Methods andSupplementary Information S2). Fig. 2(c) shows the modeledeigenstate pixelized patterns. Fig. 2(d) shows the calculated {rj9(l0)}as a function of Dn, with Dnd 5 6.204 3 1022 RIU and Dni 5 1.2 3
1024 RIU. Fig. 2(e) shows the calculated differential correlationcoefficients per unit Dn, given as (d(r9(l0))/d(Dn)).
When lp is offset from l0, the zero-point of Dn is offset in theopposite direction to DnB. We define the sensitivity at an arbitraryprobe wavelength lp as the larger (d(r9(lp))/d(Dn)) of rp and rs, in
Figure 2 | (a) Schematic of an imperfect CROW model with disordered waveguide widths W1, W2,…WN and coupling gap widths g1, g2, … gN 1 1. Inset
(i): Simulated cross-sectional view of the waveguide mode-field amplitude profile. (b) Modeled throughput- and drop-port transmission spectra
of an imperfect CROW using transfer-matrix modeling. Green dashed line: reference wavelength l0 of 1555.82 nm. Red dashed line: probe wavelength lp
of 1556.66 nm. (c) Modeled pixelized intensity patterns at eigenstates I–VIII. (d) Calculated library of the correlation coefficients r19–r89 as a function of
Dn at l0. (e) Calculated library of the differential correlation coefficients as a function of Dn. (f) Calculated sensitivity as a function of probe wavelength.
The red dashed line indicates a sensitivity of 306 RIU21 at 1556.66 nm.
www.nature.com/scientificreports
SCIENTIFIC REPORTS | 4 : 7528 | DOI: 10.1038/srep07528 3
units of RIU21. Therefore, we can directly extract the sensitivity forlp from the library of differential correlation coefficients at DnB inFig. 2(e). Fig. 2(f)) shows a highly non-uniform distribution of themodeled sensitivity as a function of lp. The sensitivity spans a rangeof 1.6 RIU21 and 715 RIU21 over the spectral 3 dB-bandwidth withan average sensitivity of ,279 RIU21. It is highly dependent on thechoice of lp. For modeling the sensing in the spatial domain, we firstarbitrarily choose a fixed probe wavelength lp at 1556.66 nm nearthe center of the CROW transmission band (Fig. 2(b)). The sensitiv-ity at lp is ,306 RIU21.
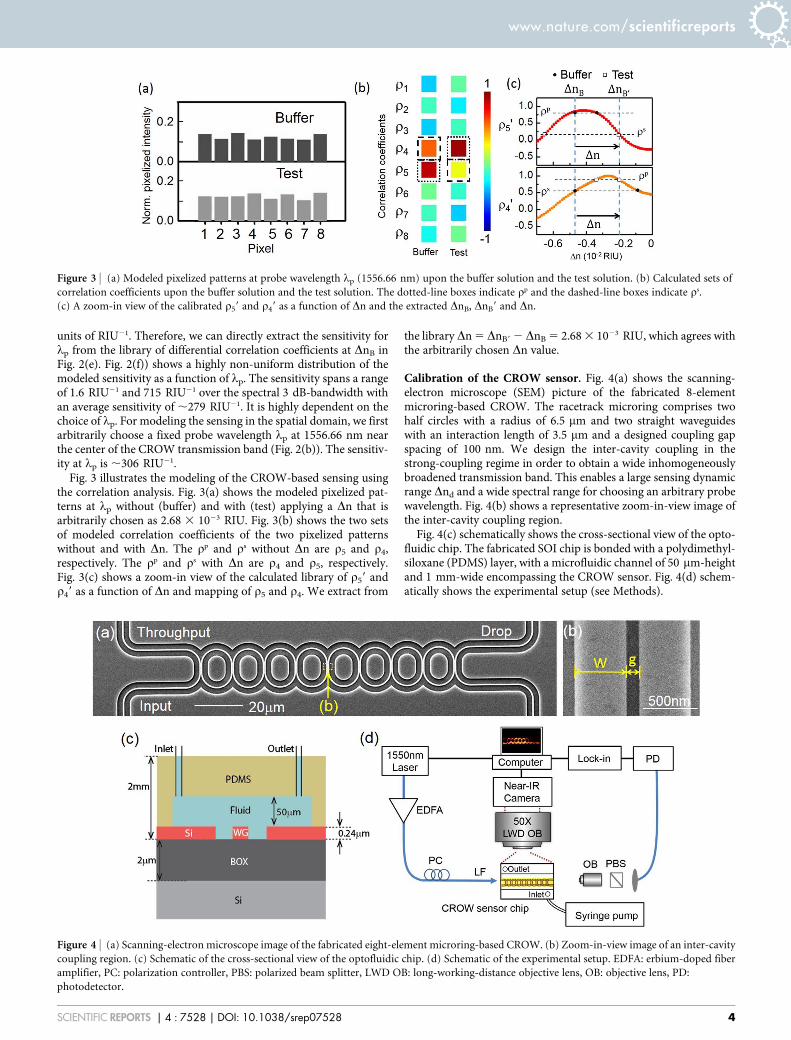
Fig. 3 illustrates the modeling of the CROW-based sensing usingthe correlation analysis. Fig. 3(a) shows the modeled pixelized pat-terns at lp without (buffer) and with (test) applying a Dn that isarbitrarily chosen as 2.68 3 1023 RIU. Fig. 3(b) shows the two setsof modeled correlation coefficients of the two pixelized patternswithout and with Dn. The rp and rs without Dn are r5 and r4,respectively. The rp and rs with Dn are r4 and r5, respectively.Fig. 3(c) shows a zoom-in view of the calculated library of r59 andr49 as a function of Dn and mapping of r5 and r4. We extract from
the library Dn 5 DnB9 2 DnB 5 2.68 3 1023 RIU, which agrees withthe arbitrarily chosen Dn value.
Calibration of the CROW sensor. Fig. 4(a) shows the scanning-electron microscope (SEM) picture of the fabricated 8-elementmicroring-based CROW. The racetrack microring comprises twohalf circles with a radius of 6.5 mm and two straight waveguideswith an interaction length of 3.5 mm and a designed coupling gapspacing of 100 nm. We design the inter-cavity coupling in thestrong-coupling regime in order to obtain a wide inhomogeneouslybroadened transmission band. This enables a large sensing dynamicrange Dnd and a wide spectral range for choosing an arbitrary probewavelength. Fig. 4(b) shows a representative zoom-in-view image ofthe inter-cavity coupling region.
Fig. 4(c) schematically shows the cross-sectional view of the opto-fluidic chip. The fabricated SOI chip is bonded with a polydimethyl-siloxane (PDMS) layer, with a microfluidic channel of 50 mm-heightand 1 mm-wide encompassing the CROW sensor. Fig. 4(d) schem-atically shows the experimental setup (see Methods).
Figure 4 | (a) Scanning-electron microscope image of the fabricated eight-element microring-based CROW. (b) Zoom-in-view image of an inter-cavity
coupling region. (c) Schematic of the cross-sectional view of the optofluidic chip. (d) Schematic of the experimental setup. EDFA: erbium-doped fiber
amplifier, PC: polarization controller, PBS: polarized beam splitter, LWD OB: long-working-distance objective lens, OB: objective lens, PD:
photodetector.
Figure 3 | (a) Modeled pixelized patterns at probe wavelength lp (1556.66 nm) upon the buffer solution and the test solution. (b) Calculated sets of
correlation coefficients upon the buffer solution and the test solution. The dotted-line boxes indicate rp and the dashed-line boxes indicate rs.
(c) A zoom-in view of the calibrated r59 and r49 as a function of Dn and the extracted DnB, DnB9 and Dn.
www.nature.com/scientificreports
SCIENTIFIC REPORTS | 4 : 7528 | DOI: 10.1038/srep07528 4
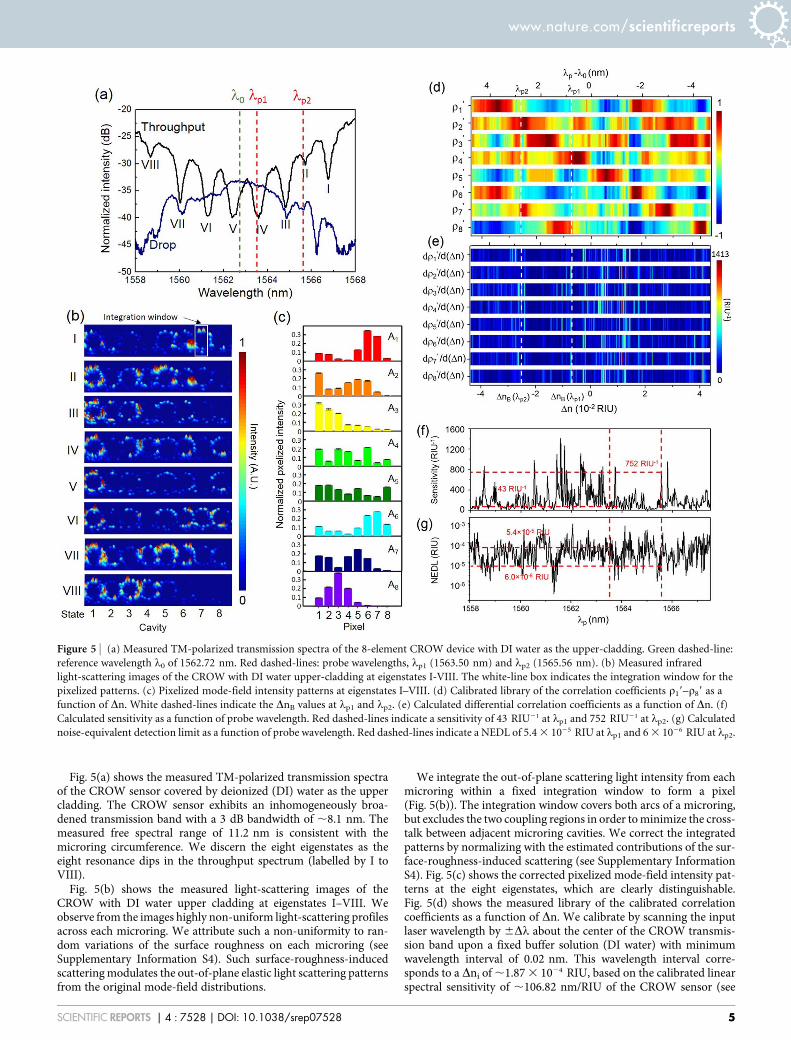
Fig. 5(a) shows the measured TM-polarized transmission spectraof the CROW sensor covered by deionized (DI) water as the uppercladding. The CROW sensor exhibits an inhomogeneously broa-dened transmission band with a 3 dB bandwidth of ,8.1 nm. Themeasured free spectral range of 11.2 nm is consistent with themicroring circumference. We discern the eight eigenstates as theeight resonance dips in the throughput spectrum (labelled by I toVIII).
Fig. 5(b) shows the measured light-scattering images of theCROW with DI water upper cladding at eigenstates I–VIII. Weobserve from the images highly non-uniform light-scattering profilesacross each microring. We attribute such a non-uniformity to ran-dom variations of the surface roughness on each microring (seeSupplementary Information S4). Such surface-roughness-inducedscattering modulates the out-of-plane elastic light scattering patternsfrom the original mode-field distributions.
We integrate the out-of-plane scattering light intensity from eachmicroring within a fixed integration window to form a pixel(Fig. 5(b)). The integration window covers both arcs of a microring,but excludes the two coupling regions in order to minimize the cross-talk between adjacent microring cavities. We correct the integratedpatterns by normalizing with the estimated contributions of the sur-face-roughness-induced scattering (see Supplementary InformationS4). Fig. 5(c) shows the corrected pixelized mode-field intensity pat-terns at the eight eigenstates, which are clearly distinguishable.Fig. 5(d) shows the measured library of the calibrated correlationcoefficients as a function of Dn. We calibrate by scanning the inputlaser wavelength by 6Dl about the center of the CROW transmis-sion band upon a fixed buffer solution (DI water) with minimumwavelength interval of 0.02 nm. This wavelength interval corre-sponds to a Dni of ,1.87 3 1024 RIU, based on the calibrated linearspectral sensitivity of ,106.82 nm/RIU of the CROW sensor (see
Figure 5 | (a) Measured TM-polarized transmission spectra of the 8-element CROW device with DI water as the upper-cladding. Green dashed-line:
reference wavelength l0 of 1562.72 nm. Red dashed-lines: probe wavelengths, lp1 (1563.50 nm) and lp2 (1565.56 nm). (b) Measured infrared
light-scattering images of the CROW with DI water upper-cladding at eigenstates I-VIII. The white-line box indicates the integration window for the
pixelized patterns. (c) Pixelized mode-field intensity patterns at eigenstates I–VIII. (d) Calibrated library of the correlation coefficients r19–r89 as a
function of Dn. White dashed-lines indicate the DnB values at lp1 and lp2. (e) Calculated differential correlation coefficients as a function of Dn. (f)
Calculated sensitivity as a function of probe wavelength. Red dashed-lines indicate a sensitivity of 43 RIU21 at lp1 and 752 RIU21 at lp2. (g) Calculated
noise-equivalent detection limit as a function of probe wavelength. Red dashed-lines indicate a NEDL of 5.4 3 1025 RIU at lp1 and 6 3 1026 RIU at lp2.
www.nature.com/scientificreports
SCIENTIFIC REPORTS | 4 : 7528 | DOI: 10.1038/srep07528 5
Supplementary Information S5). We convert Dl to Dn using thecalibrated linear spectral sensitivity. We choose Dl 5 4.7 nm suchthat the corresponding Dn ranging from 24.40 3 1022 RIU to 4.403 1022 RIU (Dnd 5 8.80 3 1022 RIU), which sequentially yields aunity value for r19 to r89.
Fig. 5(e) shows the calculated differential correlation coefficients,drj9/d(Dn), as a function of Dn. Fig. 5(f) shows the calculated sens-itivity as a function of lp. The calculated sensitivity shows a highlynon-uniform profile, ranging from 5 to 1412 RIU21, with an averagevalue of 199 RIU21 over the 3 dB bandwidth of the CROW trans-mission band.
We define the NEDL at lp as the uncertainty of extracted Dn (seeMethods). We extract the NEDL from the measured uncertainty ofeach rp and rs of the library {rj9(l0)} at DnB. Fig. 5(g) shows thecalculated NEDL as a function of lp. NEDL is highly dependent onthe choice of lp. We show an average NEDL over the entire trans-mission band as ,6 3 1025 RIU.
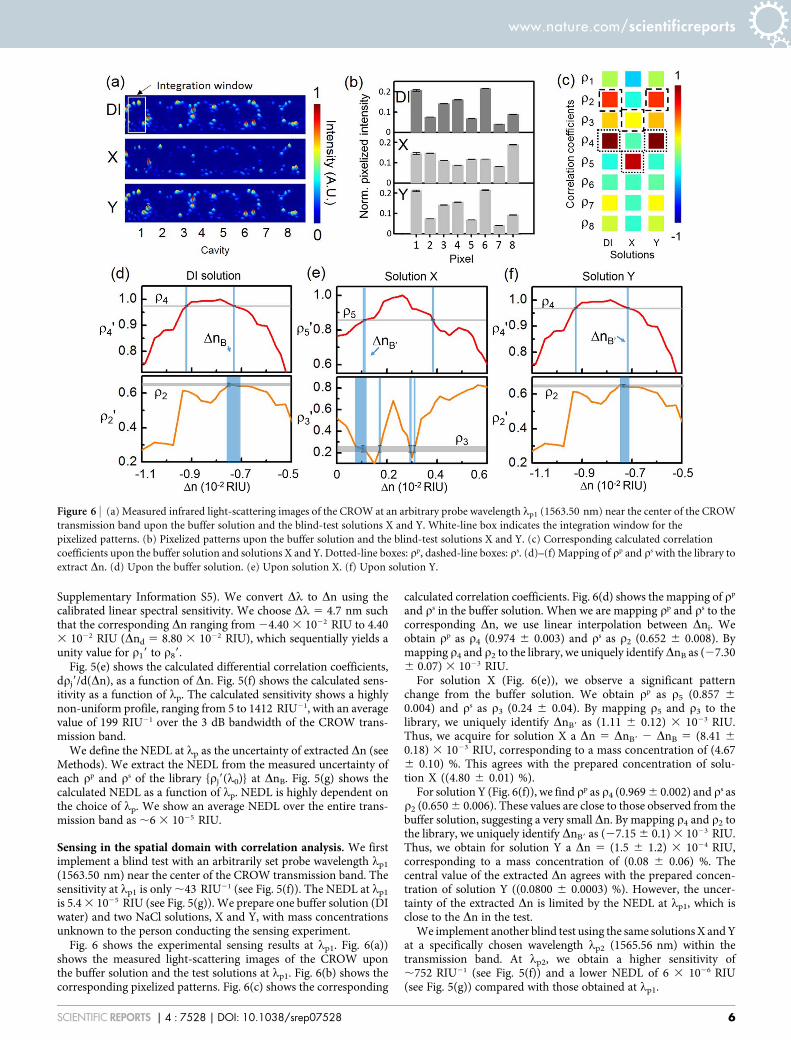
Sensing in the spatial domain with correlation analysis. We firstimplement a blind test with an arbitrarily set probe wavelength lp1
(1563.50 nm) near the center of the CROW transmission band. Thesensitivity at lp1 is only ,43 RIU21 (see Fig. 5(f)). The NEDL at lp1
is 5.4 3 1025 RIU (see Fig. 5(g)). We prepare one buffer solution (DIwater) and two NaCl solutions, X and Y, with mass concentrationsunknown to the person conducting the sensing experiment.
Fig. 6 shows the experimental sensing results at lp1. Fig. 6(a))shows the measured light-scattering images of the CROW uponthe buffer solution and the test solutions at lp1. Fig. 6(b) shows thecorresponding pixelized patterns. Fig. 6(c) shows the corresponding
calculated correlation coefficients. Fig. 6(d) shows the mapping of rp
and rs in the buffer solution. When we are mapping rp and rs to thecorresponding Dn, we use linear interpolation between Dni. Weobtain rp as r4 (0.974 6 0.003) and rs as r2 (0.652 6 0.008). Bymapping r4 and r2 to the library, we uniquely identify DnB as (27.306 0.07) 3 1023 RIU.
For solution X (Fig. 6(e)), we observe a significant patternchange from the buffer solution. We obtain rp as r5 (0.857 60.004) and rs as r3 (0.24 6 0.04). By mapping r5 and r3 to thelibrary, we uniquely identify DnB9 as (1.11 6 0.12) 3 1023 RIU.Thus, we acquire for solution X a Dn 5 DnB9 2 DnB 5 (8.41 6
0.18) 3 1023 RIU, corresponding to a mass concentration of (4.676 0.10) %. This agrees with the prepared concentration of solu-tion X ((4.80 6 0.01) %).
For solution Y (Fig. 6(f)), we find rp as r4 (0.969 6 0.002) and rs asr2 (0.650 6 0.006). These values are close to those observed from thebuffer solution, suggesting a very small Dn. By mapping r4 and r2 tothe library, we uniquely identify DnB9 as (27.15 6 0.1) 3 1023 RIU.Thus, we obtain for solution Y a Dn 5 (1.5 6 1.2) 3 1024 RIU,corresponding to a mass concentration of (0.08 6 0.06) %. Thecentral value of the extracted Dn agrees with the prepared concen-tration of solution Y ((0.0800 6 0.0003) %). However, the uncer-tainty of the extracted Dn is limited by the NEDL at lp1, which isclose to the Dn in the test.
We implement another blind test using the same solutions X and Yat a specifically chosen wavelength lp2 (1565.56 nm) within thetransmission band. At lp2, we obtain a higher sensitivity of,752 RIU21 (see Fig. 5(f)) and a lower NEDL of 6 3 1026 RIU(see Fig. 5(g)) compared with those obtained at lp1.
Figure 6 | (a) Measured infrared light-scattering images of the CROW at an arbitrary probe wavelength lp1 (1563.50 nm) near the center of the CROW
transmission band upon the buffer solution and the blind-test solutions X and Y. White-line box indicates the integration window for the
pixelized patterns. (b) Pixelized patterns upon the buffer solution and the blind-test solutions X and Y. (c) Corresponding calculated correlation
coefficients upon the buffer solution and solutions X and Y. Dotted-line boxes: rp, dashed-line boxes: rs. (d)–(f) Mapping of rp and rs with the library to
extract Dn. (d) Upon the buffer solution. (e) Upon solution X. (f) Upon solution Y.
www.nature.com/scientificreports
SCIENTIFIC REPORTS | 4 : 7528 | DOI: 10.1038/srep07528 6
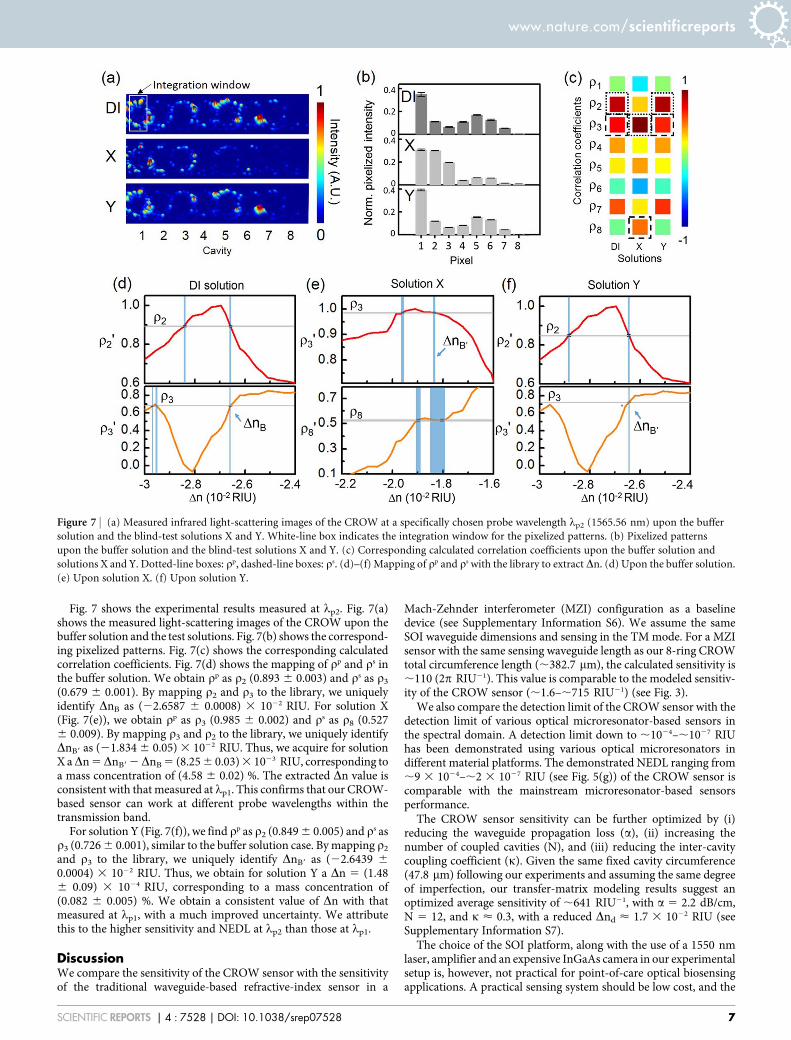
Fig. 7 shows the experimental results measured at lp2. Fig. 7(a)shows the measured light-scattering images of the CROW upon thebuffer solution and the test solutions. Fig. 7(b) shows the correspond-ing pixelized patterns. Fig. 7(c) shows the corresponding calculatedcorrelation coefficients. Fig. 7(d) shows the mapping of rp and rs inthe buffer solution. We obtain rp as r2 (0.893 6 0.003) and rs as r3
(0.679 6 0.001). By mapping r2 and r3 to the library, we uniquelyidentify DnB as (22.6587 6 0.0008) 3 1022 RIU. For solution X(Fig. 7(e)), we obtain rp as r3 (0.985 6 0.002) and rs as r8 (0.5276 0.009). By mapping r3 and r2 to the library, we uniquely identifyDnB9 as (21.834 6 0.05) 3 1022 RIU. Thus, we acquire for solutionX aDn 5DnB9 2DnB 5 (8.25 6 0.03) 3 1023 RIU, corresponding toa mass concentration of (4.58 6 0.02) %. The extracted Dn value isconsistent with that measured at lp1. This confirms that our CROW-based sensor can work at different probe wavelengths within thetransmission band.
For solution Y (Fig. 7(f)), we find rp as r2 (0.849 6 0.005) and rs asr3 (0.726 6 0.001), similar to the buffer solution case. By mapping r2
and r3 to the library, we uniquely identify DnB9 as (22.6439 6
0.0004) 3 1022 RIU. Thus, we obtain for solution Y a Dn 5 (1.486 0.09) 3 1024 RIU, corresponding to a mass concentration of(0.082 6 0.005) %. We obtain a consistent value of Dn with thatmeasured at lp1, with a much improved uncertainty. We attributethis to the higher sensitivity and NEDL at lp2 than those at lp1.
DiscussionWe compare the sensitivity of the CROW sensor with the sensitivityof the traditional waveguide-based refractive-index sensor in a
Mach-Zehnder interferometer (MZI) configuration as a baselinedevice (see Supplementary Information S6). We assume the sameSOI waveguide dimensions and sensing in the TM mode. For a MZIsensor with the same sensing waveguide length as our 8-ring CROWtotal circumference length (,382.7 mm), the calculated sensitivity is,110 (2p RIU21). This value is comparable to the modeled sensitiv-ity of the CROW sensor (,1.6–,715 RIU21) (see Fig. 3).
We also compare the detection limit of the CROW sensor with thedetection limit of various optical microresonator-based sensors inthe spectral domain. A detection limit down to ,1024–,1027 RIUhas been demonstrated using various optical microresonators indifferent material platforms. The demonstrated NEDL ranging from,9 3 1024–,2 3 1027 RIU (see Fig. 5(g)) of the CROW sensor iscomparable with the mainstream microresonator-based sensorsperformance.
The CROW sensor sensitivity can be further optimized by (i)reducing the waveguide propagation loss (a), (ii) increasing thenumber of coupled cavities (N), and (iii) reducing the inter-cavitycoupling coefficient (k). Given the same fixed cavity circumference(47.8 mm) following our experiments and assuming the same degreeof imperfection, our transfer-matrix modeling results suggest anoptimized average sensitivity of ,641 RIU21, with a 5 2.2 dB/cm,N 5 12, and k < 0.3, with a reduced Dnd < 1.7 3 1022 RIU (seeSupplementary Information S7).
The choice of the SOI platform, along with the use of a 1550 nmlaser, amplifier and an expensive InGaAs camera in our experimentalsetup is, however, not practical for point-of-care optical biosensingapplications. A practical sensing system should be low cost, and the
Figure 7 | (a) Measured infrared light-scattering images of the CROW at a specifically chosen probe wavelength lp2 (1565.56 nm) upon the buffer
solution and the blind-test solutions X and Y. White-line box indicates the integration window for the pixelized patterns. (b) Pixelized patterns
upon the buffer solution and the blind-test solutions X and Y. (c) Corresponding calculated correlation coefficients upon the buffer solution and
solutions X and Y. Dotted-line boxes: rp, dashed-line boxes: rs. (d)–(f) Mapping of rp and rs with the library to extract Dn. (d) Upon the buffer solution.
(e) Upon solution X. (f) Upon solution Y.
www.nature.com/scientificreports
SCIENTIFIC REPORTS | 4 : 7528 | DOI: 10.1038/srep07528 7
sensing window is likely to be in the visible to near-infrared wave-lengths. Thus, a future direction for practically implementing oursensing scheme is to adopt a silicon-based material platform that istransparent to the visible and near-infrared wavelengths, is compat-ible with CMOS processes, and offers a sufficiently high refractiveindex for a small device footprint. A possible choice is silicon nitride(SiN). The operational wavelength can then be below ,1000 nm,which allows the use of a low-power diode laser source and a stand-ard silicon charge-coupled device (CCD) or CMOS camera to imagethe light scattering. The relatively low refractive index contrastbetween the SiN waveguide and the analyte also enables a betterexposure of the TM mode to interact with the analyte.
In summary, we report a paradigm-shift biochemical sensingscheme in the spatial domain using chip-scale, microresonator-basedCROWs on a SOI chip. Instead of using narrowband microresonatorresonances, we use an inhomogeneously broadened transmissionband of an imperfect CROW and the out-of-plane elastic light scat-tering patterns to attain a good average sensitivity (,199 RIU21) anda low detection limit (,9 3 1024–,2 3 1027 RIU) over a largerefractive index range (8.8 3 1022 RIU). The correlation analysisemployed takes into account of the whole mode-field-intensity dis-tribution across the CROW. This sensing scheme is immune to thecommon external noise affecting all the coupled cavities, and thusenabling an improved tolerance to the equipment noise. Our blindtests using a SOI 8-microring CROW at fixed probe wavelengths andNaCl solutions with different mass concentrations showed the detec-tion of a cladding refractive index change of 1.5 3 1024 RIU. Weshowed a noise-equivalent detection limit of ,6 3 1026 RIU at aspecific fixed probe wavelength. We therefore envision that ourdemonstrated CROW-based sensing scheme using light-scatteringpattern recognition and the correlation analysis can potentially offeran alternative route toward a high-performance, reliable and rela-tively compact integrated label-free optical biochemical sensor.
MethodsTransfer-matrix modeling on an imperfect CROW. We model an imperfectmicroring CROW using transfer-matrix method with empirical and numerical inputs(see Supplementary Information S1). We accumulate statistics of the measuredwaveguide widths and coupling gap widths from SEM characterization over the ninecoupling regions of a representative 8-microring CROW (see SupplementaryInformation S2). For each coupling region, we sample six waveguide widths and threecoupling gap spacing. The statistics of the waveguide widths and the coupling gapwidths approximately follow Gaussian distributions. We obtain the mean values andthe standard deviations of fabricated waveguide widths and coupling gap widths. Weassume that the Gaussian distributions of the waveguide widths and the coupling gapwidths are independent. We use the Gaussian number generator in Matlab togenerate a set of randomized waveguide widths and coupling gap widths distributedalong an imperfect CROW. We study 200 sets of such randomly generatedparameters for the 8-microring CROW (see Supplementary Information S7).
We calculate using FEM (COMSOL RF module) the waveguide effective refractiveindex, neff, of a SOI waveguide with a water upper-cladding as a function of thewaveguide width, at a fixed waveguide height of 240 nm. The mean value of thecalculated neff is 1.839 6 0.002. We calculate using two-dimensional (2D) finite-difference time-domain (FDTD) simulations the coupling coefficient in each coup-ling region as a function of the coupling gap width, with the waveguide width fixed atits mean value of 470 nm. The mean value of the calculated coupling coefficient is0.910 6 0.004. In the simulations, we choose the TM polarization mode. Based on ourexperiments, we estimate the waveguide propagation loss to be relatively high at22 dB/cm, which we attribute primarily to surface-roughness-induced scatteringlosses. We assume that each microring follows the designed racetrack arc radius of6.5 mm and the designed interaction length of 3.5 mm. In order to convert the clad-ding refractive index change into the effective index change of the sensor, we calculatethe intrinsic sensitivity, Si, using the FEM. Si is calculated as 0.45 using the effectiverefractive index change divided by the cladding refractive index change (seeSupplementary Information S1). We extract from the transfer-matrix modelingassuming the above parameters the mode-field intensity distributions of an imperfectCROW through adding the intensities right before and after each coupling region.
Fabrication process. We fabricate the CROW devices in commercial SOI wafers(SOITEC). The 6-inch SOI wafer has a 240 nm-thick silicon device layer on a 3 mm-thick buried-oxide (BOX) layer. We pattern the CROW devices by electron-beam (E-beam) lithography (JEOL JBX-6300FS) using photoresist ZEP-520. We transfer thedevice pattern to the silicon device layer by inductively coupled plasma (ICP) etching(STS ICP DRIE Silicon Etcher).
We fabricate a microfluidic chamber with an inlet and an outlet on a PDMS layer.In order to form the microfluidic channel by imprinting, we use SU8 patterned bycontact photolithography as the PDMS mold to transfer the pattern to the PDMS. Weuse a puncher to make an inlet and an outlet, each with a diameter of 1 mm.
The SOI chip and the PDMS microfluidic layer are treated with oxygen plasma anddirectly bonded, with the microfluidic channel aligned with the CROW devices. Thebonded PDMS-silicon interface is stable enough for repeating the sensing experi-ments under a relatively high pump pressure.
Experimental setup. The wavelength-tunable laser light in the 1550 nm wavelengthrange is coupled into a 33 dB-gain erbium-doped fiber amplifier. The amplified laserlight is polarization-controlled to the TM polarization and is end-fired into a taperedsilicon waveguide through a singlemode polarization-maintaining lensed fiber.
We prepare NaCl solutions with mass concentrations from 1% to 5% (in steps of1%) in order to calibrate the CROW transmission band spectral shifts upon arefractive index change from the cladding solution. All the measurements arerepeated three times, with DI water as the reference cladding solution. Between twomeasurements, we rinse the chip by DI water for one time. We determine the res-onance spectral shifts by fitting the throughput- and drop-transmission spectra with asum of multiple Lorentzian lineshapes, with each Lorentzian lineshape centered at theCROW eigenstate wavelength. The overall transmission band shift is taken as theaverage value of the spectral shifts of eigenstates I–VIII.
Imaging of elastic light scattering. We use a long-working-distance microscopeobjective lens (503 Mitutoyo Plan Apo, NA 5 0.55) and an InGaAs camera(Hamamatsu C10633-23) with 320 3 256 pixels (a 30 mm pixel size) to image thelight scattering patterns from the top. The camera has a high responsivity at the 1000–1700 nm wavelength range with a 14 bit analog-to-digital conversion in data readout.We set the camera exposure time as 6 ms with a calibrated gamma factor of ,1. Eachmicroring is imaged onto an area of 44 3 25 pixels. The integration window for eachmicroring includes 44 3 19 pixels. We set the probe wavelength far away from theCROW transmission band and obtain a background image for backgroundsubtraction.
In order to acquire the calibrated correlation coefficients, we scan the laser wave-length and record 8 successive images for each wavelength step over a time interval of0.8 s and take average for reducing the equipment noise contribution. In the blindsensing tests, we record and take average over 100 successive images during a timeperiod of 10 s at a fixed probe wavelength after the buffer or the test solution isinjected and the scattering pattern is stabilized.
1. Estevez, M.-C., Alvarez, M. & Lechuga, L. M. Integrated optical devices for lab-on-a-chip biosensing applications. Laser & Photon. Rev. 6, 463–487 (2012).
2. Fan, X. et al. Sensitive optical biosensors for unlabeled targets: A review. Anal.Chim. Acta. 620, 8–26 (2008).
3. Ciminelli, C., Campanella, C. M., Dell’Olio, F., Campanella, C. E. & Armenise,M. N. Label-free optical resonant sensors for biochemical applications. Prog.Quantum Electron. 37, 51–107 (2013).
4. Vollmer, F. & Arnold, S. Whispering-gallery-mode biosensing: label-freedetection down to single molecules. Nat. Methods 5, 591–596 (2008).
5. Shao, L. et al. Detection of single nanoparticles and lentiviruses using microcavityresonance broadening. Adv. Mater. 25, 5616–5620 (2013).
6. De Vos, K., Bartolozzi, I., Schacht, E., Bienstman, P. & Baets, R. Silicon-on-Insulator microring resonator for sensitive and label-free biosensing. Opt. Express15, 7610–7615 (2007).
7. Chao, C.-Y. & Guo, L. J. Biochemical sensors based on polymer microrings withsharp asymmetrical resonance. Appl. Phys. Lett. 83, 1527–1529 (2003).
8. De Vos, K. et al. SOI optical microring resonator with poly (ethylene glycol)polymer brush for label-free biosensor applications. Biosens. & Bioelectron. 24,2528–2533 (2009).
9. Feng, S. et al. Silicon photonics: from a microresonator perspective. Laser &Photon. Rev. 6, 145–177 (2012).
10. Claes, T. et al. Label-free biosensing with a slot-waveguide-based ring resonator insilicon on insulator. Photonics J., IEEE 1, 197–204 (2009).
11. Washburn, A. L., Luchansky, M. S., Bowman, A. L. & Bailey, R. C. Quantitative,label-free detection of five protein biomarkers using multiplexed arrays of siliconphotonic microring resonators. Anal. Chem. 82, 69–72 (2009).
12. Armani, A. M., Kulkarni, R. P., Fraser, S. E., Flagan, R. C. & Vahala, K. J. Label-free, single-molecule detection with optical microcavities. Science 317, 783–787(2007).
13. Jiang, W. C., Zhang, J. & Lin, Q. Compact suspended silicon microring resonatorswith ultrahigh quality. Opt. Express 22, 1187–1192 (2014).
14. Li, M., Wu, X., Liu, L., Fan, X. & Xu, L. Self-referencing optofluidic ring resonatorsensor for highly sensitive biomolecular detection. Anal. Chem. 85, 9328–9332(2013).
15. Lei, T. & Poon, A. W. Modeling of coupled-resonator optical waveguide (CROW)based refractive index sensors using pixelized spatial detection at a singlewavelength. Opt. Express 19, 22227–22241 (2011).
16. Lei, T. & Poon, A. W. Coupled-resonator optical waveguide sensors using multi-channel spatial detection. Paper presented at CLEO: Science and Innovations,Baltimore, Maryland United States. Washington, DC United States: OSATechnical Digest. (2011, May 1–6).
www.nature.com/scientificreports
SCIENTIFIC REPORTS | 4 : 7528 | DOI: 10.1038/srep07528 8

17. Cooper, M. L. et al. Quantitative infrared imaging of silicon-on-insulatormicroring resonators. Opt. Lett. 35, 784–786 (2010).
18. Mookherjea, S. & Grant, H. R. High dynamic range microscope infrared imagingof silicon nanophotonic devices. Opt. Lett. 37, 4705–4707 (2012).
19. Hafezi, M., Mittal, S., Fan, J., Migdall, A. & Taylor, J. Imaging topological edgestates in silicon photonics. Nat. Photon. 7, 1001–1005 (2013).
20. Song, W. & Psaltis, D. Optofluidic pressure sensor based on interferometricimaging. Opt. Lett. 35, 3604–3606 (2010).
AcknowledgmentsThis work is supported by a grant from the Research Grants Council of the Hong KongSpecial Administrative Region, China (Project No. 618010).
Author contributionsA.W.P. initiated and supervised all of the work. T.L. designed the device and conducted theinitial experimental work. J.W. and T.L. carried out the device fabrication. J.W. conductedthe experiment and the data analysis. Z.Y. and J.W. performed the numerical modeling.A.W.P., J.W. and Z.Y. wrote the manuscript.
Additional informationSupplementary information accompanies this paper at http://www.nature.com/scientificreports
Competing financial interests: The authors declare no competing financial interests.
How to cite this article: Wang, J., Yao, Z., Lei, T. & Poon, A.W. Silicon coupled-resonatoroptical-waveguide-based biosensors using light-scattering pattern recognition withpixelized mode-field-intensity distributions. Sci. Rep. 4, 7528; DOI:10.1038/srep07528(2014).
This work is licensed under a Creative Commons Attribution-NonCommercial-NoDerivs 4.0 International License. The images or other third party material inthis article are included in the article’s Creative Commons license, unless indicatedotherwise in the credit line; if the material is not included under the CreativeCommons license, users will need to obtain permission from the license holderin order to reproduce the material. To view a copy of this license, visit http://creativecommons.org/licenses/by-nc-nd/4.0/
www.nature.com/scientificreports
SCIENTIFIC REPORTS | 4 : 7528 | DOI: 10.1038/srep07528 9


![Mid-infrared Vernier racetrack resonator tunable filter ... · Mid-infrared Vernier racetrack resonator tunable filter implemented on a germanium on SOI waveguide platform [Invited]](https://img.pdfslide.us/doc/110x75/5f4c8a2be860f8783803843f/mid-infrared-vernier-racetrack-resonator-tunable-filter-mid-infrared-vernier.jpg)
![Broadband resonator-waveguide coupling for efficient ... · the resonator dispersion profile for octave bandwidth [6,7], or even super-octave bandwidth [8], has been widely reported,](https://img.pdfslide.us/doc/110x75/611e88f7bfe3b84497714dcf/broadband-resonator-waveguide-coupling-for-efficient-the-resonator-dispersion.jpg)